driving habits › about-icbc › newsroom › documents › ...topline takeaways • drivers...
TRANSCRIPT
Simplified Understanding
J u n e 2 0 1 8
DRIVING HABITS
Simplified Understanding
INTRODUCTION
Background & Objectives
3
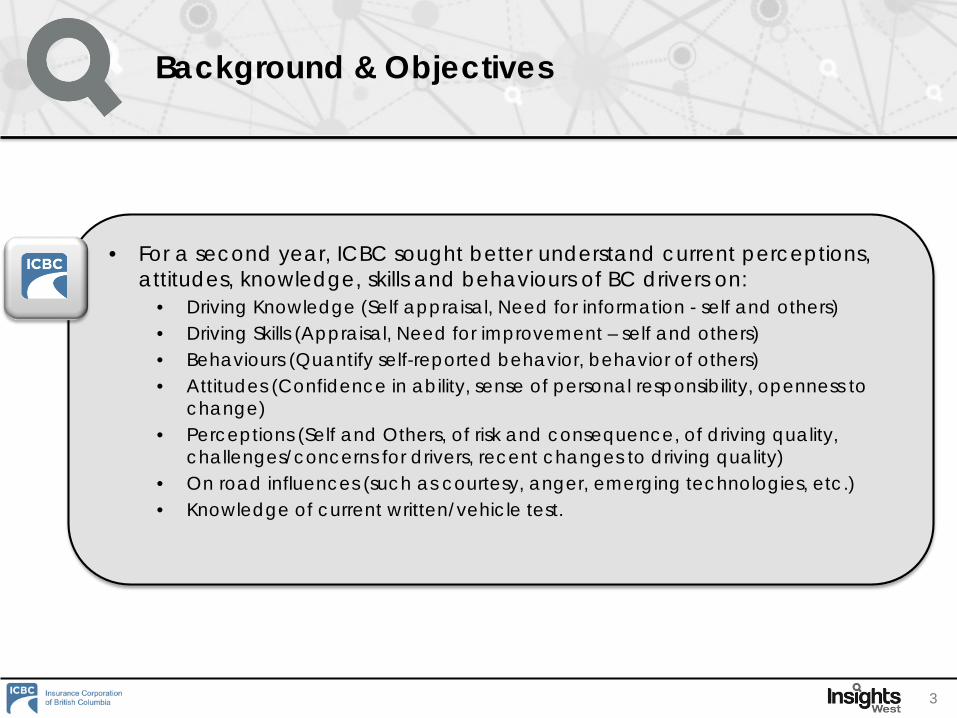
• For a second year, ICBC sought better understand current perceptions, attitudes, knowledge, skills and behaviours of BC drivers on:
• Driving Knowledge (Self appraisal, Need for information - self and others) • Driving Skills (Appraisal, Need for improvement – self and others) • Behaviours (Quantify self-reported behavior, behavior of others) • Attitudes (Confidence in ability, sense of personal responsibility, openness to
change) • Perceptions (Self and Others, of risk and consequence, of driving quality,
challenges/concerns for drivers, recent changes to driving quality) • On road influences (such as courtesy, anger, emerging technologies, etc.)• Knowledge of current written/vehicle test.
Methodology & Sample
4
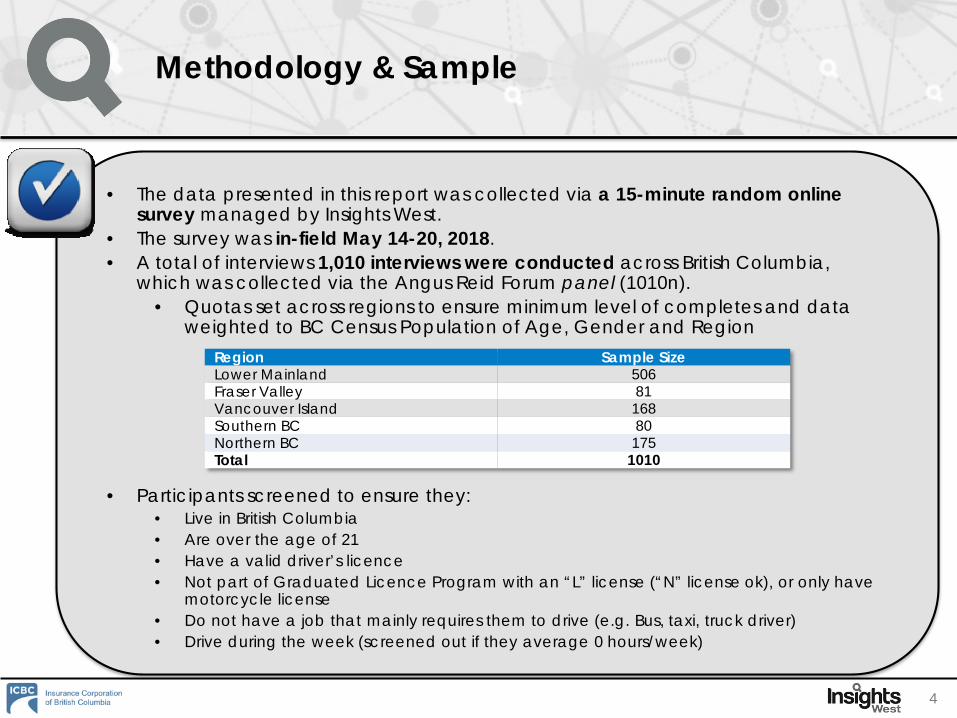
• The data presented in this report was collected via a 15-minute random online survey managed by Insights West.
• The survey was in-field May 14-20, 2018. • A total of interviews 1,010 interviews were conducted across British Columbia,
which was collected via the Angus Reid Forum panel (1010n).• Quotas set across regions to ensure minimum level of completes and data
weighted to BC Census Population of Age, Gender and Region
• Participants screened to ensure they:• Live in British Columbia• Are over the age of 21• Have a valid driver’s licence • Not part of Graduated Licence Program with an “L” license (“N” license ok), or only have
motorcycle license• Do not have a job that mainly requires them to drive (e.g. Bus, taxi, truck driver)• Drive during the week (screened out if they average 0 hours/week)
Region Sample SizeLower Mainland 506Fraser Valley 81Vancouver Island 168Southern BC 80Northern BC 175Total 1010
Observations on the Data
5
• Findings cited as T2/B2 refer to the “Top 2” and “Bottom 2” answers for a particular question with a four-scale (i.e. “strongly agree” and “somewhat agree” would be T2, and “somewhat disagree” or “strongly disagree” would be B2.
• A sample of 1,010 British Columbians would yield a margin of error of +/- 3.1%, 19 times out of 20, for the entire province. The margin of error is higher among sub-groups, and in questions were a split-sample was utilized.
Simplified Understanding
TOPLINE TAKEAWAYS
Topline Takeaways
• Drivers continue to believe that other drivers and driving in general is worse than it was 5 years ago. (60% say other drivers are worse, 46% say that driving is worse).
– Traffic congestion the main reason cited for driving being harder, while distracted driving and a lack of respect for driving rules are the most common complaints against other drivers.
• Drivers are frustrated with the actions of other drivers – more so than traffic or maintenance issues. The top frustrations that drivers experience include aggressive driving (56% say it is a top 3 frustration), distracted drivers (35%), and poor driving skills (29%).
• Drivers hold themselves in high regards in terms of their own actions behind the wheel as well as compared to other drivers. However, three-quarters of drivers have caught themselves doing actions behind the wheel that they shouldn’t have in the past 3 months (eg. 44% have passed someone driving too slowly, 31% did not come to complete stop at stop sign).
– Interestingly, those who give themselves higher ratings are no less likely to have bad driving habits than those who say they are average in their skills.
• Drivers remain confident they could pass a written and road test if they had to take them again. However, many drivers believe that the pass rate for the written test is higher than it actually is.
• 71% of drivers say they would be likely to take a refresher written test if it was available, which aligns nicely in with the upcoming Drive Smart campaign objectives.
– Drivers who are interested want to know if they have forgotten something, as well as learn what/how rules have changed.
– A lack of time, and the belief that they’re already a good driver are the main reasons drivers say they would not take the test.
• ICBC is perceived to have the second highest presence behind the police with regards to organizations that promote safe driving across the province.
7
Simplified Understanding
DETAILED FINDINGS
About the
Same
34%
38%
45%
45%
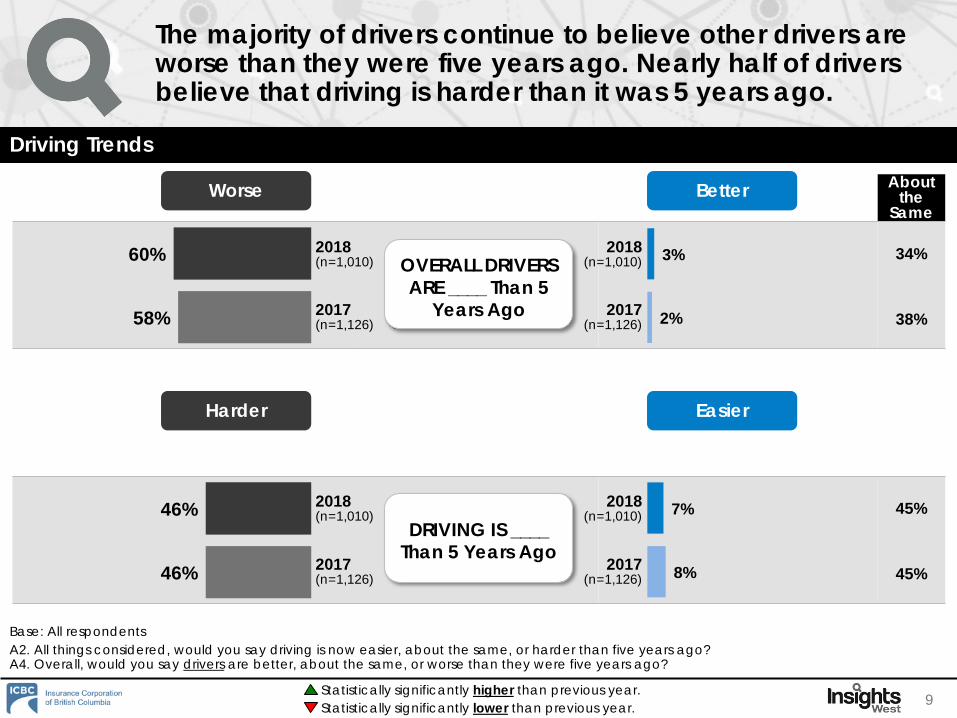
The majority of drivers continue to believe other drivers are worse than they were five years ago. Nearly half of drivers believe that driving is harder than it was 5 years ago.
Driving Trends
9
Base: All respondentsA2. All things considered, would you say driving is now easier, about the same, or harder than five years ago? A4. Overall, would you say drivers are better, about the same, or worse than they were five years ago?
60%
58%
46%
46%
3%
2%
7%
8%
BetterWorse
EasierHarder
OVERALL DRIVERSARE ____ Than 5
Years Ago
DRIVING IS ____ Than 5 Years Ago
2018(n=1,010)
2017(n=1,126)
2018(n=1,010)
2017(n=1,126)
2018(n=1,010)
2017(n=1,126)
2018(n=1,010)
2017(n=1,126)
Statistically significantly lower than previous year.Statistically significantly higher than previous year.
About the
Same
45%
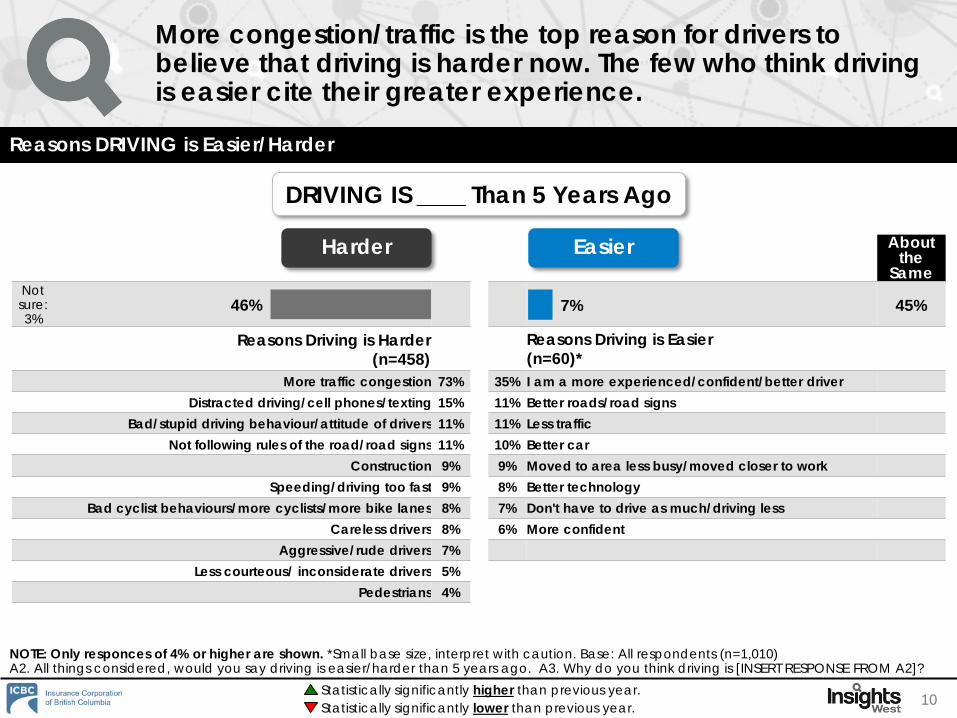
Reasons Driving is Harder(n=458)
Reasons Driving is Easier(n=60)*
More traffic congestion 73% 35% I am a more experienced/confident/better driverDistracted driving/cell phones/texting 15% 11% Better roads/road signs
Bad/stupid driving behaviour/attitude of drivers 11% 11% Less trafficNot following rules of the road/road signs 11% 10% Better car
Construction 9% 9% Moved to area less busy/moved closer to workSpeeding/driving too fast 9% 8% Better technology
Bad cyclist behaviours/more cyclists/more bike lanes 8% 7% Don't have to drive as much/driving lessCareless drivers 8% 6% More confident
Aggressive/rude drivers 7%Less courteous/ inconsiderate drivers 5%
Pedestrians 4%
More congestion/traffic is the top reason for drivers to believe that driving is harder now. The few who think driving is easier cite their greater experience.
Reasons DRIVING is Easier/Harder
10
46% 7%
EasierHarder
DRIVING IS ____ Than 5 Years Ago
Statistically significantly lower than previous year.Statistically significantly higher than previous year.
NOTE: Only responces of 4% or higher are shown. *Small base size, interpret with caution. Base: All respondents (n=1,010)A2. All things considered, would you say driving is easier/harder than 5 years ago. A3. Why do you think driving is [INSERT RESPONSE FROM A2]?
Not sure: 3%
About the
Same
34%
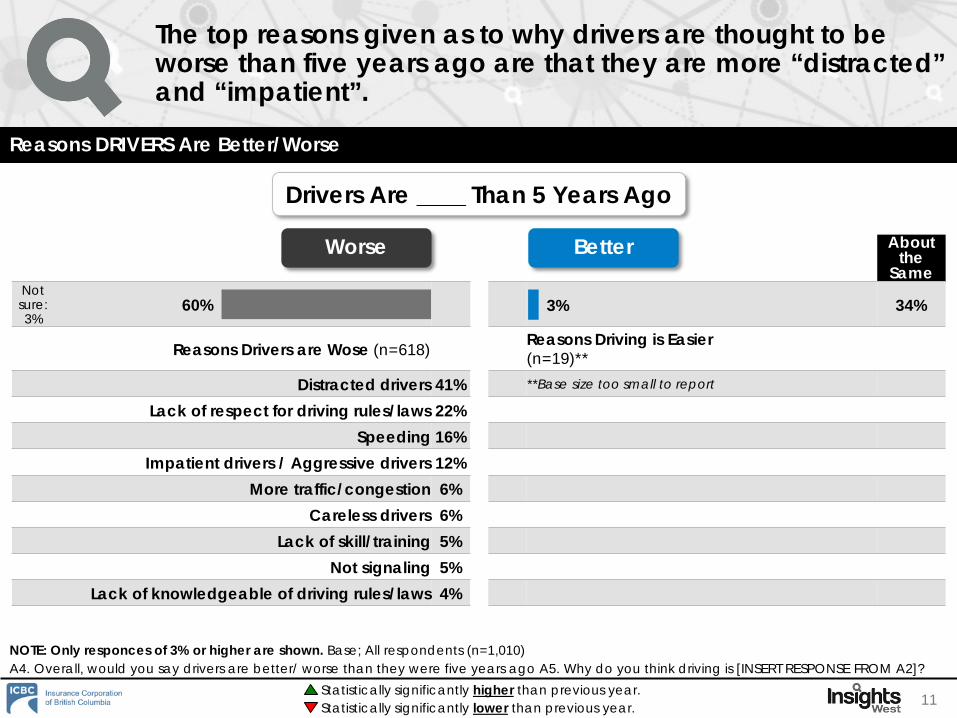
Reasons Drivers are Wose (n=618) Reasons Driving is Easier(n=19)**
Distracted drivers 41% **Base size too small to report
Lack of respect for driving rules/laws 22%Speeding 16%
Impatient drivers / Aggressive drivers 12%More traffic/congestion 6%
Careless drivers 6%Lack of skill/training 5%
Not signaling 5%Lack of knowledgeable of driving rules/laws 4%
The top reasons given as to why drivers are thought to be worse than five years ago are that they are more “distracted” and “impatient”.
Reasons DRIVERS Are Better/Worse
11
BetterWorse
Drivers Are ____ Than 5 Years Ago
60% 3%
Statistically significantly lower than previous year.Statistically significantly higher than previous year.
Not sure: 3%
NOTE: Only responces of 3% or higher are shown. Base; All respondents (n=1,010)A4. Overall, would you say drivers are better/ worse than they were five years ago A5. Why do you think driving is [INSERT RESPONSE FROM A2]?
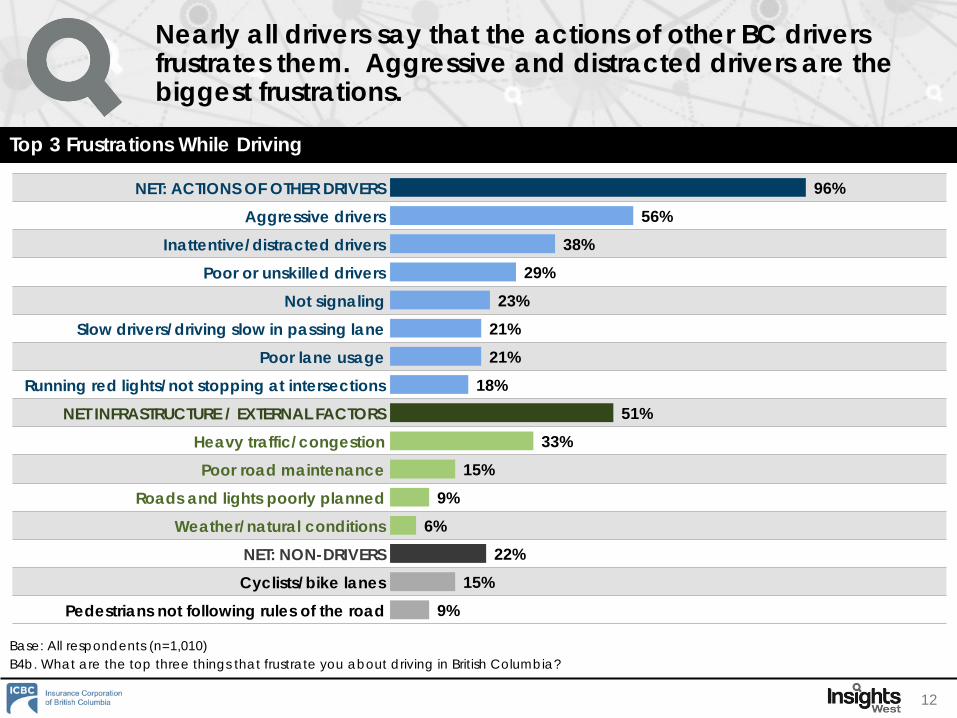
Nearly all drivers say that the actions of other BC drivers frustrates them. Aggressive and distracted drivers are the biggest frustrations.
Top 3 Frustrations While Driving
12
NET: ACTIONS OF OTHER DRIVERSAggressive drivers
Inattentive/distracted driversPoor or unskilled drivers
Not signalingSlow drivers/driving slow in passing lane
Poor lane usage Running red lights/not stopping at intersections
NET INFRASTRUCTURE / EXTERNAL FACTORSHeavy traffic/congestionPoor road maintenance
Roads and lights poorly plannedWeather/natural conditions
NET: NON-DRIVERSCyclists/bike lanes
Pedestrians not following rules of the road
Base: All respondents (n=1,010)B4b. What are the top three things that frustrate you about driving in British Columbia?
96%56%
38%29%
23%21%21%
18%51%
33%15%
9%6%
22%15%
9%
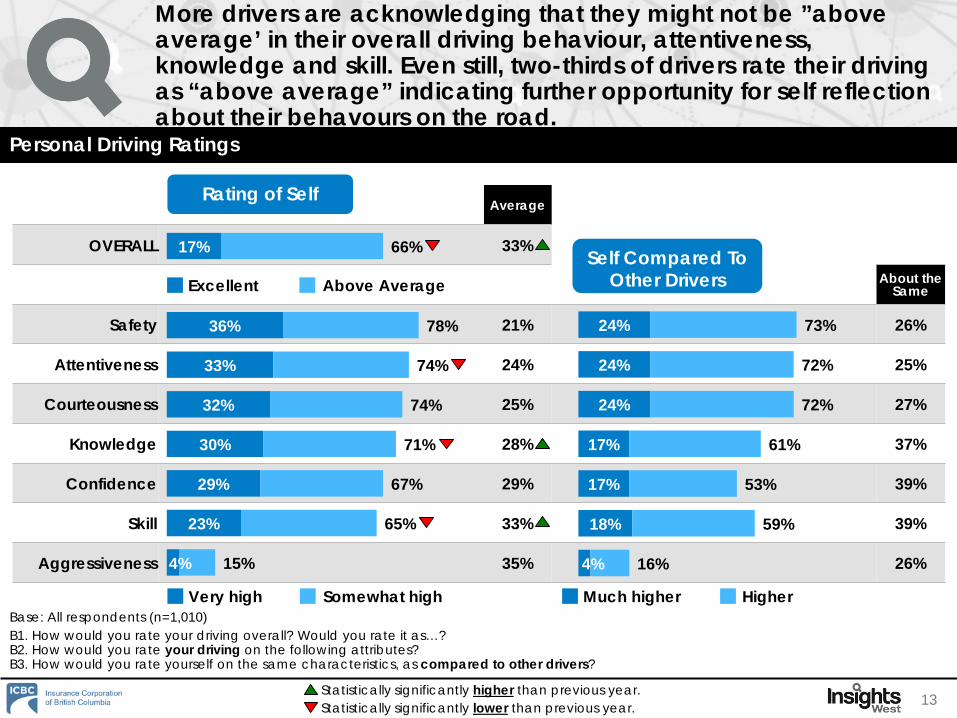
Average
OVERALL 33%
About the Same
Safety 21% 26%
Attentiveness 24% 25%
Courteousness 25% 27%
Knowledge 28% 37%
Confidence 29% 39%
Skill 33% 39%
Aggressiveness 35% 26%
Base: All respondents (n=1,010)B1. How would you rate your driving overall? Would you rate it as…?B2. How would you rate your driving on the following attributes? B3. How would you rate yourself on the same characteristics, as compared to other drivers?
More drivers are acknowledging that they might not be ”above average’ in their overall driving behaviour, attentiveness, knowledge and skill. Even still, two-thirds of drivers rate their driving as “above average” indicating further opportunity for self reflection about their behavours on the road.
Personal Driving Ratings
13
24%
24%
24%
17%
17%
18%
4%
73%
72%
72%
61%
53%
59%
16%
Much higher HigherVery high Somewhat high
Rating of Self
Self Compared To Other DriversExcellent Above Average
17%
36%
33%
32%
30%
29%
23%
4%
66%
78%
74%
74%
71%
67%
65%
15%
Statistically significantly lower than previous year.Statistically significantly higher than previous year.
Neutral
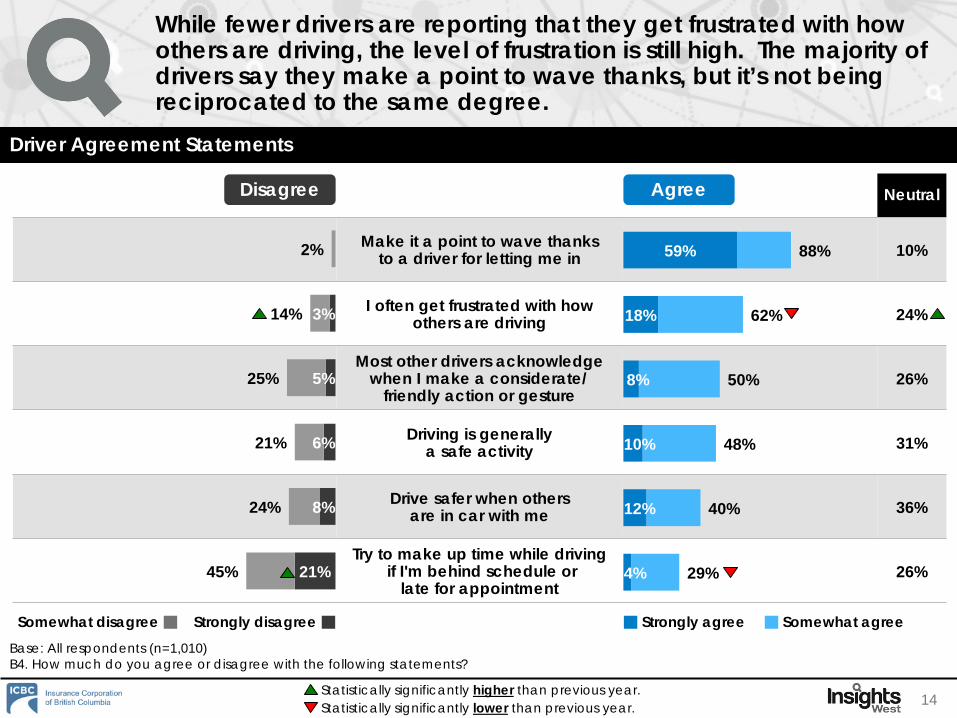
Make it a point to wave thanks to a driver for letting me in 10%
I often get frustrated with how others are driving 24%
Most other drivers acknowledge when I make a considerate/
friendly action or gesture26%
Driving is generally a safe activity 31%
Drive safer when others are in car with me 36%
Try to make up time while drivingif I'm behind schedule or
late for appointment26%
While fewer drivers are reporting that they get frustrated with how others are driving, the level of frustration is still high. The majority of drivers say they make a point to wave thanks, but it’s not being reciprocated to the same degree.
Driver Agreement Statements
14
Base: All respondents (n=1,010)B4. How much do you agree or disagree with the following statements?
AgreeDisagree
3%
5%
6%
8%
21%
2%
14%
25%
21%
24%
45%
59%
18%
8%
10%
12%
4%
88%
62%
50%
48%
40%
29%
Strongly agree Somewhat agreeStrongly disagreeSomewhat disagree
Statistically significantly lower than previous year.Statistically significantly higher than previous year.
Neutral
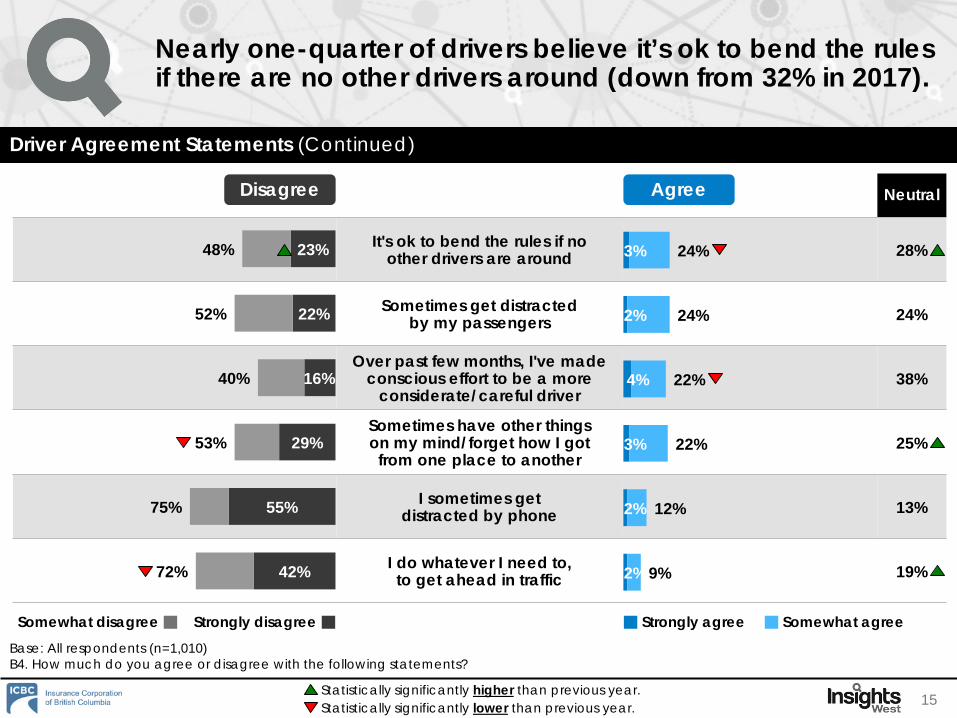
It's ok to bend the rules if no other drivers are around 28%
Sometimes get distracted by my passengers 24%
Over past few months, I've made conscious effort to be a more
considerate/careful driver38%
Sometimes have other things on my mind/forget how I got
from one place to another25%
I sometimes get distracted by phone 13%
I do whatever I need to, to get ahead in traffic 19%
Nearly one-quarter of drivers believe it’s ok to bend the rules if there are no other drivers around (down from 32% in 2017).
Driver Agreement Statements (Continued)
15
Base: All respondents (n=1,010)B4. How much do you agree or disagree with the following statements?
AgreeDisagree
23%
22%
16%
29%
55%
42%
48%
52%
40%
53%
75%
72%
3%
2%
4%
3%
2%
2%
24%
24%
22%
22%
12%
9%
Strongly agree Somewhat agreeStrongly disagreeSomewhat disagree
Statistically significantly lower than previous year.Statistically significantly higher than previous year.
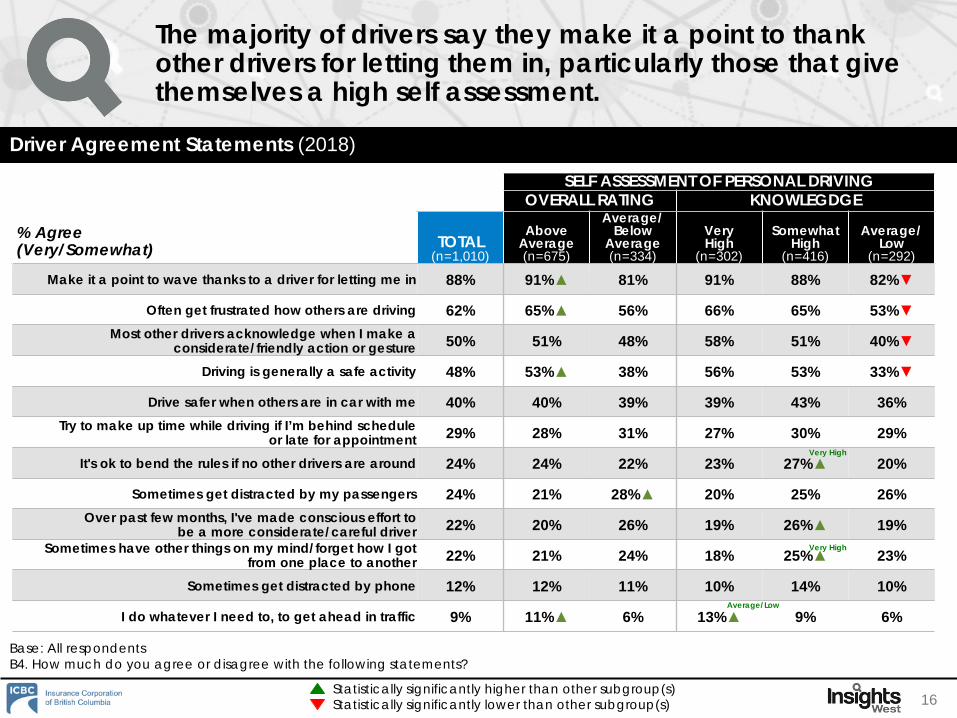
The majority of drivers say they make it a point to thank other drivers for letting them in, particularly those that give themselves a high self assessment.
Driver Agreement Statements (2018)
16
% Agree (Very/Somewhat)
SELF ASSESSMENT OF PERSONAL DRIVINGOVERALL RATING KNOWLEGDGE
TOTAL(n=1,010)
Above Average(n=675)
Average/ Below
Average (n=334)
Very High
(n=302)
Somewhat High
(n=416)
Average/ Low
(n=292)
Make it a point to wave thanks to a driver for letting me in 88% 91%▲ 81% 91% 88% 82%▼
Often get frustrated how others are driving 62% 65%▲ 56% 66% 65% 53%▼Most other drivers acknowledge when I make a
considerate/friendly action or gesture 50% 51% 48% 58% 51% 40%▼
Driving is generally a safe activity 48% 53%▲ 38% 56% 53% 33%▼
Drive safer when others are in car with me 40% 40% 39% 39% 43% 36%Try to make up time while driving if I’m behind schedule
or late for appointment 29% 28% 31% 27% 30% 29%
It's ok to bend the rules if no other drivers are around 24% 24% 22% 23% 27%▲ 20%
Sometimes get distracted by my passengers 24% 21% 28%▲ 20% 25% 26%Over past few months, I've made conscious effort to
be a more considerate/careful driver 22% 20% 26% 19% 26%▲ 19%Sometimes have other things on my mind/forget how I got
from one place to another 22% 21% 24% 18% 25%▲ 23%
Sometimes get distracted by phone 12% 12% 11% 10% 14% 10%
I do whatever I need to, to get ahead in traffic 9% 11%▲ 6% 13%▲ 9% 6%
Base: All respondentsB4. How much do you agree or disagree with the following statements?
Statistically significantly lower than other subgroup(s)Statistically significantly higher than other subgroup(s)
Very High
Very High
Average/Low
NET: ANYPassing someone who you thought was driving too slow
Not coming to a complete stop at a stop signGoing well over the speed limit
Being the 2nd/3rd car in an intersection at a yellow lightHonking, screaming, or gesturing at another driver
Not letting someone into your laneReading a text message
Turning or changing lanes without signalingNot shoulder checking
Not stopping for a pedestrian at a crosswalkTalking or texting on a hand-held cell phone
Not following road signs, signals, or road markings Blocking oncoming traffic/pedestrian crosswalk
Cutting someone offNearly hitting a cyclist or pedestrianReversing without checking mirrors
Taking a photo or video of somethingWatching a video
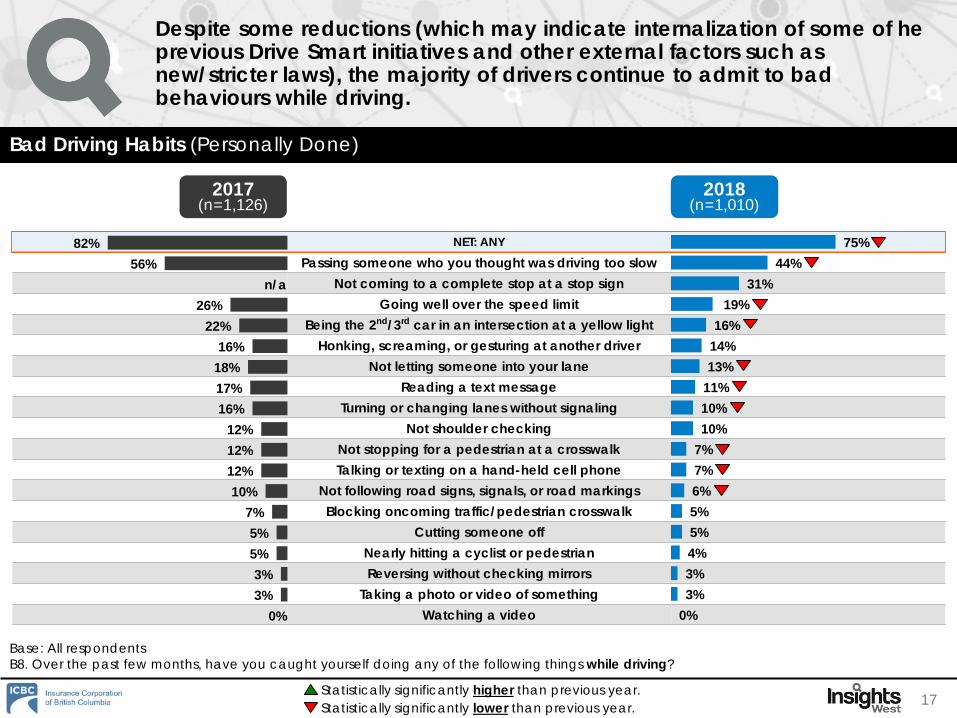
Despite some reductions (which may indicate internalization of some of he previous Drive Smart initiatives and other external factors such as new/stricter laws), the majority of drivers continue to admit to bad behaviours while driving.
Bad Driving Habits (Personally Done)
17
Base: All respondents B8. Over the past few months, have you caught yourself doing any of the following things while driving?
82%56%
n/a26%
22%16%
18%17%16%
12%12%12%10%
7%5%5%3%3%
0%
75%44%
31%19%
16%14%13%
11%10%10%
7%7%6%5%5%4%3%3%
0%
2018(n=1,010)
2017(n=1,126)
Statistically significantly lower than previous year.Statistically significantly higher than previous year.
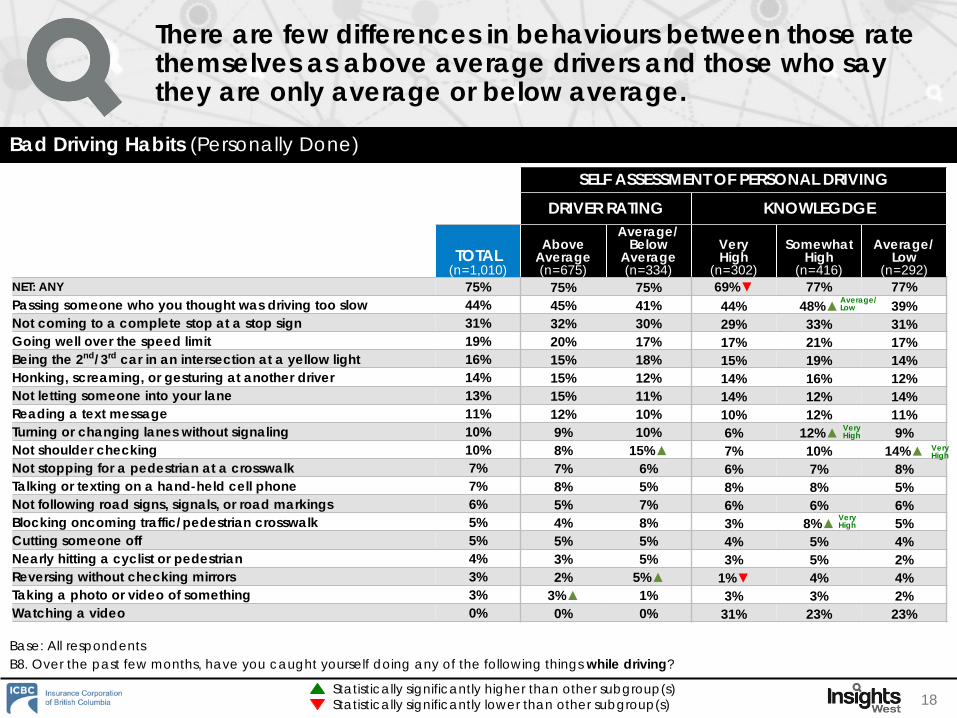
There are few differences in behaviours between those rate themselves as above average drivers and those who say they are only average or below average.
Bad Driving Habits (Personally Done)
18
Base: All respondents B8. Over the past few months, have you caught yourself doing any of the following things while driving?
SELF ASSESSMENT OF PERSONAL DRIVING
DRIVER RATING KNOWLEGDGE
TOTAL(n=1,010)
Above Average(n=675)
Average/ Below
Average (n=334)
Very High
(n=302)
Somewhat High
(n=416)
Average/ Low
(n=292)NET: ANY 75% 75% 75% 69%▼ 77% 77%Passing someone who you thought was driving too slow 44% 45% 41% 44% 48%▲ 39%Not coming to a complete stop at a stop sign 31% 32% 30% 29% 33% 31%Going well over the speed limit 19% 20% 17% 17% 21% 17%Being the 2nd/3rd car in an intersection at a yellow light 16% 15% 18% 15% 19% 14%Honking, screaming, or gesturing at another driver 14% 15% 12% 14% 16% 12%Not letting someone into your lane 13% 15% 11% 14% 12% 14%Reading a text message 11% 12% 10% 10% 12% 11%Turning or changing lanes without signaling 10% 9% 10% 6% 12%▲ 9%Not shoulder checking 10% 8% 15%▲ 7% 10% 14%▲Not stopping for a pedestrian at a crosswalk 7% 7% 6% 6% 7% 8%Talking or texting on a hand-held cell phone 7% 8% 5% 8% 8% 5%Not following road signs, signals, or road markings 6% 5% 7% 6% 6% 6%Blocking oncoming traffic/pedestrian crosswalk 5% 4% 8% 3% 8%▲ 5%Cutting someone off 5% 5% 5% 4% 5% 4%Nearly hitting a cyclist or pedestrian 4% 3% 5% 3% 5% 2%Reversing without checking mirrors 3% 2% 5%▲ 1%▼ 4% 4%Taking a photo or video of something 3% 3%▲ 1% 3% 3% 2%Watching a video 0% 0% 0% 31% 23% 23%
Statistically significantly lower than other subgroup(s)Statistically significantly higher than other subgroup(s)
Very High
Very High
Very High
Average/Low
Simplified Understanding
Driver’s Test
Road Test
Written Test
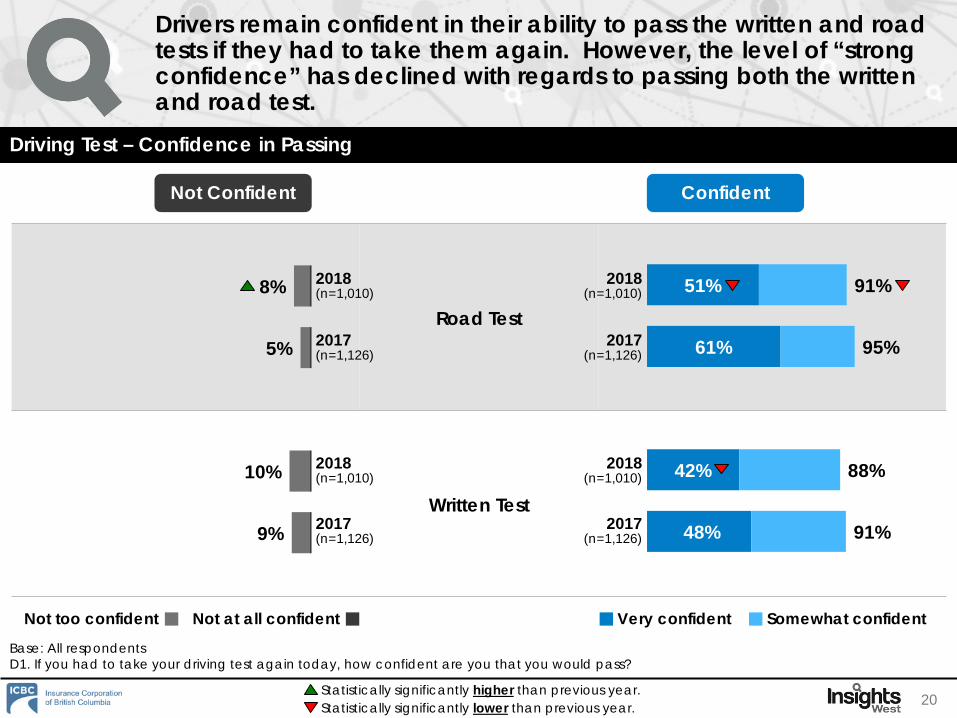
Drivers remain confident in their ability to pass the written and road tests if they had to take them again. However, the level of “strong confidence” has declined with regards to passing both the written and road test.
Driving Test – Confidence in Passing
20
Base: All respondents D1. If you had to take your driving test again today, how confident are you that you would pass?
ConfidentNot Confident
8%
5%
10%
9%
51%
61%
42%
48%
91%
95%
88%
91%
Very confident Somewhat confidentNot at all confidentNot too confident
2018(n=1,010)
2017(n=1,126)
2018(n=1,010)
2017(n=1,126)
2018(n=1,010)
2017(n=1,126)
2018(n=1,010)
2017(n=1,126)
Statistically significantly lower than previous year.Statistically significantly higher than previous year.

Control your vehicle speed
Navigate lanes
Communicate with other drivers around you
Maintain a safe vehicle distance
Understand the meaning of the road signs and markings
Monitor the traffic around you/hazard perception/blind spots
Rules for sharing the road
Navigate intersections
Navigating roundabouts
What to do in the event of an emergency
Drivers are confident in how they rate their knowledge of the rules and regulations around driving. Drivers are least confident about what to do in the event of an emergency.
Knowledge of Rules and Recommendations for Specific Actions
21
Base: All respondents (n=1,010)D2. How confident are you in your ability to do the following…? D3. How confident are you in your knowledge of the rules and recommendations on doing the following activities…?
ConfidentNot Confident
3%
4%
4%
4%
4%
4%
5%
5%
9%
16%
60%
57%
56%
53%
50%
48%
53%
50%
49%
31%
97%
96%
96%
96%
96%
96%
95%
95%
91%
84%
Very confident Somewhat confidentNot at all confidentNot too confident
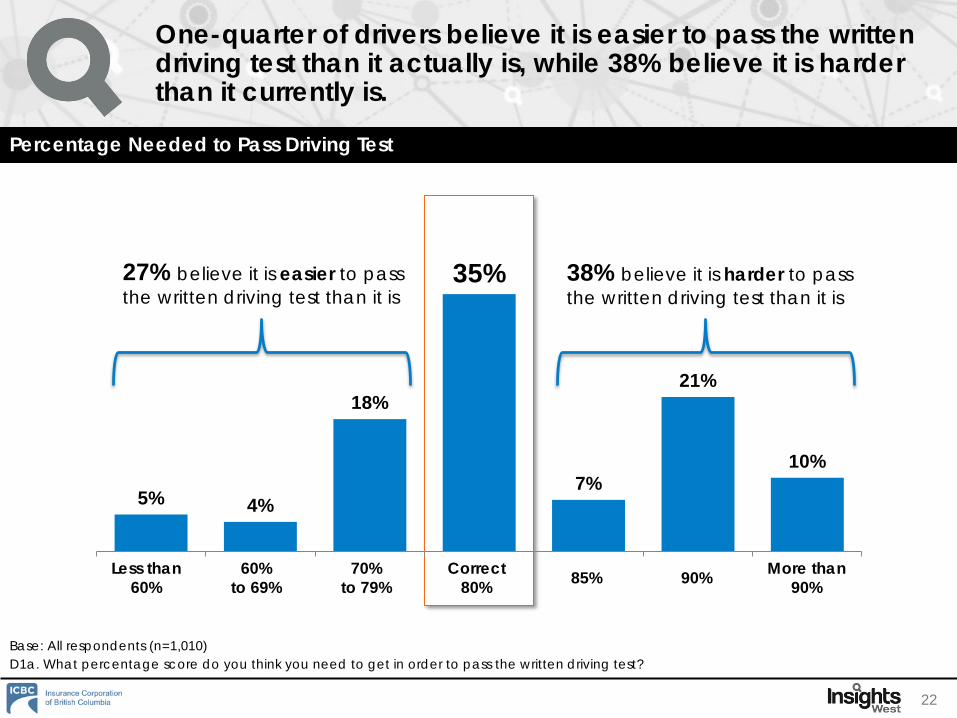
One-quarter of drivers believe it is easier to pass the written driving test than it actually is, while 38% believe it is harder than it currently is.
Percentage Needed to Pass Driving Test
22
Base: All respondents (n=1,010)D1a. What percentage score do you think you need to get in order to pass the written driving test?
5% 4%
18%
35%
7%
21%
10%
Less than 60%
60% to 69%
70% to 79%
Correct 80% 85% 90% More than
90%
27% believe it is easier to pass the written driving test than it is
38% believe it is harder to pass the written driving test than it is
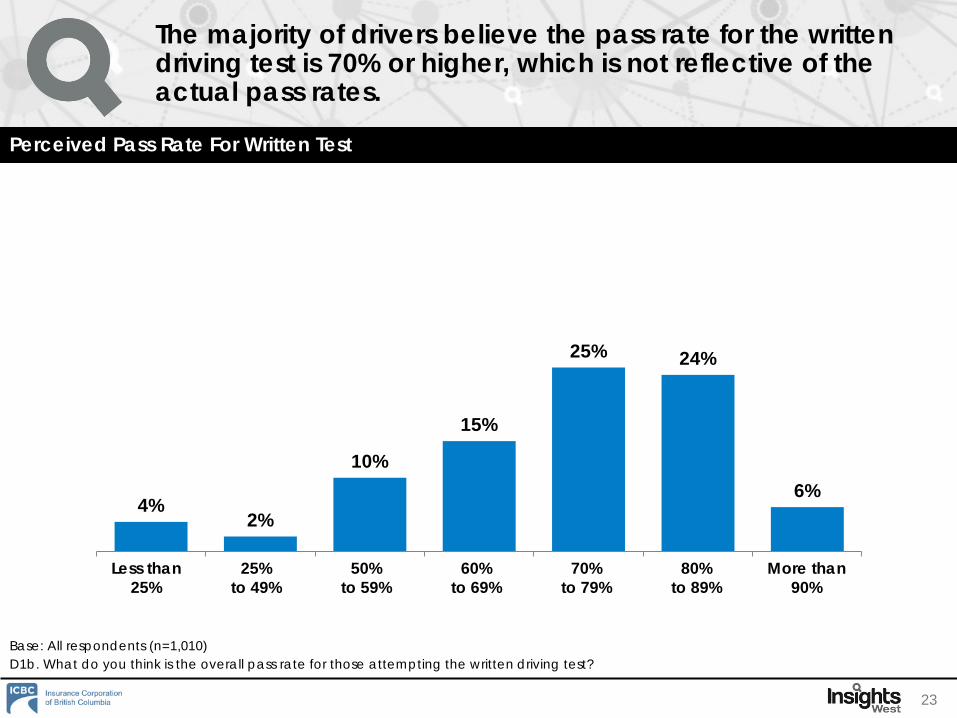
The majority of drivers believe the pass rate for the written driving test is 70% or higher, which is not reflective of the actual pass rates.
Perceived Pass Rate For Written Test
23
4%2%
10%
15%
25% 24%
6%
Less than 25%
25% to 49%
50% to 59%
60%to 69%
70%to 79%
80%to 89%
More than 90%
Base: All respondents (n=1,010)D1b. What do you think is the overall pass rate for those attempting the written driving test?
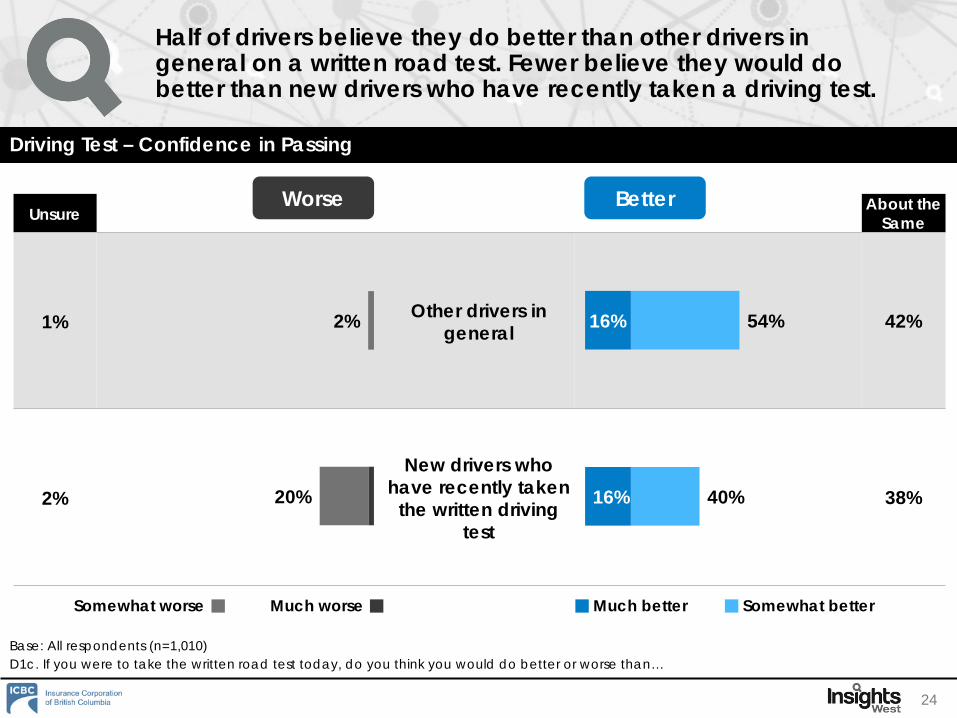
Unsure About the Same
1% Other drivers in general 42%
2%
New drivers who have recently taken
the written driving test
38%
Half of drivers believe they do better than other drivers in general on a written road test. Fewer believe they would do better than new drivers who have recently taken a driving test.
Driving Test – Confidence in Passing
24
Base: All respondents (n=1,010)D1c. If you were to take the written road test today, do you think you would do better or worse than…
BetterWorse
2%
20%
16%
16%
54%
40%
Much better Somewhat betterMuch worseSomewhat worse

Two-thirds of drivers say that it would be worthwhile to take a refresher written test, no matter a driver’s experience. A similar proportion feels they would learn new things.
Interest in Refresher Course
25
Base: All respondents (n=1,010)D1d. How much do you agree or disagree with the following statements?
If a refresher written test were available, it would
be worthwhile to complete, no matter how
experienced a driver is
If a refresher written test were available, I would
be curious to complete it to see how I would do
I think I would learn new things if I took a refresher written test
I feel like there are rules of the road that
I’ve forgotten
AgreeDisagree
27%
22%
16%
8%
66%
65%
61%
41%
Strongly agree Somewhat agreeStrongly disagreeSomewhat disagree
6%
4%
5%
8%
12%
12%
12%
27%
Claimed Level of KnowledgeVery High: 55%Somewhat 63%Average/Low: 66%
Very High: 30%Somewhat 43%Average/Low: 48%
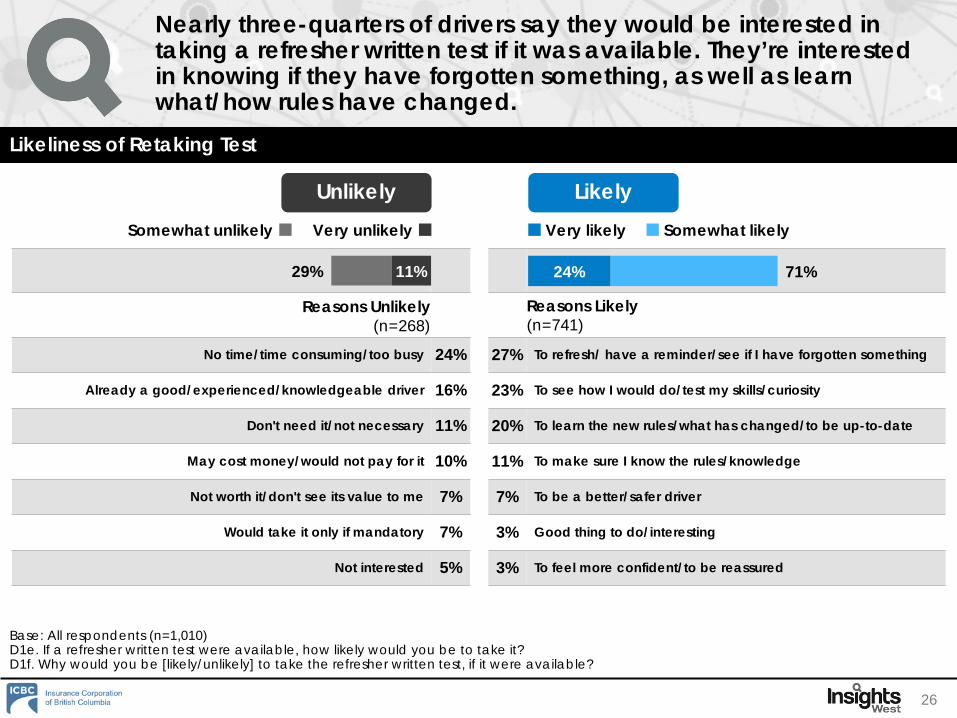
Nearly three-quarters of drivers say they would be interested in taking a refresher written test if it was available. They’re interested in knowing if they have forgotten something, as well as learn what/how rules have changed.
Likeliness of Retaking Test
26
Base: All respondents (n=1,010)D1e. If a refresher written test were available, how likely would you be to take it?D1f. Why would you be [likely/unlikely] to take the refresher written test, if it were available?
Reasons Unlikely(n=268)
Reasons Likely(n=741)
No time/time consuming/too busy 24% 27% To refresh/ have a reminder/see if I have forgotten something
Already a good/experienced/knowledgeable driver 16% 23% To see how I would do/test my skills/curiosity
Don't need it/not necessary 11% 20% To learn the new rules/what has changed/to be up-to-date
May cost money/would not pay for it 10% 11% To make sure I know the rules/knowledge
Not worth it/don't see its value to me 7% 7% To be a better/safer driver
Would take it only if mandatory 7% 3% Good thing to do/interesting
Not interested 5% 3% To feel more confident/to be reassured
LikelyUnlikely
24% 71%
Very likely Somewhat likelyVery unlikelySomewhat unlikely
11%29%
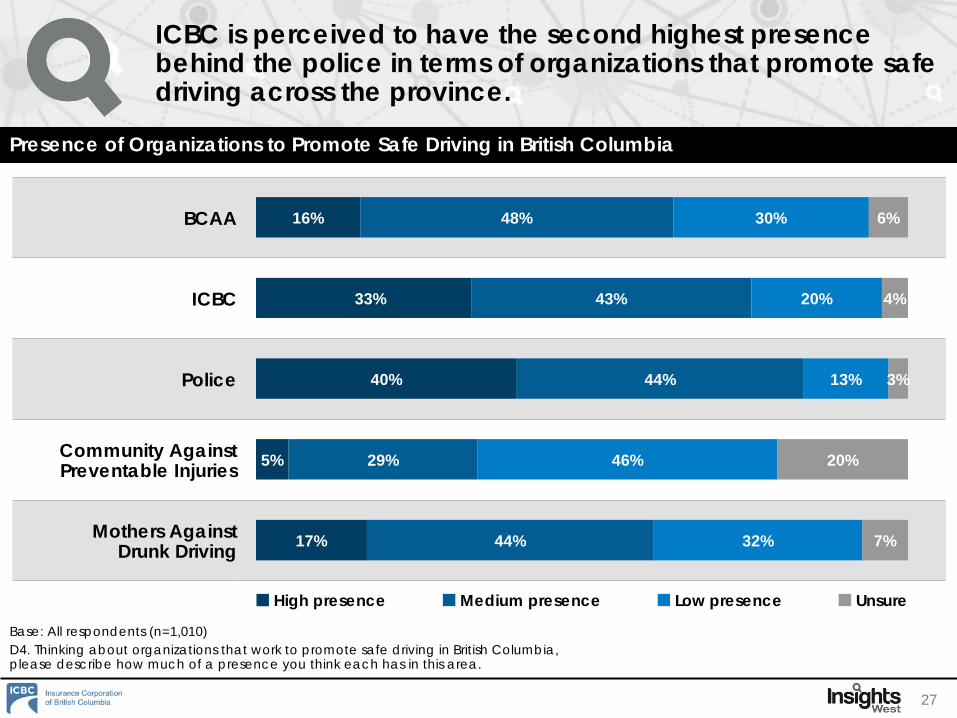
ICBC is perceived to have the second highest presence behind the police in terms of organizations that promote safe driving across the province.
Presence of Organizations to Promote Safe Driving in British Columbia
27
Base: All respondents (n=1,010)D4. Thinking about organizations that work to promote safe driving in British Columbia, please describe how much of a presence you think each has in this area.
BCAA
ICBC
Police
Community Against Preventable Injuries
Mothers Against Drunk Driving
16%
33%
40%
5%
17%
48%
43%
44%
29%
44%
30%
20%
13%
46%
32%
6%
4%
3%
20%
7%
High presence Medium presence Low presence Unsure
Simplified Understanding
Respondent Profile
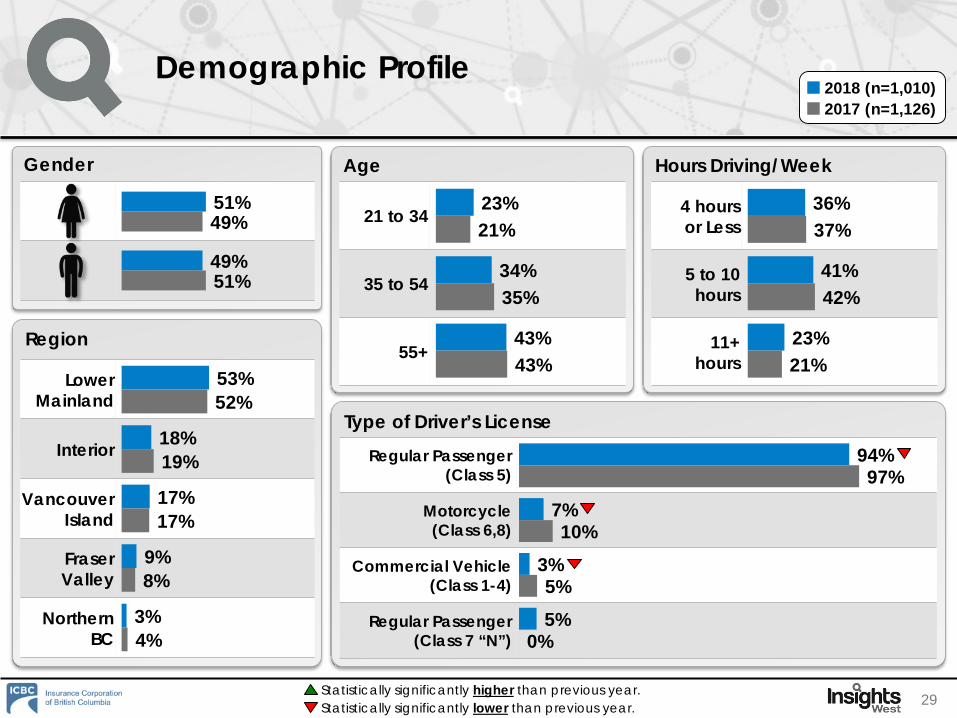
Hours Driving/Week
4 hours or Less
5 to 10 hours
11+ hours
Age
21 to 34
35 to 54
55+
Gender
Region
Lower Mainland
Interior
Vancouver Island
Fraser Valley
Northern BC
Type of Driver’s LicenseRegular Passenger
(Class 5)
Motorcycle (Class 6,8)
Commercial Vehicle (Class 1-4)
Regular Passenger(Class 7 “N”)
Demographic Profile
29
23%
34%
43%
21%
35%
43%
51%
49%
49%
51%
36%
41%
23%
37%
42%
21%53%
18%
17%
9%
3%
52%
19%
17%
8%
4%
94%
7%
3%
5%
97%
10%
5%
0%
2018 (n=1,010)2017 (n=1,126)
Statistically significantly lower than previous year.Statistically significantly higher than previous year.
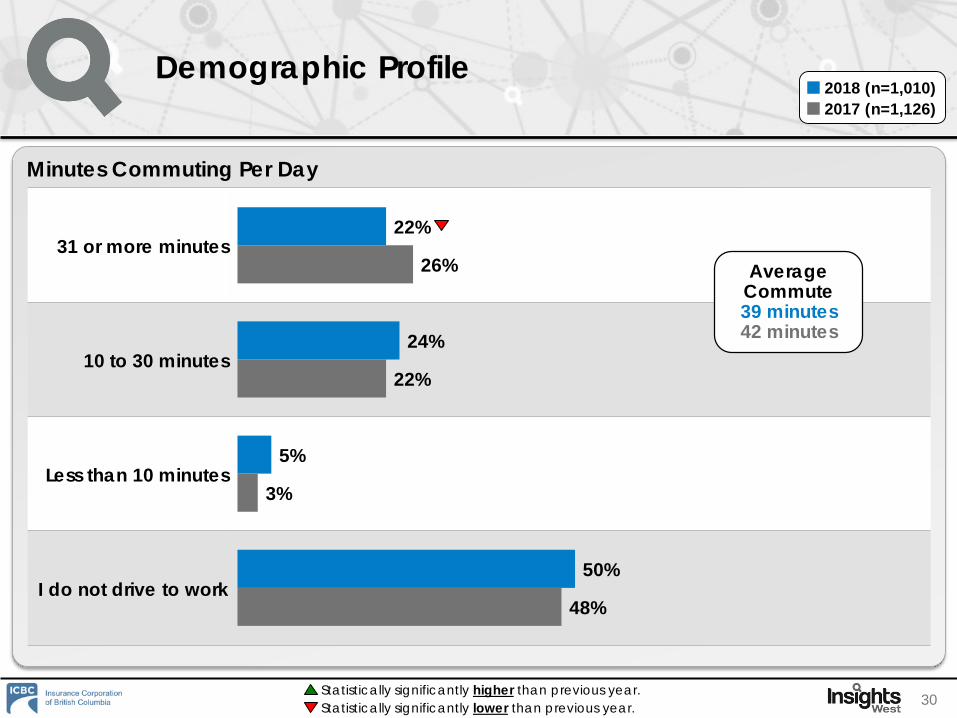
Minutes Commuting Per Day
31 or more minutes
10 to 30 minutes
Less than 10 minutes
I do not drive to work
Demographic Profile
30
22%
24%
5%
50%
26%
22%
3%
48%
Average Commute39 minutes42 minutes
Statistically significantly lower than previous year.Statistically significantly higher than previous year.
2018 (n=1,010)2017 (n=1,126)

© 2018 INSIGHTS WEST ALL RIGHTS RESERVED
Simplified Understanding
Suite 304, 1140 Homer StreetVancouver, BC
V6B 2X6www.insightswest.com
For more information on this report, please contact:Allan Dawe, Vice President