driving organic growth · 5 q1, 2020 highlights 5 q1 production tracking in line with guidance...
TRANSCRIPT

1
TSX: EDR | NYSE: EXK April 2020
DrivingOrganicGrowth

2
Cautionary Note
This presentation contains “forward-looking statements” within the meaning of the United States private securities litigation reform act of 1995 and “forward-looking
information” within the meaning of applicable Canadian securities legislation. Such forward-looking statements and information herein include, but are not limited to,
statements regarding Endeavour’s anticipated performance in 2020 and future years, including revenue, cash flow, operating and capital cost forecasts, silver and gold
production, timing and expenditures to explore and develop new silver mines and mineralized zones, silver and gold grades and recoveries, cash and all-in sustaining
costs per ounce, initial and sustaining capital expenditures, and the use of the Company’s working capital. The Company does not intend to, and does not assume any
obligation to update such forward-looking statements or information, other than as required by applicable law.
Forward-looking statements or information involve known and unknown risks, uncertainties and other factors that may cause the actual results, level of activity,
performance or achievements of Endeavour and its operations to be materially different from those expressed or implied by such statements. Such factors include,
among others: fluctuations in the prices of silver and gold, fluctuations in the currency markets (particularly the Mexican peso, Canadian dollar and U.S. dollar);
fluctuations in the price of consumed commodities, changes in national and local governments, legislation, taxation, controls, regulations and political or economic
developments in Canada and Mexico; operating or technical difficulties in mineral exploration, development and mining activities; risks and hazards of mineral
exploration, development and mining (including environmental hazards, industrial accidents, unusual or unexpected geological conditions, pressures, cave-ins and
flooding); inadequate insurance, or inability to obtain insurance; availability of and costs associated with mining inputs and labour; the speculative nature of mineral
exploration and development, reliability of calculation of mineral reserves and resources and precious metal recoveries, diminishing quantities or grades of mineral
reserves as properties are mined; risks in obtaining necessary licenses and permits, global market events and conditions and challenges to the Company’s title to
properties; as well as those factors described in the section “risk factors” contained in the Company’s most recent form 40F/Annual Information Form filed with the S.E.C.
and Canadian securities regulatory authorities
Forward-looking statements are based on assumptions management believes to be reasonable, including but not limited to: the continued operation of the Company’s
mining operations, no material adverse change in the market price of commodities, mining operations will operate and the mining products will be completed in
accordance with management’s expectations and achieve their stated production outcomes, and such other assumptions and factors as set out herein.
Although the Company has attempted to identify important factors that could cause actual results to differ materially from those contained in forward-looking statements
or information, there may be other factors that cause results to be materially different from those anticipated, described, estimated, assessed or intended. There can be
no assurance that any forward-looking statements or information will prove to be accurate as actual results and future events could differ materially from those
anticipated in such statements or information. Accordingly, readers should not place undue reliance on forward-looking statements or information.
3
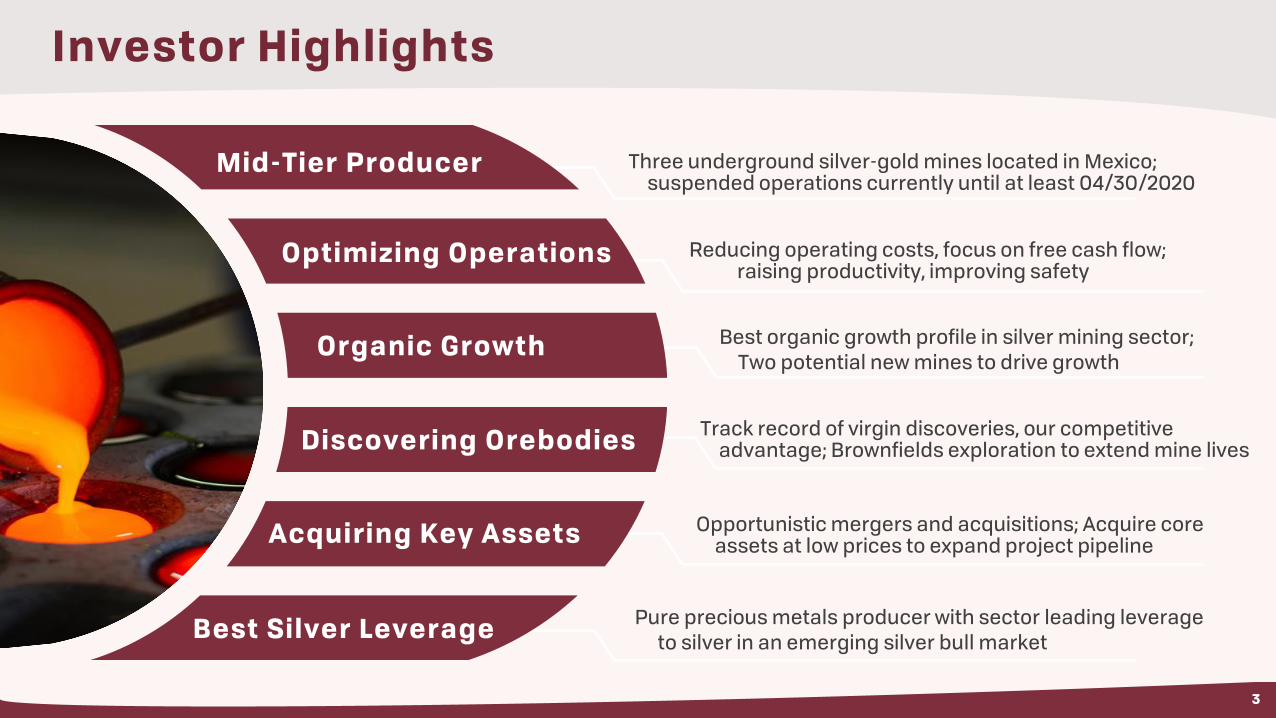
Investor Highlights
Pure precious metals producer with sector leading leverage
to silver in an emerging silver bull market
Opportunistic mergers and acquisitions; Acquire core assets at low prices to expand project pipeline
Mid-Tier Producer
Organic Growth
Discovering Orebodies
Acquiring Key Assets
Best Silver Leverage
Three underground silver-gold mines located in Mexico; suspended operations currently until at least 04/30/2020
Best organic growth profile in silver mining sector;
Two potential new mines to drive growth
Optimizing Operations Reducing operating costs, focus on free cash flow; raising productivity, improving safety
Track record of virgin discoveries, our competitive advantage; Brownfields exploration to extend mine lives
4
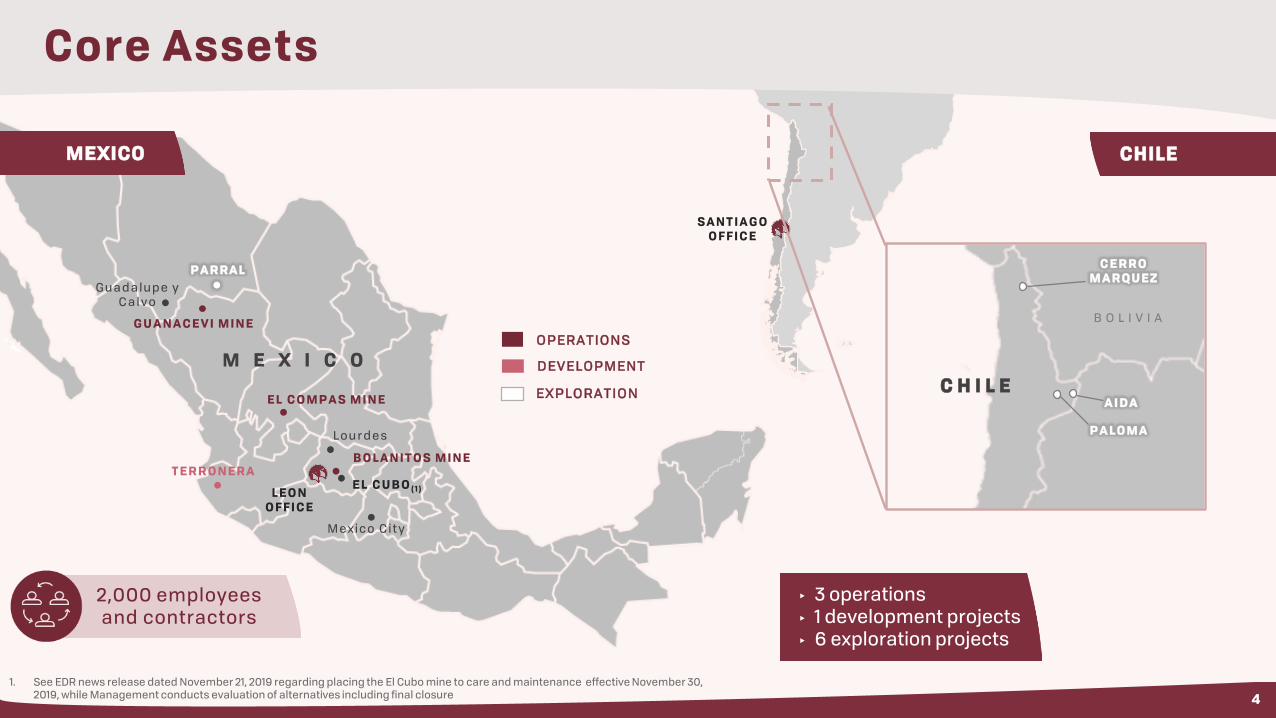
Core Assets
OPERATIONS
DEVELOPMENT
EXPLORATION
MEXICO CHILE
M exi co C i t y
Lo u r d es
Gu a d a lup e y C a l v o
L EO NO F F I C E
S A N T I A G OO F F I C E
M E X I C O
G U A N A C EV I M I N E
EL C O M P A S M I N E
EL C U B O ( 1)
B O L A N I T O S M I N ET ER R O N ER A
P A R RA L
B O L I V I A
C H I L EA I D A
P A L O M A
C E R R O M A R Q U EZ
2,000 employees and contractors
▸ 3 operations▸ 1 development projects ▸ 6 exploration projects
1. See EDR news release dated November 21, 2019 regarding placing the El Cubo mine to care and maintenance effective November 30, 2019, while Management conducts evaluation of alternatives including final closure

5
Q1, 2020 Highlights
5
Q1 Production Tracking In Line with Guidance prior to
suspension. Consolidated production was 857,689 oz Ag
and 8,476 oz Au (1.5 million oz AgEq (1) /1.8 million oz AgEq(2))
Implemented Operating Improvements at All Mines
Guanacevi outperformed, Bolanitos underperformed and
El Compas close to plan
Strengthened Management Team, appointed new
Director, Project Development to advance growth pipeline
De-risked Terronera Project by updating PFS and
optimizing internally to improve economics
2019 Mineral Reserves & Resources(3) P&P increased at
Bolanitos & El Compas, M&I increased at Guanacevi &
Parral, inferred increased at Guanacevi, Bolanitos, & Parral
Implemented COVID-19 Plan to minimize risks to employees
and the business. Operations suspended due to Mexico
National Health Emergency and Government decree
46% Au39,151
oz Au sold
54% Ag4.1 million oz Ag sold
2019 Revenue $121.7 million
Q1 2020 AgEq (1) Production 1.5 million oz
1. Silver equivalents have been calculated using an 80:1 gold: silver ratio (guidance)2. Silver equivalents have been calculated using an 110:1 gold: silver ratio (current) 3. As at December 31, 2019. For full details refer to table in the appendix
Guanacevi
61%Bolanitos
26%
El Compas
13%

6
Guanacevi MineDurango
7
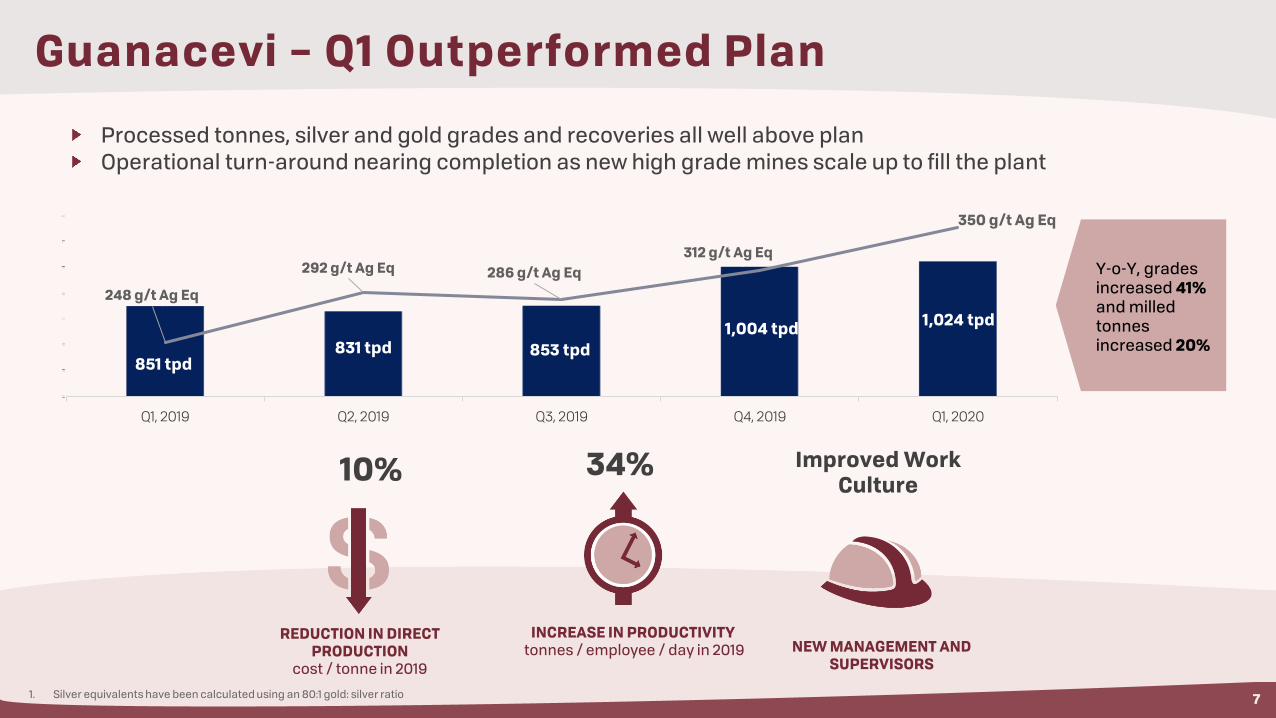
Guanacevi – Q1 Outperformed Plan
851 tpd831 tpd 853 tpd
1,004 tpd1,024 tpd
248 g/t Ag Eq
292 g/t Ag Eq 286 g/t Ag Eq
312 g/t Ag Eq
350 g/t Ag Eq
200
220
240
260
280
300
320
340
360
Q1, 2019 Q2, 2019 Q3, 2019 Q4, 2019 Q1, 2020
10%
REDUCTION IN DIRECT PRODUCTION
cost / tonne in 2019
34%
INCREASE IN PRODUCTIVITYtonnes / employee / day in 2019
Improved Work Culture
NEW MANAGEMENT AND SUPERVISORS
Y-o-Y, gradesincreased 41% and milled tonnesincreased 20%
Processed tonnes, silver and gold grades and recoveries all well above plan
Operational turn-around nearing completion as new high grade mines scale up to fill the plant
1. Silver equivalents have been calculated using an 80:1 gold: silver ratio

8
1. Silver equivalents are converted using a 80:1 silver: gold ratio (guidance) 2. Silver equivalents are converted using a 110:1 silver: gold ratio (current) 3. Cash costs per ounce and AISC per ounce are examples of Non-IFRS measures. See disclosure in quarterly MD&A for information on “Non-GAAP”
measures found on the company website. Costs are presented in US $, net of by-product credits. 4. All-in sustaining costs (AISC) include mining, processing, direct overhead, corporate G&A, on-site exploration, share-based compensation,
reclamation, and sustaining capital net of gold credits.
Guanacevi –Outlook: Continue to Outperform
$21.06 $17.37
$12.83 $13.54
$27.56$24.94
$20.99 $19.48
$0.00
$5.00
$10.00
$15.00
$20.00
$25.00
$30.00
Q1, 2019 Q2, 2019 Q3, 2019 Q4, 2019
AISC/ oz Cash Cost/ oz
Operating Costs(3,4) Decreasing
Q1, 2020 Production of 1.0 million AgEq oz
20% Au 2,427 oz
80% Ag745,114 oz
► Install two refurbished core crushers in April
► Ramp up throughput to 1,200 tpd plant capacity
► Expand production from SCS orebody to 2-300 tpd
► Replace mining contractors with employees to reduce costs
► Deliver free cash flow
Q1, 2020 Q1, 2019 Change (%)
Tonnes Produced (tpd) 1,024 851 20%
Ag Grade (gpt) 280 206 36%
Au Grade (gpt) 0.87 0.52 67%
AgEq (1) Production (oz) 939,274 549,184 71%
AgEq (2) Production (oz) 1,012,084 583,324 84%
Cash Costs (3) n/a $21.06 Will continue to fall as productivityrisesAll-in Sustaining Costs (3,4) n/a $27.56

9
Bolanitos MineGuanajuato
10
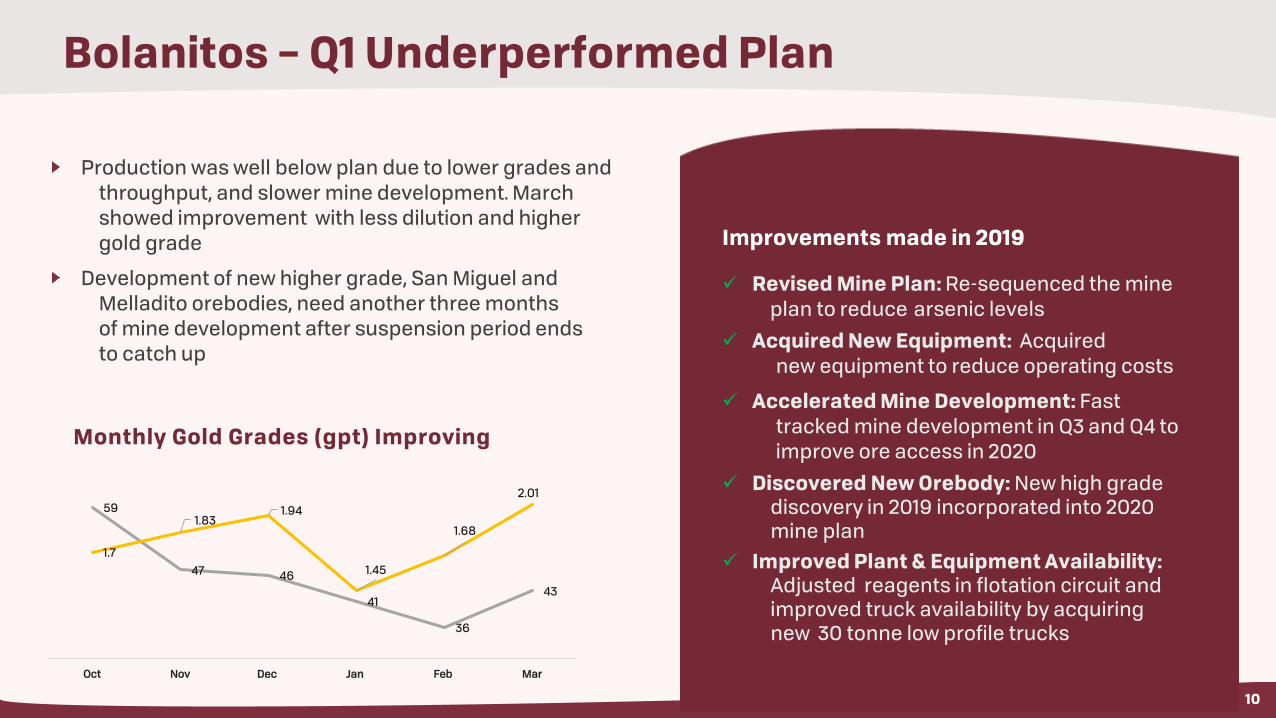
Bolanitos – Q1 Underperformed Plan
Production was well below plan due to lower grades and
throughput, and slower mine development. March
showed improvement with less dilution and higher
gold grade
Development of new higher grade, San Miguel and
Melladito orebodies, need another three months
of mine development after suspension period ends
to catch up
Improvements made in 2019
Revised Mine Plan: Re-sequenced the mine
plan to reduce arsenic levels
Acquired New Equipment: Acquired
new equipment to reduce operating costs
Accelerated Mine Development: Fast
tracked mine development in Q3 and Q4 to
improve ore access in 2020
Discovered New Orebody: New high grade discovery in 2019 incorporated into 2020 mine plan
Improved Plant & Equipment Availability: Adjusted reagents in flotation circuit and improved truck availability by acquiring new 30 tonne low profile trucks
Monthly Gold Grades (gpt) Improving
59
47 46
41
36
43
1.7
1.831.94
1.45
1.68
2.01
1
1.2
1.4
1.6
1.8
2
2.2
30
35
40
45
50
55
60
65
Oct Nov Dec Jan Feb Mar

11
Bolanitos –Outlook: Quarterly Improvement
80% Au 3,922 oz Au20% Ag
86,125 oz Ag
Q1, 2020 Production of 400,000 0 AgEq (1) oz
Rising Quarterly Throughput (tpd)
963
tpd 839
tpd778
tpd
893
tpd
905
tpd
500
550
600
650
700
750
800
850
900
950
1000
Q1, 2019 Q2, 2019 Q3, 2019 Q4, 2019 Q1, 2020
Q1, 2020 Q1, 2019 Change (%)
Tonnes Produced (tpd) 905 963 6%
Ag Grade (gpt) 40 86 53%
Au Grade (gpt) 1.71 1.82 6%
AgEq (1) Production (oz) 399,885 550,410 27%
AgEq (2) Production (oz) 517,545 683,310 24%
Cash Costs (3) n/a $2.43 Historicallyoperated at less than $5/oz
All-in Sustaining Costs (3,4) n/a $16.36
Ramp up throughput to 1,200 tpd plant capacity
Expand production from San Miguel to 300 tpd
New discovery, possible extension of Melladito orebody
Currently investing capital to develop new high-grade areas
Acquire extensions of known orebodies to increase mine life
Deliver free cash flow
1. Silver equivalents are converted using a 80:1 silver: gold ratio (guidance) 2. Silver equivalents are converted using a 110:1 silver: gold ratio (current) 3. Cash costs per ounce and AISC per ounce are examples of Non-IFRS measures. See disclosure in quarterly MD&A for information on “Non-GAAP”
measures found on the company website. Costs are presented in US $, net of by-product credits. 4. All-in sustaining costs (AISC) include mining, processing, direct overhead, corporate G&A, on-site exploration, share-based compensation,
reclamation, and sustaining capital net of gold credits.

12
El Compas MineZacatecas

13
El Compas – Q1 Close to Plan
La PlomosaPanuco
Vetagrande
San JuanMala Noche
Calicanto
La Cantera
La Parroquia
Compas Orito
Plant
Processed tonnes higher but silver and gold grades and
recoveries lower than plan
Operating improvements continuing
Delayed development of higher grade Upper El Compas vein
Throughput, grades and recoveries improved during Q1
14
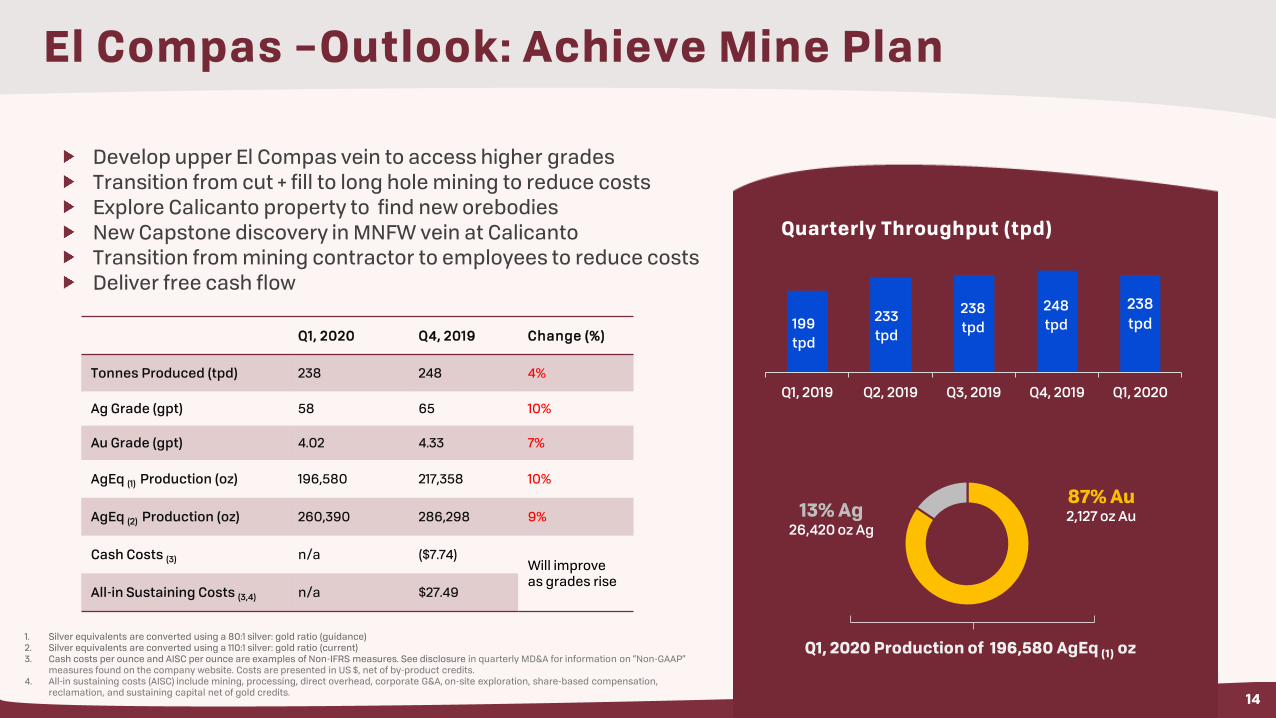
El Compas –Outlook: Achieve Mine Plan
Quarterly Throughput (tpd)
87% Au 2,127 oz Au13% Ag
26,420 oz Ag
Q1, 2020 Production of 196,580 AgEq (1) oz
199
tpd
233
tpd
238
tpd
248
tpd
238
tpd
0
50
100
150
200
250
300
Q1, 2019 Q2, 2019 Q3, 2019 Q4, 2019 Q1, 2020
Q1, 2020 Q4, 2019 Change (%)
Tonnes Produced (tpd) 238 248 4%
Ag Grade (gpt) 58 65 10%
Au Grade (gpt) 4.02 4.33 7%
AgEq (1) Production (oz) 196,580 217,358 10%
AgEq (2) Production (oz) 260,390 286,298 9%
Cash Costs (3) n/a ($7.74)Will improveas grades rise
All-in Sustaining Costs (3,4) n/a $27.49
Develop upper El Compas vein to access higher grades
Transition from cut + fill to long hole mining to reduce costs
Explore Calicanto property to find new orebodies
New Capstone discovery in MNFW vein at Calicanto
Transition from mining contractor to employees to reduce costs
Deliver free cash flow
1. Silver equivalents are converted using a 80:1 silver: gold ratio (guidance) 2. Silver equivalents are converted using a 110:1 silver: gold ratio (current) 3. Cash costs per ounce and AISC per ounce are examples of Non-IFRS measures. See disclosure in quarterly MD&A for information on “Non-GAAP”
measures found on the company website. Costs are presented in US $, net of by-product credits. 4. All-in sustaining costs (AISC) include mining, processing, direct overhead, corporate G&A, on-site exploration, share-based compensation,
reclamation, and sustaining capital net of gold credits.

15
Terronera Project Jalisco

16
Terronera – Large, Low Cost Mine Potential
TerroneraDiscovery
La LuzDiscovery
1. 2019 silver equivalents are converted using a 80:1 gold: silver ratio 2. As at December 31, 2019. For full details refer to table in the appendix
Quick Facts
Annual Silver/Gold Production (oz) 2.9 million Ag / 28,000 Au
Annual AgEq (1) Production (oz) 5.1 million
2 Defined Ore Bodies Terronera and La Luz, 66m oz Ag Eq in Reserves (2)
and 14m oz AgEq in Resources, 12 year mine life
AgEq (1) Grade (gpt) & Vein Widths Approx. 400 gpt AgEq; 3-16 m thick
Next Core Asset
Increases consolidated production by +50%
Significantly decreases consolidated costs
District Scale Opportunity
Endeavour controls 21 concessions, totalling 16,691 hectares
Covering the entire district of San Sebastian, +50 old mines on
+20 known veins, 40 km NE of Puerto Vallarta
PFS Being Optimized
2018 PFS returned robust economics
2019 PFS update returned less robust economics
2020 PFS optimization now underway; Management will then
consider a full feasibility study

17
Mining Costs ,
$46.08Processing
Costs , $19.58
G&A, $8.40
Royalty , $4.23
Positive Project Economics Based on Updated 2018 PFS (AFTER-TAX)
NPV
@5% (US$)
$118 M
IRR
23.5%
PAYBACK
(years)
5.4
Terronera - Improved Project Economics
Operating & Financial Metrics 2018 PFS (1)
LOM tonnes processed (thousands) 4,701
Life of Mine (Years) 9.5
Average silver grade (g/t) 224
Average gold grade (g/t) 2.26
Silver equivalent grade (g/t) Base Prices 394
Avg annual Ag ounces produced (millions) 2.9
Avg annual Au ounces produced (thousands) 28
Avg annual Ag Eq ounces produced (millions) 5.1
LOM Revenue ($, millions) 815.8
LOM EBITDA ($, millions) 447.7
LOM Free cash flow ($, millions) 193.2
Total Cost $78.30
Direct Costs per Tonne
Cash Costs(2) AISC (2)
$0.15 / Ag oz$1.36 / Ag oz
Projected Low Total Cash Costs & AISC (3)
1. See Appendix for full base case assumptions in the updated 2018 PFS. Silver and gold price assumptions were $17/ oz Ag and $1,275 / oz Au. Average Recoveries for silver and gold are 84.6% and 80.4% respectively
2. Cash costs per ounce and AISC per ounce are examples of Non-IFRS measures. See disclosure in quarterly MD&A for information on “Non-GAAP” measures found on the company website. Costs are presented in US $, net of by-product credits
3. Projected cash costs & AISC are based on Updated PFS filed in 2018.
* S u b j e c t t o c h a n g e u p o n r e l e a s e o f f i n a l e c o n o m i c s

18
Terronera – Production & Grade Profiles
NW SE
Terronera Vein
Longitudinal Section Silver Equivalent Grade Distribution AGEQ= AG + (AU x 75)
La Luz Vein
W
E
Almost entirely super high grade
All colors but grey and blue make ore grade Grey were high grade stopes mined out
Annual production profile source: Updated 2019 PFS dated April 30, 2019

19
Terronera – Surface Layout
Santiago de los Pinos
San Sebastián
La Luz Mine
Terronera Mine
Tailings Dam
Plant
El Rayo
Waste Dump
Mine Camp
0 21Km
Community Engagement
Will employ 350 people during construction &
400 in operations
Social impact study underway
Reclaiming disturbed areas annually – planted
over 69,000 trees in the area
Mine skills training programs for locals to
become future employees
Signed collaboration agreement with CONANP -
(Natural Protected Areas Commission) to
cooperate on minimizing potential
environmental impacts
Hiring key managers and positions
The Project is fully permitted including Tailings,
Mine and Plant Permits

20
Terronera – Upcoming Catalysts
Next Engineering Steps
Conduct gap analysis & PFS validation
Optimize mine plan – new reserves based on drilling
Optimize plant circuits - increase recoveries & con grades
Metallurgical testing – complete large diameter core holes
Final reserve estimate – drill infill holes at La Luz
Publish final economics - signed by independent firm
Issue contracts - EPCM, plant, tailings, mine and other
Permit camp construction – review alternatives
Advance to feasibility study – optimize economics and
enhance financing alternatives
Finalize economics
Consider feasibility study
Receive Boarddevelopmentdecision

21
Terronera – Further Optimization
Criteria under review in the new PFS to generate more robust economics:
Confirm Mineral Reserve estimate by re-assessing and validating methodology
Defer certain initial CAPEX costs by partnering with suppliers
Reduce preproduction underground mine development – reduce number and length
of access ramps
Reduce power cost by analyzing details of power consumption needs,
renegotiate rates, consider alternative sources of energy
Change construction camp to rental vs. purchasing a permanent facility up front
Consider leasing new/used mining equipment & consider relocating certain plant
equipment from El Cubo
Phase in construction and use of tailings facility
1
2
3
4
7
5
6

22
Parral ProjectChihuahua

23
Parral – Potential Sixth Mine
Historic Silver District
Palmilla was highest grade silver mine in Mexico in 1800s,
provided silver to the Mexican mint
Veta Colorada mine produced 4 million oz Ag per year prior to
closing in 1990 due to low silver price
Historic IMMSA resource at Veta Colorada; small toll mill in the
district could facilitate early production in 2020
IMMSA’s Santa Barbara and Frisco’s San Francisco mines to SW,
Levon’s Cordero project to NE, Kootenay’s Cigarra project to W
Potential Core Asset
Was 4 million Ag oz per year mine until 1990
Indicated Resource(1) 3.7 million oz Ag; Inferred Resource(1)
36.8 million oz Ag, 21,800 oz Au
District Scale Opportunity
Endeavour concessions total 3,450 hectares
Controls the Parral district, 4 old mines and multiple veins
Potential Resource Expansion
Largest exploration project in 2019 ($2 million budget)
Updated resource estimate, mined bulk sample, now ready
for processing at local toll mill
1. As at December 31, 2019. For full details refer to table in the appendix.

24
Parral – Review and Outlook
2020 Objectives
Complete a stage 1 PEA to evaluate small scale 200 tpd
mining and toll milling project to generate early cash flow
to fund Stage 2 larger scale 1,500 – 2,000 tpd operation
2,000 tonne bulk sample will be processed at local toll mill
to refine metal recoveries in Q1
Initial mine permitting, underground development, drilling,
mapping and sampling to confirm old resources and
outline new resources at Veta Colorada mine
2019 Results
Positive drill results including 332 gpt Ag over 13.1m and
+400 channel samples collected
1. As at December 31, 2019. For full details refer to table in the appendix
High grade San Patricio drill core from successful exploration program
Veta Colorado main ramp access Sierra Plata

25
Chile Projects

26
Chile – World Class Exploration Targets
Cerro Marquez – Bulk Tonnage Porphyry Copper (Au-Mo)
Geologically similar to other large porphyry copper mines in Chile
Massive porphyry alteration zone in Miocene Volcanic Caldera
Drilled in Q4, 2019 – results geologically encouraging
Paloma – High Sulfidation Epithermal Gold (Ag)
Geologically similar to 4 million oz Solares Noite discovery
Massive acid-sulfate alteration zone in Miocene Volcanic Caldera
Drilling commenced November 2019, will resume in Q3, 2019
Aida – Low Sulfidation Epithermal Silver (Pb-Zn)
Geologically similar to 2 billion oz Cerro Potosi mine
Massive epithermal alteration zone Miocene Volcanic rocks
Drilling planned 2021
Cerro Marquez
Paloma
Aida

27
Exploring to extend
mine lives
Developing to
expand production
Advancing to development
High impact discovery potential
OPERATING MINES
Guanacevi – Transitioned to new higher grade orebodies
Bolanitos – Developing new higher grade orebodies
El Compas – Recently commissioned new mine
DEVELOPMENT PROJECTS
CHILE ASSETS
Aida – Bulk tonnage low sulfidation epithermal silver
Cerro Marquez – Bulk tonnage porphyry copper
Paloma – Bulk tonnage high sulfidation epithermal gold
Terronera Jalisco
Complete updated PFS
Consider feasibility study and project financing
Parral, Chihuahua
Complete initial PEA
Evaluate near term small scale production
Evaluate longer term large scale production
Sector Leading Organic Growth Strategy

28
Shareholder Information
Capital Structure
Issued/ Outstanding 141.7 million
Fully Diluted 149.8 million
Recent Price (April 7, 2020) US$1.32
Market cap (April 7, 2020) US$188 million
52-Week High/Low US$3.20/$1.00
60-Day Avg Daily Volume (shares) ~3.0 million
Key Data
Exchange Listings NYSE:EXK, TSX:EDR, FSE:EJD
Working Capital US$38.4 million
Cash Position US$23.4 million
Major Shareholder Van Eck (GDXJ) 6.0%
Strategic Shareholder Fresnillo 2%
Mining Analysts 9
~ presented as at December 31, 2019 unless noted otherwise
Sector Leading Beta to Silver(1)
Analysts Coverage
BMO Capital Markets Ryan Thompson
CIBC World Markets Cosmos Chiu
Global Alliance Bhakti Pavani
GMP Securities Ian Parkinson
Noble Capital Markets Mark Reichman
PI Financial Chris Thompson
Roth Capital Partners Joseph Reagor
H.C. Wainwright Heiko Ihle
TD Securities Craig Hutchison
1.00
1.491.70 1.72
2.09 2.172.30 2.32
2.46
Hecla Mining Pan
American
Coeur Mining Great
Panther
Avino Silver First Majestic Fortuna
Silver
Americas
Silver Corp
Endeavour
Silver
Expressed as a weekly frequency as compared to the GSCI Silver index
1. Source: 1 year beta as provided by Capital IQ software – as of Feb 19, 2020.

29
Underperformed in 2019; Value + Growth in 2020
2.4X
2.4X
1.9X
1.5X
1.4X
1.1X
1.1X
1X
0.9X
FIRST MAJESTIC
HECLA
SILVERCORP
COEUR
PAN AMERICAN
HOCHSCHILD
FORTUNA
FRESNILLO
ENDEAVOUR
Current P/NAV (ratio)
82%
44%
28%
10%
9%
9%
-1%
-2%
-17%
ENDEAVOUR
PAN AMERICAN
FRESNILLO
FORTUNA
HOCHSCHILD
HECLA
SILVER CORP
COEUR
FIRST MAJESTIC
20E - '22E Ag Growth
1. Source: BMO Capital Markets Equity Research model at street pricing, company filings, & Factset, dated Jan 21, 2020
Stock underperformed in
2019 due to operational
challenges at 2 mines
Endeavour has the strongest
organic growth profile in
the sector that is not
implicit in valuations
Historically, Endeavour has
delivered industry leading
multiples and consistent
returns and offers an
industry leading beta to
silver
30
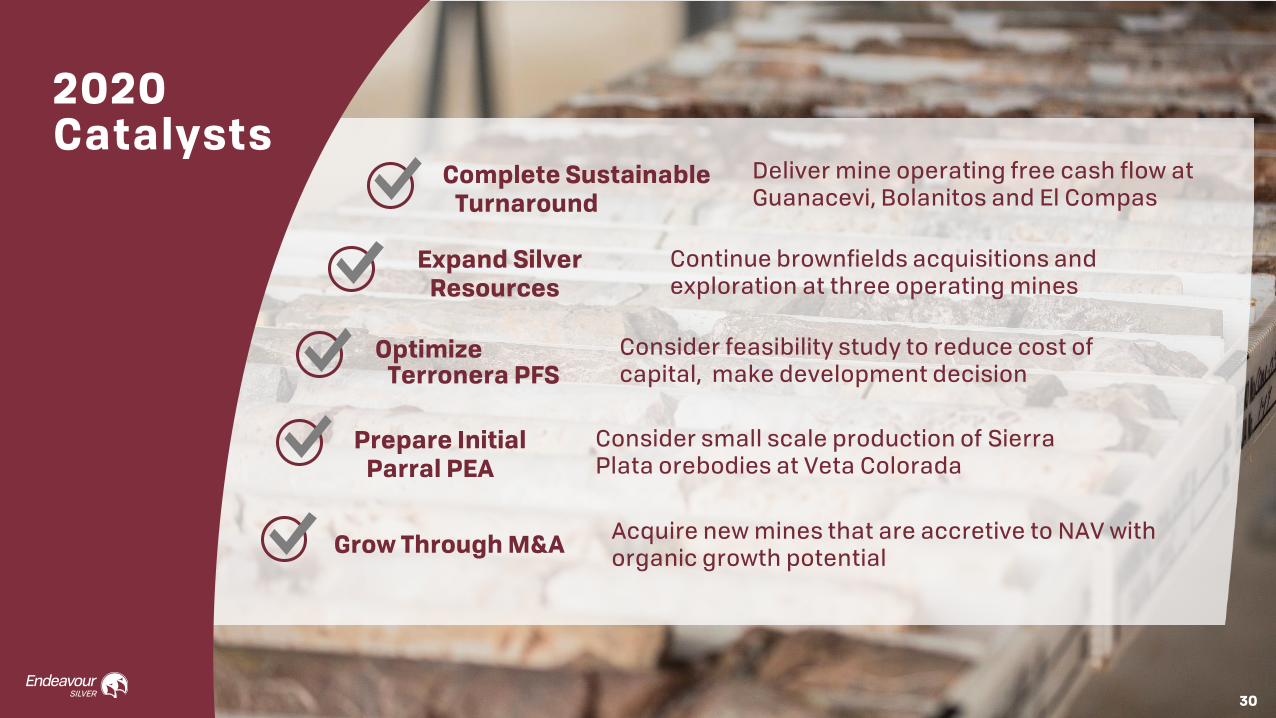
2020 Catalysts
Expand Silver Resources
Complete Sustainable Turnaround
OptimizeTerronera PFS
Prepare Initial Parral PEA
30
Grow Through M&A
Deliver mine operating free cash flow at Guanacevi, Bolanitos and El Compas
Continue brownfields acquisitions and exploration at three operating mines
Consider feasibility study to reduce cost of capital, make development decision
Consider small scale production of Sierra Plata orebodies at Veta Colorada
Acquire new mines that are accretive to NAV with organic growth potential
31
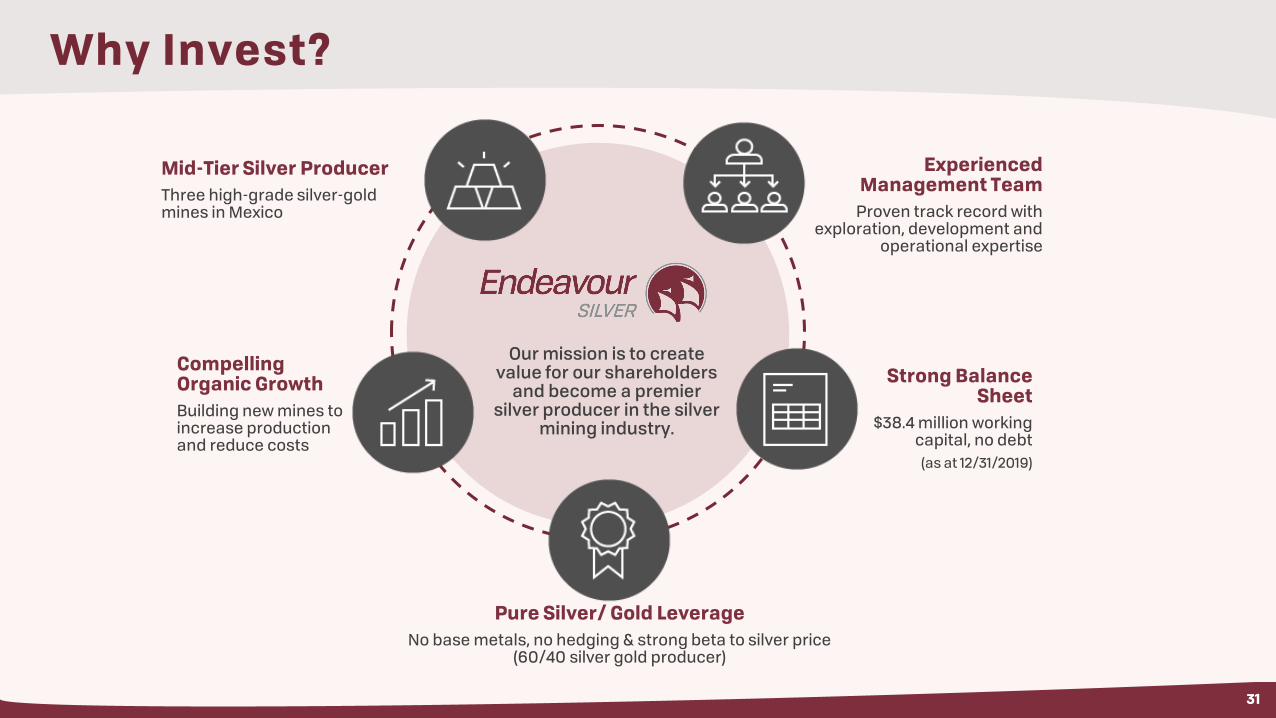
Why Invest?
Mid-Tier Silver Producer
Three high-grade silver-gold mines in Mexico
Compelling Organic Growth
Building new mines to increase production and reduce costs
Experienced Management Team
Proven track record with exploration, development and
operational expertise
Strong Balance Sheet
$38.4 million working capital, no debt
(as at 12/31/2019)
Pure Silver/ Gold Leverage
No base metals, no hedging & strong beta to silver price (60/40 silver gold producer)
Our mission is to create value for our shareholders
and become a premier silver producer in the silver
mining industry.

32
Appendix
Compelling Value Proposition
An attractive investment opportunity with an industry leading growth profile & silver leverage

33
ELECTRONICS
SILVERWARE
BATTERIES
SOLAR PANELS
BARS & COINS
WATER TREATMENT
MEDICAL
JEWELRY
Why Silver?
SILVER is playing an increasingly important role in industrial applications that contribute to a sustainable future:
100%
50%
0%
DENARIUS % SILVER
64-68 161-168 DidiusJulianus
193
Elagabalus219-222
Puplenus & Balbinus
238
Philip 244 Valerian255-60
Best natural conductor of electricity and heat: used in electronics, batteries, solar panels, alloys & coatings, LED & RFID chips, semi-conductors, photography, anti-bacterials, preservatives, medicines
Silver is a precious metal: like gold, silver is money and its role as a store of value and a hedge against monetary inflation is growing
Currency debasement is not new: governments throughout history have “printed” money; eg. falling silver % in the Roman Denarius coin
POPULAR APPLICATIONS: NON-COMMERCIAL USES:
SILVER SEMI-CONDUCTOR FILM
SILVER NANO PARTICLES
HIGH VALUE CHEMICALS
HYDROGREN FOR FUEL CELLS, ELECTRICITY
34
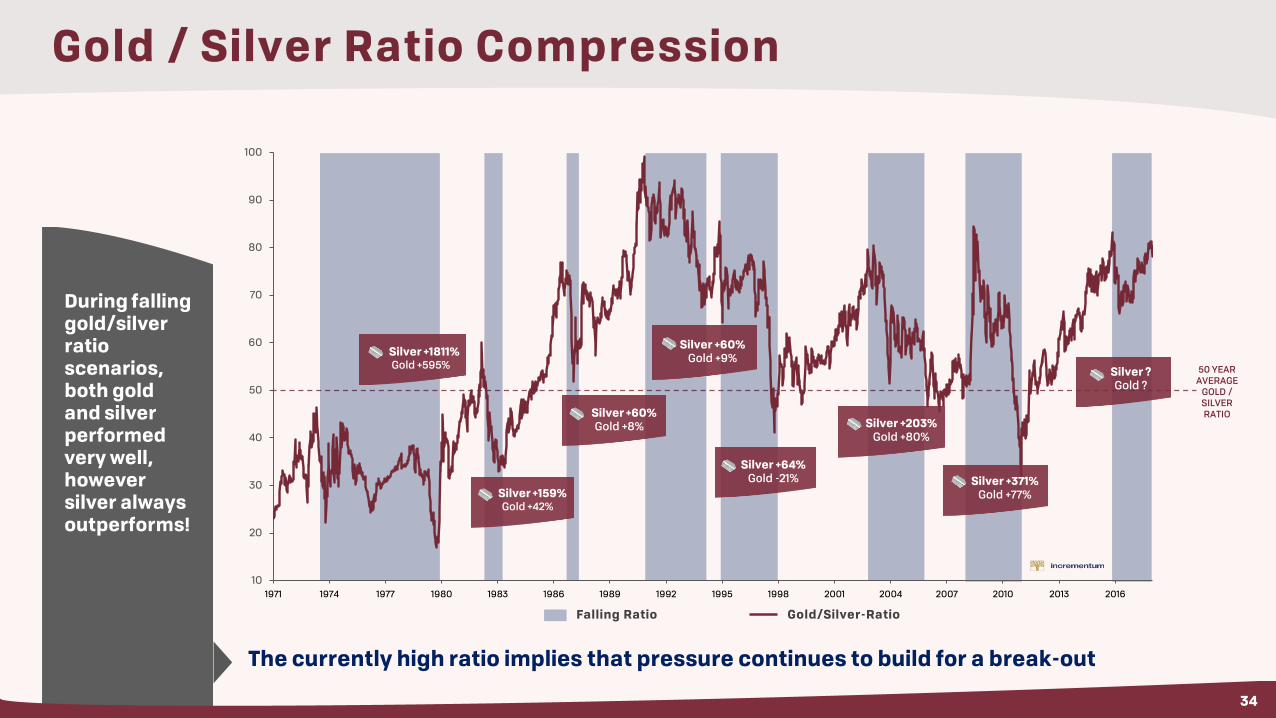
Gold / Silver Ratio Compression
During falling gold/silver ratio scenarios, both gold and silver performed very well, however silver always outperforms!
The currently high ratio implies that pressure continues to build for a break-out
10
20
30
40
50
60
70
80
90
100
1971 1974 1977 1980 1983 1986 1989 1992 1995 1998 2001 2004 2007 2010 2013 2016
Silver +1811%Gold +595%
Silver +159%Gold +42%
Silver +60%Gold +8%
Silver +64%Gold -21%
Silver +60%Gold +9%
Silver +203%Gold +80%
Silver +371%Gold +77%
Silver ?Gold ?
Gold/Silver-RatioFalling Ratio
50 YEAR AVERAGE
GOLD / SILVER RATIO
34

35
Ore Grades (g/t) Recovered Ounces Recoveries (%) Cost Analysis
Period
Plant throughput
(tonnes)Silver Gold Silver Gold Silver Gold
Cash costs ($/oz Ag)
AISC ($/oz Ag)
Direct costs($/tonne)
Q1 - 15 380,792 174 1.53 1,820,050 15,808 85.2 84.5 7.17 13.32 82.67
Q2 - 15 371,745 180 1.32 1,769,741 13,047 82.4 83.0 8.60 16.86 82.93
Q3 - 15 404,878 163 1.39 1,820,282 15,319 85.7 84.9 8.11 15.05 75.09
Q4 - 15 406,387 156 1.40 1,732,765 15,433 84.9 84.3 9.76 17.33 80.39
Total 2015 1,563,802 167 1.41 7,178,666 59,990 85.4 84.7 8.39 15.62 80.18
Q1 - 16 408,553 137 1.50 1,510,065 15,960 83.7 81.0 7.63 11.12 74.26
Q2 - 16 377,198 148 1.58 1,551,851 15,649 86.2 81.9 5.37 10.53 73.01
Q3 - 16 355,611 133 1.55 1,284,646 14,364 84.3 80.8 5.27 11.47 71.18
Q4 - 16 317,555 123 1.35 1,088.845 11,402 87.0 83.0 9.39 20.11 70.72
Total 2016 1,458,917 136 1.50 5,435,407 57,375 85.3 81.7 6.78 12.43 72.42
Q1 - 17 303,222 126 1.41 1,076,974 11,724 87.4 85.2 7.81 18.24 75.77
Q2 - 17 303,943 135 1.58 1,143,788 13,058 86.6 84.6 8.36 20.46 84.01
Q3 - 17 319,038 144 1.53 1,262,064 13,648 84.5 87 8.10 18.71 81.60
Q4 - 17 349,924 152 1.56 1,436,962 14,577 84.1 83.3 7.97 12.70 84.38
Total 2017 1,279,873 140 1.54 4,919,788 53,007 85.4 83.9 8.06 16.96 82.36
Q1 - 18 325,669 148 1.47 1,314,648 12,832 84.6 83.6 6.50 14.18 79.38
Q2 - 18 314,305 156 1.60 1,355,895 13,674 86.2 84.5 7.05 15.73 83.75
Q3 - 18 317,821 160 1.50 1,428,828 12,968 87.5 84.8 8.86 16.14 86.33
Q4 - 18 309,036 157 1.55 1,386,505 13,117 88.8 85.4 9.22 14.20 93.52
Total 2018 1,266,831 156 1.53 5,522,068 52,967 86.9 84.9 8.06 15.45 86.32
Q1 - 19 246,519 154 1.45 1,071,355 10,055 87.7 87.4 12.55 19.37 105.84
Q2 - 19 237,640 157 1.51 1,059,322 9,558 88.5 83.0 13.67 20.90 114.40
Q3 - 19 234,196 144 1.49 948,547 9,716 87.6 86.7 11.51 21.53 106.76
Q4 - 19 236,531 140 1.53 939,511 9,578 88.3 82.2 13.63 23.20 113.47
Total 2019 954,886 149 1.50 4,018,735 38,907 88.0 84.7 12.85 21.19 110.09
Consolidated Mine Operations Table

36
Guanaceví Mine Operations Table
Ore Grades (g/t) Recovered Ounces Recoveries (%) Cost Analysis
Period
Plant throughput
(tonnes)Silver Gold Silver Gold Silver Gold
Cash costs ($/oz Ag)
AISC ($/oz Ag)
Direct costs($/tonne)
Q1 - 15 106,106 300 0.63 853,106 1,877 83.4 87.3 8.23 11.16 87.34
Q2 - 15 108,817 325 0.64 958,581 1,946 84.3 86.9 8.14 13.40 92.48
Q3 - 15 111,469 285 0.58 867,292 1,792 84.9 86.2 7.98 12.76 79.15
Q4 - 15 105,039 269 0.61 761,769 1,775 83.9 86.2 10.57 14.67 93.58
Total 2015 431,431 295 0.62 3,440,748 7,390 84.1 85.9 8.66 12.97 88.04
Q1 - 16 98,776 249 0.56 651,731 1,568 82.4 88.5 8.09 12.95 71.92
Q2 - 16 98,756 232 0.49 629,221 1,365 85.4 87.7 10.82 20.11 83.38
Q3 - 16 82,059 235 0.51 542,385 1,163 87.5 86.4 11.12 21.53 93.24
Q4 - 16 87,850 211 0.49 540,708 1,232 90.7 89.0 12.66 26.74 93.60
Total 2016 367,441 232 0.51 2,364,045 5,328 86.3 88.4 10.56 19.07 84.94
Q1 - 17 87,599 213 0.49 530,683 1,192 88.5 86.4 12.85 23.78 94.99
Q2 - 17 74,894 219 0.50 468,741 1,079 88.8 89.5 14.94 27.40 111.42
Q3 - 17 74,649 249 0.57 522,907 1,224 87.5 89.5 13.68 23.47 117.15
Q4 - 17 83,881 241 0.54 544,117 1,245 83.7 85.5 12.39 17.57 99.39
Total 2017 321,113 230 0.53 2,066,448 4,740 87.0 86.6 13.41 22.87 105.13
Q1 - 18 78,971 224 0.63 489,163 1,443 86.0 90.2 15.31 22.62 120.63
Q2 - 18 71,275 225 0.67 464,929 1,423 90.2 92.7 17.46 29.24 139.24
Q3 - 18 81,268 218 0.48 518,318 1,114 91.0 88.8 18.14 28.75 131.75
Q4 - 18 75,528 222 0.58 484,197 1,240 89.8 88.0 19.38 27.49 144.57
Total 2018 307,042 222 0.59 1,963,773 5,224 89.6 89.7 17.57 27.01 133.78
Q1 – 19 76,557 206 0.52 458,144 1,138 90.4 88.9 21.06 27.56 145.37
Q2 – 19 75,591 242 0.62 536,966 1,367 91.3 90.7 17.37 24.94 148.84
Q3 – 19 78,517 232 0.67 533,923 1,557 91.2 92.1 12.83 20.99 116.20
Q4 – 19 92,323 252 0.75 673,559 2,025 90.0 91.0 13.54 19.48 131.56
Total 2019 322,988 234 0.65 2,202,592 6,087 90.6 90.2 15.87 22.86 135.14

37
Ore Grades (g/t) Recovered Ounces Recoveries (%) Cost Analysis
Period
Plant throughput
(tonnes)Silver Gold Silver Gold Silver Gold
Cash costs ($/oz Ag)
AISC ($/oz Ag)
Direct costs($/tonne)
Q1 - 15 136,076 139 2.30 521,117 8,421 85.7 83.7 0.17 5.74 74.00
Q2 - 15 106,148 131 1.72 376,305 4,982 84.2 84.9 4.82 13.80 70.89
Q3 - 15 109,124 105 1.95 300,988 5,397 81.7 78.9 7.68 14.40 70.17
Q4 - 15 103,878 90 1.88 251,363 5,166 83.6 82.3 8.09 18.15 72.31
Total 2015 455,226 118 1.99 1,449,776 23,966 83.9 82.3 4.31 11.79 71.97
Q1 - 16 137,128 94 2.33 334,569 8,449 80.7 82.2 (6.20) (3.55) 60.03
Q2 - 16 136,322 80 2.38 276,885 8,470 79.0 81.2 (7.08) (4.25) 63.94
Q3 - 16 132,686 76 2.30 255,350 7,875 78.7 80.3 (15.17) (11.16) 49.03
Q4 - 16 101,568 71 2.22 185,813 5,926 80.1 81.7 (4.87) 1.02 54.35
Total 2016 507,704 81 2.31 1,052,617 30,720 79.6 81.5 (8.37) (4.77) 57.07
Q1 - 17 94,351 66 2.40 168,723 6,218 84.3 85.4 (10.28) (3.82) 65.18
Q2 - 17 113,875 78 2.27 231,106 6,965 80.9 83.8 (4.78) 3.61 66.60
Q3 - 17 114,526 83 2.09 257,972 6,663 84.4 86.6 (0.52) 3.96 71.52
Q4 - 17 124,172 86 2.18 280,712 7,204 81.8 82.8 (2.73) 1.01 67.04
Total 2017 446,924 80 2.24 934,238 26,910 81.3 83.6 (4.00) 1.62 67.68
Q1 - 18 115,014 82 1.83 238,012 5,578 78.5 82.4 (2.77) 4.20 60.87
Q2 - 18 108,495 91 1.82 248,591 5,222 78.3 82.3 2.87 12.84 65.74
Q3 - 18 109,728 84 1.67 236,197 4,832 79.7 82.0 6.22 14.00 64.00
Q4 - 18 105,768 82 1.77 235,326 5,166 84.4 85.8 2.59 5.12 66.43
Total 2018 439,005 86 1.79 975,555 21,127 80.4 83.6 2.14 9.00 64.20
Q1 – 19 86,634 86 1.82 196,010 4,430 81.8 87.4 2.43 16.36 70.87
Q2 – 19 76,386 78 1.49 171,891 3,035 89.7 82.9 11.56 22.64 79.90
Q3 – 19 71,541 77 1.62 147,078 3,226 86.6 83.0 8.13 29.90 81.03
Q4 – 19 82,147 51 1.81 109,963 4,088 81.6 85.5 4.82 38.83 80.66
Total 2019 316,708 73 1.69 624,942 14,779 84.1 85.9 6.72 25.11 77.88
Bolañitos Mine Operations Table

38
Ore Grades (g/t) Recovered Ounces Recoveries (%) Cost Analysis
Period
Plant throughput
(tonnes)Silver Gold Silver Gold Silver Gold
Cash costs ($/oz Ag)
AISC ($/oz Ag)
Direct costs($/tonne)
Q1 - 15 138,610 113 1.46 445,827 5,510 88.5 84.7 13.24 26.44 87.61
Q2 - 15 156,780 112 1.51 434,855 6,119 77.0 80.4 12.59 26.56 84.14
Q3 - 15 184,285 124 1.54 652,002 8,130 88.7 89.1 8.48 18.48 75.50
Q4 - 15 197,470 131 1.57 719,633 8,492 86.5 85.2 9.45 19.96 77.65
Total 2015 1,563,802 119 1.52 2,288,145 28,634 88.3 86.5 10.56 22.15 80.60
Q1 - 16 172,649 108 1.38 523,765 5,943 87.4 77.6 15.87 18.11 86.91
Q2 - 16 142,120 156 1.56 645,745 5,814 90.6 81.6 5.21 7.20 74.51
Q3 - 16 140,866 128 1.46 486,911 5,326 84.0 80.5 9.16 11.60 79.20
Q4 - 16 128,137 103 1.24 362,324 4,244 85.4 83.1 11.65 19.62 68.01
Total 2016 583,772 136 1.41 2,018,745 21,327 87.4 80.6 10.09 13.32 77.88
Q1 - 17 94,351 111 1.31 377,568 4,314 87.2 84.5 8.52 20.00 70.12
Q2 - 17 115,084 137 1.60 444,031 5,014 87.6 84.7 7.95 21.60 83.38
Q3 - 17 129,863 137 1.60 465,351 5,803 81.4 86.9 6.37 17.95 78.13
Q4 - 17 141,871 157 1.61 612,133 6,128 85.5 83.4 8.78 13.56 90.69
Total 2017 511,836 136 1.55 1,919,102 21,357 85.8 83.7 7.93 17.80 80.90
Q1 - 18 131,684 161 1.65 587,473 5,811 86.2 83.2 2.93 11.22 70.81
Q2 - 18 134,535 171 1.92 642,375 7,029 86.8 84.6 2.09 10.08 75.13
Q3 - 18 126,825 188 2.00 674,313 7,022 88.0 86.1 2.47 6.96 76.55
Q4 - 18 127,740 181 1.93 666,982 6,711 89.7 84.7 3.97 7.48 85.77
Total 2018 520,784 176 1.87 2,582,740 26,616 87.6 85.0 2.87 8.86 77.00
Q1 – 19 79,538 183 1.84 413,983 4,145 88.5 88.1 7.72 11.43 105.69
Q2 – 19 64,421 178 1.63 326,458 2,918 88.6 86.4 9.63 11.47 107.09
Q3 – 19 62,253 128 1.29 223,912 2,234 87.4 86.5 17.67 20.77 113.44
Q4 – 19 39,206 106 1.16 122,471 1,167 91.7 79.8 22.67 24.41 112.48
Total 2019 245,418 155 1.54 1,086,824 10,464 88.9 86.1 12.02 14.85 109.11
El Cubo Mine Operations Table

39
Silver-Gold Reserves and Resources
Tonnes Ag g/t Au g/t Ag oz Au oz Ag Eq OzCompared
to 2018
Proven
Guanaceví 155,000 276 0.70 1,374,000 3,500 1,654,000 143%
Bolañitos 39,000 68 2.56 86,000 3,300 350,000 (78%)
El Compas 42,000 64 3.65 87,000 5,000 487,000 (2%)
Total Proven 236,000 203 1.54 1,547,000 11,800 2,491,000 (35%)
Probable
Guanaceví 560,000 240 0.66 4,326,000 11,800 5,270,000 (30%)
Bolañitos 327,000 43 2.44 455,000 25,700 2,511,000 111%
El Compas 53,000 82 4.96 141,000 8,500 821,000 100%
Terronera 5,587,000 208 2.33 37,440,000 419,000 70,960,000 -
Total Probable 6,527,000 202 2.22 42,362,000 465,000 79,562,000 (2%)
Total P+P 6,763,000 202 2.19 43,909,000 476,800 82,053,000 (4%)
Measured
Guanaceví 78,000 377 0.64 947,000 1,600 1,075,000 168%
Bolañitos 33,000 124 1.89 131,000 2,000 291,000 (77%)
El Cubo 19,000 224 1.89 140,000 1,200 236,000 (70%)
El Compas 2,000 123 6.27 9,000 500 49,000 43%
Total Measured 132,000 287 1.23 1,227,000 5,300 1,651,000 (33%)
Indicated
Guanaceví 1,062,000 331 0.85 11,305,000 29,100 13,633,000 22%
Bolañitos 502,000 160 1.95 2,588,000 31,400 5,100,000 (10%)
El Cubo 32,000 209 2.03 214,000 2,100 382,000 (83%)
El Compas 32,000 69 4.79 64,000 6,400 576,000 (49%)
Guadalupe y Calvo 1,861,000 119 2.38 7,120,000 142,400 18,512,000 -
Parral (new) 433,000 271 - 3,771,000 - 3,771,000 1,461%
Total Indicated 3,922,000 199 1.68 25,062,000 211,400 41,974,000 7%
Total M&I 4,054,000 202 1.68 26,289,000 216,700 43,625,000 5%
Inferred
Guanaceví 778,000 406 0.99 10,155,000 24,900 12,147,000 26%
Bolanitos 832,000 113 2.31 3,031,000 61,700 7,967,000 5%
El Cubo 463,000 163 1.89 2,419,000 28,200 4,675,000 (47%)
El Compas 81,000 90 6.77 232,000 17,500 1,632,000 (52%)
Terronera 1,080,000 208 2.26 7,239,000 79,000 13,559,000 -
Guadalupe y Calvo 154,000 94 2.14 465,000 10,600 1,313,000 -
Parral (new) 3,160,000 324 0.21 32,930,000 21,800 34,674,000 9%
Total Inferred 6,548,000 269 1.16 56,471,000 243,700 75,967,000 0%
Silver-Gold-Lead-Zinc Resources
Tonnes Ag g/t Au g/t Ag oz Au oz Pb% Zn% Ag Eq OzCompared to
2018
IndicatedGuanaceví 363,000 208 0.26 2,420,500 3,100 0.78 1.32 2,668,500 -
Parral (Cometa) 180,000 55 1.17 300,000 6,800 3.20 3.30 844,000 (87%)
Total Indicated 543,000 156 0.57 2,720,500 9,900 1.58 1.98 3,512,500 (61%)
InferredGuanaceví 488,000 132 0.16 2,076,000 2,500 1.36 2.54 2,276,000 -
Parral (Cometa) 880,000 74 1.45 2,100,000 41,000 3.27 3.24 5,380,000 (4%)
Total Inferred 1,368,000 95 0.99 4,176,000 43,500 2,59 2.99 7,656,000 (3%)
Reserves and Resources (Dec 31, 2019)

40
Reserves & Resources (Dec 31, 2019)Notes1. Mineral Resources are not Mineral Reserves and do not have demonstrated economic viability. There is no certainty that any or all part of the Mineral Resources will be converted into
Mineral Reserves.2. The Inferred Mineral Resource in this estimate has a lower level of confidence than that applied to an Indicated Mineral Resource and must not be converted to a Mineral Reserve. It is
reasonably expected that the majority of the Inferred Mineral Resource could be upgraded to an Indicated Mineral Resource with continued exploration.3. The Mineral Resources in this estimate were calculated using the Canadian Institute of Mining, Metallurgy and Petroleum (CIM), CIM Standards on Mineral Resources and Reserves,
Definitions and Guidelines prepared by the CIM Standing Committee on Reserve Definitions and adopted by CIM Council.4. Mineral Resources are exclusive of and in addition to Mineral Reserves.5. Guanacevi Mineral Resource and Mineral Reserve cut-off grades are based on a 182 g/t silver equivalent for Santa Cruz Sur of Guanacevi, 340 g/t silver equivalent for the El Curso
concession of Guanacevi and 218 g/t silver equivalent for Santa Cruz, North Porvenir and Milache of Guanaceví; Metallurgical recoveries were 83.3% silver and 84.5% gold for Guanaceví6. Bolañitos, Mineral Resource and Mineral Reserve cut-off grades are based on a 166 g/t silver equivalent for the Lucero ramp, 206 g/t for the La Luz ramp and 168 g/t for San Miguel of
Bolanitos. Metallurgical recoveries were 71.9% silver and 89.0% gold for Bolañitos7. El Cubo Mineral Resource cut-off grades are based on a 196 g/t silver equivalent for Area II (that comprises Dolores Mine) of El Cubo and 238 g/t silver equivalent for Areas I&IV (that
comprise Santa Cecilia and San Nicolas Mines) of El Cubo.8. El Compas Mineral Resource and Mineral Reserve cut-off grades are based on a 3.46 g/t gold equivalent. Metallurgical recoveries were 70.0% silver and 82.5% gold for El Compas9. Mineral Resource cut-off grades for Terronera was 150 g/t silver equivalent and the Mineral Reserve cut-off grades for Terronera and La Luz Deposits were 165 g/t and 222 g/t silver
equivalent respectively. Metallurgical recoveries were 84.6% silver and 80.4% gold for Terronera10. Mineral Resource cut-off grades are based on a 150 g/t silver equivalent for Guadalupe y Calvo11. Mineral Resource cut-off grades at Parral vary: 130 g/t silver equivalent for most veins, 200 g/t silver for Sierra Plata, and US$55/t NSR for Cometa.12. Mining recoveries of 93% were applied for Guanaceví, Bolañitos and El Compas and 95% for Terronera for Mineral Reserve Estimate calculations. Minimum mining widths were 0.8 metres
for Mineral Reserve Estimate calculations.13. Dilution factors for Mineral Reserve Estimate calculations averaged 35% for Guanaceví, 33.66% for Bolañitos and 36.2% for El Compas and 11% for Terronera. Dilution factors are calculated
based on internal stope dilution calculations and external dilution factors of 24% for cut and fill mining and 40% for long hole mining at Guanaceví and Bolañitos14. Silver equivalent grades and ounces are based on a 80:1 silver:gold ratio and calculated including only silver and gold.15. Probable Mineral Reserves for Terronera includes the Terronera and La Luz Deposits.16. Inferred Mineral Resources for Terronera includes the Terronera, La Luz and Real Alto Area.17. Indicated and Inferred Mineral Resources for "Parral (new)" includes the Colorada, Palmilla, San Patricio, and Sierra Plata areas.18. The La Colorada structure (Parral) does not contain gold on an economic scale.19. Price assumptions for Guanaceví, Bolañitos, El Compas and El Cubo are US$16.34/oz for silver, US$1,279/oz for gold, US$0.82/lb for lead and US$0.90/lb for zinc.20. Price assumptions for Terronera are US$17.50/oz for silver, US$1,275/oz for gold.21. Price assumptions for Parral are US$15/oz for silver, US$1,275/oz for gold.22. Figures in tables are rounded to reflect estimate precision; small differences generated by rounding are not material to the estimates.23. Effective November 31, 2019, Endeavour Silver announced suspension of operations at the El Cubo Mine, while Management evaluates other alternatives including final closure. 2018
Reserve subtotals and totals include El Cubo for comparative purposes.24. See AIF for potential risks that can materially affect the development of the mineral resources or exploitation of reserves.
Godfrey Walton, M.Sc., P.Geo., President and COO of Endeavour, is the Qualified Person who reviewed and approved this technical information contained in these Mineral Reserve and Resource Estimates. A Quality Control sampling program of reference standards, blanks and duplicates has been instituted to monitor th e integrity of all assay results. All samples are split at the local field office and shipped to ALS-Chemex Labs, where they are dried, crushed, split and 50 gram pulp samples are prepared for analysis. Gold and silver are determined by fire assay with an atomic absorption (AA) finish.
The Mineral Reserve Estimate for Terronera in the technical report titled “Updated Technical Report for the Terronera Project, Jalisco State, Mexico” effective February 12, 2019 and signed April 30, 2019 were undertaken by Independent Qualified Persons Eugene Puritch, P.Eng., FEC, CET, Yungang Wu, P.Geo., David Burga, P.Geo., D. Gregory Robinson, P.Eng., Peter J Smith P. Eng, Eugenio Iasillo P.E., Humberto Preciado P.E., and Benjamin Peacock, P. Eng.
The Parral Mineral Resources disclosed have been estimated by Mr. Jose Texidor Carlsson, P.Geo., an employee of Roscoe Postle Associates (RPA) and independent of Endeavour. By virtue of his education and relevant experience, Mr. Texidor Carlsson is a “Qualified Person” for the purpose of National Instrument 43 -101. The Mineral Resources have been classified in accordance with CIM Definition Standards for Mineral Resources and Mineral Reserves (May, 2014). Mr. Texidor Carlsson, P.Geo. has read and approved the contents as it pertains to the disclosed Parral Mineral Resource estimates.

41
Terronera Assumptions for 2018 PFS
Financial Notes
Corporate Tax Rate 30.0% After allowable deductions
Mining Special Duty Tax Rate 7.5% Applied to EBITDA, deductible against corporate tax
Government Royalty 0.5% NSR on gross revenues after smelter charges
Discount Rate 5.0% For NPV calculation
PESOS:USD FX Rate 20 Approximate average Q2 2018
Silver Price, US$/oz $17.00 Constant, LOM
Gold Price, US$/oz $1,275 Constant, LOM
Depreciation 11yr Units of production
Property NSR Royalty 2.0% Payable to original property owner
Technical Notes
Silver Recovery to Con % 84.6% Forecast from detailed metallurgical tests
Gold Recovery to Con % 80.4% Forecast from detailed metallurgical tests
Con Silver Payable % 97.5% Based on current contracts
Con Silver Payable % 97.5% Based on current contracts
Mining Cost per Tonne $46.08 Applicable to stoped ore
Processing Cost per Tonne $19.58 On-site processing, including treatment and refining charges
G&A Costs per Tonne $8.40 On-site G&A

42
Management Team
Dan Dickson, CA, CFO
Luis Castro, Ing., Geo.VP Exploration
Miguel Ordaz,Ing., Geo.
Mexico Projects Director, Legal Representative
Bradford Cooke, M.Sc., P.Geo.
CEO
Godfrey Walton, M.Sc., P.Geo.
President and COO
Dale Mah, B.Sc.,
P.Geo.VP Corporate Development
Galina Meleger,
Director Investor Relations
Christine West,
CPA, CGAVP Controller
Lorena Aguilar, BS,
Director Human ResourcesErnesto Lima ,
Ing., MBADirector, Project
Development
Nicholas Shakesby, BBA
VP Operations

43
Board of Directors
Bradford Cooke, M.Sc., P.Geo.
Margaret Beck, B.Sc.
Mario Szotlender, B.IR
Ricardo Campoy, B.Sc.
Comp. Committee Chair
Geoff Handley, B.Sc.Chair; Corp. Gov. &
Nom. Committee Chair
Rex McLennan, B.Sc., MBA, ICD.D
Audit Committee Chair
Ken Pickering, P. Eng.
HSES Committee Chair
44
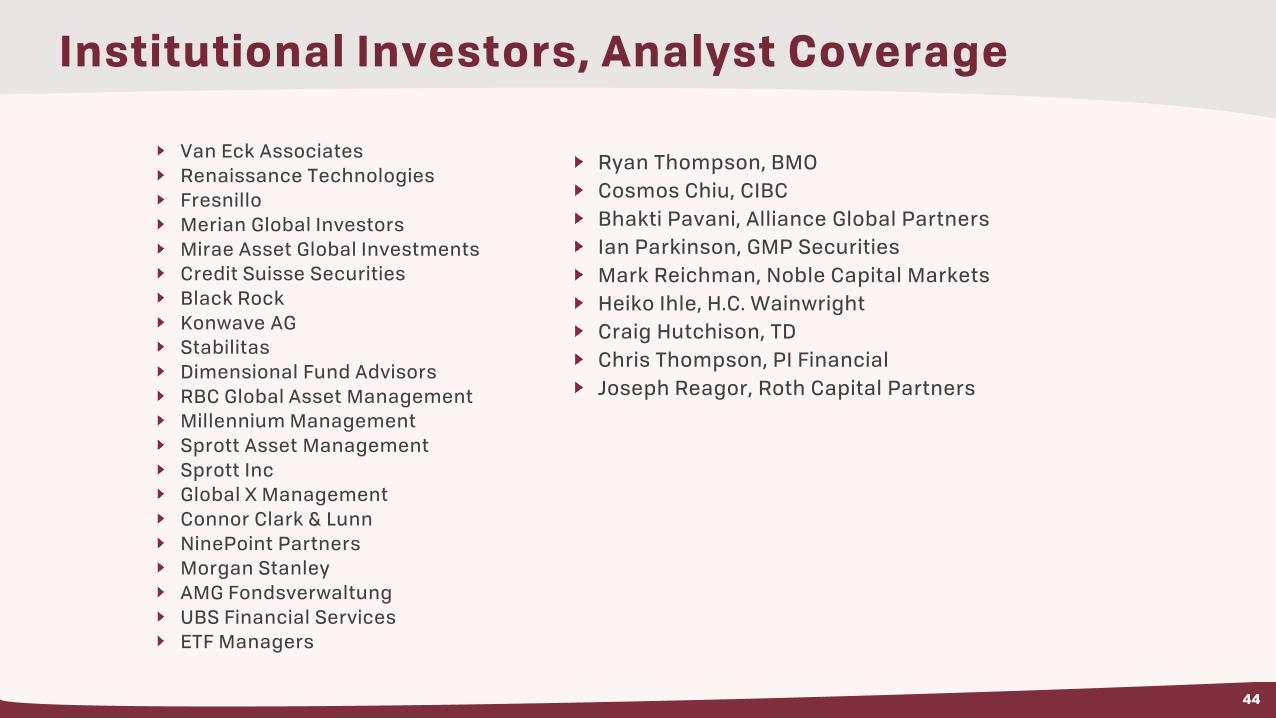
Van Eck Associates
Renaissance Technologies
Fresnillo
Merian Global Investors
Mirae Asset Global Investments
Credit Suisse Securities
Black Rock
Konwave AG
Stabilitas
Dimensional Fund Advisors
RBC Global Asset Management
Millennium Management
Sprott Asset Management
Sprott Inc
Global X Management
Connor Clark & Lunn
NinePoint Partners
Morgan Stanley
AMG Fondsverwaltung
UBS Financial Services
ETF Managers
Institutional Investors, Analyst Coverage
Ryan Thompson, BMO
Cosmos Chiu, CIBC
Bhakti Pavani, Alliance Global Partners
Ian Parkinson, GMP Securities
Mark Reichman, Noble Capital Markets
Heiko Ihle, H.C. Wainwright
Craig Hutchison, TD
Chris Thompson, PI Financial
Joseph Reagor, Roth Capital Partners
45
46
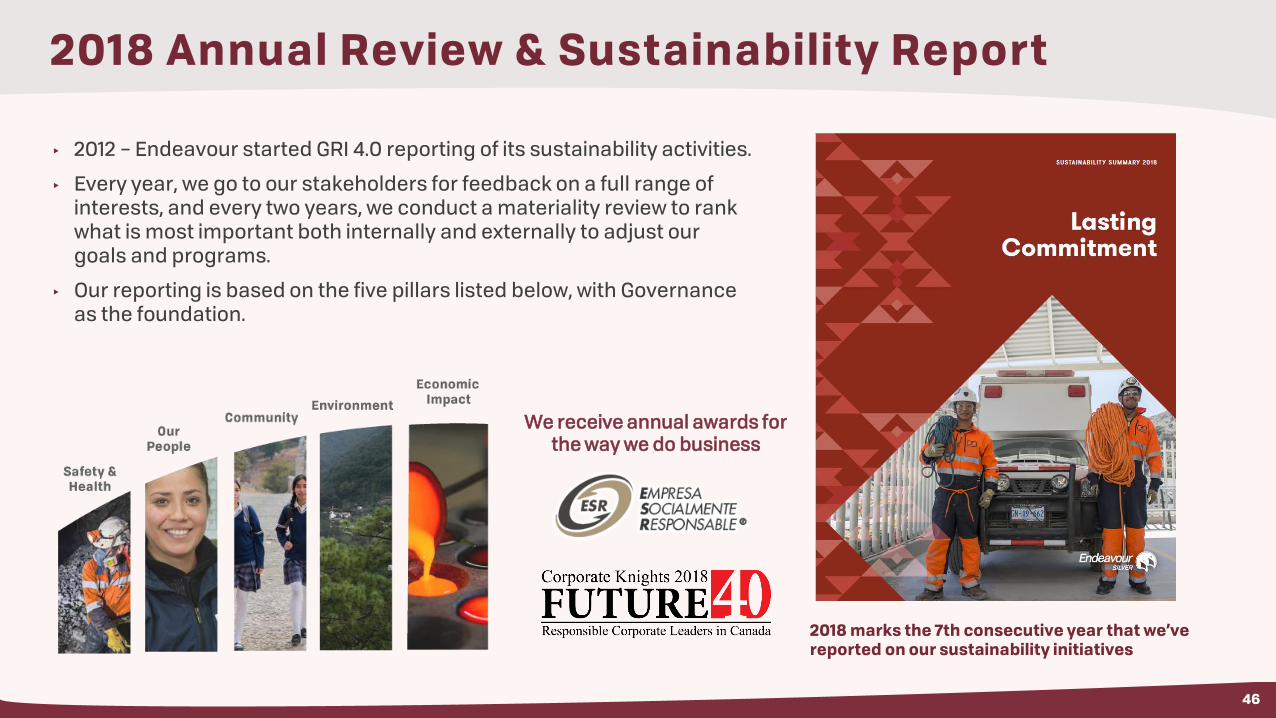
▸ 2012 – Endeavour started GRI 4.0 reporting of its sustainability activities.
▸ Every year, we go to our stakeholders for feedback on a full range of interests, and every two years, we conduct a materiality review to rank what is most important both internally and externally to adjust our goals and programs.
▸ Our reporting is based on the five pillars listed below, with Governance as the foundation.
2018 Annual Review & Sustainability Report
2018 marks the 7th consecutive year that we’ve reported on our sustainability initiatives
We receive annual awards for the way we do business
47
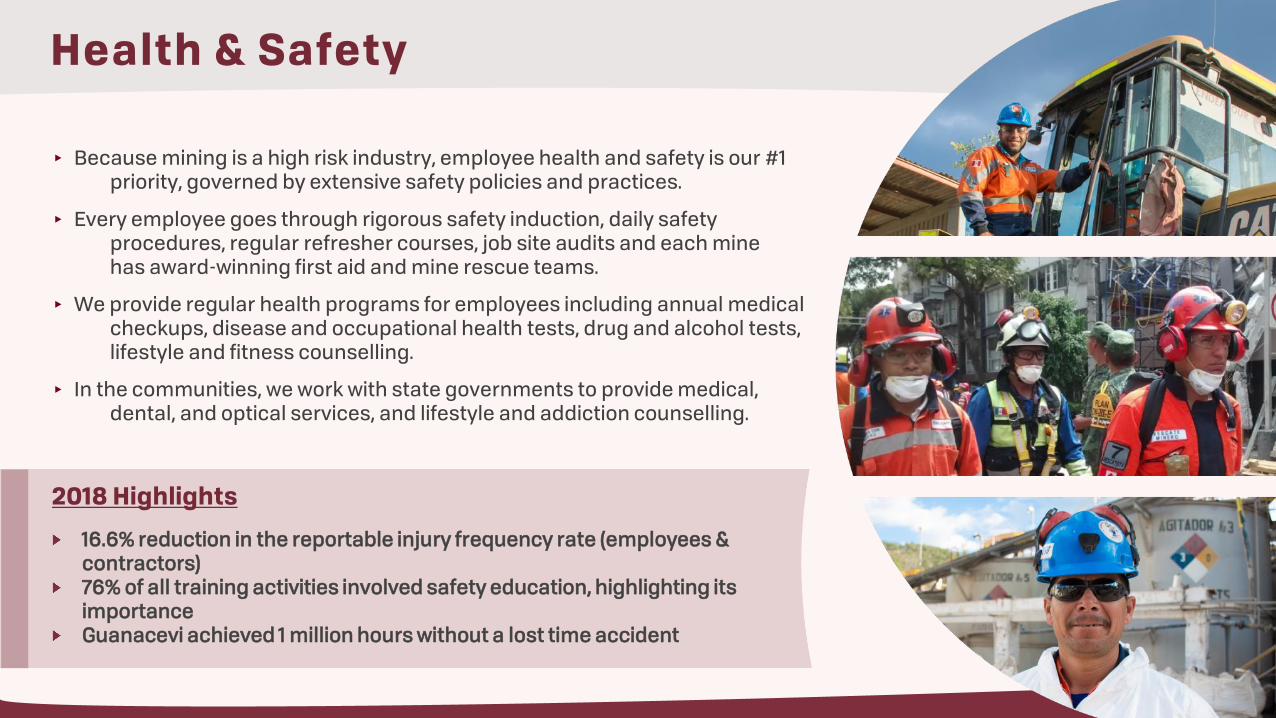
▸ Because mining is a high risk industry, employee health and safety is our #1 priority, governed by extensive safety policies and practices.
▸ Every employee goes through rigorous safety induction, daily safety procedures, regular refresher courses, job site audits and each mine has award-winning first aid and mine rescue teams.
▸ We provide regular health programs for employees including annual medical checkups, disease and occupational health tests, drug and alcohol tests, lifestyle and fitness counselling.
▸ In the communities, we work with state governments to provide medical, dental, and optical services, and lifestyle and addiction counselling.
Health & Safety
2018 Highlights
16.6% reduction in the reportable injury frequency rate (employees & contractors)76% of all training activities involved safety education, highlighting its importance Guanacevi achieved 1 million hours without a lost time accident

48
▸ Education and training are important to improving the quality of life in the local communities.
▸ Endeavour sponsors university scholarships in Mexico and Canada, high school scholarships in Mexico, and online courses to complete high school diplomas, technical and self-employment courses.
▸ We run mining skills training programs to teach young people, women and the unemployed career skills like operating dump trucks, scoop trams, jumbo drills followed by job offers.
Our People
2018 Highlights
Provided an average of 54 hours of training for each employeeAchieved 8% reduction in employee turnover Supported a record 60 employees in obtaining skills certification awarded by the Ministry of LaborReceived the “Merit in Mining Education” award in Mexico for our employee learning and development efforts

49
▸ We support our local communities in many ways to improve the quality of life, resolve issues and build sustainable capacity.
▸ Endeavour donates our time, funds, food and gifts for cultural and religious celebrations; we sponsor sports teams, kids camps and field trips, and an annual 10 km race to promote fitness; we help upgrade local buildings, schools, churches and roads.
▸ We also train locals and provide equipment for cottage businesses such as pastry making, confections, jewelry, tourist gifts, clothing and mops.
▸ Our goal is to complete at least one legacy project at each community, from fresh water supply, to proper sewage disposal, to new community buildings, to tourist mine.
Community
2018 Highlights
Invested $400,000 in corporate charitable in Mexico and CanadaSupported 77 Mexican students with scholarships Hosted job skills workshops for 109 community members to expand their capacitiesCarried out a social impact assessment for the Terronera Project, to better understand and address community needs

50
▸ Protection of our natural environment is paramount for Endeavour.
▸ We monitor dumps, tailings, water and energy consumption and emissions, waste recycling and disposal & biodiversity.
▸ In particular, tailings management has been a hot topic recently but from day one we have made major investments to upgrade our tailings facilities to North American standards – dry stack at Guanaceví, a unique drainage system at Bolañitos, and new facilities at El Cubo.
▸ We typically plant tens of thousands of trees and cacti each year, reclaiming areas disturbed by Endeavour but also historic areas.
Environment
2018 Highlights
Achieved 12% reduction in hazardous waste across all sitesPlanted 53,000 trees in reforestation projects to reclaim groundRecycled over 93% of water used Invested $1.7 million in environmental protection programs across all sites

51
▸ Investments are essential to generate economic impact and profits are essential to fulfil community and sustainability objectives.
▸ Our most obvious positive economic impacts have been from investing in:
▸ acquisition of properties, mines and plants ▸ exploration to discover new orebodies in historic mining districts▸ development to open new mines and refurbish and expand old
mines, plants and facilities▸ operations to create 1,700 employee jobs and 1,200 contractor
jobs▸ direct economic impact on 8,100 people (3:1 ratio)▸ indirect economic impact on another 8,100 people such as
suppliers and services; 99% in Mexico
Economic Value
2018 Highlights
99% of our workforce is Mexican, spent $42 million in employee wages and benefits. Spent $181.1 million on goods and services, 97% of total procurement is from within Mexico. Paid $10.2 million in taxes