droplet flocculation and coalescence in dilute oil-in
TRANSCRIPT

5Droplet Flocculation andCoalescence in DiluteOil-in-Water Emulsions
Øystein Sæther and Johan SjoblomNorwegian University of Science and Technology, Trondheim, Norway
Stanislav S. DukhinNew Jersey Institute of Technology, Newark, New Jersey, U.S.A.
I. INTRODUCTION
Emulsions are common in the food industry. They are presented to theconsumer as finished products or they appear during the preparation offood from the mixing and treatment of suitable constituents. The emulsionhas a certain texture which influences the perception of the food aestheticsand which to the consumer is the most important feature. At the basis liesemulsion stability, which represents the scientific point of view. The texturecan be interpreted as a function of the physicochemical properties of theemulsion—the dispersed concentration, droplet size and interactions, bulkand interfacial rheology, and so on—properties that also control dropletaggregation (flocculation or coagulation) and rupture of the membranebetween aggregated droplets (coalescence).
Emulsions are thermodynamically unstable (unlike microemulsions),and stability is achieved kinetically. The notion of stability includes bothretardation of sedimentation or creaming (driven by the density differencebetween droplets and the surrounding fluid, and greatly dependent onthe viscosity of the last and droplet size), reduction of coagulation [irre-versible droplet aggregation, countered (e.g., by repulsion arising from the
Copyright 2004 by Marcel Dekker, Inc. All Rights Reserved.

adsorbed layer)], and stabilization of the interface in order to retardcoalescence (linked to the viscoelastic properties of the interfacial layer).
Food emulsions include milk, butter, ice cream, mayonnaise,margarine, and many more. Milk, cream, and mayonnaise are oil-in-wateremulsions, stabilized from coalescence by interfacially adsorbed surfactantsindigenous to the raw material.
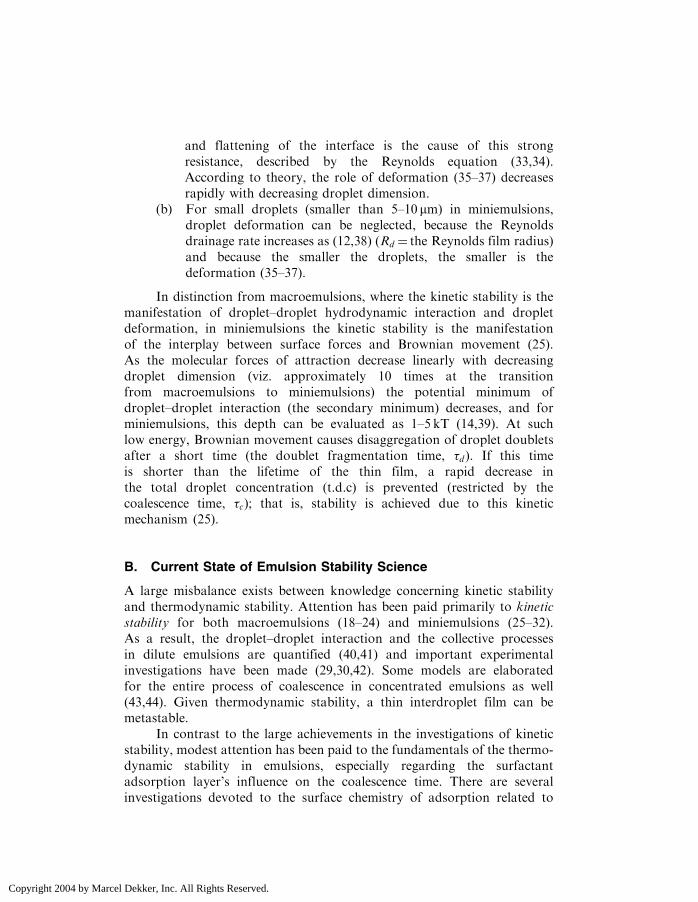
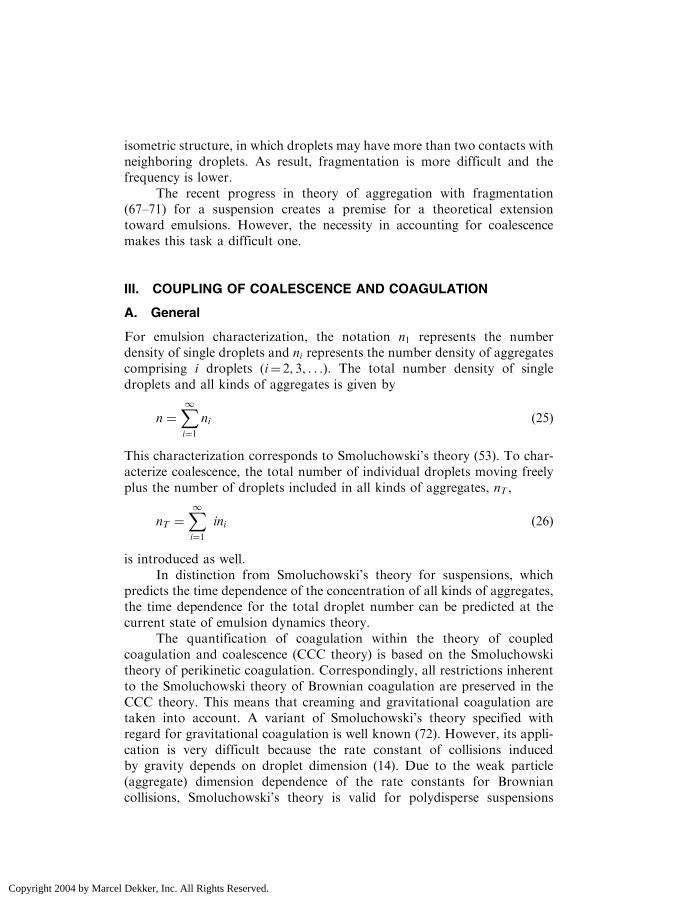
The next example illustrates how the processes of destabilization arecountered. The homogenization of milk induces droplet breakup by passingthe liquid through a high-pressure-drop mixing valve, resulting in dropletsizes down to about 250 nm (1). A droplet size of 250 nm is so small that thecreaming rate is extremely low and Brownian diffusion will dominate drop-let motion. The newly formed interface is stabilized by adsorbed casein (andrelatives) and phospholipids, expectedly forming a complex film of mono-mers, aggregates, and even particles (2). Adsorbed species at the interfacegive rise to a repulsive contribution to the droplet–droplet interaction poten-tial (electrostatic and/or steric), reducing the collision efficiency (the ratio ofcollisions leading to coalescence to the total number of collisions). The filmformed by the species can, to some system-specific degree, resist ruptureupon collision, as elastic film properties will restore the film as collisionenergy is dissipated. These separate factors work to decrease the rate ofseparation and give milk a certain lifetime. Figure 1 shows snapshots of
Figure 1 Image series (from frame 1 at the upper left to frame 12 at the lower right)
showing oil droplets in milk interacting, and the formation and fragmentation of a
short-lived doublet. The milk (‘‘1.5% fat’’) was centrifuged to reduce the droplet
numerical concentration in the prepared sample. The largest droplet is about 3 mm,
the time between images 0.5 s.
Copyright 2004 by Marcel Dekker, Inc. All Rights Reserved.

droplets interacting in a milk sample in which the majority of droplets havebeen centrifuged off to isolate droplet pair effects.
In the following, the authors attempt to describe the interplayof mechanisms that influence the breakdown of kinetically stabilizedemulsions, namely droplet aggregation (flocculation or coagulation),droplet aggregate fragmentation and coalescence.
A. Kinetic and Thermodynamic Stability inMacroemulsions and Miniemulsions
The majority of emulsion technology problems relate to the stabilizationand destabilization of emulsions (3–9). Despite the existence of many fun-damental studies related to the stability of emulsions, the extreme vari-ability and complexity of the systems involved in any specific applicationoften pushes the industry to achieve technologically applicable resultswithout developing a detailed understanding of the fundamental processes.Nevertheless, because in most cases, technological success requires thedesign of emulsions with a very delicate equilibrium between stabilityand instability, a better understanding of the mechanisms of stabiliza-tion and destabilization might lead to significant breakthroughs intechnology.
Notwithstanding their thermodynamic instability, many emulsions arekinetically stable and do not change appreciably for a prolonged period.These systems exist in the metastable state (10–17). The fundamentals ofemulsion stability (destabilization) comprise emulsion surface chemistry andphysicochemical kinetics.
In contrast to the large success in industrial applications of emulsionsurface chemistry, the potential of physicochemical kinetics as basis foremulsion dynamics modeling is almost never used in emulsion technology.This situation has started to change during the last decade. Althoughthe coupling of the subprocesses in emulsion dynamics modeling (EDM)continues to represent a large problem yet to be solved, models areelaborated for (a) macroemulsions (12,18–24) and (b) miniemulsions(25–32) for long and short lifetimes of thin emulsion films.
(a) For large droplets (larger than 10–30 mm) in macroemulsions, therate of thinning of the emulsion film formed between twoapproaching droplets is rather low and, correspondingly, theentire lifetime of an emulsion need not be short, even withoutsurfactant stabilization of the film. For this case, the notion ofkinetic stability is introduced (12,18–21) to denote the resistanceof the film against rupture during thinning. Droplet deformation
Copyright 2004 by Marcel Dekker, Inc. All Rights Reserved.
and flattening of the interface is the cause of this strongresistance, described by the Reynolds equation (33,34).According to theory, the role of deformation (35–37) decreasesrapidly with decreasing droplet dimension.
(b) For small droplets (smaller than 5–10 mm) in miniemulsions,droplet deformation can be neglected, because the Reynoldsdrainage rate increases as (12,38) (Rd ¼ the Reynolds film radius)and because the smaller the droplets, the smaller is thedeformation (35–37).
In distinction from macroemulsions, where the kinetic stability is themanifestation of droplet–droplet hydrodynamic interaction and dropletdeformation, in miniemulsions the kinetic stability is the manifestationof the interplay between surface forces and Brownian movement (25).As the molecular forces of attraction decrease linearly with decreasingdroplet dimension (viz. approximately 10 times at the transitionfrom macroemulsions to miniemulsions) the potential minimum ofdroplet–droplet interaction (the secondary minimum) decreases, and forminiemulsions, this depth can be evaluated as 1–5 kT (14,39). At suchlow energy, Brownian movement causes disaggregation of droplet doubletsafter a short time (the doublet fragmentation time, �d ). If this timeis shorter than the lifetime of the thin film, a rapid decrease inthe total droplet concentration (t.d.c) is prevented (restricted by thecoalescence time, �c); that is, stability is achieved due to this kineticmechanism (25).
B. Current State of Emulsion Stability Science
A large misbalance exists between knowledge concerning kinetic stabilityand thermodynamic stability. Attention has been paid primarily to kineticstability for both macroemulsions (18–24) and miniemulsions (25–32).As a result, the droplet–droplet interaction and the collective processesin dilute emulsions are quantified (40,41) and important experimentalinvestigations have been made (29,30,42). Some models are elaboratedfor the entire process of coalescence in concentrated emulsions as well(43,44). Given thermodynamic stability, a thin interdroplet film can bemetastable.
In contrast to the large achievements in the investigations of kineticstability, modest attention has been paid to the fundamentals of the thermo-dynamic stability in emulsions, especially regarding the surfactantadsorption layer’s influence on the coalescence time. There are severalinvestigations devoted to the surface chemistry of adsorption related to
Copyright 2004 by Marcel Dekker, Inc. All Rights Reserved.
emulsification and demulsification. However, the link among the chemicalnature of an adsorption layer, its structure and the coalescence time is notyet quantified.
A premise for such quantification is the theory of a foam bilayerlifetime (45). The main notions of this theory is similar to theory ofDerjaguin et al. (46,47). However, the theory (45) is specified for amphiphilefoam films, it is elaborated in detail, and it is proven by experiment withwater-soluble amphiphiles, such as sodium dodecyl sulfate (48). Becauseas the dependence of the rupture of the emulsion film on surfactantconcentration is similar to that of a foam film, modification of the theorywith respect to emulsions may be possible. Although this modification isdesirable, the specification of theory for a given surfactant will not be trivial,because the parameters in the equation for the lifetime (47) are unknownand their determination is not trivial. As the theory (45,49) is proposedfor amphiphiles and a wider class of chemical compounds can stabilizeemulsions, the film rupture mechanism (46) is not universal regardingemulsions.
In contrast to the quantification of kinetic stability, the empiricalapproach continues to predominate regarding thermodynamic stability.Meanwhile, thermodynamic stability provides greater opportunity forlong-term stabilization of emulsions than does kinetic stability. Thismeans that the experimental characterization of thermodynamic stability(i.e., the measurement of coalescence time) is of major importance.
C. Specificity of Emulsion Characterization
Generalized emulsion characterization (i.e., measurement of droplet sizedistribution, electrokinetic potential, Hamaker constant, etc.) is notalways sufficient. Thermodynamic stability with respect to bilayer rupturecannot be quantified with such a characterization procedure alone.Consequently, measurement of the coalescence time �c is of major impor-tance for an evaluation of emulsion stability; it is an important and specificparameter of emulsion characterization.
The current state of miniemulsion characterization neglects the impor-tance of �c measurement. The practice of �c measurement is practically absentwith the exception of only a few articles considered in this chapter.Meanwhile, many articles devoted to issues more or less related to emulsionstability do not discuss �c measurement. One reason for this scientifically andtechnologically unfavorable situation in which emulsions are incompletelycharacterized might originate from a lack of devices enabling �cmeasurement.
Copyright 2004 by Marcel Dekker, Inc. All Rights Reserved.
D. Scope of the Chapter
This chapter is focused on kinetic stability in miniemulsions, with emphasison the coupled destabilizing subprocesses. In general, there are threecoupled subprocesses which will influence the rate of destabilization andphase separation in emulsions. These are aggregation, coalescence, andfloc fragmentation. Often, irreversible aggregation is called coagulationand the term flocculation is used for reversible aggregation (45,50).Ostwald ripening (51,52) coupled (26) with aggregation and fragmentationis a separate topic and will be not considered here.
A simplified theory is available for the coupling of coalescenceand flocculation in emulsions void of larger flocs. This theory is consid-ered in Section II and will assist in the consideration of the more compli-cated theory of coupling of coalescence and coagulation (Sec. III). Theexperimental investigations are described in parallel. Section IV is devotedto the theory of doublet fragmentation time and its measurement, asthis characterizes an emulsion regarding fragmentation and because itsmeasurement is an important source of information about surface forcesand the pair interaction potential. The discrimination between conditionsfor coupling of coalescence with coagulation or with flocculation isconsidered in Section V. The quantification of kinetic stability createsnew opportunities for the long-term prediction of miniemulsion stability,for stability optimization, and for characterization with standardizationof �c and �d measurements. This forms the base for emulsion dynamicsmodeling (Sec. VI).
II. COUPLING OF COALESCENCE AND FLOCCULATION
A. Singlet–Doublet Quasiequilibrium
Each process among the three processes under consideration is charac-terized by a characteristic time, namely �Sm, �d , and �c. TheSmoluchowski time (53), �Sm, gives the average time between droplet colli-sions. If the time between two collisions is shorter than �d , a doublet cantransform into a triplet before it spontaneously disrupts. In the oppositecase—at
�Sm >> �d ð1Þ
—the probability for a doublet to transform into a triplet is very lowbecause the disruption of the doublet occurs much earlier than its collision
Copyright 2004 by Marcel Dekker, Inc. All Rights Reserved.

with a singlet. The rate of multiplet formation is very low for
Rev ¼�d�Sm
<< 1 ð2Þ
where we introduce the notation Rev for small values of the ratiocorresponding to the reversibility of aggregation and a singlet–doubletquasiequilibrium.
The kinetic equation for reversible flocculation in a dilute mono-disperse oil-in-water (o/w) emulsion when neglecting coalescence is (54–56)
dn2
dt¼
n21�Sm
�n2
�dð3Þ
where n1 and n2 are the dimensionless concentrations of doublets andsinglets and n1 ¼ N1=N10 and n2 ¼ N2=N10, where N1 and N2 are theconcentrations of singlets and doublets, respectively, and N10 is the initialconcentration, and
�Sm ¼4kT
3�N10
� ��1
¼ Kf N10
� ��1ð4Þ
where k is the Boltzmann constant, T is the absolute temperature, and� is the viscosity of water. For aqueous dispersions at 25�C, Kf ¼
ð4kT=3�Þ ¼ 6� 10�18 m3=s. The singlet concentration decreases with timedue to doublet formation, whereas the doublet concentration increases. As aresult, the rates of aggregation and floc fragmentation will approach eachother. Correspondingly, the change in the number of doublets dn2=dt ¼ 0.Thus, a dynamic singlet–doublet equilibrium (s.d.e.) is established:
n2eq ¼�d�Sm
n2eq ð5Þ
At condition (2), it follows from Eq. (5) that
n1eq ffi 1, N1eq ¼ N10 ð6Þ
N2 ¼ ðRevÞN10 or n2 << 1 ð7Þ
Thus, at small values of Rev, the s.d.e. is established with only small devia-tions in the singlet equilibrium concentration from the initial concentration[Eq. (6)]. The doublet concentration is very low compared to the singletconcentration, and the multiplet concentration is very low compared tothe doublet concentration. The last statement follows from a comparison
Copyright 2004 by Marcel Dekker, Inc. All Rights Reserved.

of the production rates of doublets and triplets. The doublets appear due tosinglet–singlet collisions, whereas the triplets appear due to singlet–doubletcollisions. The latter rate is lower due to the low doublet concentration.The ratio of the number of singlet–doublet collisions to the number ofsinglet–singlet collisions is proportional to Rev.
B. Kinetic Equation for Coupling of Flocculationand Intradoublet Coalescence inMonodisperse Emulsions
Both the rate of doublet disaggregation and the rate of intradoubletcoalescence are proportional to the momentary doublet concentration.This leads (25,31) to a generalization of Eq. (3):
dn2
dt¼
n21�Sm
� n21
�dþ
1
�c
� �
ð8Þ
There are two unknown functions in Eq. (8), so an additional equation isneeded. This equation describes the decrease in the droplet concentrationcaused by coalescence:
d
dtn1 þ 2n2ð Þ ¼ �
n2
�cð9Þ
The initial conditions are
n2jt¼0¼ 0 ð10Þ
dn2
dt
����t¼0
¼n10
�Smð11Þ
Condition (11) follows from Eqs. (8) and (9). The solution of the set ofEqs. (8) and (9) taking into account boundary conditions (10) and (11) isa superposition of two exponents (25,31). In the case
�c >> �d ð12Þ
the solution simplifies (25,31) to
n2ðtÞ ¼�d�Sm
exp �2�dt
�Sm�c
� �
� exp �t
�d
� �� �
ð13Þ
Copyright 2004 by Marcel Dekker, Inc. All Rights Reserved.
Equation (13), as compared to Eqs. (5) and (6), corresponds to the s.d.e. ifthe expression in the second set of brackets equals 1. In the time interval
�d < t < � ð14Þ
where
� ¼ �c�Sm2�d
ð15Þ
the first term in the second set of brackets approximately equals 1, whereasthe second term decreases from 1 to a very small value. Thus, the s.d.e. isestablished during the time �d and preserves during the longer time interval[according to Eq. (14)].
For times longer than �, there is no reason to apply Eq. (13) becausethe condition to linearize Eq. (8) is no longer valid with the concentrationdecrease. At the beginning of the process, the doublet concentrationincreases, whereas later in the process, coalescence predominates andthe doublet concentration decreases. Thus, the function in Eq. (13) has amaximum (25,31).
C. Coalescence in a Singlet–Doublet Systemat Quasiequilibrium
After a time tmax, a slow decrease in the doublet concentration takesplace simultaneously with the more rapid processes of aggregation anddisaggregation. Naturally, an exact singlet–doublet equilibrium is notvalid due to the continuous decrease in the doublet concentration.However, the slower the coalescence, the smaller is the deviation fromthe momentary dynamic equilibrium with respect to the aggregation–disaggregation processes.
It is reasonable to neglect the deviation from the momentarydoublet–singlet equilibrium with the condition
dn2
dt<<
n2
�dð16Þ
Indeed, for this condition, the derivative in Eq. (3) can be omitted, whichcorresponds to s.d.e. characterized by Eq. (5).
It turns out (25,29–31) that the deviation from s.d.e. is negligiblebecause the condition (15) is valid [i.e., for conditions (2) and (12)]. Forthese conditions, the fragmentation of flocs influences the coalescencekinetics, which can be represented as a three-stage process, as illustratedin Fig. 2. During a rather short time �d , the approach to s.d.e. takes place
Copyright 2004 by Marcel Dekker, Inc. All Rights Reserved.

[i.e., a rather rapid increase in the doublet concentration (stage 1)]. Duringthe next time interval, �d < t < tmax, the same process continues. However,the rate of doublet formation declines due to coalescence (stage 2). The exactequilibrium between the doublet formation and their disappearance due tocoalescence takes place at the time tmax when the doublet concentrationreaches its maximum value, n2ðtmaxÞ. During the third stage, whent > tmax, the rate of doublet fragmentation is lower than the rate offormation, because of the coalescence within doublets. This causes a slowmonotonous decrease in the concentration. Taking into account the s.d.e.[Eqs. (5) and (7)], Eq. (9) can be expressed as
dn1
dt¼ �
�d�Sm�c
n21 ð17Þ
The result of the integration of Eq. (17) can be simplified to
n1ðtÞ ¼n1ðtmaxÞ
1þ n1ðtmaxÞt=2�ffi 1þ
t
2�
� �1
ð18Þ
Figure 2 Three stages in the coupling of aggregation, fragmentation, and
coalescence at the condition �d << �Sm << �c. Initially, the doublet concentration
n2 is very low and the rates of doublet fragmentation and of coalescence are
correspondingly low compared to the rate of aggregation (first stage, no coupling).
Due to increasing n2, the fragmentation rate increases and equals the aggregation
rate at tmax (exact singlet–doublet equilibrium). The growth in n2 stops at tmax
(second stage, coupling of aggregation and fragmentation). Intradoublet coalescence
causes a slight deviation from exact s.d.e. to arise at t > tmax, and the singlet
concentration n1 and the doublet concentration decrease due to intradoublet
coalescence (third stage, coupling of aggregation, fragmentation, and coalescence).
n1 and n2 are dimensionless, (n1 ¼ N1=N10, n2 ¼ N2=N10, N10 is the initial singlet
concentration). (From Ref. 25.)
Copyright 2004 by Marcel Dekker, Inc. All Rights Reserved.
with a small deviation in n1ðtmaxÞ from 1. Differing from the preceding stageswhen the decrease in the droplet concentration caused by coalescence issmall, a large decrease is now possible during the third stage. Thus, this isthe most important stage of the coalescence kinetics.
D. Reduced Role of Fragmentation with Decreasing �c
With decreasing �c, condition (12) is violated and new qualitative features ofthe destabilization process not discussed in Refs. 29–31 arise. As the ratio�c=�d diminishes and
�c < �d ð19Þ
the s.d.e. is violated because a larger part of the doublets disappears due tocoalescence. Correspondingly, the smaller the ratio �c=�d , the smaller is thefragmentation rate in comparison with the aggregation rate (i.e., the largerthe deviation from s.d.e.). In the extreme case
�c << �d ð20Þ
the fragmentation role in s.d.e. can be neglected. This means that almostany act of aggregation is accompanied by coalescence after a short doubletlifetime. Neglecting this time in comparison with �Sm in agreement withcondition (1), one concludes that any act of aggregation is accompaniedby the disappearance of one singlet:
dn1
dt¼ �
n21�Sm
ð21Þ
This leads to a decrease in the singlet concentration described by anequation similar to the Smoluchovski equation for rapid coagulation:
n1ðtÞ ¼ 1þt
�Sm
� ��1
ð22Þ
The Smoluchowski equation describing the singlet time evolution does notcoincide with Eq. (22). The peculiarity of Eq. (22) is that it describes thekinetics of coupled aggregation and coalescence with a negligible fragmen-tation rate. Due to fragmentation, doublet transformation into multiplets isalmost impossible at condition (1).
Copyright 2004 by Marcel Dekker, Inc. All Rights Reserved.

The coupling of aggregation, fragmentation, and coalescence in themore general case described by condition (19) leads to
n1ðtÞ ¼n1ðtmaxÞ
1þ n1ðtmaxÞt=2�gffi 1þ
t
2�g
� ��1
t > �d þ �cð Þ ð23Þ
with a small deviation of n1ðtmaxÞ from 1 and
�g ¼�Smð�d þ �cÞ
2�dð24Þ
At conditions (1) and (12) �g � � and Eq. (23) transforms into Eq. (18). Atconditions (1) and (20) �g � �Sm and Eq. (23) transforms into Eq. (22).Equation (24) demonstrates the reduction of the role of fragmentationwith decreasing �c. It is seen that at the transition from condition (19) tocondition (20), �d cancels in Eq. (21) (i.e., the fragmentation rolediminishes).
E. Experimental
1. Video-Enhanced Microscopy (Microslide PreparativeTechnique) for Investigation of Singlet–DoubletEquilibrium and Intradoublet Coalescence (29–31)
Direct observation of doublets in the emulsion bulk is difficult due to doub-lets tending to move away from the focal plane during the time of obser-vation. The microslide preparative technique can, however, be successfullyapplied, providing pseudobulk conditions. A microslide is a plane-parallelglass capillary of rectangular cross section. The bottom and top walls of thecapillary are horizontal, and the gravity-induced formation of a sediment orcream on one of the inner normal surfaces is rapidly completed due to themodest inner diameter of the slide (typically 50–100 mm). If both the volumefraction of droplets in an emulsion and the slide inner diameter are small,the droplet coverage along the inside surface amounts to no more than a fewpercent, and the analysis of results is rather simple. It can be seen throughthe microscope that the droplets which have sedimented (or for the case ofoil droplets, creamed) toward the capillary surface participate in chaoticmotion along the surface. This indicates that a thin layer of water separatingthe surface of the microslide from the droplets is preventing the mainportion of droplets from adhering to the microslide surface—an actionwhich would stop their Brownian motion.
Copyright 2004 by Marcel Dekker, Inc. All Rights Reserved.
During diffusion along the microslide ceiling, the oil dropletscollide. Some collisions lead to the formation of doublets. Direct visualobservation enables evaluation of the doublet fragmentation time, whichvaries in a broad range (27). Another approach to doublet fragmentationtime determination is based on the evaluation of the average concentrationof singlets and doublets and using the above-outlined theory.
The application of the microslide preparative technique combined withvideo microscopy is promising and has enabled the measurement of thecoupling of reversible flocculation and coalescence (29,31). However,some experimental difficulties were encountered. A modest number ofdroplets could sometimes be seen sticking to the glass surface of themicroslide—an effect that corresponded to electrolyte-induced reductionof electrostatic stabilization by adsorbed surfactant. According to theory,increased salt concentration would increase the number of droplets adheringto the surface, reducing the span of electrolyte concentrations that couldbe used.
2. Improving the Experimental Technique with theUse of Low-Density Contrast Emulsions (30)
The sticking of droplets indicates a droplet–wall attraction and the existenceof a secondary potential pit as that for the droplet–droplet attraction in adoublet. The droplet concentration within the pit is proportional to theconcentration on its boundary. The latter decreases with a decrease in thedensity contrast (i.e., the density difference between the droplet and contin-uous phases). The higher the contrast, the greater the gravity promotedadhesion of droplets to the wall. The electrostatic barrier between the poten-tial pit and the wall retards the rate of sticking. The lower the droplet fluxthrough this barrier, the lower is the potential pit occupancy by droplets.Thus, an essential decrease in the rate of sticking is possible with decreasingdensity contrast.
Oil-in-water emulsions were prepared (30) by mixing dichlorodecane(DCD, volume fraction 1%) into a 5� 10�5 M sodium dodecyl sulfate(SDS) solution with a Silverson homogenizer. The oil phase was a 70:1mixture of DCD, which is characterized by an extremely low-density con-trast to water, and decane.
The droplet distribution along and across the slide was uniform (30).This indicates that there was no gravity-induced rolling either. One slideamong four was examined for 2 weeks without any sticking being observed(30). The absence of the rolling and sticking phenomena allowed acquisitionof rather accurate data concerning the time dependence of the droplet sizedistribution.
Copyright 2004 by Marcel Dekker, Inc. All Rights Reserved.
3. Measurement of Coalescence Time andDoublet Fragmentation Time
The doublet fragmentation time was measured by direct real-time on-screenobservation of the doublets and by analysis of series of images acquired with1–3-min time intervals (47). The formation and disruption/coalescence of adoublet could thus be determined.
The general form of the concentration dependence agrees with thetheory. At C�3� 10�3 M, both theory and experiment yield times ofabout 1 min; at C¼ 9� 10�3 M, these times exceed 10min. For the calcula-tion of the doublet fragmentation time, the electrokinetic potential wasmeasured (31,48).
In experiments with different droplet concentrations, it wasestablished that the higher the initial droplet concentration, the higher thedoublet concentration. This corresponds to the notion of singlet–doubletequilibrium. However, if the initial droplet concentration exceeds 200–300per observed section of the microslide, multiplets predominate. Both theinitial droplet concentration and size affect the rate of decrease in thedroplet concentration. The larger the droplets, the smaller the concentrationsufficient for the measurement of the rate of decrease in the dropletconcentration. This agrees with the theory of doublet fragmentation time,which increases with droplet dimension. Correspondingly, the probabilityfor coalescence increases. These first series of experiments (29,31) wereaccomplished using toluene-in-water emulsions without the addition ofa surfactant and decane-in-water emulsions stabilized by SDS. The obtaineddata concerning the influence of the electrolyte concentration and surfacecharge density were in agreement with the existing notions about themechanism of coalescence. With increasing SDS concentration and corre-spondingly increasing surface potential, the rate of decrease in the dropletconcentration is reduced.
Two methods were used for the measurement of the coalescence time(30,31). Measurement of the time dependence for the concentrations ofsinglets and doublets and a comparison with Eq. (9) enables an evaluationof the coalescence time. Further, information about the time dependence forsinglets and the doublet fragmentation time may be used as well. Theseresults in combination with Eqs. (18) and (15) determine the coalescencetime. The good agreement between results obtained by these very differentmethods indicates that the exactness of the theory and experiments isnot low.
In recent years, several research groups have improved significantly thetheoretical understanding of coalescence of droplet or bubbles. Thenew results (55–59) together with results of earlier investigations (60–64)
Copyright 2004 by Marcel Dekker, Inc. All Rights Reserved.
have clarified the role of double-layer interaction in the elementary act ofcoalescence.
Derjaguin-Landau-Verwey-Overbeek (DVLO) theory was applied(65,66) for the description of ‘‘spontaneous’’ and ‘‘forced’’ thinning of theliquid film separating the droplets. These experimental results and DLVOtheory were used (65) for the interpretation of the reported visual study ofcoalescence of oil droplets 70–140 mm in diameter in water over a wide pHinterval. A comparison based on DLVO theory and these experimental dataled the authors to conclude (65) that ‘‘if the total interaction energy is closeto zero or has a positive slope in the critical thickness range, i.e. between 30and 50 nm, the oil drops should be expected to coalesce.’’ In the secondarticle (66), in which both ionic strength and pH effects were studied, coa-lescence was observed at constant pH values of 5.7 and 10.9, when theDebye thickness was less than 5 nm. The main trend in our experimentsand in Refs. 65 and 66 are in accordance, because it was difficult to establishthe decrease in total droplet concentration (t.d.c.) at NaCl concentrationslower than 5� 10�3 M (i.e., DL thicknesses larger than 5 nm). An almostquantitative coincidence in the double-layer influence on coalescence estab-lished in our work for micrometer-sized droplets and in Refs. 65 and 66 foralmost 100 times larger droplets is important for the general knowledgeabout coalescence.
F. Perspective for Generalization of the Theory forCoupling of Coalescence and Flocculation
The proposed theory for coupling of coalescence and flocculation at s.d.e.enables the proposal of some important applications (Sec. VI). At the sametime, generalized theory is necessary, because the role of multiplets increasesafter some time or with a higher initial concentration. At least twoapproaches to this difficult task are seen.
According to our video-microscopic observations, there are largepeculiarities in the structure and behavior of multiplets arising at conditionsclose to s.d.e. These peculiarities can be interpreted as the manifestation ofquasiequilibrium, comprising singlets, doublets, and multiplets. Similar todoublets, the lifetime of triplets, tetraplets, and so forth can be short dueto fragmentation and coalescence. This can be valid for multiplets with an‘‘open’’ structure, in distinction from another structure which can be called‘‘closed.’’ In ‘‘open’’ multiplets, any droplet has no more than one or twocontacts with other droplets, which corresponds to a linear chainlike struc-ture. This causes easy fragmentation, especially for the outermostdroplets within a chain. The ‘‘closed’’ aggregates have a denser and more
Copyright 2004 by Marcel Dekker, Inc. All Rights Reserved.
isometric structure, in which droplets may have more than two contacts withneighboring droplets. As result, fragmentation is more difficult and thefrequency is lower.
The recent progress in theory of aggregation with fragmentation(67–71) for a suspension creates a premise for a theoretical extensiontoward emulsions. However, the necessity in accounting for coalescencemakes this task a difficult one.
III. COUPLING OF COALESCENCE AND COAGULATION
A. General
For emulsion characterization, the notation n1 represents the numberdensity of single droplets and ni represents the number density of aggregatescomprising i droplets (i¼ 2, 3, . . .). The total number density of singledroplets and all kinds of aggregates is given by
n ¼X1
i¼1
ni ð25Þ
This characterization corresponds to Smoluchowski’s theory (53). To char-acterize coalescence, the total number of individual droplets moving freelyplus the number of droplets included in all kinds of aggregates, nT ,
nT ¼X1
i¼1
ini ð26Þ
is introduced as well.In distinction from Smoluchowski’s theory for suspensions, which
predicts the time dependence of the concentration of all kinds of aggregates,the time dependence for the total droplet number can be predicted at thecurrent state of emulsion dynamics theory.
The quantification of coagulation within the theory of coupledcoagulation and coalescence (CCC theory) is based on the Smoluchowskitheory of perikinetic coagulation. Correspondingly, all restrictions inherentto the Smoluchowski theory of Brownian coagulation are preserved in theCCC theory. This means that creaming and gravitational coagulation aretaken into account. A variant of Smoluchowski’s theory specified withregard for gravitational coagulation is well known (72). However, its appli-cation is very difficult because the rate constant of collisions inducedby gravity depends on droplet dimension (14). Due to the weak particle(aggregate) dimension dependence of the rate constants for Browniancollisions, Smoluchowski’s theory is valid for polydisperse suspensions
Copyright 2004 by Marcel Dekker, Inc. All Rights Reserved.
and remains valid as polydisperse aggregates arise. Unfortunately, thisadvantage of the Smoluchowski theory can almost disappear when com-bined with the coalescence theory, because the coalescence rate coefficientsare sensitive to droplet dimension. Thus, droplet and aggregate poly-dispersity does not strongly decrease the exactness of the description ofcoagulation in the CCC theory, whereas the exactness of the coalescencedescription can be severely reduced.
Although the coalescence influence on the Brownian coagulation ratecoefficient can be neglected, its influence on the final equations ofthe Smoluchovski theory remains. It can be shown that Smoluchowski’sequation for the total number of particles,
nðtÞ ¼ 1þt
�Sm
� ��1
ð27Þ
remains valid, whereas, in parallel, the equations for the singlet and aggre-gate concentrations cannot be used to account for coalescence. Regardingcoupled coagulation and coalescence, the Smoluchowski equation for n1ðtÞis not exact because it does not take into account the singlet formationcaused by coalescence within doublets.
The coalescence within an aggregate consisting of i droplet is accom-panied by the aggregate transforming into an aggregate consisting of i � 1droplets. Because coalescence changes the aggregate type only, the totalquantity of aggregates and singlets does not change. This means that theSmoluchowski function nðtÞ does not change during coalescence, becauseSmoluchowski defined the total quantity of particles as consisting ofaggregates and singlets.
B. Average Models
Average models do not assign rate constants to each possibility for coales-cence within the aggregates; they deal with certain averaged characteristicsof the process. The models in Refs. 40 and 73 introduce the average numberof drops in an aggregate m, because the number of films in an aggregate nfand m are interconnected. For a linear aggregate,
nf ¼ m� 1 ð28Þ
As the coalescence rate for one film is characterized by ��1c , the decrease in
the average droplet quantity in an aggregate is nf times larger. This is takeninto account in the model of van den Tempel for simultaneous dropletquantity increase due to aggregation and decrease due to coalescence.
Copyright 2004 by Marcel Dekker, Inc. All Rights Reserved.
Van den Tempel formulates the equation which describes the timedependence for the average number of droplets in an aggregate as
dm
dt¼ KfN10 � �
�1c ðm� 1Þ ð29Þ
where the first term is derived using Smoluchowski’s theory.The total number of droplets nT is the sum of single droplets n1ðtÞ and
the droplets within aggregates,
nT ðtÞ ¼ n1ðtÞ þ nvðtÞmðtÞ ð30Þ
where nv is the aggregate number. The latter can be expressed as
nvðtÞ ¼ nðtÞ � n1ðtÞ ð31Þ
Both terms are expressed by Smoluchowski’s theory. The integration ofEq. (29) and the substitution of the result into Eq. (30) yields the timedependence nT ðtÞ according to the van den Tempel model.
1. The Model of Borwankar et al.
In Ref. 40, the van den Tempel model is criticized and improved throughthe elimination of Eq. (29). The authors point out that the ‘‘incoming’’aggregates which cause the increase in m have themselves undergone coales-cence. This is not taken into account in the first term on the right-hand sideof Eq. (29). Instead of taking a balance on each aggregate (as van denTempel did), Borwankar et al. took an overall balance on all particlesin the emulsion. For linear aggregates, the total number of films in theemulsion is given by
nf nv ¼ ðm� 1Þnv ð32Þ
Thus, instead of Eq. (29), the differential equation for nT follows:
�dnT
dt¼ ��1
c ðm� 1Þnv ð33Þ
where m can be expressed through nT using Eq. (30). The advantage ofthis equation in comparison with Eq. (29) is obvious. However, there isa common disadvantage of both theories, caused by the use of theSmoluchowski equation for n1ðtÞ. Coalescence does not change the total
Copyright 2004 by Marcel Dekker, Inc. All Rights Reserved.
particle concentration nðtÞ, but it changes n1ðtÞ and, correspondingly, nvðtÞ,according to Eq. (31).
The application of Smoluchowski’s theory in the quantification of thecoupling of coalescence and coagulation has to be restricted with the use ofthe total particle concentration nðtÞ only. The average models of van denTempel and Borwankar et al. do not meet this demand.
The theory of Danov et al. (41) does not contradict this demand,which makes it more correct than the preceding theories. Among theSmoluchowski results, the function nðtÞ only is present in the final equationsof this theory. Although the exactness of averaged models is reduced due tothe violation of the restriction in the use of the Smoluchowski theory, resultsfor some limiting cases are not erroneous.
2. Limiting Cases of Fast and Slow Coalescence
Two limiting cases can be distinguished:
The rate of coalescence is much greater than that of flocculation(rapid coalescence):
��1c >> ��1
Sm ð34Þ
The rate of flocculation is much greater than that of coalescence(slow coalescence):
��1c << ��1
Sm ð35Þ
According to general regularities of physicochemical kinetics, theslowest process is rate controlling. If the coagulation step is rate controlling[viz. when condition (34) is valid], then the coalescence is rapid and thegeneral equation of the theory in Ref. 40 is reduced to second order kinetics[i.e., to Smoluchowski’s equation (27)]. Flocs composed of three, four, andmore droplets cannot be formed because of rapid coalescence within thefloc. In this case, the structure of the flocs becomes irrelevant.
At first glance, the coagulation rate has not manifested itself in theentire destabilization process in the case of slow coalescence [condition (35)].At any given moment, the decrease in the total droplet concentration isproportional to the momentary total droplet concentration (first-orderkinetics), which causes an exponential decrease with time:
n ¼ exp �t
�c
� �
ð36Þ
Copyright 2004 by Marcel Dekker, Inc. All Rights Reserved.

However, this equation cannot be valid for an initial short period of time,because at the initial moment, there are no aggregates and their quantitycontinues to be low during a short time. This means that the coagulation islimiting during an initial time at any slow coalescence rate. This exampleillustrates the necessity of a more exact approach than that which usesaverage models. This was done by Danov et al. (41).
C. The DIGB Model for SimultaneousCoagulation and Coalescence
This kinetic model proposed by Danov, Ivanov, Gurkov, and Borwankar iscalled the DIGB model here for the sake of brevity. Danov et al. (41)generalized the Smoluchowski scheme (Fig. 3a) to account for dropletcoalescence within flocs. Any aggregate (floc) composed of k particlescan partially coalesce to become an aggregate of i particles (1 < i < k),with the rate constant being Kk,i
c (Fig. 3b). This aggregate is further involvedin the flocculation scheme, which makes the flocculation and coalescenceprocesses interdependent. Therefore, the system exhibiting both flocculationand coalescence is described by a combination of schemes 1 and 2:
dnk
dt¼Xk�1
i¼1
Ki,k�if nink�i � 2
X1
i¼1
Kk,if nkni þ
X1
i¼kþ1
Ki,kc ni �
Xk�1
i¼1
Kk,ic nk
ð37Þ
Figure 3 (a) Model of flocculation according to the Smoluchowski scheme (41).
(b) Coalescence in an aggregate of k particles to become an aggregate of i particles,
with a rate constant Kk,ic , 1 < i < k (41).
Copyright 2004 by Marcel Dekker, Inc. All Rights Reserved.
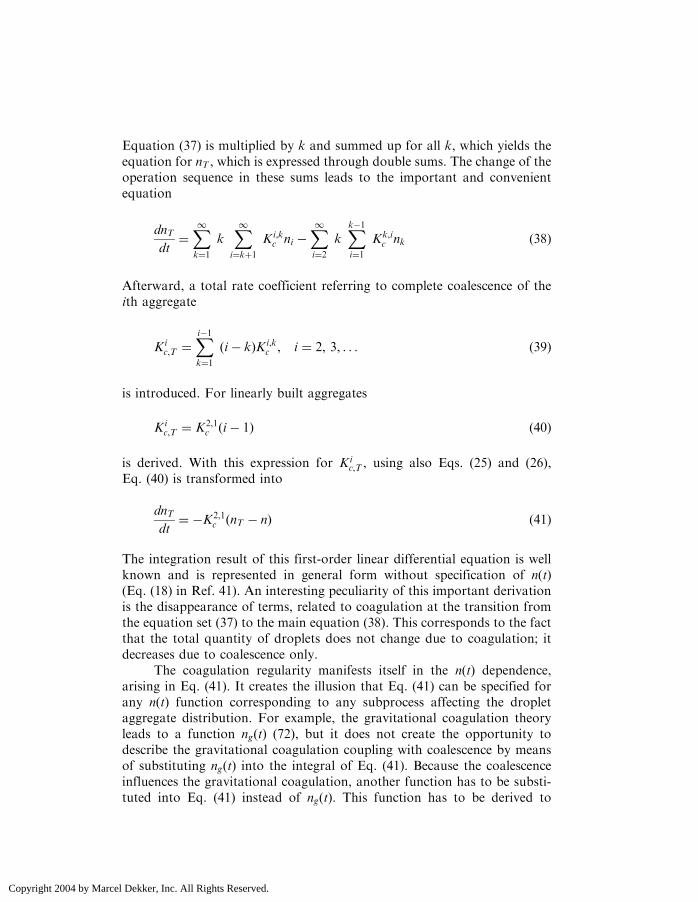
Equation (37) is multiplied by k and summed up for all k, which yields theequation for nT , which is expressed through double sums. The change of theoperation sequence in these sums leads to the important and convenientequation
dnT
dt¼X1
k¼1
kX1
i¼kþ1
Ki,kc ni �
X1
i¼2
kXk�1
i¼1
Kk,ic nk ð38Þ
Afterward, a total rate coefficient referring to complete coalescence of theith aggregate
Kic,T ¼
Xi�1
k¼1
ði � kÞKi,kc , i ¼ 2, 3, . . . ð39Þ
is introduced. For linearly built aggregates
Kic,T ¼ K2,1
c ði � 1Þ ð40Þ
is derived. With this expression for Kic,T , using also Eqs. (25) and (26),
Eq. (40) is transformed into
dnT
dt¼ �K2,1
c ðnT � nÞ ð41Þ
The integration result of this first-order linear differential equation is wellknown and is represented in general form without specification of nðtÞ(Eq. (18) in Ref. 41). An interesting peculiarity of this important derivationis the disappearance of terms, related to coagulation at the transition fromthe equation set (37) to the main equation (38). This corresponds to the factthat the total quantity of droplets does not change due to coagulation; itdecreases due to coalescence only.
The coagulation regularity manifests itself in the nðtÞ dependence,arising in Eq. (41). It creates the illusion that Eq. (41) can be specified forany nðtÞ function corresponding to any subprocess affecting the dropletaggregate distribution. For example, the gravitational coagulation theoryleads to a function ngðtÞ (72), but it does not create the opportunity todescribe the gravitational coagulation coupling with coalescence by meansof substituting ngðtÞ into the integral of Eq. (41). Because the coalescenceinfluences the gravitational coagulation, another function has to be substi-tuted into Eq. (41) instead of ngðtÞ. This function has to be derived to
Copyright 2004 by Marcel Dekker, Inc. All Rights Reserved.

account for the coupling of coalescence and coagulation. One concludes thatEq. (41) cannot be used, because its derivation assumes that the coupling ofgravitational coagulation (or another process) and coalescence is alreadyquantified.
A useful exception is Brownian coagulation and its modeling bySmoluchowski with the coagulation rate coefficients, of which sensitivityto aggregate structure and coalescence is low. The substitution of function(27) into the integral of Eq. (41) yields the equation, characterizing thecoupling of coalescence and Brownian coagulation (41).
In fractal theory (74), it is established that diffusion-limitedaggregates and diffusion-limited cluster–cluster aggregates are built uplinearly. This can simplify the application of the DIGB model. However,the diffusivity of fractal aggregates (75) cannot be described by simpleequations and the Smoluchowski theory. This will cause coagulation ratecoefficient dependence on aggregate structure, decreasing the exactnessof Eq. (41) when applied to fractal aggregates. However, there is noalternative to the DIGB model, which can be used as a crude but usefulapproximation in this case as well. In the absence of an alternative, theDIGB model can be recommended for evaluation in the case of gravita-tional coagulation.
Danov et al. compares their theory with the predictions of averagedmodels for identical conditions. It turns out that if coalescence ismuch faster than flocculation, the predictions of the different models coin-cide. Conversely, for slow coalescence, the results of the averaged modelsdeviate considerably from the exact solution. These two results of the com-parison are in agreement with the qualitative considerations in Section III.B.
Data for the relative change in the total number of droplets as afunction of time are presented in Fig. 4 (41). Figures 4a–4c refer toKFN10 ¼ 0:1 s�1 and the coalescence constant K2,1
c varies between 0:1 s�1
(Fig. 4a) and 0:001 s�1 (Fig. 4c). It is seen that the agreement between theDanov et al. and Borwankar et al. models is better the faster the coalescence,as was explained qualitatively earlier. The van den Tempel curves deviateconsiderably from the other two solutions.
For very long times and irrespective of the values of the kinetic param-eters, the model of Borwankar et al. (40) is close to the numerical solution.This is probably because the longer the time, the smaller the concentrationof single droplets. In this extreme case, the error caused in the averagemodels due to the influence of coalescence on the singlet concentration[not taken into account in the equation for nðtÞ] is negligible.
The shortcomings of the averaged models (40,73) and the advantagesof the DIGB model are demonstrated in Ref. 41. However, the range ofapplicability of this model is restricted by many simplifications and the
Copyright 2004 by Marcel Dekker, Inc. All Rights Reserved.
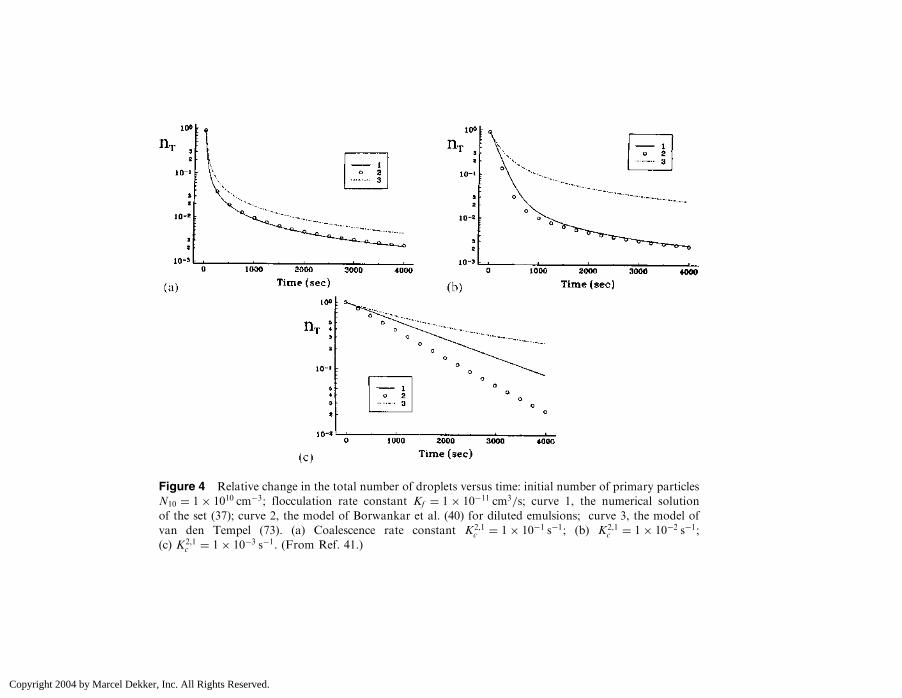
Figure 4 Relative change in the total number of droplets versus time: initial number of primary particles
N10 ¼ 1� 1010 cm�3; flocculation rate constant Kf ¼ 1� 10�11 cm3=s; curve 1, the numerical solution
of the set (37); curve 2, the model of Borwankar et al. (40) for diluted emulsions; curve 3, the model of
van den Tempel (73). (a) Coalescence rate constant K2,1c ¼ 1� 10�1 s�1; (b) K2,1
c ¼ 1� 10�2 s�1;
(c) K2,1c ¼ 1� 10�3 s�1. (From Ref. 41.)
Copyright 2004 by Marcel Dekker, Inc. All Rights Reserved.
neglect of other subprocesses (see Sec. III.A). An efficient analyticalapproach was made possible due to the neglect of the coalescence ratecoefficient’s dependence on the dimensions of both interacting droplets.
The model of Borwankar et al. was examined experimentally inRef. 42. The emulsions were oil-in-water, with soybean oil as the dispersedphase, volume fraction 30%, and number concentration 107–1010 cm�3. Theemulsions were gently stirred to prevent creaming during the aging study.A sample was placed on a glass slide, all aggregates were broken up, and thesize of the individual droplets was measured. A rather good agreement withthe theory was established. However, the fitting of the experimental datawas accomplished using two model parameters, namely the coalescence andcoagulation rate coefficients. For the last coefficient, the optimal values(different for two emulsions) were obtained, strongly exceeding theSmoluchowski theory value (Sec. II.A). An interpretation is that ortho-kinetic and perikinetic coagulation took place simultaneously due to stir-ring. Several experiments are known (discussed in Ref. 56) whichdemonstrate better agreement with the value for the coagulation constantpredicted in the Smoluchowski theory.
IV. DOUBLET FRAGMENTATION TIME
A. Theory of Doublet Fragmentation Time
A doublet fragmentation was described by Chandrasekhar (76) by thediffusion of its droplets from the potential minimum, characterizing theirattraction. The time scale for this process takes the form (77)
�d ¼6��a3
�Texp
�Umin
�T
� �
ð42Þ
where Umin is the depth of the potential minimum.To derive the formula for the average lifetime of doublets, Muller (78)
considered the equilibrium in a system of doublets and singlets; that is, thenumber of doublets decomposing and forming are equal. Both processes aredescribed by the standard diffusion flux J of particles in the force field of theparticle that is regarded as central.
Each doublet is represented as an immovable particle with the secondsinglet ‘‘spread’’ around the central one over a spherical layer, whichcorresponds to the region of the potential well. The diffusion flux J of‘‘escaping’’ particles is described by equations used in the Fuchs theoryof slow coagulation. The first boundary condition corresponds to theassumption that the escaping particles do not interact with other singlets.
Copyright 2004 by Marcel Dekker, Inc. All Rights Reserved.

The second condition reflects the fact that the potential well contains exactlyone particle.
At a small separation between the droplets in a doublet, thedroplet diffusivity reduces because of the increasing hydrodynamicresistance during the droplet approach. A convenient interpolation formulawas used (78) for the description of the influence of hydrodynamic interac-tion on the mutual diffusivity. The difference between the more exactMuller equation and Eq. (42) is caused mainly because of this hydrodynamicinteraction.
B. Doublet Fragmentation Time of Uncharged Droplets
In this subsection, we consider a doublet consisting of droplets with anonionic adsorption layer. The closest separation between two dropletssurfaces h0 exceeds the double thickness of the adsorption layer (2ha). Asa crude approximation, h0 can be identified with 2ha. In the case of smallsurfactant molecules, 2ha� 2 nm.
In this case, the potential well has a sharp and deep minimum. Thismeans that the vicinity of this minimum determines the value of the integral(42). For examination of this assumption, Eq. (42) was calculated numeri-cally and according to the approximate equation (28)
Z�
�
’ðtÞ exp½ f ðtÞ� dt ¼2�
f 00ðtmÞ
� �1=2’ðtmÞ exp½ f ðtmÞ� ð43Þ
where tm corresponds to the potential well minimum.The difference in results was small and enabled application of Eq. (43)
for the calculation and substitution of the asymptotic expression (13,16):
UðhÞ ¼ �A
12
a
hð44Þ
which is valid at small distances to the surface. The result of calculationsaccording to Eqs. (43) and (44) (the Hamaker constant A ¼ 1:3� 10�20 J )are shown in Fig. 5. The chosen value of the Hamaker constant is consistentwith those reported elsewhere (79,80). In addition to the value ofA ¼ 1:3� 10�20 J, we mention other values of the Hamaker constantemployed elsewhere. For example, in food emulsions (80), the Hamaker
Copyright 2004 by Marcel Dekker, Inc. All Rights Reserved.

constant lies within the range of 3�10�21 J to 10�20 J. The results of calcula-tions for smaller Hamaker constants are also presented in Fig. 5.
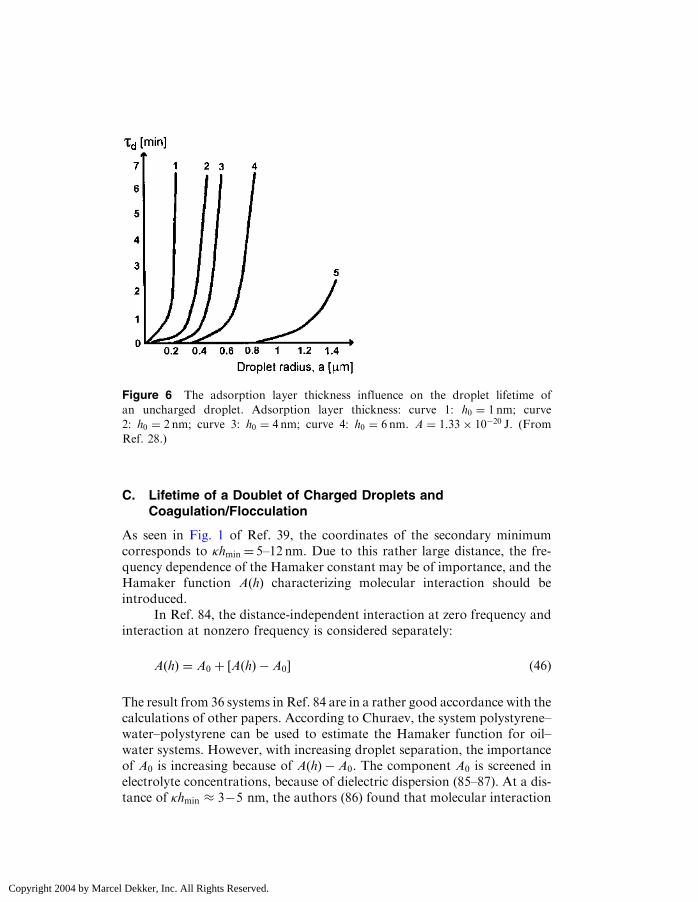
The influence of the adsorption layer thickness on doublet lifetime isshown in Fig. 6 for one value of the Hamaker constant. There is highspecificity in the thickness of a polymer adsorption layer. �-Caseinadsorbed onto polystyrene latex causes an increase in the radius of theparticle of 10–15 nm (81). A layer of �-lactoglobulin appears to be in theorder of 1–2 nm thick, as compared to 10 nm for the caseins (82).
When adsorbed layers of hydrophilic nature are present, the repulsivehydration forces must be taken into account. At low ionic strengths, therepulsion follows the expected exponential form for double-layer interaction:
UðhÞ ¼ Kse�ðh=hsÞ ð45Þ
In Ref. 83, the authors emphasize that the surface charge in food emulsions islow, electrolyte concentrations are high, and, hence, the DL is not responsiblefor emulsion stability. The stabilization can be caused by the hydrationforces. However, the flocculation to the secondary minimum remains.Meanwhile, this conclusion must be specified with account for dropletdimension.
Figure 5 Dependence of doublet lifetime on droplet dimension at different values
of the Hamaker constant A: curve 1: A ¼ A1 ¼ 1:33� 10�20 J; curve 2: A ¼ 0:5A1;
curve 3: A ¼ 0:35A1; curve 4: A ¼ 0:25A1; curve 5: A ¼ 0:1A1. The shortest
interdroplet distance is 2 nm. (From Ref. 28.)
Copyright 2004 by Marcel Dekker, Inc. All Rights Reserved.
C. Lifetime of a Doublet of Charged Droplets andCoagulation/Flocculation
As seen in Fig. 1 of Ref. 39, the coordinates of the secondary minimumcorresponds to �hmin ¼ 5–12 nm. Due to this rather large distance, the fre-quency dependence of the Hamaker constant may be of importance, and theHamaker function AðhÞ characterizing molecular interaction should beintroduced.
In Ref. 84, the distance-independent interaction at zero frequency andinteraction at nonzero frequency is considered separately:
AðhÞ ¼ A0 þ ½AðhÞ � A0� ð46Þ
The result from 36 systems in Ref. 84 are in a rather good accordance with thecalculations of other papers. According to Churaev, the system polystyrene–water–polystyrene can be used to estimate the Hamaker function for oil–water systems. However, with increasing droplet separation, the importanceof A0 is increasing because of AðhÞ � A0. The component A0 is screened inelectrolyte concentrations, because of dielectric dispersion (85–87). At a dis-tance of �hmin � 3�5 nm, the authors (86) found that molecular interaction
Figure 6 The adsorption layer thickness influence on the droplet lifetime of
an uncharged droplet. Adsorption layer thickness: curve 1: h0 ¼ 1 nm; curve
2: h0 ¼ 2 nm; curve 3: h0 ¼ 4 nm; curve 4: h0 ¼ 6 nm. A ¼ 1:33� 10�20 J. (From
Ref. 28.)
Copyright 2004 by Marcel Dekker, Inc. All Rights Reserved.

disappeared at zero frequency. Experimental evidence concerning this state-ment is discussed in Ref. 16. When evaluating the secondary minimum coa-gulation, A0 can be omitted, as illustrated in Ref. 87.
For illustration of the influence of electrolyte concentration,Stern potential, and particle dimension, some calculations of doublet lifetimeare made and their results are presented in Fig. 7. The potential welldepth increases and, in parallel, doublet lifetime increases with increasingparticle dimension and electrolyte concentration and decreasing surfacepotential.
V. COALESCENCE COUPLED WITH EITHERCOAGULATION OR FLOCCULATION INDILUTE EMULSIONS
Limited attention is paid to the role of fragmentation in emulsion science.A comparison of the prediction of coalescence with and without accountingfor fragmentation (Secs. II and III) enables evaluation of the significance offragmentation. This comparison will be done in Section V.A.
The theories of Refs. 41 and 25 have different areas of applicability(not specified in the articles) and are complementary. Naturally, this
Figure 7 The dependence of doublet lifetime on the Stern potential for different
electrolyte concentrations and droplet dimensions. Numbers near the curves
correspond to droplet radius. Curves 1–4 without account for retardation of
molecular forces of attraction, � ¼ e =kT . Curves 10– 40 with account for
retardation. (From Ref. 28.)
Copyright 2004 by Marcel Dekker, Inc. All Rights Reserved.
complicates the choice between these theories with respect to concrete con-ditions of the experiments. An approximate evaluation of the aforesaidareas of applicability is given in Section V.B.
A. Fragmentation of Primary Flocs in Emulsions and theSubsequent Reduction of Coalescence
Floc fragmentation reduces the quantity of interdroplet films and, corre-spondingly, retards the entire coalescence process. This retardation can becharacterized by the comparison of Eq. (18) with the theory of Ref. 41,which neglects fragmentation. The longer the time, the greater the retarda-tion, which enables the use of the simpler theory of Ref. 40 for comparison.The results for longer times coincide with the predictions of the more exacttheory of Ref. 41.
The results of the theory of Ref. 41 concerning slow coalescence areillustrated by curve 1 in Fig. 3c in Ref. 41, which is redrawn here as Fig. 8a.It can be seen that for a low value of the coalescence rate constant,the semilogarithmic plot is linear, indicating that the process follows acoalescence rate-controlled mechanism according to Eq. (36). Differingfrom the simple exponential time dependence in Eq. (36), second-orderkinetics dominate at rapid doublet fragmentation, even if coalescence isvery slow. The physical reason becomes clear when considering howEq. (18) is derived. As seen from Eq. (17), the rate of decline in the dropletconcentration is proportional to the doublet concentration. The latter isproportional to the square of the singlet concentration at s.d.e., whichcauses second-order kinetics. Thus, at slow coalescence, the disaggregationdrastically changes the kinetic law of the coalescence (i.e., from the expo-nential law to second-order kinetics).
In the second stage, coagulation becomes the rate-controlling processbecause of the decrease in the collision rate accompanying the decrease inthe droplet concentration. Thus, at sufficiently long times, second-orderkinetics characterizes both reversible and irreversible aggregation.Nevertheless, a large difference exists even when identical functions describethe time dependence, as the characteristic times are expressed throughdifferent equations for irreversible and reversible aggregation. In the firstcase, it is the Smoluchowski time; in the second case, it is the combination ofthree characteristic times [i.e., Eq. (18)].
Let us now try to quantitatively characterize the reduction in coales-cence caused by doublet disintegration. For this purpose, the calculationsare performed according to Eq. (6) at �Sm ¼ 10 s and �c ¼ 103 s (Fig. 8a),102 s (Fig. 8b), and 10 s (Fig. 8c). For all figures, the same value of the ratio
Copyright 2004 by Marcel Dekker, Inc. All Rights Reserved.
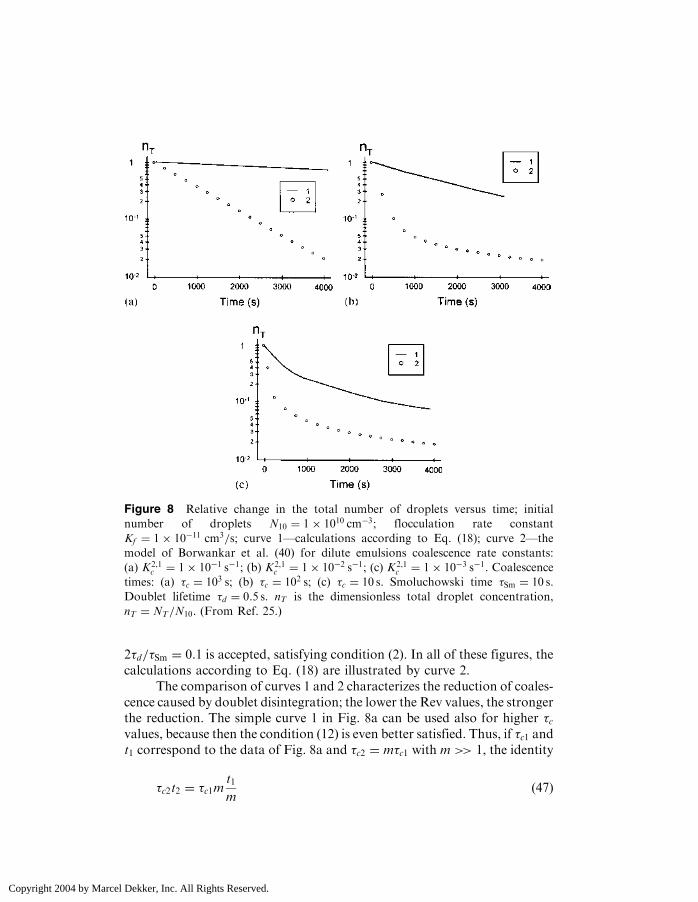
2�d=�Sm ¼ 0:1 is accepted, satisfying condition (2). In all of these figures, thecalculations according to Eq. (18) are illustrated by curve 2.
The comparison of curves 1 and 2 characterizes the reduction of coales-cence caused by doublet disintegration; the lower the Rev values, the strongerthe reduction. The simple curve 1 in Fig. 8a can be used also for higher �cvalues, because then the condition (12) is even better satisfied. Thus, if �c1 andt1 correspond to the data of Fig. 8a and �c2 ¼ m�c1 with m >> 1, the identity
�c2t2 ¼ �c1mt1
mð47Þ
Figure 8 Relative change in the total number of droplets versus time; initial
number of droplets N10 ¼ 1� 1010 cm�3; flocculation rate constant
Kf ¼ 1� 10�11 cm3=s; curve 1—calculations according to Eq. (18); curve 2—the
model of Borwankar et al. (40) for dilute emulsions coalescence rate constants:
(a) K2,1c ¼ 1� 10�1 s�1; (b) K2,1
c ¼ 1� 10�2 s�1; (c) K2,1c ¼ 1� 10�3 s�1. Coalescence
times: (a) �c ¼ 103 s; (b) �c ¼ 102 s; (c) �c ¼ 10 s. Smoluchowski time �Sm ¼ 10 s.
Doublet lifetime �d ¼ 0:5 s. nT is the dimensionless total droplet concentration,
nT ¼ NT=N10. (From Ref. 25.)
Copyright 2004 by Marcel Dekker, Inc. All Rights Reserved.

is useful. This means that
nT
n0�c1m,
t1
m
� ¼
nT
n0ð�c1, t1Þ ð48Þ
[i.e., t2 ¼ t1=m, where the right-hand side of Eq. (48) is drawn in Fig. 9]. Forexample, Fig. 9 is similar to Fig. 8a and can be used for 100 fold longer time,shown on the abscissa axis. The increase in �c enables us to increase �Smwithout violating condition (35) and with Eq. (36) valid. Thus, �Sm ¼ 1000 sor lower can be chosen as condition for Fig. 9. Curve 2, characterizing therate of doublet disintegration, preserves as well if the value of 2�d=�Sm ¼ 0:1remains; now, it corresponds to a higher �d value of 5 s.
B. Domains of Coalescence Coupled Either withCoagulation or with Flocculation
The condition
Rev >> 1 ð49Þ
corresponds to coagulation. A theory for the intermediate case
Rev � 1 ð50Þ
when part of the droplets participate in flocculation and another coagulateis absent. To specify the conditions (2) and (49), the doublet lifetime must be
Figure 9 Similar to Fig. 8, with other values for the characteristic times.
Coalescence time �c ¼ 105 s; the Smoluchowski time �Sm ¼ 103 s; Doublet fragmen-
tation lifetime �d ¼ 50 s. (From Ref. 25.)
Copyright 2004 by Marcel Dekker, Inc. All Rights Reserved.
expressed through surface force characteristics (viz. through the surfaceelectric potential and the Hamaker function) and droplet dimension, aswas described in Section IV.
In the equation for the Smoluchowski time [Eq. (4)], the dropletnumerical concentration N10 can easily be expressed through the dropletvolume fraction ’ and the average droplet radius a (we replace a polydis-perse emulsion by an ‘‘equivalent’’ monodisperse emulsion). The resultinganalysis respective to a and ’ is easier than relating to N10 because theboundary of application of different regularities are usually formulatedrespective to a and ’. The Smoluchowski time is
�Sm ¼ ��1F ’
�1 4
3�a3 ð51Þ
We exclude from consideration a special case of extremely dilute emulsions.Comparing Fig. 7 and the results of calculations according to Eq. (51),one concludes that condition (49) is mainly satisfied. It can beviolated if simultaneously the droplet volume fraction and the dropletdimension are very small. This occurs if ’ < 10�2 and a < 0:2�0:3 mm.Discussing this case, we exclude from consideration the situation whena 0:1 mm, corresponding to microemulsions and ’ << 10�2. With thisexception, one concludes that for uncharged droplets, flocculationis almost impossible because condition (2) cannot be satisfied. A secondconclusion is that at
a < 0:2�0:3 mm ð52Þ
the theory in Ref. 41 cannot be applied without some corrections madenecessary by the partially reversible character of the aggregation. Themain conclusion is that when
a > 0:2 mm and ’ > 10�2 ð53Þ
the theory in Ref. 41 does not need corrections respective to the reversibilityof flocculation. However, this conclusion will change at the transition toa thicker adsorption layer. As described in Section IV, the thicker theadsorption layer, the shorter is the doublet fragmentation time.
The electrostatic repulsion decreases the depth of the potential welland, correspondingly, decreases the doublet lifetime. As result, flocculationbecomes possible for submicrometer droplets as well as for micrometer-sizeddroplets if the electrolyte concentration is not too high, the surface potential
Copyright 2004 by Marcel Dekker, Inc. All Rights Reserved.
is rather high, and the droplet volume fraction is not too high. This is seenfrom Fig. 7.
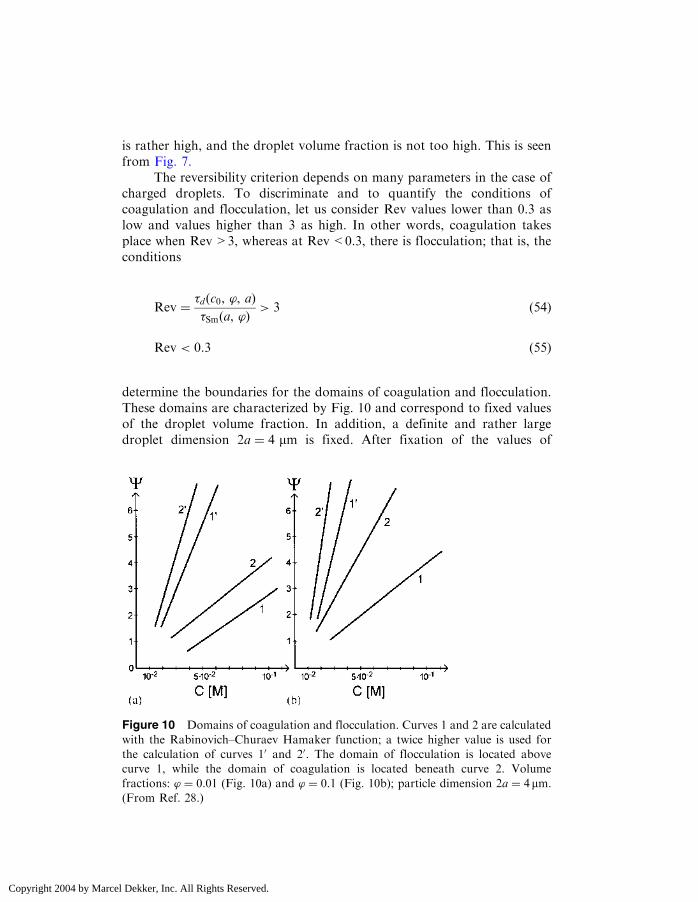
The reversibility criterion depends on many parameters in the case ofcharged droplets. To discriminate and to quantify the conditions ofcoagulation and flocculation, let us consider Rev values lower than 0.3 aslow and values higher than 3 as high. In other words, coagulation takesplace when Rev>3, whereas at Rev<0.3, there is flocculation; that is, theconditions
Rev ¼�dðc0, ’, aÞ
�Smða, ’Þ> 3 ð54Þ
Rev < 0:3 ð55Þ
determine the boundaries for the domains of coagulation and flocculation.These domains are characterized by Fig. 10 and correspond to fixed valuesof the droplet volume fraction. In addition, a definite and rather largedroplet dimension 2a ¼ 4 mm is fixed. After fixation of the values of
Figure 10 Domains of coagulation and flocculation. Curves 1 and 2 are calculated
with the Rabinovich–Churaev Hamaker function; a twice higher value is used for
the calculation of curves 10 and 20. The domain of flocculation is located above
curve 1, while the domain of coagulation is located beneath curve 2. Volume
fractions: ’ ¼ 0:01 (Fig. 10a) and ’ ¼ 0:1 (Fig. 10b); particle dimension 2a ¼ 4mm:(From Ref. 28.)
Copyright 2004 by Marcel Dekker, Inc. All Rights Reserved.
volume fraction and droplet dimension, the domains are characterized incoordinates � and C.
In Fig. 10, the domain of flocculation is located above and to the leftof curve 2; the domain of coagulation is located beneath and to the right ofcurve 1. To indicate the sensitivity of the domain boundaries to theHamaker function value, curves 10 and 20 are calculated using values twotimes higher than those of curves 1 and 2.
In distinction from uncharged droplets, flocculation in the range ofmicrometer-sized droplets is possible. As seen in Fig. 10, even rather largedroplets (4 mm) aggregate reversibly if the electrolyte concentration is lowerthan ð1�5Þ � 10�2 M and the Stern potential is higher than 25mV. Forsmaller droplets, the domain of flocculation will extend while the domainof coagulation shrinks. For submicrometer droplets, flocculation takes placeeven at high electrolyte concentrations (0.1M).
C. Hydration Forces Initiate Flocculation
Due to the similar dependence on the distance h of hydration forcesand electrostatic interaction, the decrease of doublet lifetime caused byhydration forces of repulsion can be calculated because of this similarity.It is sufficient to use the substitution hs for �
�1 and Ks for
16"kT
e
� �2
tanhe
kT
� �2
ð56Þ
where k is the Boltzmann constant, T is absolute temperature, and e is theelementary charge. The doublet lifetime can be determined with the use ofthe results presented in Fig. 7. For the sake of brevity, a similar figure withKs given on the ordinate axis and hs on the abscissa axis is not shown.It turns out that the decrease in �d caused by hydration forces leads toflocculation of submicrometer droplets. As for micrometer-sized droplets,coagulation takes place with the exception for the case when both hs and Ks
are rather large.
VI. APPLICATIONS
The restrictions in Eqs. (1) and (15) corresponding to strong retardation ofthe rate of multiplet formation and slow intradoublet coalescence are notfrequently satisfied. Nevertheless, these conditions are important becausethey correspond to the case of very stable emulsions. Because the kinetics ofretarded destabilization of rather stable emulsions are of interest, attention
Copyright 2004 by Marcel Dekker, Inc. All Rights Reserved.
has to be paid to provide these conditions and, thus, the problem of coupledcoalescence and flocculation arises.
There are large qualitative distinctions in the destabilization processesfor the coupling of coalescence and coagulation, and coalescence and floc-culation. In the first case, rapid aggregation causes rapid creaming andfurther coalescence within aggregates. In the second case, the creaming ishampered due to the low concentration of multiplets, and coalescence takesplace both before and after creaming. Before creaming, singlets predominatefor a rather long period of gradual growth of droplet dimensions due tocoalescence within doublets. The discrimination of conditions for couplingof coalescence with either flocculation or coagulation is accomplished inRef. 28.
The creaming time is much shorter in the case of coagulation and,correspondingly, the equation describing the coupling of coalescence andflocculation preserves its physical sense for a longer time than is the casefor coagulation. One concludes that the theory of the coupling of coalescenceand flocculation provides a new opportunity for the long-term predictionof emulsion stability, although creaming restricts the application ofthis theory as well. Note that this restriction weakens in emulsions of low-density contrast and in water-in-oil (w/o) emulsions with a high-viscositycontinuum.
Long-term prediction is a two-step procedure. The first step is thedetermination of whether an emulsion exhibits coagulation or flocculation.It means that the characteristic time �d must be measured and comparedwith �Sm, the value of which is easily evaluated taking into account themeasured concentration using Eq. (4). A comparison of these times enablesthe choice between condition (1) and the opposite condition (�Sm << �d).The second step is the prediction of the evolution in time for the t.d.c. Ifcondition (1) is valid, Eq. (18) has to be used for the prediction [� in Eq. (18)has to be specified in accordance with Eq. (15)]. In the opposite case, DIGBtheory must be used.
A. Long-Term Prediction of Emulsion Stability
It is possible, in principle, to give a long-term prediction of emulsion stabil-ity based on the first indications of aggregation and coalescence. The nextexample clarifies the principal difficulty in a reliable long-term prediction ifa dynamic model of the emulsion is not available.
The first signs of aggregation and coalescence can always becharacterized by a linear dependence if the investigation time t is shortcompared with a characteristic time � for the evolution of the total droplet
Copyright 2004 by Marcel Dekker, Inc. All Rights Reserved.

concentration nðtÞ:
nðtÞ ¼ n0 1�t
�
� ð57Þ
This short-time asymptotic corresponds to many functions [e.g., to Eq. (18)or to Eq. (36)]. The first can arise in the case of coalescence coupled withcoagulation (41), whereas the second can arise for coalescence coupled withflocculation (31). The discrimination between irreversible and reversibleaggregation is only one component of emulsion dynamics modeling(EDM) and it is seen that without this discrimination, the difference inthe prediction of the time necessary for a droplet concentration decrease(e.g., 1000 times) can be 7� and 1000�.
B. Refinement of Methods for Emulsion Stabilization(Destabilization) by Means of the Effect on BothCoalescence and Flocculation
Emulsion stability (or, for that matter, instability) can be described from theviewpoint of the coupling of coalescence and flocculation. However, foremulsifiers (or demulsifiers), only their influence on the elementary act ofcoalescence is primarily taken into account. The coupling of coalescence andflocculation is reflected in Eq. (15) and one concludes that it follows themultiplicativity rule and not the additivity rule. This means that the totalresult of the application of a stabilizer (destabilizer) depends very much onboth flocculation and fragmentation. The development of a more efficienttechnology for emulsion stabilization (destabilization) is possible by takinginto account the joint effect on both the coalescence and the aggregation(disaggregation) processes.
1. Combining Surfactants and Polymers inEmulsion Stabilization
The coalescence rate depends mainly on the thin-film (black) stability andcorrespondingly on the short-range forces, whereas flocculation depends onthe long-range surface forces. Due to this important difference, synergism inthe dependence of these processes on the different factors can be absent. Theuse of a single surfactant only may not provide, at the same time, both theoptimal fragmentation and optimal stability of an emulsion film. Probablythe use of a binary surfactant mixture with one component which providesthe film stability and a second one which prevents the flocculation mayprovide optimal emulsion stabilization. Naturally, coadsorption of the
Copyright 2004 by Marcel Dekker, Inc. All Rights Reserved.
two is necessary. For such an investigation, a measurement method for boththe doublet fragmentation time and the coalescence time is necessary.
2. There Is a Strong Influence of Low Concentrations ofIonic Surfactant on Doublet Fragmentation Timeand Coalescence Time
Let us consider the situation when an emulsion is stabilized against coales-cence by means of an adsorption layer of nonionic surfactant and is stronglycoagulated because of the subcritical value of the Stern potential that isusual for inorganic electrolytes (48) at moderate pH. In a large floc, anydroplet has many neighbors, meaning a rather high number of interdropletfilms per droplet. The coalescence rate is proportional to the total number offilms and can be rather high. It can be strongly decreased by adding evena low concentration of an ionic surfactant. This can be sufficient to providea supercritical Stern potential value that will be accompanied by a drasticdecrease in the doublet lifetime compared to that of weakly chargeddroplets.
At shorter doublet lifetimes, flocculation can become reversible and itcan stop at the stage of singlet–doublet equilibrium. It will provide a strongdecrease in the coalescence rate because coalescence occurs within doubletsonly and their concentration can be very low.
Thus, a modest addition of an ionic surfactant to an amount of anonionic surfactant sufficient to provide an almost saturated adsorptionlayer can make the overall emulsion stabilization more efficient.The nonionic surfactant suppresses coalescence but cannot preventflocculation, whereas the ionic surfactant retards the development offlocculation.
We can give an example when both coalescence and flocculation areaffected by an ionic surfactant (SDS). In Ref. 88, it is established thatcoalescence is suppressed at SDS concentrations exceeding 6� 10�5 M:Meanwhile, the CCC is 2� 10�2 M NaCl at 10�6 M SDS. Thus, SDSconcentrations slightly above 10�6 M are sufficient to retard flocculation.In this example, it is essential that the concentrations needed toretard flocculation are very low compared to those needed to preventcoalescence.
It is noteworthy that low concentrations of an ionic surfactantcan increase emulsion stability due to the simultaneous manifestation ofthree mechanisms. First, the depth of the secondary potential minimumdecreases due to the electrostatic repulsion that is accompanied by a�d decrease. Second, the transition from the secondary minimum throughan electrostatic barrier and into the primary minimum extends the
Copyright 2004 by Marcel Dekker, Inc. All Rights Reserved.
coalescence time. Third, the time of true coalescence (i.e., the timenecessary for thin-film rupture) increases due to electrostatic repulsionas well (29,65).
C. Standardization of the Measurement of �c and �d
Direct investigation of the coalescence subprocess in emulsions is difficult.Instead, the entire destabilization process is usually investigated.Meanwhile, the rate of the destabilization process depends on the rates ofboth flocculation and disaggregation and on the floc structure as well. Allthese characteristics vary in a broad range. Given an unknown value for thetime of the elementary act of coalescence, �c, the different times can bemeasured for the integrated process and different evaluations of �c arethen possible.
The rate of coalescence in an aggregate essentially depends on thenumber of droplets within it and the packing type (i.e., on the number offilms between the droplets). This complication is absent when consideringthe case of the s.d.e.
The possible advantage of �c measurement at s.d.e. is in avoiding thedifficulty caused by polydispersity of droplets appearing during precedingcoalescence within large flocs. At s.d.e., the initial stage of the entirecoalescence process can be investigated when the narrow size distributionof an emulsion is preserved.
At s.d.e., determination of the time dependence of the t.d.c. issufficient for the investigation of coalescence. In Refs. 29 and 30, this wasaccomplished through direct visual observation. By using video-enhancedmicroscopy and computerized image analysis, the determination of the t.d.c.can be automated. Such automated determination of total droplet numberin a dilute DCD-in-water emulsion at the s.d.e. can be recommended asa standard method for the characterization of the elementary act ofcoalescence.
In parallel, the second important characteristic (viz. the doubletfragmentation time) is determined by the substitution of �c, �Sm, andmeasured �d into Eq. (18).
D. Experimental–Theoretical Approach toEmulsion Dynamics Modeling
1. General
To predict the evolution of the droplet (floc) size distribution is the centralproblem concerning emulsion stability. It is possible, in principle, to predict
Copyright 2004 by Marcel Dekker, Inc. All Rights Reserved.

the time dependence of the distribution of droplets (flocs) if informationregarding the main subprocesses (flocculation, floc fragmentation, coales-cence, creaming), constituting the whole phenomenon, is available. This pre-diction is based on consideration of the population balance equation (PBE).
The PBE concept was proposed by Smoluchowski. He specified thisconcept for suspensions and did not take into account the possibility of flocfragmentation. Even with this restriction, he succeeded in the analyticalsolution neglecting gravitational coagulation and creaming, and he obtainedthe analytical time dependence for a number of aggregates ni comprisingi particles (i¼ 2, 3, . . .).
In the most general case, the equation for the evolution of the totaldroplet number takes into account the role of aggregation, fragmentation,creaming, and coalescence. There is no attempt to propose an algorithmeven for a numerical solution to such a problem.
The usual approach in the modeling of an extremely complicatedprocess is the consideration of some extreme cases with further synthesisof the obtained results. The next three main simplifications are inherent tothe current state of emulsion dynamics modeling: the neglection of theinfluence of the gravitational field (i.e., neglection of creaming/sedimenta-tion); in a first approximation, it is possible to consider either coagulation orflocculation; finally, neglection of the rate constant dependence on dropletdimension.
2. Combined Approach in Investigations of Dilute andConcentrated Emulsions
The modeling of collective processes in concentrated emulsions is ex-tremely complicated. Recently, the efficiency of computer simulation in thesystematic study of aggregates, gels, and creams has been demonstrated (50).Monte Carlo and Brownian dynamics are particularly suited to thesimulation of concentrated emulsions. However, information aboutdroplet–droplet interaction is necessary. The reliability of this informa-tion is very important to provide reasonable results concerning concen-trated emulsions. In other words, the assumption concerning pairwiseadditive potentials for droplet–droplet interaction and the thin-emulsion-film stability must be experimentally confirmed. The extraction of thisinformation from experiments with concentrated emulsions is very diffi-cult. On the other hand, measurement of the doublet fragmentation timein dilute emulsions is a convenient method to obtain information aboutpairwise additive potentials. Information about pair potentials and theelementary act of coalescence obtained in experiments with diluteemulsions preserves its significance for concentrated emulsions as well.
Copyright 2004 by Marcel Dekker, Inc. All Rights Reserved.
One concludes that modeling of concentrated emulsions becomespossible by combining experimental investigation of the simplest emulsionmodel system with computer simulation accounting for the characteristics ofa concentrated emulsion (high droplet volume fraction, etc.).
3. In the Transformation of PBE into an Efficient Tool for EDM,the Determination of Kernels Is the Main Task
The levels of knowledge concerning kernels describing different subpro-cesses differ strongly. There exists a possibility for quantification of kernelsrelated to aggregation and fragmentation (14,39,78). On the other hand, thecurrent state of knowledge is not sufficient for prediction of the thin-filmbreakdown time.
The deficit in knowledge about thin-film stability currently makespurely theoretical modeling of emulsion dynamics impossible. As a result,a complex semitheoretical approach to EDM is necessary. The PBE is themain component of both the experimental and the theoretical stages of thisapproach. In the experimental stage, the PBE simplified for s.d.e. providesthe background for the determination of the coalescence kernels with the useof experimental data (29,30).
For the determination of the coalescence kernels, the more compli-cated reverse task must be solved—namely their determination based onthe comparison of experimental data about the emulsion evolution in timewith solution of the PBE. In the absence of an analytical solution, thereverse task is usually very difficult. The most efficient way to overcomethis difficulty is an experimental realization with the use of the universallysimplest conditions for emulsion time evolution, which can be describedanalytically.
4. The Simplest Emulsion State for Which InvestigationCan Provide Information About Coalescence Is atSinglet–Doublet Quasiequilibrium with SlowCoalescence Within the Doublets
The simplest singlet–doublet emulsion can exist at singlet–doublet quasi-equilibrium given slow coalescence within doublets. Its simplicity resultsin a very simple kinetic law for the entire kinetics of coupled flocculationand coalescence, [viz. Eq. (18)]. Thus, s.d.e. provides the most convenientconditions for investigations of the elementary act of coalescence and thedoublet fragmentation time.
The main simplification in all existing models for emulsion dynamics(25,41) is the neglection of the coalescence time dependence on droplet
Copyright 2004 by Marcel Dekker, Inc. All Rights Reserved.
dimensions. This simplification is not justified and reduces severely the valueof the prediction, which can now be made with use of the PBE. For elim-ination of this unjustified simplification, it is necessary to determine thecoalescence time for emulsion films between droplets of different dimensionsi and j (viz. �cij, similar to the existing analytical expressions for the doubletfragmentation time, �dij) (14). The determination of a large set of �cij valuesby means of a comparison of experimental data obtained for an emulsionconsisting of different multiplets and the PBE numerical solutions for it isimpossible. On the other hand, this paramount experimental–theoreticaltask can be solved for a dilute emulsion at s.d.e. and slow intradoubletcoalescence.
5. Substitution of the Coalescence Kernels Makes thePBE Equation Definite and Ready for the Predictionof Emulsion Time Evolution (With the Restriction ofLow-Density Contrast and Without Accounting forGravitational Creaming and Coagulation)
With application of the scaling procedure for the representation of thekinetic rate constants for creaming and gravitational coagulation, the PBEis solved analytically in Ref. 89. This scaling theory creates a perspective forthe incorporation of creaming in the emulsion dynamics model in parallelwith coalescence, aggregation, and fragmentation.
VII. SUMMARY
The mechanisms of kinetic stability in macroemulsions and miniemulsionsare completely different. Strong droplet deformation and flattening of theinterface in a macroemulsion cause the Reynolds mode of drainage, whichprolongs the life of the emulsion. This mechanism is not importantfor miniemulsion droplet interaction, because either the deformation andflattening are weak (charged droplets) or the Reynolds drainage is rapid dueto the small dimension of the interdroplet film (uncharged droplets). Kineticstability in a miniemulsion can result from floc fragmentation if the electro-kinetic potential is not too low and the electrolyte concentration is not toohigh, corresponding to a degree of electrostatic repulsion.
The potential strength of physicochemical kinetics with respectto emulsions is the PBE, enabling prediction of the time evolution of thedroplet size distribution (d.s.d.) when the subprocesses [including dropletaggregation, aggregate fragmentation, droplet coalescence and droplet (floc)creaming] are quantified. The subprocesses are characterized in the PBE by
Copyright 2004 by Marcel Dekker, Inc. All Rights Reserved.

the kinetic coefficients. The coupling of the four subprocesses, the dropletpolydispersity, and the immense variety of droplet aggregate configurationscauses extreme difficulty in EDM. The three processes of aggregation,fragmentation, and creaming can be quantified. In contrast, only theexperimental approach is now available for efficient accumulation ofinformation concerning emulsion film stability and coalescence kernelquantification.
Correspondingly, EDM may be accomplished by combiningexperiment and theory: (a) the determination of coalescence and fragmenta-tion kernels with the use of emulsion stability experiments at low-densitycontrast (l.d.c.) and s.d.e., because this allows for the omittance of creamingand gravitational terms in PBE, simplifying the equation and enabling kerneldetermination; (b) the prediction of the droplet size evolution as functionof time by means of solution of the PBE, specified for the determinedcoalescence and fragmentation kernels. This mathematical model has to bebased on the PBE supplemented by terms accounting for the role of creamingand gravitational coagulation in the aggregation kinetics.
Emulsion dynamics modeling with experiments using l.d.c. emulsionsand s.d.e. may result in the following: (a) The quantification of emulsionfilm stability [viz. the establishment of the coalescence time dependenceon the physicochemical specificity of the adsorption layer of a specificsurfactant (polymer), its structure, and the droplet dimensions]. Such quan-tification can form a basis for optimized selection and synthesis of emulsi-fiers and demulsifiers for a broad variety of technological applicationsof emulsions, replacing the current empirical approach dominating thisarea. (b) The elaboration of a commercial device for coalescence timemeasurement, in combination with EDM, will represent a useful approachto the optimization of emulsion technology with respect to stabilization anddestabilization.
ACKNOWLEDGMENT
The technology program FLUCHA, financed by industry and theNorwegian Research Council, is acknowledged for financial support.
REFERENCES
1. D. G. Dalgleish, in Emulsions and Emulsion Stability (J. Sjoblom, ed.),
Marcel Dekker, New York, 1996, pp. 287–325.
2. D. G. Dalgleish, in Encyclopedic Handbook of Emulsion Technology (J. Sjoblom,
ed.), Marcel Dekker, New York, 2001, pp. 207–232.
Copyright 2004 by Marcel Dekker, Inc. All Rights Reserved.
3. P. Becher (ed.), Encyclopedia of Emulsion Technology, Volume 1, Marcel
Dekker, New York, 1983.
4. P. Becher (ed.), Encyclopedia of Emulsion Technology, Volume 2, Marcel
Dekker, New York, 1985.
5. J. Sjoblom (ed.), Emulsions—A Fundamental and Practical Approach, Kluwer
Academic, Dordrecht, 1992, p. 1.
6. R. A. Mohammed, A. I. Bailey, P. F. Luckham, and S. E. Taylor, Colloids
Surfaces 80, 223 (1993); 80, 237 (1993); 83, 261 (1994).
7. C. I. Chitewelu, V. Hornof, G. H. Neale, and A. E. George, Can. J. Chem. Eng.
72, 534 (1994).
8. L. Bertero, A. DiLullo, A. Lentini, and L. Terzi, in Proceedings of the SPE
Annual Technical Conference and Exhibition (Part 2) (SPE 28543) Society of
Petroleum Engineers, New Orleans, 1994, p. 283–295.
9. J. F. McCafferty and G. G. McClaflin, in Proceedings of the SPE Annual
Technical Conference, SPE 24850, Society of Petroleum Engineers, 1992,
pp. 857–868.
10. J. A. Kitchener and P. R. Musselwhite, in Emulsion Science (I. P. Sherman, ed.),
Academic Press, New York, 1968.
11. J. Sjoblom (ed.), Emulsions and Emulsion Stability, Marcel Dekker, New York,
1996.
12. I. B. Ivanov and P. A. Kralchevsky, Colloids Surfaces 128, 155 (1997).
13. B. V. Derjaguin, Theory of Stability of Colloids and Thin Films, Plenum Press,
New York, 1989.
14. S. S. Dukhin and J. Sjoblom, in Emulsions and Emulsion Stability (J. Sjoblom,
ed.), Marcel Dekker, New York, 1996, p. 41.
15. I. Gregory, Crit. Rev. Environ. Control. 19, 185 (1989).
16. J. N. Israelachvili, Intermolecular and Surface Forces, Academic Press, London,
1991.
17. J. Lyklema, Fundamentals of Interface and Colloid Science, Academic Press,
London, 1993, Vol. 1.
18. P. A. Kralchevsky, K. D. Danov, and N. D. Denkov, in Handbook of Surface
and Colloid Chemistry (K. S. Birdi, ed.), CRC Press, London, 1996.
19. Reference deleted.
20. R. K. Prud’homme (ed.), Foams: Theory, Measurement and Applications,
Marcel Dekker, New York, 1995.
21. P.A.Kralchevsky,K.D.Danov, and I. B. Ivanov, inFoams: Theory,Measurement
and Applications (R. K. Prud’homme, ed.), Marcel Dekker, New York, 1995.
22. S. A. K. Jeelany and S. Hartland, J. Colloid Interf. Sci. 164, 296 (1994).
23. P. D. I. Fletcher, in Drops and Bubbles in Interface Research (D. Mobius and
R. Miller, eds.), Elsevier, New York, 1998, Vol. 6.
24. P. J. Breen,D.T.Wasan,Y.H.Kim,A.D.Nikolov, andC. S. Shetty, inEmulsions
and Emulsion Stability (J. Sjoblom, ed.), Marcel Dekker, New York, 1996.
25. S. S. Dukhin and J. Sjoblom, J. Dispers. Sci. Technol. 19, 311 (1998).
26. Ø. Holt, Ø. Sæther, J. Sjoblom, S. S. Dukhin, and N. A. Mishchuk, Colloids
Surfaces 123–124, 195 (1997).
Copyright 2004 by Marcel Dekker, Inc. All Rights Reserved.
27. Ø. Sæther, S. S. Dukhin, J. Sjoblom, and Ø. Holt, Colloid J. 57, 836 (1995).
28. S. S. Dukhin, J. Sjoblom, D. T. Wasan, and Ø. Sæther, Colloids Surfaces 180,
223 (2001).
29. Ø. Sæther, J. Sjoblom, S. V. Verbich, N. A. Mishchuk, and S. S. Dukhin,
Colloids Surfaces 142, 189 (1998).
30. Ø. Sæther, J. Sjoblom, S. V. Verbich, and S. S. Dukhin, J. Dispers. Sci. Technol.
20, 295 (1999).
31. Ø. Holt, Ø. Sæther, J. Sjoblom, S. S. Dukhin, and N. A. Mishchuk, Colloids
Surfaces 141, 269 (1998).
32. S. S. Dukhin, Ø. Sæther, J. Sjoblom, Proc. Special Symposium in honor of D.T.
Wasan on Emulsions, Foams, Thin Films and Interfacial Rheology as part of 72nd
ACS Colloid and Surface Science Conference, 1998.
33. O. Reynolds, Phil. Trans. R. Soc. (London) A 177, 157 (1886).
34. A. Scheludko, Adv. Colloid. Interface Sci. 1, 391 (1967).
35. K. D. Danov, D. N. Petsev, N. D. Denkov, and R. Borwankar, J. Chem. Phys.
99, 7179 (1993).
36. K. D. Danov, N. D. Denkov, D. N. Petsev, and R. Borwankar, Langmuir 9,
1731 (1993).
37. D. N. Petsev, N. D. Denkov, and P. A. Kralchevsky, J. Colloid Interf. Sci. 176,
201 (1995).
38. I. B. Ivanov and D. S. Dimitrov, in Thin Liquid Films (I. B. Ivanov, ed.),
Marcel Dekker, New York, 1998.
39. N. A. Mishchuk, J. Sjoblom, and S. S. Dukhin, Colloid J. 57, 785 (1995).
40. R. P. Borwankar, L. A. Lobo, andD. T.Wasan,Colloids Surfaces 69, 135 (1992).
41. K. D. Danov, I. B. Ivanov, T. D. Gurkov, and R. P. Borwankar, J. Colloid
Interf. Sci. 167, 8 (1994).
42. L. A. Lobo, D. T. Wasan, and M. Ivanova, in Surfactants in Solution (K. L.
Mittal and D. O. Shah, eds.), Plenum Press, New York, 1992, Vol. 11, p. 395.
43. L. Lobo, I. Ivanov, and D. Wasan, Mater. Interf. Electrochem. Phenomena 39,
322 (1993).
44. G. Narsimhan and E. Ruckenstein, in Foams: Theory, Measurement and
Applications (R. K. Prud’homme, ed.), Marcel Dekker, New York, 1995.
45. D. Exerova, D. Kashchiev, and D. Platikanov, Adv. Colloid Interf. Sci. 40,
201 (1992).
46. B. V. Derjaguin and Yu. V. Gutop, Kolloid. Zh. 24, 431 (1962).
47. A. V. Prokhorov and B. V. Derjaguin, J. Colloid Interf. Sci. 125, 111 (1988).
48. S. V . Verbich, S. S. Dukhin, A. Tarovsky, Ø. Holt, Ø. Sæther, and J. Sjoblom,
Colloids Surfaces 23, 209 (1997).
49. D. Kashchiev and D. Exerowa, J. Colloid Interf. Sci. 203, 146 (1998).
50. E. Dickinson and S. R. Euston, Adv. Colloid Interf. Sci. 42, 89 (1992).
51. P. Taylor, Adv. Colloid Interf. Sci. 75, 107 (1998).
52. H. W. Yarranton and Y. H. Masliyah, J. Colloid Interf. Sci. 196, 157 (1997).
53. M. Smoluchowski, Phys. Z. 17, 557 (1916).
54. G. A. Martynov and V. M. Muller, Kolloidn. Zh. 36, 687 (1974).
55. V. M. Muller, Kolloidn. Zh. 40, 885 (1978).
Copyright 2004 by Marcel Dekker, Inc. All Rights Reserved.

56. H. Sonntag and K. Strenge, Coagulation Kinetics and Structure Formation, VEB
Deutcher Verlag der Wissenschaften, Berlin, 1987.
57. J. D. Chan, P. S. Hahn, and J. C. Slattery, AIChE J. 34, 140 (1988).
58. S. A. K. Jeelani and S. Hartland, J. Colloid Interf. Sci. 156, 467 (1993).
59. R. W. Aul and W. I. Olbriht, J. Colloid Interf. Sci. 115, 478 (1991).
60. A. Scheludko and D. Exerova, Colloid J. 168, 24 (1960).
61. A. Scheludko, Proc. K. Ned. Akad. Wet. Ser. B 65, 87 (1962).
62. D. Platikanov and E. Manev, in Proceedings, 4th International Congress of
Surface Active Substances, Plenum, New York, 1964, p. 1189.
63. K. A. Burrill and D. R. Woods, J. Colloid Interf. Sci. 42, 15 (1973).
64. K. A. Burrill and D. R. Woods, J. Colloid Interf. Sci. 42, 35 (1973).
65. S. R. Deshiikan and K. D. Papadopoulos, J. Colloid Interf. Sci. 174, 302 (1995).
66. S. R. Deshiikan and K. D. Papadopoulos, J. Colloid Interf. Sci. 174, 313 (1995).
67. M. E. Costas, M. Moreau, and L. Vicente, J. Phys. A: Math. Gen.
28, 2981 (1995).
68. F. Le Berre, G. Chauveteau, and E. Pefferkorn, J. Colloid Interf. Sci. 199,
1 (1998).
69. B. J. McCoy and G. Madras, J. Colloid Interf. Sci. 201, 200 (1998).
70. J. Widmaier and E. Pefferkorn, J. Colloid Interf. Sci. 203, 402 (1998).
71. I. M. Elminyawi, S. Gangopadhyay, and C. M. Sorensen, J. Colloid Interf. Sci.
144, 315 (1991).
72. M. von Smoluchowski, Phys. Chem. 92, 129 (1917).
73. M. van den Tempel, Rec. Trav. Chim. 72, 419 (1953); 72, 433 (1953).
74. P. Meakin, Adv. Colloid Interf. Sci. 28, 249 (1988).
75. R. Nakamura, Y. Kitada, and T. Mukai, Planet. Space Sci. 42, 721 (1994).
76. S. Chandrasekhar, Rev. Mod. Phys. 15, 1 (1943).
77. W. B. Russel, D. A. Saville, and W. R. Schowalter, Colloidal Dispersions,
Cambridge University Press, New York, 1989.
78. V. M. Muller, Colloid J. 58, 598 (1996).
79. Ia. I. Rabinovich and A. A. Baran, Colloids Surfaces 59, 47 (1991).
80. P. Walstra, in Gums and Stabilizers for the Food Industry (G. O. Philips, P. A.
Williams, and D. J. Wedlock, eds.), IRL, Oxford, 1988, Vol. 4, p. 233.
81. D. G. Dalgleish, Colloids Surfaces 46, 14 (1990).
82. D. G. Dalgleish and Y. Fang, J. Colloid Interf. Sci. 156, 329 (1993).
83. B. Bergenstahl and P. M. Claesson, in Food Emulsions (K. Larson and
S. Friberg, eds.), Marcel Dekker, New York, 1989, p. 41.
84. Ya. I. Rabinovich and N. V. Churaev, Kolloidn. Zh. 46, 69 (1984); 52,
309 (1990).
85. D. J. Mitchell and P. Richmond, J. Colloid Interf. Sci. 46, 128 (1974).
86. V. N. Gorelkin and V. P. Smilga, Kolloidn. Zh. 34, 685 (1972).
87. V. N. Gorelkin and V. P. Smilga, in Poverkhnostnye Sily v Tonkikh Plenkakh i
Ustoichivost Kolloidov (B. V. Derjaguin, ed.), Nauka, Moscow, 1974, p. 206.
88. S. Usui, Y. Imamura, and E. Barough, J. Dispers. Sci. Technol. 8, 359 (1987).
89. S. B. Grant, C. Poor, and S. Relle, Colloids Surfaces 107, 155 (1996).
Copyright 2004 by Marcel Dekker, Inc. All Rights Reserved.