drug analysis - united nations office on drugs and crime · 8 outliers. laboratory code 9565 9564...
TRANSCRIPT
ICE
International Collaborative Exercises
2010
/ 1
Drug Analysis
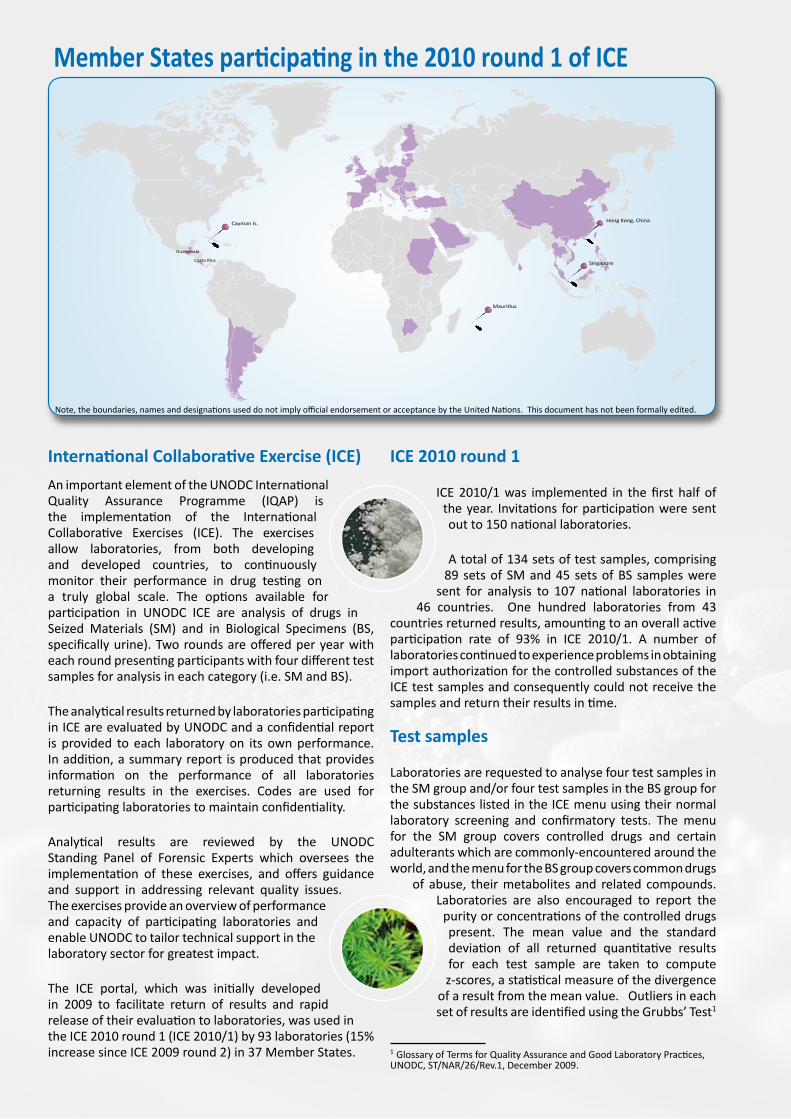
Member States participating in the 2010 round 1 of ICE
International Collaborative Exercise (ICE)
An important element of the UNODC International Quality Assurance Programme (IQAP) is the implementation of the International Collaborative Exercises (ICE). The exercises allow laboratories, from both developing and developed countries, to continuously monitor their performance in drug testing on a truly global scale. The options available for participation in UNODC ICE are analysis of drugs in Seized Materials (SM) and in Biological Specimens (BS, specifically urine). Two rounds are offered per year with each round presenting participants with four different test samples for analysis in each category (i.e. SM and BS).
The analytical results returned by laboratories participating in ICE are evaluated by UNODC and a confidential report is provided to each laboratory on its own performance. In addition, a summary report is produced that provides information on the performance of all laboratories returning results in the exercises. Codes are used for participating laboratories to maintain confidentiality.
Analytical results are reviewed by the UNODC Standing Panel of Forensic Experts which oversees the implementation of these exercises, and offers guidance and support in addressing relevant quality issues. The exercises provide an overview of performance and capacity of participating laboratories and enable UNODC to tailor technical support in the laboratory sector for greatest impact.
The ICE portal, which was initially developed in 2009 to facilitate return of results and rapid release of their evaluation to laboratories, was used in the ICE 2010 round 1 (ICE 2010/1) by 93 laboratories (15% increase since ICE 2009 round 2) in 37 Member States.
ICE 2010 round 1
ICE 2010/1 was implemented in the first half of the year. Invitations for participation were sent out to 150 national laboratories.
A total of 134 sets of test samples, comprising 89 sets of SM and 45 sets of BS samples were
sent for analysis to 107 national laboratories in 46 countries. One hundred laboratories from 43
countries returned results, amounting to an overall active participation rate of 93% in ICE 2010/1. A number of laboratories continued to experience problems in obtaining import authorization for the controlled substances of the ICE test samples and consequently could not receive the samples and return their results in time.
Test samples
Laboratories are requested to analyse four test samples in the SM group and/or four test samples in the BS group for the substances listed in the ICE menu using their normal laboratory screening and confirmatory tests. The menu for the SM group covers controlled drugs and certain adulterants which are commonly-encountered around the world, and the menu for the BS group covers common drugs
of abuse, their metabolites and related compounds. Laboratories are also encouraged to report the
purity or concentrations of the controlled drugs present. The mean value and the standard deviation of all returned quantitative results for each test sample are taken to compute z-scores, a statistical measure of the divergence
of a result from the mean value. Outliers in each set of results are identified using the Grubbs’ Test1
1 Glossary of Terms for Quality Assurance and Good Laboratory Practices, UNODC, ST/NAR/26/Rev.1, December 2009.
Note: The boundaries, names and designations used to not imply official endorsement or acceptance by the United Nations. This document has not been formally edited.
Mauritius
Hong Kong, ChinaCayman Is.
Singapore
Guatemala
Costa Rica
Note, the boundaries, names and designations used do not imply official endorsement or acceptance by the United Nations. This document has not been formally edited.
and for sets of results involving outliers the robust standard deviation is computed by excluding these outliers.
Results with z-scores within the range ± 2 are considered satisfactory. Laboratories whose results have z-scores between ± 2 and ± 3 should consider the need for corrective action, and those with z-scores beyond ± 3 should take corrective action.
Seized Materials (SM)
One sample contained lactose, a common adulterant, while the other three test samples contained controlled substances belonging to three drug classes: ecgonine (cocaine) alkaloids, opioids and cannabinoids, respectively. All laboratories returned correct results for samples containing cocaine and heroin. In the current exercise, more than 78% of laboratories also measured the purity of the controlled substance(s) in at least one of the test samples, which represents a 7% increase compared to ICE 2009/2. Statistical analyses of the results received from participants are summarised in the tables and charts corresponding to each sample.
SM1
SM1 was a “blank” sample containing only lactose. Sixty-three (97%) of the 65 laboratories that performed the analysis correctly identified the presence of lactose. Nineteen laboratories did not perform the analysis for
lactose, following their normal laboratory protocols, but equally they did not mistakenly report the presence of any controlled drugs.
SM2
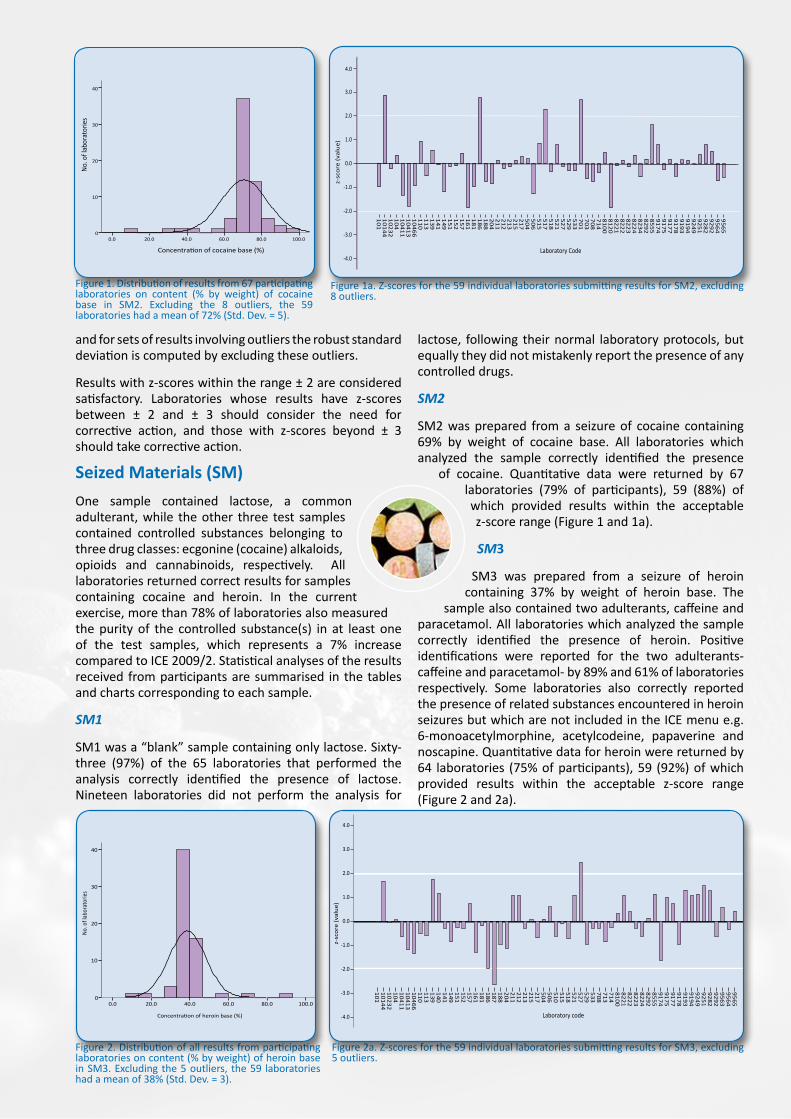
SM2 was prepared from a seizure of cocaine containing 69% by weight of cocaine base. All laboratories which analyzed the sample correctly identified the presence
of cocaine. Quantitative data were returned by 67 laboratories (79% of participants), 59 (88%) of which provided results within the acceptable z-score range (Figure 1 and 1a).
SM3
SM3 was prepared from a seizure of heroin containing 37% by weight of heroin base. The
sample also contained two adulterants, caffeine and paracetamol. All laboratories which analyzed the sample correctly identified the presence of heroin. Positive identifications were reported for the two adulterants- caffeine and paracetamol- by 89% and 61% of laboratories respectively. Some laboratories also correctly reported the presence of related substances encountered in heroin seizures but which are not included in the ICE menu e.g. 6-monoacetylmorphine, acetylcodeine, papaverine and noscapine. Quantitative data for heroin were returned by 64 laboratories (75% of participants), 59 (92%) of which provided results within the acceptable z-score range (Figure 2 and 2a).
Figure 1. Distribution of results from 67 participating laboratories on content (% by weight) of cocaine base in SM2. Excluding the 8 outliers, the 59 laboratories had a mean of 72% (Std. Dev. = 5).
Concentration of cocaine base (%)
100.080.060.040.020.00.0
No.
of l
abor
ator
ies
40
30
20
10
0
Histogramdrug name: SM-2/Cocaine
N =67
Figure 2. Distribution of all results from participating laboratories on content (% by weight) of heroin base in SM3. Excluding the 5 outliers, the 59 laboratories had a mean of 38% (Std. Dev. = 3).
Concentration of heroin base (%)
100.080.060.040.020.00.0
No.
of l
abor
ator
ies
40
30
20
10
0
Histogram
drug name: SM-3/HeroinN =64
Figure 1a. Z-scores for the 59 individual laboratories submitting results for SM2, excluding 8 outliers.
Laboratory Code
95
65
95
64
92
92
92
82
92
51
92
49
91
94
91
93
91
78
91
77
91
75
91
74
85
55
82
92
82
34
82
24
82
23
82
22
82
21
81
20
81
00
71
47
08
70
37
01
53
35
29
52
75
21
51
85
17
51
55
06
50
42
17
21
52
13
21
22
11
20
41
88
18
61
81
16
11
57
15
21
51
14
91
41
13
91
13
11
01
04
66
10
41
31
04
11
10
41
02
32
10
14
41
01
z-sc
ore
(va
lue
)
4.0
3.0
2.0
1.0
0.0
-1.0
-2.0
-3.0
-4.0
drug name: SM-2/Cocaine
Figure 2a. Z-scores for the 59 individual laboratories submitting results for SM3, excluding 5 outliers.
Laboratory code
95
65
95
64
95
63
92
92
92
82
92
51
92
49
91
94
91
93
91
78
91
77
91
75
91
74
85
55
82
92
82
24
82
23
82
22
82
21
81
00
714
713
708
533
529
527
521
518
515
510
506
504
217
215
213
212
211
204
188
187
186
181
161
157
152
151
149
141
140
139
113
110
10
46
61
04
13
10
41
11
041
02
32
10
14
41
01
z-sc
ore
(va
lue)
4.0
3.0
2.0
1.0
0.0
-1.0
-2.0
-3.0
-4.0
drug name: SM-3/Heroi n
SM4
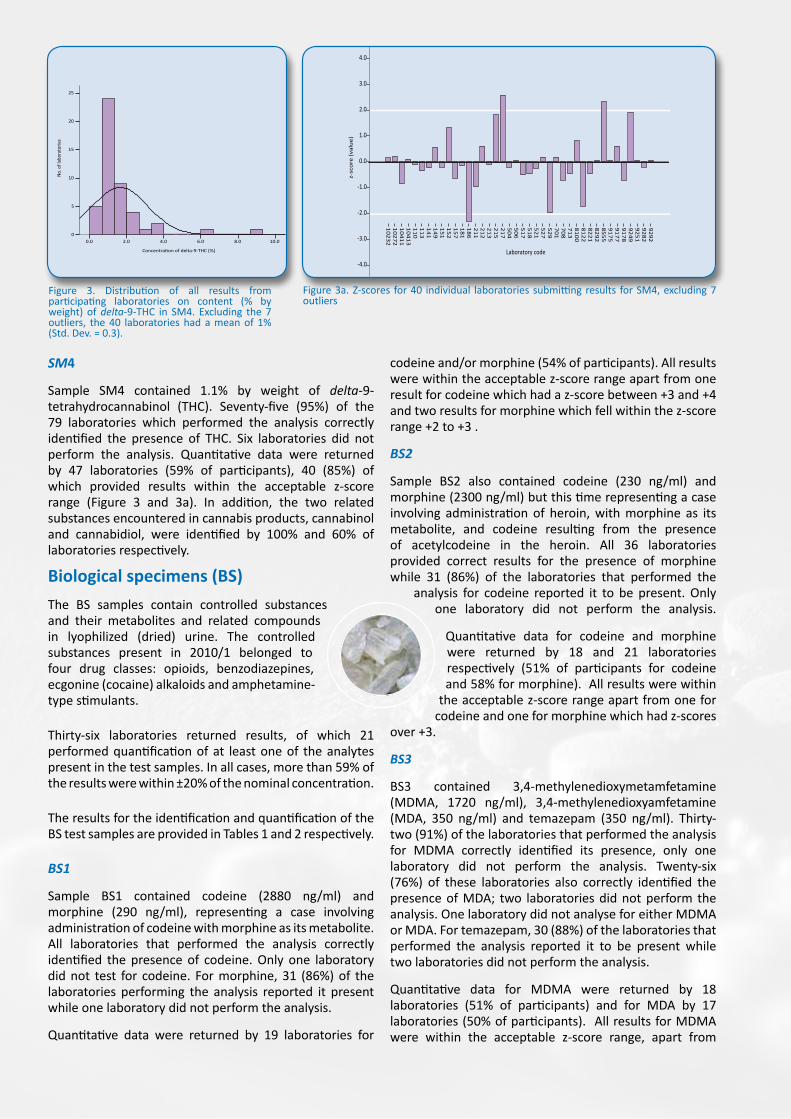
Sample SM4 contained 1.1% by weight of delta-9-tetrahydrocannabinol (THC). Seventy-five (95%) of the 79 laboratories which performed the analysis correctly identified the presence of THC. Six laboratories did not perform the analysis. Quantitative data were returned by 47 laboratories (59% of participants), 40 (85%) of which provided results within the acceptable z-score range (Figure 3 and 3a). In addition, the two related substances encountered in cannabis products, cannabinol and cannabidiol, were identified by 100% and 60% of laboratories respectively.
Biological specimens (BS)
The BS samples contain controlled substances and their metabolites and related compounds in lyophilized (dried) urine. The controlled substances present in 2010/1 belonged to four drug classes: opioids, benzodiazepines, ecgonine (cocaine) alkaloids and amphetamine-type stimulants.
Thirty-six laboratories returned results, of which 21 performed quantification of at least one of the analytes present in the test samples. In all cases, more than 59% of the results were within ±20% of the nominal concentration.
The results for the identification and quantification of the BS test samples are provided in Tables 1 and 2 respectively.
BS1
Sample BS1 contained codeine (2880 ng/ml) and morphine (290 ng/ml), representing a case involving administration of codeine with morphine as its metabolite. All laboratories that performed the analysis correctly identified the presence of codeine. Only one laboratory did not test for codeine. For morphine, 31 (86%) of the laboratories performing the analysis reported it present while one laboratory did not perform the analysis.
Quantitative data were returned by 19 laboratories for
codeine and/or morphine (54% of participants). All results were within the acceptable z-score range apart from one result for codeine which had a z-score between +3 and +4 and two results for morphine which fell within the z-score range +2 to +3 .
BS2
Sample BS2 also contained codeine (230 ng/ml) and morphine (2300 ng/ml) but this time representing a case involving administration of heroin, with morphine as its metabolite, and codeine resulting from the presence of acetylcodeine in the heroin. All 36 laboratories provided correct results for the presence of morphine while 31 (86%) of the laboratories that performed the
analysis for codeine reported it to be present. Only one laboratory did not perform the analysis.
Quantitative data for codeine and morphine were returned by 18 and 21 laboratories respectively (51% of participants for codeine and 58% for morphine). All results were within
the acceptable z-score range apart from one for codeine and one for morphine which had z-scores
over +3.
BS3
BS3 contained 3,4-methylenedioxymetamfetamine (MDMA, 1720 ng/ml), 3,4-methylenedioxyamfetamine (MDA, 350 ng/ml) and temazepam (350 ng/ml). Thirty-two (91%) of the laboratories that performed the analysis for MDMA correctly identified its presence, only one laboratory did not perform the analysis. Twenty-six (76%) of these laboratories also correctly identified the presence of MDA; two laboratories did not perform the analysis. One laboratory did not analyse for either MDMA or MDA. For temazepam, 30 (88%) of the laboratories that performed the analysis reported it to be present while two laboratories did not perform the analysis.
Quantitative data for MDMA were returned by 18 laboratories (51% of participants) and for MDA by 17 laboratories (50% of participants). All results for MDMA were within the acceptable z-score range, apart from
Figure 3. Distribution of all results from participating laboratories on content (% by weight) of delta-9-THC in SM4. Excluding the 7 outliers, the 40 laboratories had a mean of 1% (Std. Dev. = 0.3).
Concentration of delta-9-THC (%)
10.08.06.04.02.00.0
No.
of l
abor
ator
ies
25
20
15
10
5
0
Histogramdrug name: SM-4/(delta-9-THC)
N =4 7
Figure 3a. Z-scores for 40 individual laboratories submitting results for SM4, excluding 7 outliers
Laboratory code
92
92
92
82
92
51
92
49
91
78
91
77
91
75
85
55
82
92
82
21
81
22
81
00
71
37
08
70
15
29
52
75
21
51
85
17
50
65
04
21
72
15
21
32
12
21
11
86
18
11
57
15
21
51
14
91
41
11
31
10
10
41
31
04
11
10
27
21
02
32
z-sc
ore
(va
lue
)
4.0
3.0
2.0
1.0
0.0
-1.0
-2.0
-3.0
-4.0
dru name: SM-4/(delta-9-THC)

one result with a z-score greater than +3. All quantitative results for MDA were within the acceptable z-score range. Quantitative data for temazepam were returned by 19 laboratories (56% of participants), of which 17 (50 %) were within the acceptable z-score range and two were between ± 2 and ± 3.
BS4
Sample BS4 contained nordiazepam, a diazepam metabolite, which is also used as a drug on its own (1150 ng/ml), and the cocaine metabolites benzoylecgonine (1150 ng/ml) and methylecgonine (580 ng/ml). Thirty- one (91%) of the laboratories that performed the analysis for nordiazepam correctly identified its presence. Identification results for benzoylecgonine were returned by 30 laboratories (97% of participants) while five laboratories did not perform the analysis. For methylecgonine, 26 (87%) of the laboratories that performed the analysis reported it to be present while six laboratories did not perform the analysis. Four laboratories did not test for either benzoylecgonine or methylecgonine.
Quantitative data for nordiazepam were returned by 20 laboratories (59% of participants). All results were within the acceptable z-score range apart from one which fell within the z-score range -2 to -3. Quantitative data for benzoylecgonine and methylecgonine were returned by 16 laboratories (52% of participants) and 15 laboratories (50% of participants) respectively. All results for benzoylecgonine and methylecgonine were within the acceptable z-score range apart from two (one each for benzoylecgonine and methylecgonine) which had z-scores of ± 2 to ± 3.
Codeine Morphine Codeine Morphine MDMA MDA Temazepam Nordiazepam Benzoylecgonine Methylecgonine
110 3944 134 276 1269 2399 306 1094 1357 n.r n.r321 1330 280 230 1300 n.r n.r 840 1200 1050 450330 2133 300 160 2200 1566 375 1250 1050 900 580332 n.r 1000 n.r 1000 n.r n.r n.r n.r n.r n.r348 714 253 240 2420 4800 n.r 360 250 296 2940510 2680 310 250 2190 1580 340 1230 1070 1050 530529 3057 209 134 2732 1890 326 1295 780 1312 751703 11465 1275 890 10970 1070 320 947 890 1315 551713 3100 300 210 2200 1800 300 1200 1100 1500 520751 3000 300 240 2400 2100 280 1100 1100 1400 530761 2770 341 245 2150 1540 299 989 1040 1040 527
8329 3395 338 262 2215 1685 355 858 942 1409 5138369 2696 254 218 1974 1452 339 1318 1150 1165 5028392 2474 266 233 2158 1594 357 1215 1100 1173 5858396 3127 307 255 2311 1836 334 1166 1275 1197 2888555 3536 342 305 2951 1740 304 1124 1380 1593 7489193 3190 250 157 4363 2140 350 n.r 687 1012 21279366 n.r 295 n.r 2320 1600 345 1410 990 975 n.r9564 3767 n.r 346 n.r 1680 330 915 780 n.r n.r9565 2530 1480 170 2840 1650 320 470 1560 n.r n.r
10531 1644 n.r n.r 2227 n.r n.r 1990 978 n.r n.rTarget value 2880 290 230 2300 1720 350 1150 1150 1150 580
n.r = not reported
Laboratory code
BS1 BS2 BS3 BS4
Code
ine
Morph
ine an
d/or
Metab
olite
s
Code
ine
3,4‐methy
lene
diox
y metam
fetamine
(MDMA)
Tena
mfetamine
(MDA)
Benzoy
lecgon
ine
Methy
lecgon
ine
Nordiazep
am
10412 r r r r r r nr nr10531 r w w w w w w r
110 r r r r r nr nr r113 r r r r r r r r126 r r r w w r r w181 r r r r r r r w313 r r r r r r r r321 r r r w w r r r327 r r r r r r r r330 r r r r r r r r332 r r r r w r r nr337 r r r r r r r r347 r w w r r r w w348 r r r r w r r r349 r r w r r r w r504 r r r r w r r r506 r r r r r r r r510 r r r r r r r r518 r nr r r nr nr nr r520 r r r r w r w r529 r r r r r r r r533 r r r r r r r r
703 BS r r r r r r r r713 r r r r r r r r751 r r r r r r r r761 r r r r w r r r
8329 r r r r r r r r8369 r r r r r r r r8392 r r r r r r r r8396 r r r r r r r r8555 r r r r r r r r9193 r r r r r r r r9366 nr r nr r r r nr r9563 r w w nr nr nr nr r9564 r w r r r nr nr r9565 r r r r r nr r r
Sample 1 Sample 2 Sample 3 Sample 4
Morph
ine an
d/or
Metab
olite
s
Temazep
am
Laboratory code
r r
r nrr rr rr rr w
r r
r rr rr rr rr w
r r
r wr rr rr rr r
r r
r nrr rr rr rr r
r r
r rr rr rr rr r
r r
r rr wr rr rr r
nr = no report; w = wrong; r = right
16 Aug 2010 Page 1 of 1
Table 1. Results returned by laboratories for identification of substances in the BS category.
Table 2. Results returned by laboratories for quantification of substances in the BS category (ng/ml).
Comments from the Standing Panel
Seized Materials (SM)
It is very encouraging to see active participation by 96% of the 89 laboratories receiving SM samples and the increased use of the ICE portal to return results. Overall, the results were very satisfactory, with none of the participants finding any controlled drugs in the lactose (blank) sample SM1, all correctly identifying cocaine in sample SM2 and heroin in sample SM3, and 95% identifying the THC in sample SM4. No laboratory mistakenly identified any other controlled drugs which were not originally present in these samples, reflecting well on their contamination-avoidance procedures. The large proportion of participants also quantifying cocaine (79%), heroin (75%) and THC (59%) shows increasing compliance with the general recommendation to laboratories participating in ICE to perform quantitative analysis, and the large proportion (>60%) also identifying related substances and adulterants not in the ICE menu indicates better information generation for intelligence purposes. Most quantitative results were within the acceptable range of ± 2 z-score values and the means were in good agreement with the target purity values. However, the Panel is concerned about four laboratories failing to identify THC in sample SM4, notwithstanding its low concentration, while six did not perform the analysis, and the few outliers in the results for each sample. These concerns should be followed up by the laboratories concerned with assistance from UNODC.Biological Specimens (BS)
Overall, the results for the BS group were good, given the inherently higher level of difficulty in the analysis of biological specimens compared to seized materials. Correct identification results were returned for the major analytes present in all four BS samples by more than 90% of participating laboratories while metabolites were correctly identified by more than 80% of participants. The detection of metabolites in urine provides support for the correct identification of the administered substance and is particularly important for that reason. Laboratories should seek to include metabolites of target analytes when possible. The Panel is pleased with the number of laboratories undertaking quantitative analysis of urine samples. Quantitative analysis may not always assist in the
interpretation of results in a case but has been found to improve the quality of laboratory analyses.
The Panel considered that these results underlined the value of the ICE programme in revealing weaknesses in analytical methods which need to be addressed. ICE is a training and management tool and participating laboratories should take advantage of the support that LSS can provide to improve performance.
Emerging drug trends
In this round, pink tablets with the Adidas® logo (approx. 8 mm diameter), suspected to be ‘Ecstasy’ were reported by some East Asian laboratories. However, analysis indicated a mixture of benzylpiperazine (BZP), 3-trifluoromethylphenylpiperazine (TFMPP), 1,4-dibenzylpiperazine (DBZP) and caffeine. Similar tablets with ‘O’ logo were identified to contain a mixture of piperazines (BZP, TFMPP) and ketamine. Piperazine derivatives continue to be reported by a number of European participating countries. Some piperazines were also reported in Latin America and these have been used as substitutes for amphetamine-type-stimulants (ATS).
As in 2009 round 2, a significant number of ICE participating laboratories worldwide reported drugs such as mephedrone, methylenedioxypyrovalerone (MDPV) and the naphthoylindoles, including JWH-018, JWH-013 and CP 47,497, which are cannabinoid receptor agonists. N,N-Dimethyltryptamine (DMT) a naturally occurring hallucinogenic drug of the tryptamine family, has been identified in plant materials in countries both in Europe and in Latin America. Individual cases of liquid LSD, gamma-hydroxybutyric acid (GHB), phencyclidine (PCP) and fresh hallucinogenic mushrooms have been reported.
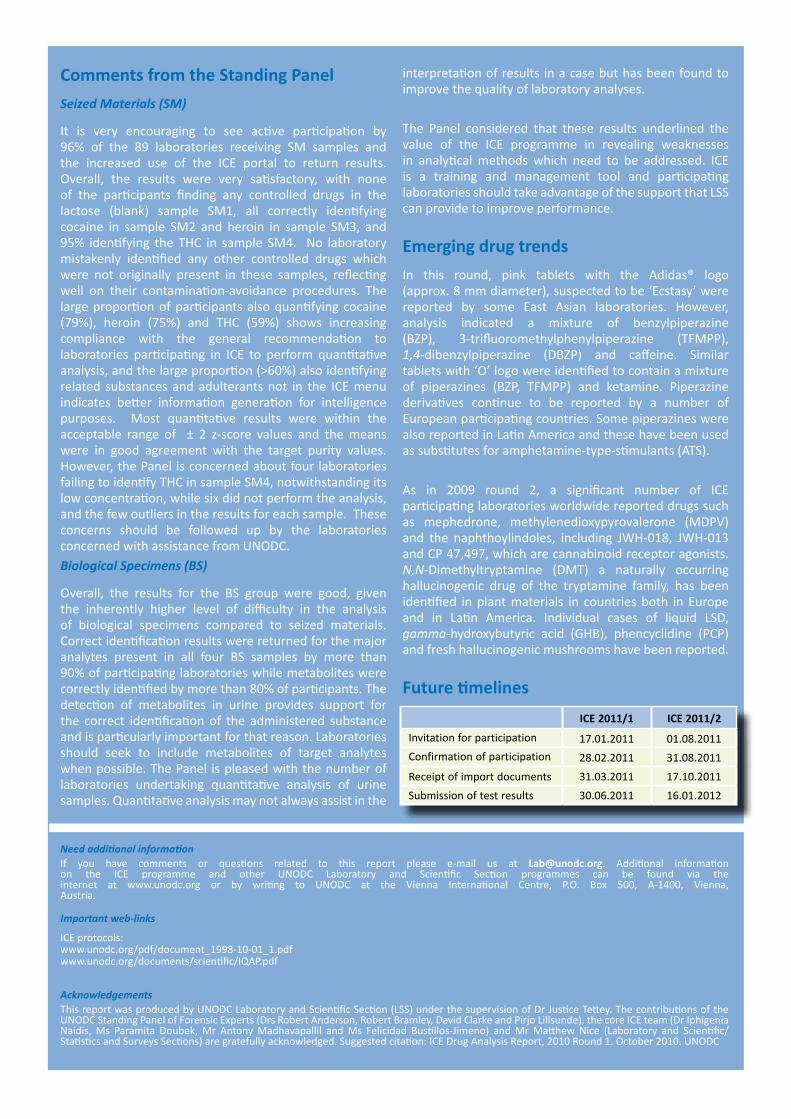
Future timelines
ICE 2011/1 ICE 2011/2
Invitation for participation 17.01.2011 01.08.2011
Confirmation of participation 28.02.2011 31.08.2011
Receipt of import documents 31.03.2011 17.10.2011
Submission of test results 30.06.2011 16.01.2012
Need additional informationIf you have comments or questions related to this report please e-mail us at [email protected]. Additional information on the ICE programme and other UNODC Laboratory and Scientific Section programmes can be found via the internet at www.unodc.org or by writing to UNODC at the Vienna International Centre, P.O. Box 500, A-1400, Vienna, Austria.
Important web-links
ICE protocols:www.unodc.org/pdf/document_1998-10-01_1.pdfwww.unodc.org/documents/scientific/IQAP.pdf
AcknowledgementsThis report was produced by UNODC Laboratory and Scientific Section (LSS) under the supervision of Dr Justice Tettey. The contributions of the UNODC Standing Panel of Forensic Experts (Drs Robert Anderson, Robert Bramley, David Clarke and Pirjo Lillsunde), the core ICE team (Dr Iphigenia Naidis, Ms Paramita Doubek, Mr Antony Madhavapallil and Ms Felicidad Bustillos-Jimeno) and Mr Matthew Nice (Laboratory and Scientific/ Statistics and Surveys Sections) are gratefully acknowledged. Suggested citation: ICE Drug Analysis Report, 2010 Round 1. October 2010. UNODC