drug shortages in canada
TRANSCRIPT
PMPRB Researcher Series
July 16, 2020
Drug Shortages
in Canada
2
Introduction
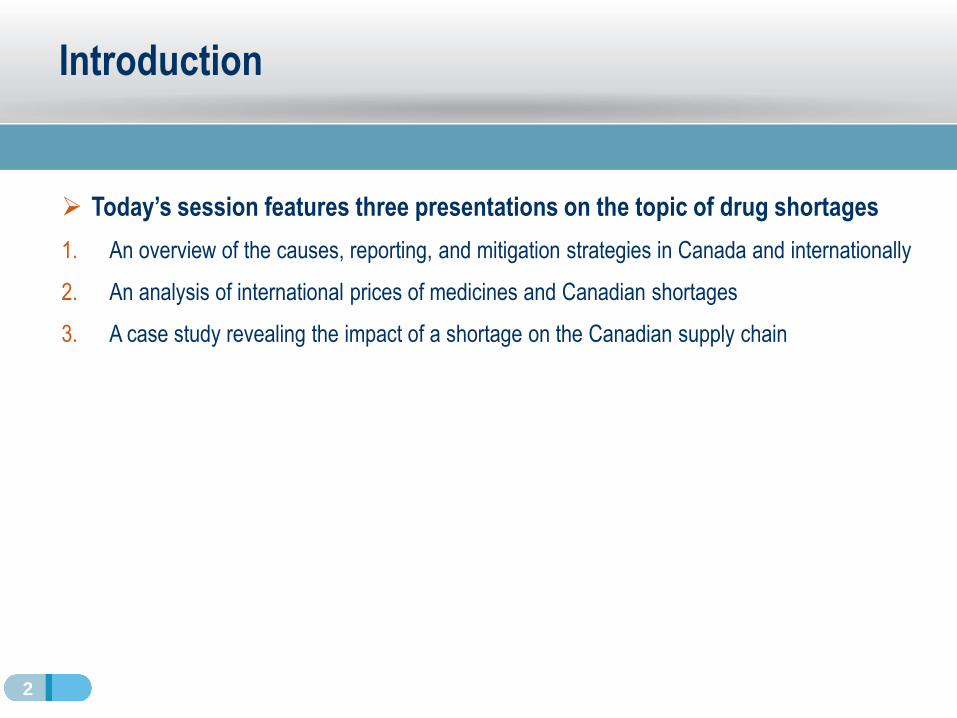
➢ Today’s session features three presentations on the topic of drug shortages
1. An overview of the causes, reporting, and mitigation strategies in Canada and internationally
2. An analysis of international prices of medicines and Canadian shortages
3. A case study revealing the impact of a shortage on the Canadian supply chain
Part 1An overview of the causes, reporting, and mitigation
strategies in Canada and internationally
Allison Carey
July 16, 2020
4
1
2
3
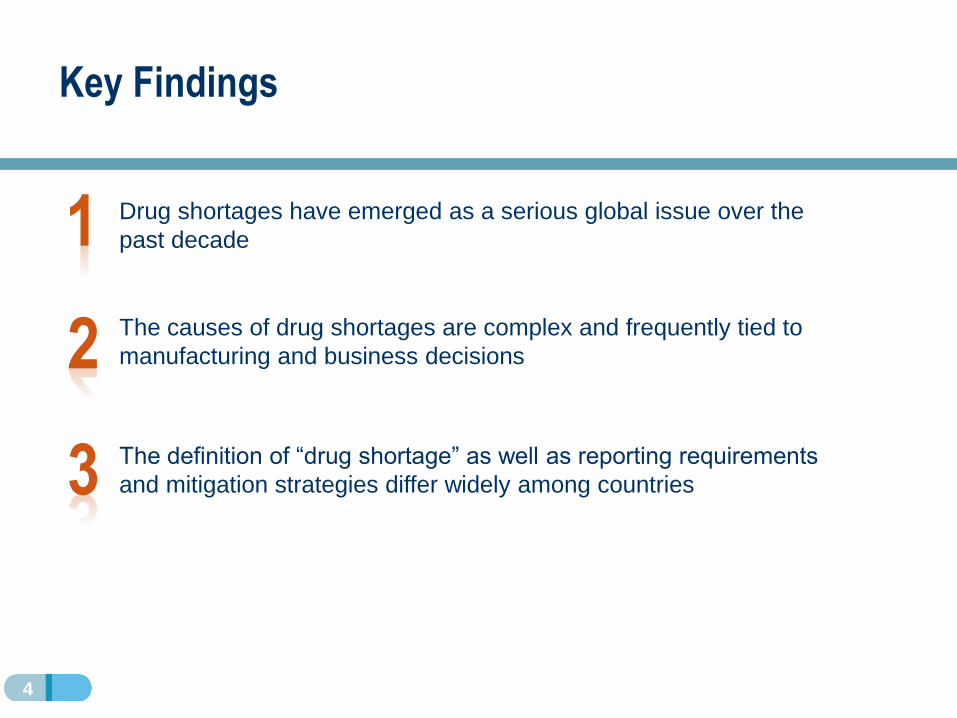
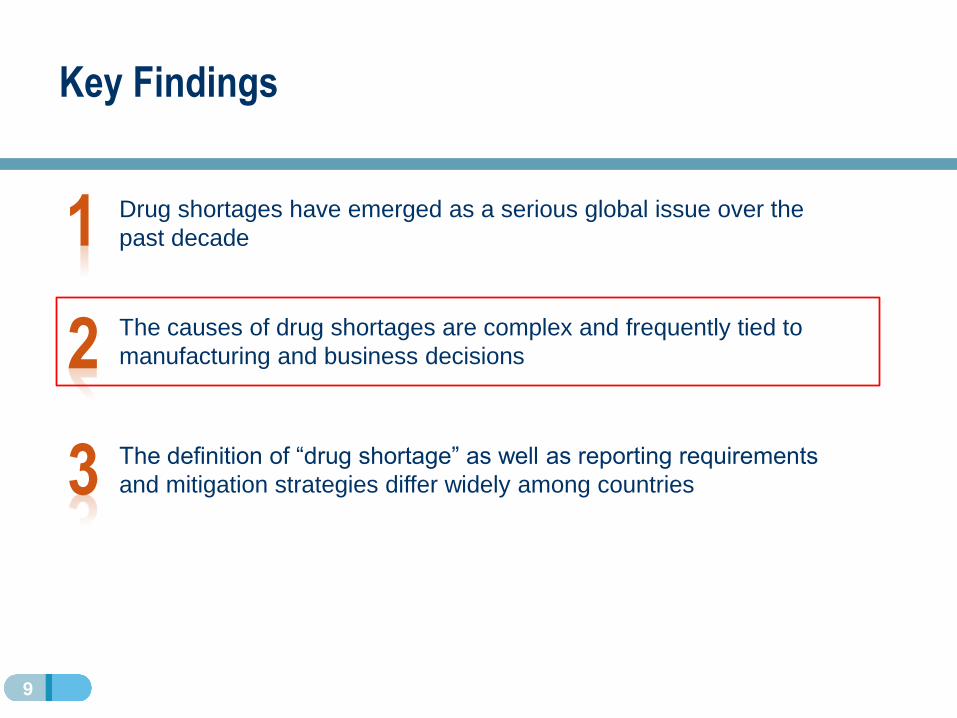
Drug shortages have emerged as a serious global issue over the
past decade
The causes of drug shortages are complex and frequently tied to
manufacturing and business decisions
The definition of “drug shortage” as well as reporting requirements
and mitigation strategies differ widely among countries
Key Findings
5
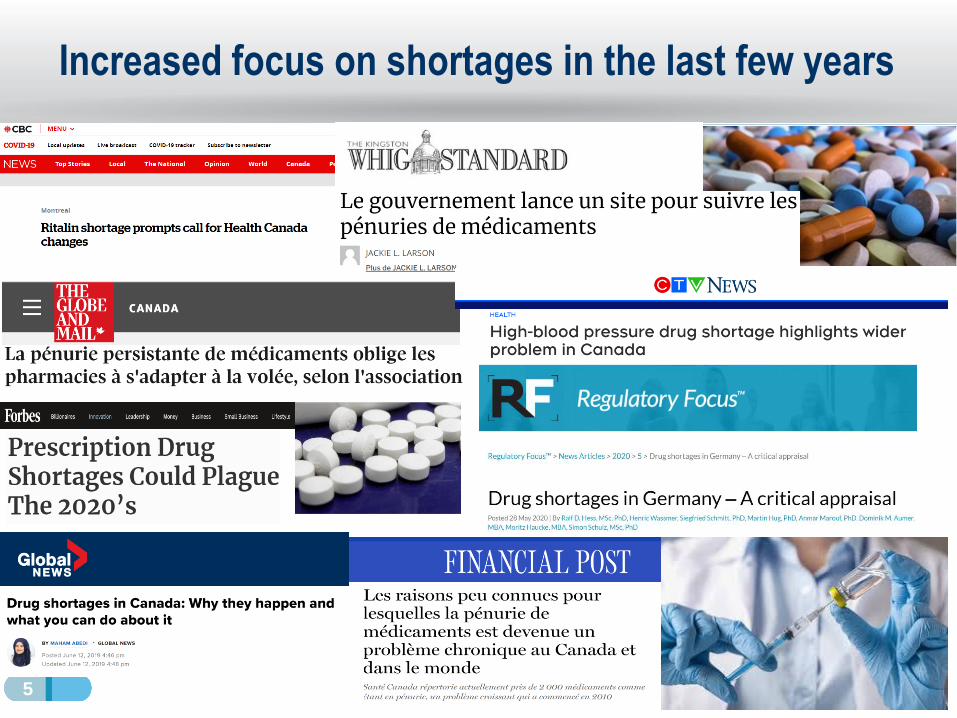
Increased focus on shortages in the last few years
6
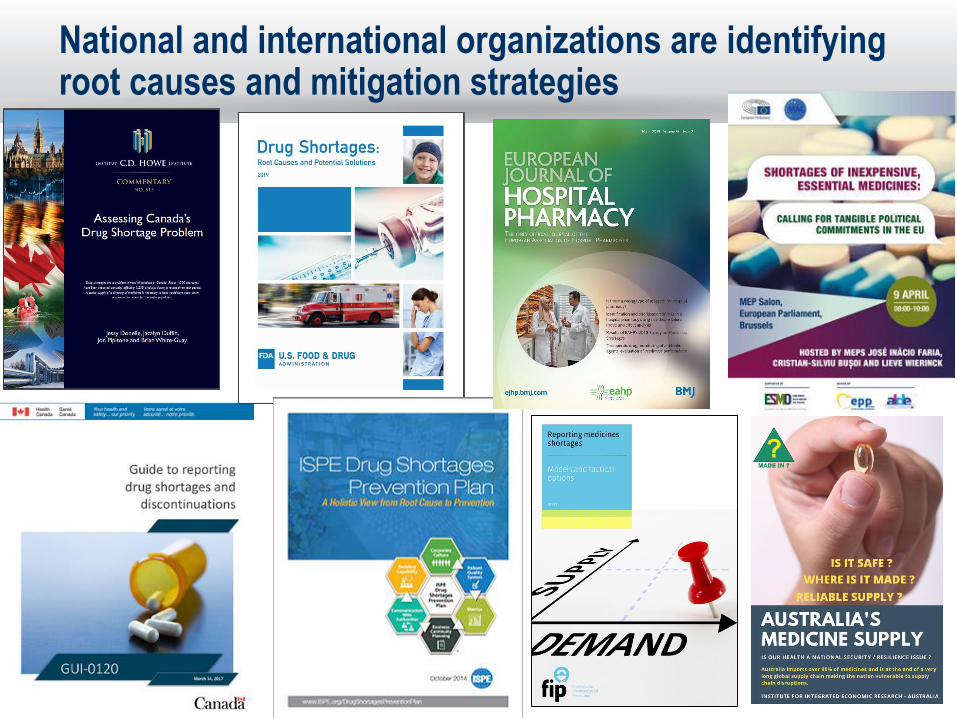
National and international organizations are identifying root causes and mitigation strategies
7
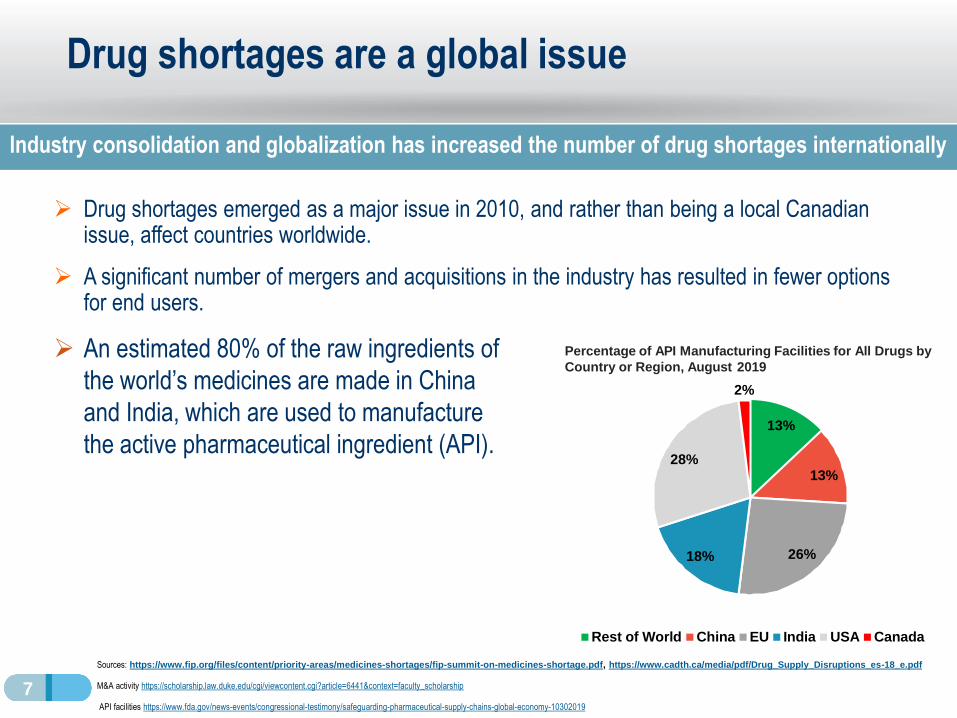
Drug shortages are a global issue
➢ Drug shortages emerged as a major issue in 2010, and rather than being a local Canadian issue, affect countries worldwide.
➢ A significant number of mergers and acquisitions in the industry has resulted in fewer options for end users.
Sources: https://www.fip.org/files/content/priority-areas/medicines-shortages/fip-summit-on-medicines-shortage.pdf, https://www.cadth.ca/media/pdf/Drug_Supply_Disruptions_es-18_e.pdf
M&A activity https://scholarship.law.duke.edu/cgi/viewcontent.cgi?article=6441&context=faculty_scholarship
API facilities https://www.fda.gov/news-events/congressional-testimony/safeguarding-pharmaceutical-supply-chains-global-economy-10302019
Industry consolidation and globalization has increased the number of drug shortages internationally
➢ An estimated 80% of the raw ingredients of
the world’s medicines are made in China
and India, which are used to manufacture
the active pharmaceutical ingredient (API).13%
13%
26%18%
28%
Percentage of API Manufacturing Facilities for All Drugs by
Country or Region, August 2019
2%
Rest of World China EU India USA Canada
8
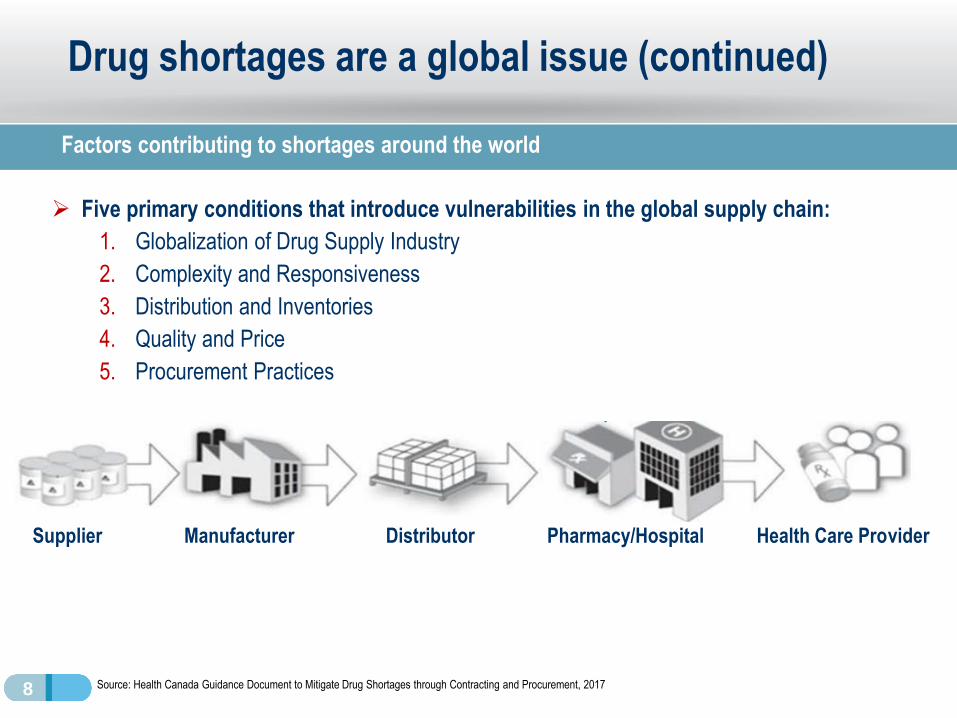
Drug shortages are a global issue (continued)
➢ Five primary conditions that introduce vulnerabilities in the global supply chain:
1. Globalization of Drug Supply Industry
2. Complexity and Responsiveness
3. Distribution and Inventories
4. Quality and Price
5. Procurement Practices
Source: Health Canada Guidance Document to Mitigate Drug Shortages through Contracting and Procurement, 2017
Factors contributing to shortages around the world
Supplier Manufacturer Distributor Pharmacy/Hospital Health Care Provider
9
1
2
3
Drug shortages have emerged as a serious global issue over the
past decade
The causes of drug shortages are complex and frequently tied to
manufacturing and business decisions
The definition of “drug shortage” as well as reporting requirements
and mitigation strategies differ widely among countries
Key Findings
10
Generic medicines are most vulnerable to shortage
Source: www.drugshortagescanada.ca
https://www.drugshortagescanada.ca/files/MSSC_Contracting_and_Procurement_2017.pdf
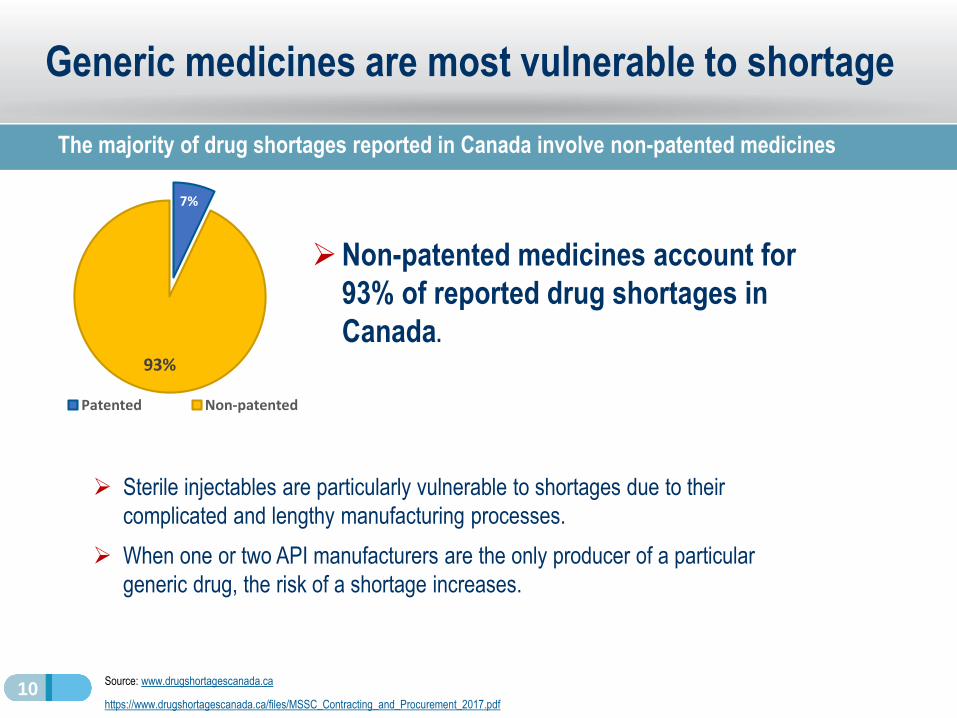
➢Non-patented medicines account for
93% of reported drug shortages in
Canada.
7%
93%
Patented Non-patented
The majority of drug shortages reported in Canada involve non-patented medicines
➢ Sterile injectables are particularly vulnerable to shortages due to their
complicated and lengthy manufacturing processes.
➢ When one or two API manufacturers are the only producer of a particular
generic drug, the risk of a shortage increases.
11
Causes of drug shortages
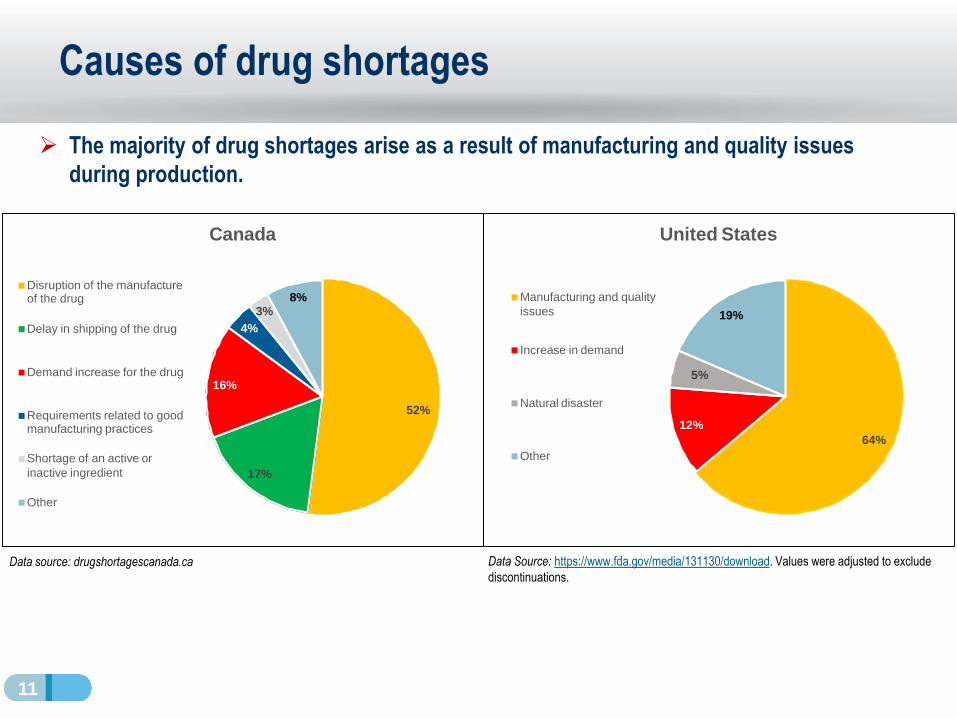
➢ The majority of drug shortages arise as a result of manufacturing and quality issues
during production.
Data source: drugshortagescanada.ca Data Source: https://www.fda.gov/media/131130/download. Values were adjusted to exclude
discontinuations.
52%
17%
16%
3%
4%
8%
Canada
Disruption of the manufacture of the drug
Delay in shipping of the drug
Demand increase for the drug
Requirements related to good manufacturing practices
Shortage of an active or
inactive ingredient
Other
64%
12%
5%
19%
United States
Manufacturing and quality
issues
Increase in demand
Natural disaster
Other
12
National and international effects of tendering
➢ Issues may arise with production or distribution when single-source tendering is used.
➢ The WHO Fair Pricing Forum, April 2019
➢ Numerous root causes for shortages were discussed, including centralized manufacturing sites and awarding of specific tenders to a small group of companies.
➢ The European Society of Medical Oncology (ESMO) convened an international consortium to study the availability of medicines internationally and develop strategic plans to mitigate shortages at global and local levels.
➢ In 2018, the pan-Canadian Pharmaceutical Alliance (pCPA), with the Canadian Generic Pharmaceutical Association (CGPA) developed a five-year initiative:
➢ Reduce the prices of nearly 70 of the most commonly prescribed drugs in Canada by 25% – 40%.
➢ Tendering is not part of this initiative.
Tendering can be associated with drug shortages through shifts in demand
Sources: Dranitsaris, G et al, Drug tendering: drug supply and shortage implications for the uptake of biosimilars. 2017,
https://www.ncbi.nlm.nih.gov/pmc/articles/PMC5628685/
WHO Fair Pricing Forum Report: https://www.who.int/medicines/access/fair_pricing/fair_price_report_2019/en/
pCPA-CGPA initiate: https://canadiangenerics.ca/news-release62/a-joint-statement-from-the-pan-canadian-pharmaceutical-alliance-and-the-canadian-generic-
pharmaceutical-association/
13
1
2
3
Drug shortages have emerged as a serious global issue over the
past decade
The causes of drug shortages are complex and frequently tied to
manufacturing and business decisions
The definition of “drug shortage” as well as reporting requirements
and mitigation strategies differ widely among countries
Key Findings
14
Drug Shortages in Canada
➢ High-profile 2012 shortage led to emergency debate in the House of Commons
• Creation of the Multi-Stakeholder Steering Committee on Drug Shortages (MSSC)
• Creation of a www.drugshortages.ca, a website for voluntary shortage reporting managed by IMC
➢ On March 14, 2017, reporting became mandatory on a new website overseen by Health Canada, www.drugshortagescanada.ca
• Number of reports increased 100% over those on the voluntary website
Source: C.D. Howe Institute Commentary No.515, 2018; Health Canada, Drug Shortages in Canada website.
Recent changes to Canadian reporting standards
15
Drug shortages in Canada (continued)
Sources: https://www.drugshortagescanada.ca/files/MSSC_Protocol_2017.pdf
Reporting strategies
➢ In Canada, drug shortage is defined as “a situation in which an authorization holder for a drug is unable to meet the demand for the drug”.
➢ Mandatory requirement for manufacturers to report all shortages (anticipated, actual, and discontinuations) on www.drugshortagescanada.ca.
➢ Nearly 2,000 drugs are currently in shortage in Canada.
➢ Drug shortages are a multi-stakeholder responsibility, requiring the coordinated involvement of federal, provincial and territorial (P/T) governments, health professional associations and industry associations.
➢ The P/T Drug Shortages Task Team coordinates communication requirements, to confirm and assess the status and details of a drug shortage.
➢ Tier 1: Anticipated shortages
➢ Tier 2: Actual shortages
➢ Tier 3: Shortages with the greatest potential impact
16
Drug shortages reporting internationally
EMA and FDA regulation
➢ EMA drug shortages catalogue is limited.
➢ Most shortages are dealt with at the national level.
➢ The definition of shortages and scope of reporting system is not uniform.
➢ Causes for drug shortages are under-reported.
➢ Limited number of countries have publicly available reporting systems.
➢ FDA drug shortages database covers current and resolved shortages updated regularly.
➢ Manufacturers are required to report information about a shortage, the reasons and the expected duration of the shortage on the FDA website.
➢ The American Society of Health System Pharmacists (ASHP) also lists drug shortages and additional information.
➢ The Center for Drug Evaluation and Research (CDER) was established to address potential or actual shortages of drugs with significant impact on public health.
17
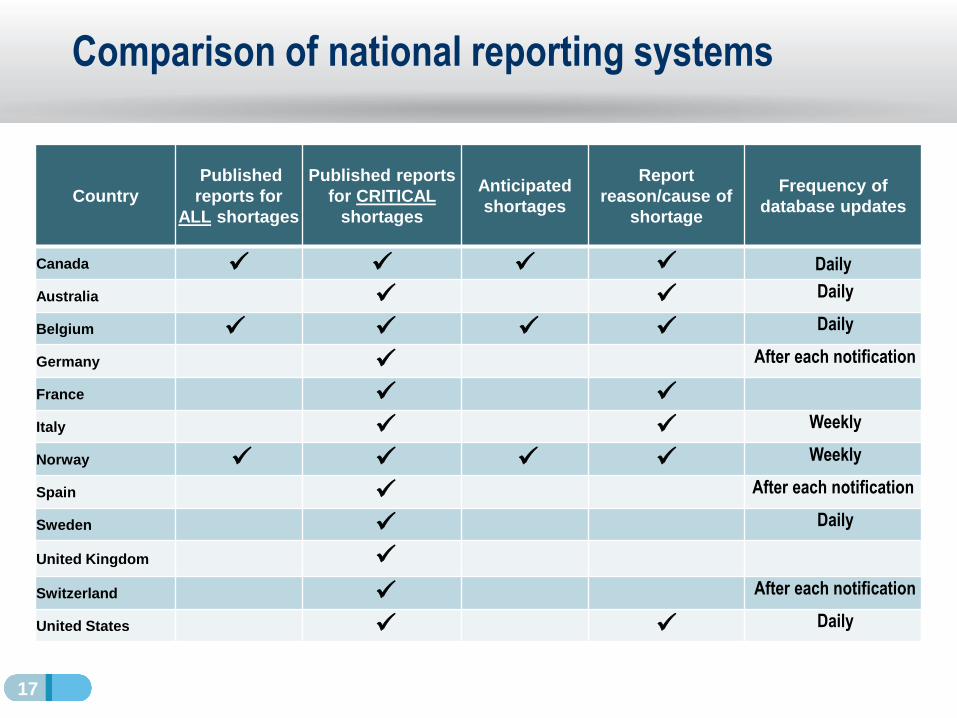
Comparison of national reporting systems
Country
Published
reports for
ALL shortages
Published reports
for CRITICAL
shortages
Anticipated
shortages
Report
reason/cause of
shortage
Frequency of
database updates
Canada ✓ ✓ ✓ ✓ Daily
Australia ✓ ✓ Daily
Belgium ✓ ✓ ✓ ✓ Daily
Germany ✓ After each notification
France ✓ ✓
Italy ✓ ✓ Weekly
Norway ✓ ✓ ✓ ✓ Weekly
Spain ✓ After each notification
Sweden ✓ Daily
United Kingdom ✓
Switzerland ✓ After each notification
United States ✓ ✓ Daily
18
Differences in Reporting Systems
➢ Types of medicine shortages reported in national databases greatly differ between countries and data is not necessarily located in one central repository.
➢ While MAHs have to report all expected or current shortages in some countries (e.g. Canada, Belgium, Norway), in other countries they only have to do so for “essential medicines” (e.g. Australia, France, Switzerland, United States).
➢ Additional online databases held by non-government entities also report shortages in certain countries (e.g. Australia, France, Switzerland, the United Kingdom and the United States).
➢ In Europe, MAHs are requested to notify the European Medicines Agency (EMA) for all centrally approved product shortages with a list of all countries impacted.
International comparisons
19
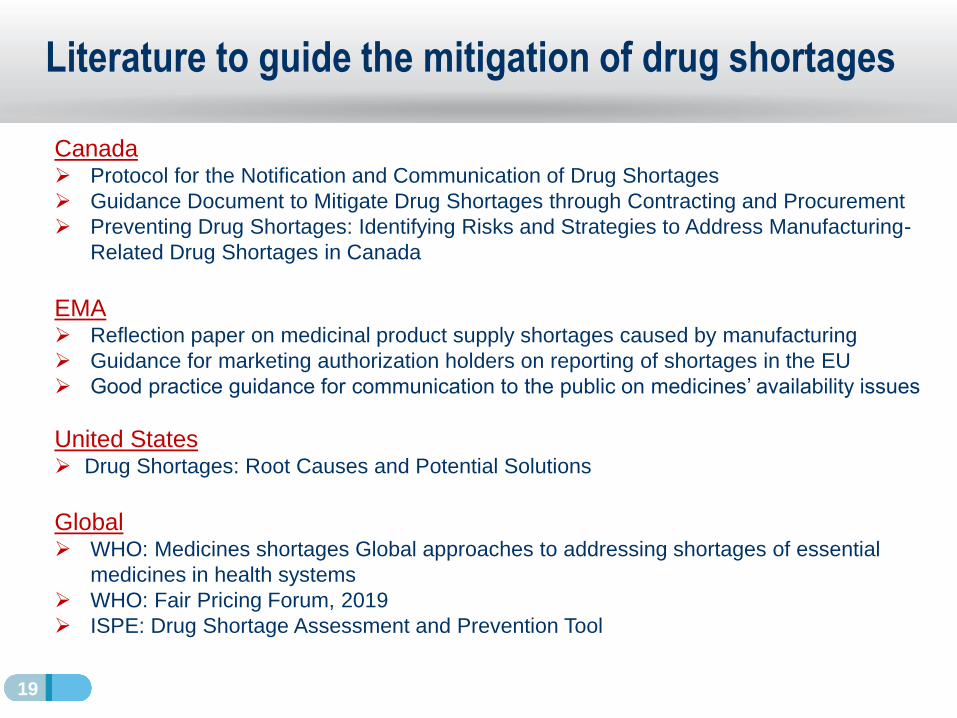
Literature to guide the mitigation of drug shortages
Canada➢ Protocol for the Notification and Communication of Drug Shortages
➢ Guidance Document to Mitigate Drug Shortages through Contracting and Procurement
➢ Preventing Drug Shortages: Identifying Risks and Strategies to Address Manufacturing-
Related Drug Shortages in Canada
EMA➢ Reflection paper on medicinal product supply shortages caused by manufacturing
➢ Guidance for marketing authorization holders on reporting of shortages in the EU
➢ Good practice guidance for communication to the public on medicines’ availability issues
United States➢ Drug Shortages: Root Causes and Potential Solutions
Global➢ WHO: Medicines shortages Global approaches to addressing shortages of essential
medicines in health systems
➢ WHO: Fair Pricing Forum, 2019
➢ ISPE: Drug Shortage Assessment and Prevention Tool
20
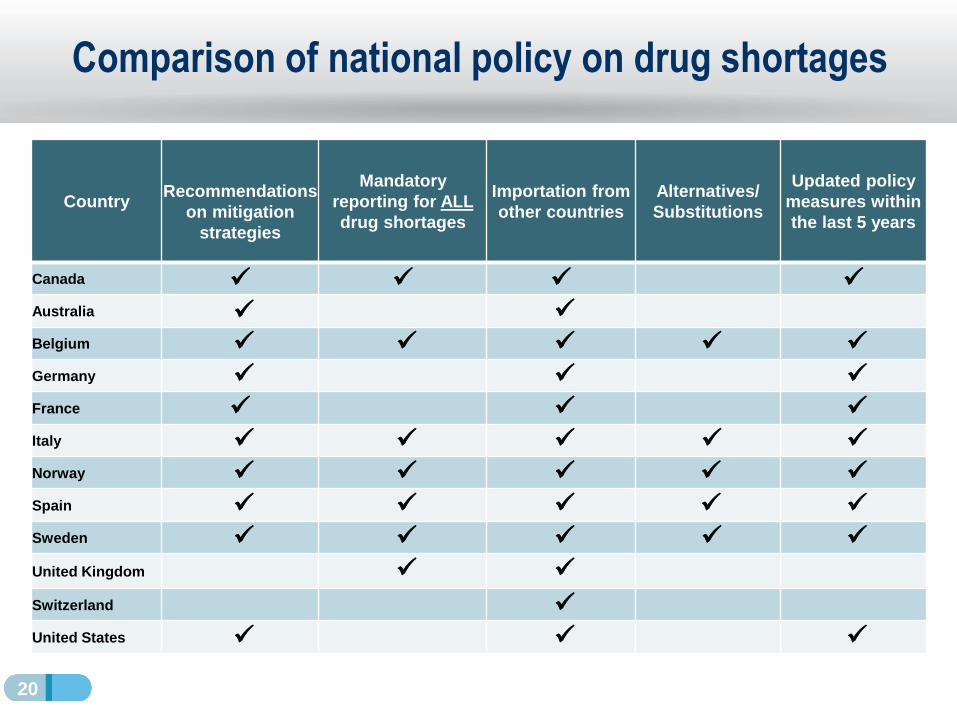
Comparison of national policy on drug shortages
CountryRecommendations
on mitigation
strategies
Mandatory
reporting for ALL
drug shortages
Importation from
other countries
Alternatives/
Substitutions
Updated policy
measures within
the last 5 years
Canada ✓ ✓ ✓ ✓
Australia ✓ ✓
Belgium ✓ ✓ ✓ ✓ ✓
Germany ✓ ✓ ✓
France ✓ ✓ ✓
Italy ✓ ✓ ✓ ✓ ✓
Norway ✓ ✓ ✓ ✓ ✓
Spain ✓ ✓ ✓ ✓ ✓
Sweden ✓ ✓ ✓ ✓ ✓
United Kingdom ✓ ✓
Switzerland ✓
United States ✓ ✓ ✓
21
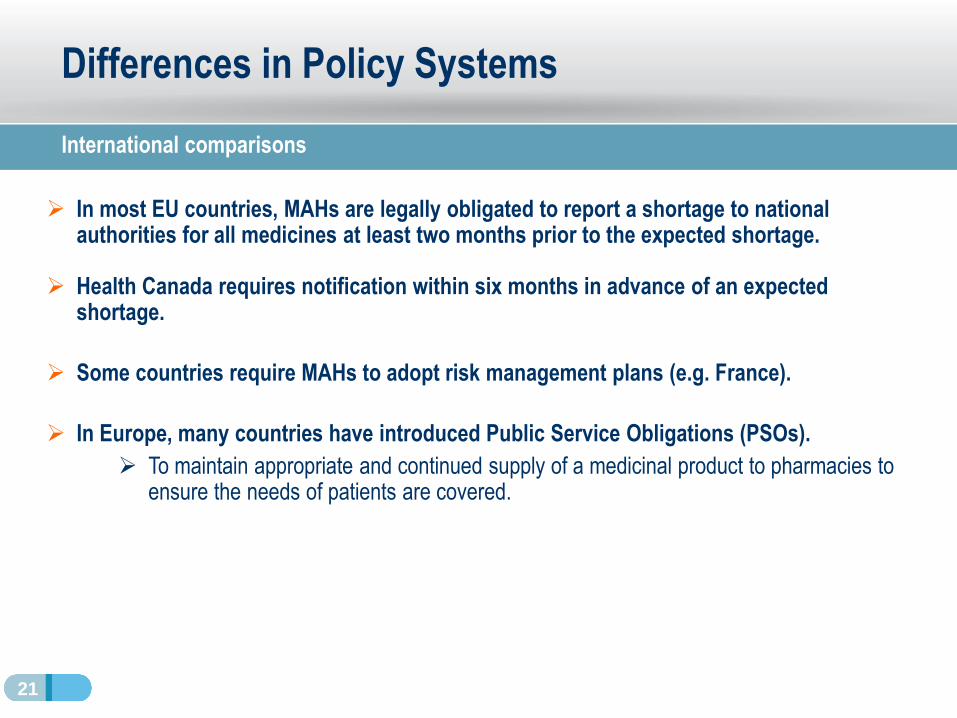
Differences in Policy Systems
➢ In most EU countries, MAHs are legally obligated to report a shortage to national authorities for all medicines at least two months prior to the expected shortage.
➢ Health Canada requires notification within six months in advance of an expected shortage.
➢ Some countries require MAHs to adopt risk management plans (e.g. France).
➢ In Europe, many countries have introduced Public Service Obligations (PSOs).
➢ To maintain appropriate and continued supply of a medicinal product to pharmacies to ensure the needs of patients are covered.
International comparisons
22
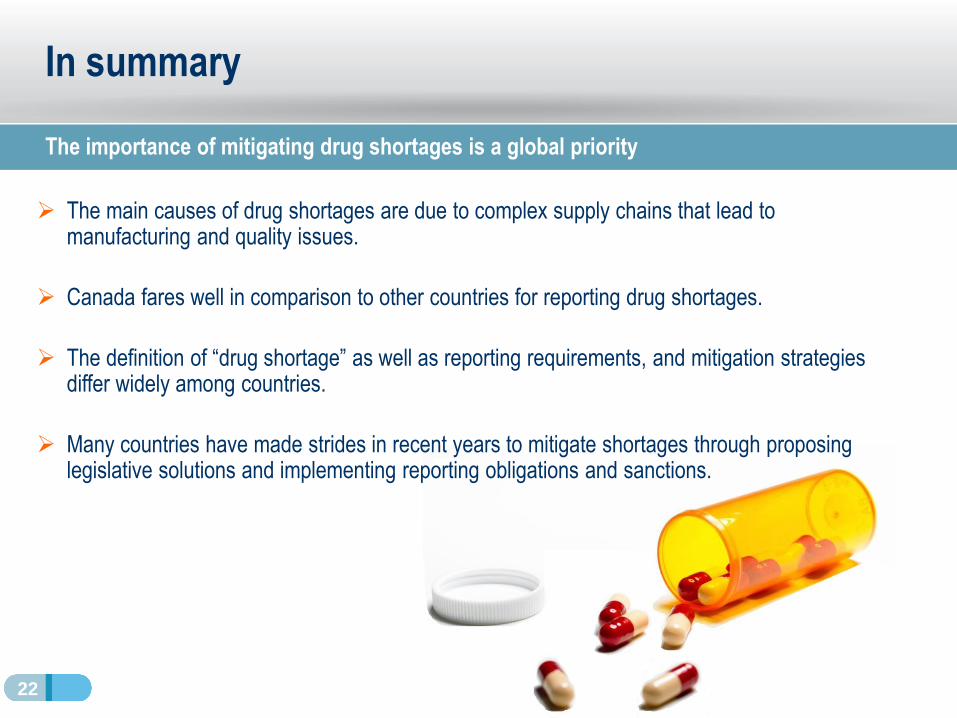
In summary
➢ The main causes of drug shortages are due to complex supply chains that lead to manufacturing and quality issues.
➢ Canada fares well in comparison to other countries for reporting drug shortages.
➢ The definition of “drug shortage” as well as reporting requirements, and mitigation strategies differ widely among countries.
➢ Many countries have made strides in recent years to mitigate shortages through proposing legislative solutions and implementing reporting obligations and sanctions.
The importance of mitigating drug shortages is a global priority
Are Canadian shortages associated with lower
prices than in other countries?
Étienne Gaudette, PhD and Yvonne Zhang
July 16, 2020
Part 2
24
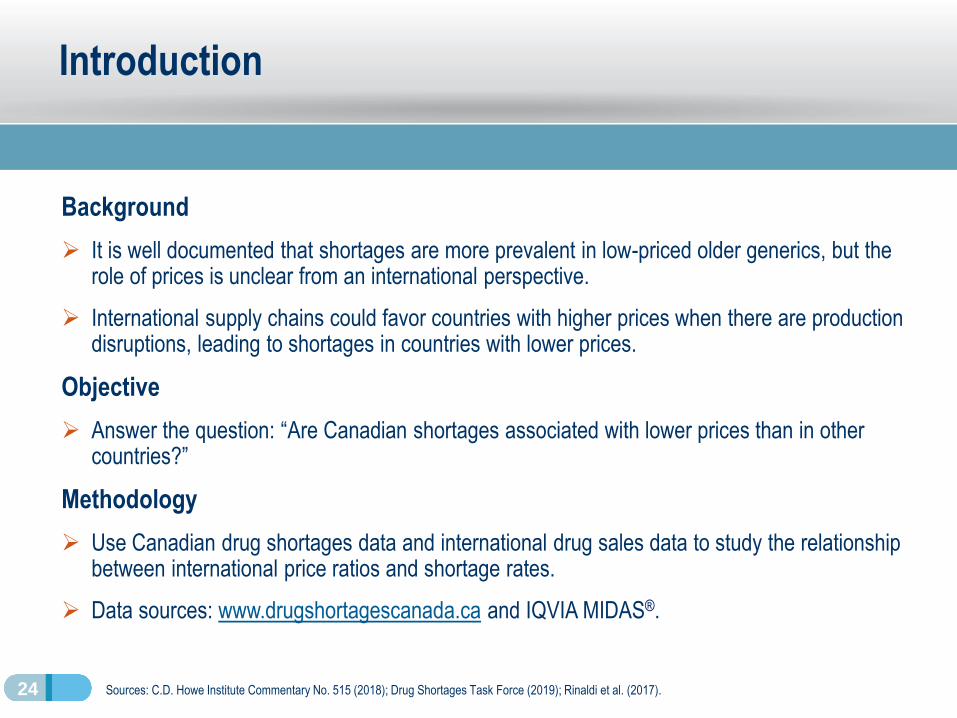
Introduction
Background
➢ It is well documented that shortages are more prevalent in low-priced older generics, but the role of prices is unclear from an international perspective.
➢ International supply chains could favor countries with higher prices when there are production disruptions, leading to shortages in countries with lower prices.
Objective
➢ Answer the question: “Are Canadian shortages associated with lower prices than in other countries?”
Methodology
➢ Use Canadian drug shortages data and international drug sales data to study the relationship between international price ratios and shortage rates.
➢ Data sources: www.drugshortagescanada.ca and IQVIA MIDAS®.
Sources: C.D. Howe Institute Commentary No. 515 (2018); Drug Shortages Task Force (2019); Rinaldi et al. (2017).
25
1
2
Over 90% of drug shortages occur in the non-patented space.
There is no clear association between the relative price of medicines
and shortages.
Key Findings
26
Recent trends in Canadian shortages
➢ We use www.drugshortagescanada.ca data to explore Canada’s drug shortages from March 2017 to April 2020.
▪ Trends in the number of shortage reports filed every month and ingredients going in shortage
▪ Shortage outcomes and duration
▪ Patented status of medicines in shortage
➢ Shortages are reported by manufacturers at the drug identification number (DIN) and package size level
▪ Each distinct strength, form, and packaging size of a pharmaceutical ingredient in shortage are reported separately
1
27
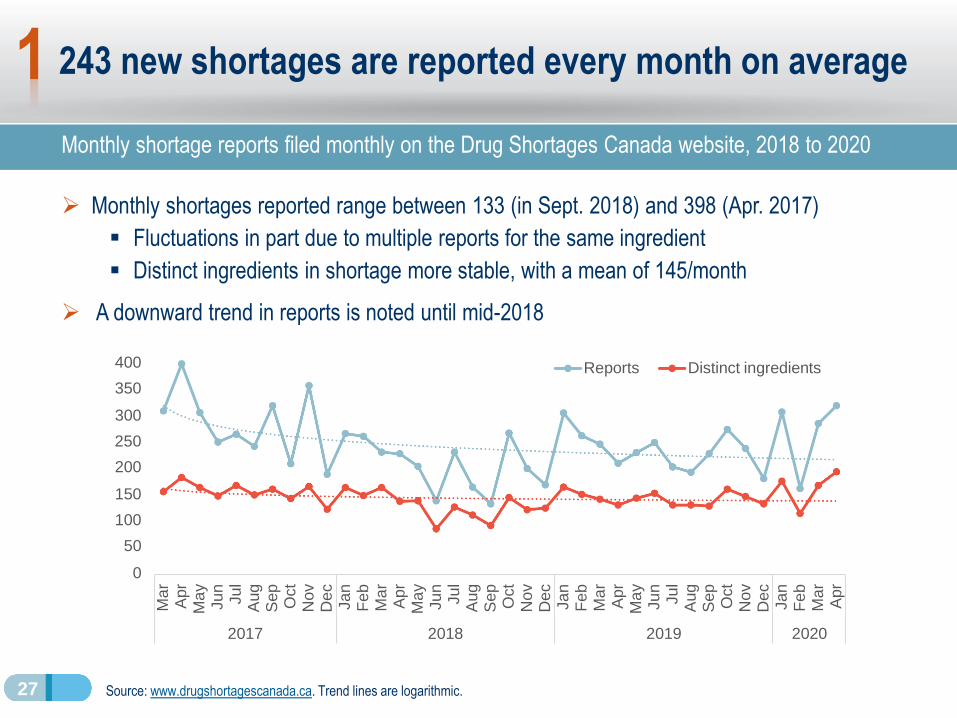
243 new shortages are reported every month on average
Monthly shortage reports filed monthly on the Drug Shortages Canada website, 2018 to 2020
➢ Monthly shortages reported range between 133 (in Sept. 2018) and 398 (Apr. 2017)
▪ Fluctuations in part due to multiple reports for the same ingredient
▪ Distinct ingredients in shortage more stable, with a mean of 145/month
➢ A downward trend in reports is noted until mid-2018
Source: www.drugshortagescanada.ca. Trend lines are logarithmic.
1
400
350
300
250
200
150
100
50
0
Ma
r
Apr
M
ay
Ju
n
Ju
l
Aug
Sep
O
ct
N
ov
Dec
Ja
n
Fe
b
Ma
r
Apr
M
ay
Ju
n
Ju
l
Aug
Sep
O
ct
N
ov
De
c
Ja
n
Fe
b
Ma
r
Apr
M
ay
Ju
n
Ju
l
Aug
Sep
O
ct
N
ov
Dec
Ja
n
Fe
b
Ma
r
Apr
2017 2018 2019 2020
Reports Distinct ingredients
28
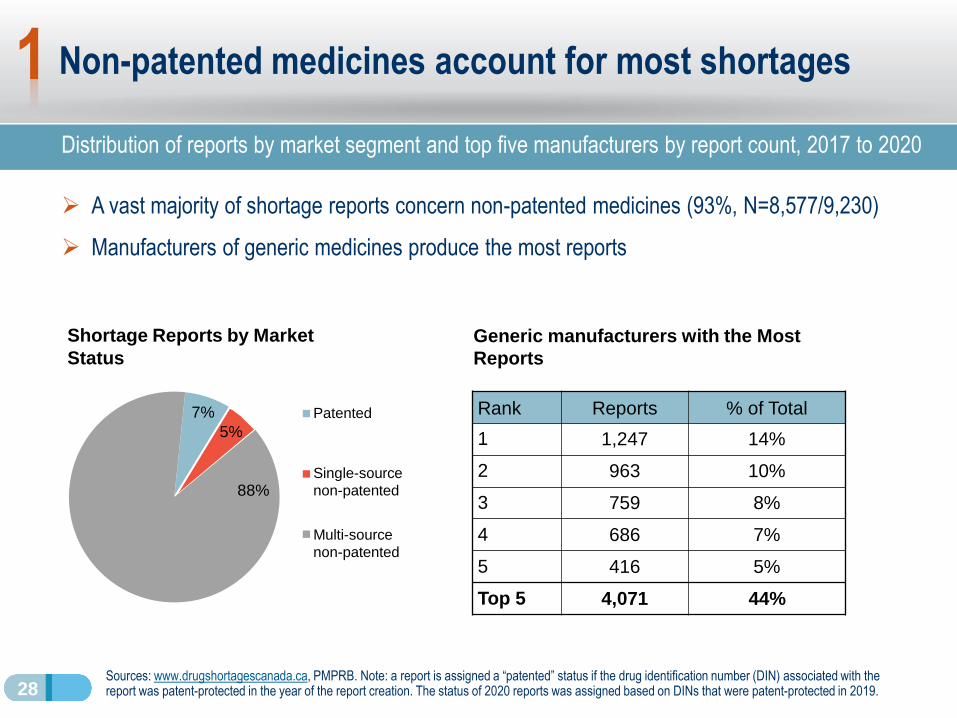
Non-patented medicines account for most shortages
Distribution of reports by market segment and top five manufacturers by report count, 2017 to 2020
➢ A vast majority of shortage reports concern non-patented medicines (93%, N=8,577/9,230)
➢ Manufacturers of generic medicines produce the most reports
Sources: www.drugshortagescanada.ca, PMPRB. Note: a report is assigned a “patented” status if the drug identification number (DIN) associated with the report was patent-protected in the year of the report creation. The status of 2020 reports was assigned based on DINs that were patent-protected in 2019.
Generic manufacturers with the Most
Reports
Rank Reports % of Total
1 1,247 14%
2 963 10%
3 759 8%
4 686 7%
5 416 5%
Top 5 4,071 44%
1
7%
5%
88%
Shortage Reports by Market
Status
Patented
Single-source
non-patented
Multi-source
non-patented
29
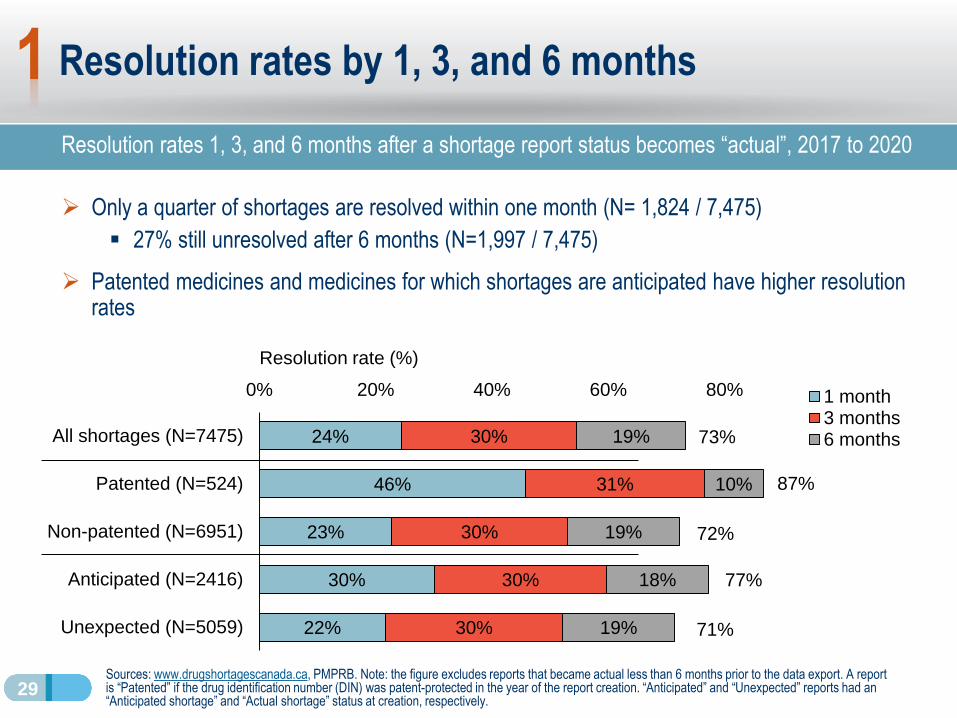
Resolution rates by 1, 3, and 6 months
Resolution rates 1, 3, and 6 months after a shortage report status becomes “actual”, 2017 to 2020
➢ Only a quarter of shortages are resolved within one month (N= 1,824 / 7,475)
▪ 27% still unresolved after 6 months (N=1,997 / 7,475)
➢ Patented medicines and medicines for which shortages are anticipated have higher resolution rates
Sources: www.drugshortagescanada.ca, PMPRB. Note: the figure excludes reports that became actual less than 6 months prior to the data export. A report is “Patented” if the drug identification number (DIN) was patent-protected in the year of the report creation. “Anticipated” and “Unexpected” reports had an “Anticipated shortage” and “Actual shortage” status at creation, respectively.
22%
30%
23%
46%
24%
30%
30%
30%
31%
30%
19%
18%
19%
10%
19%
71%
77%
72%
87%
73%
0% 20% 40% 60% 80%
Unexpected (N=5059)
Anticipated (N=2416)
Non-patented (N=6951)
Patented (N=524)
All shortages (N=7475)
1 month3 months6 months
Resolution rate (%)
1
30
1
2
Over 90% of drug shortages occur in the non-patented space.
There is no clear association between the relative price of medicines
and shortages.
Key Findings
31
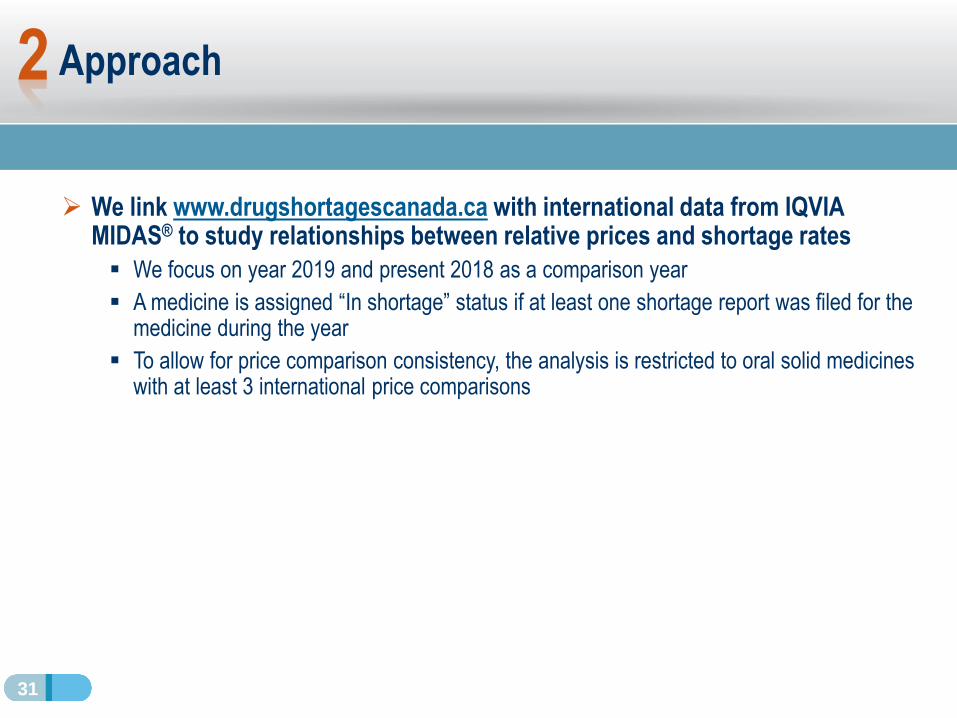
Approach
➢ We link www.drugshortagescanada.ca with international data from IQVIA MIDAS® to study relationships between relative prices and shortage rates
▪ We focus on year 2019 and present 2018 as a comparison year
▪ A medicine is assigned “In shortage” status if at least one shortage report was filed for the medicine during the year
▪ To allow for price comparison consistency, the analysis is restricted to oral solid medicines with at least 3 international price comparisons
2
32
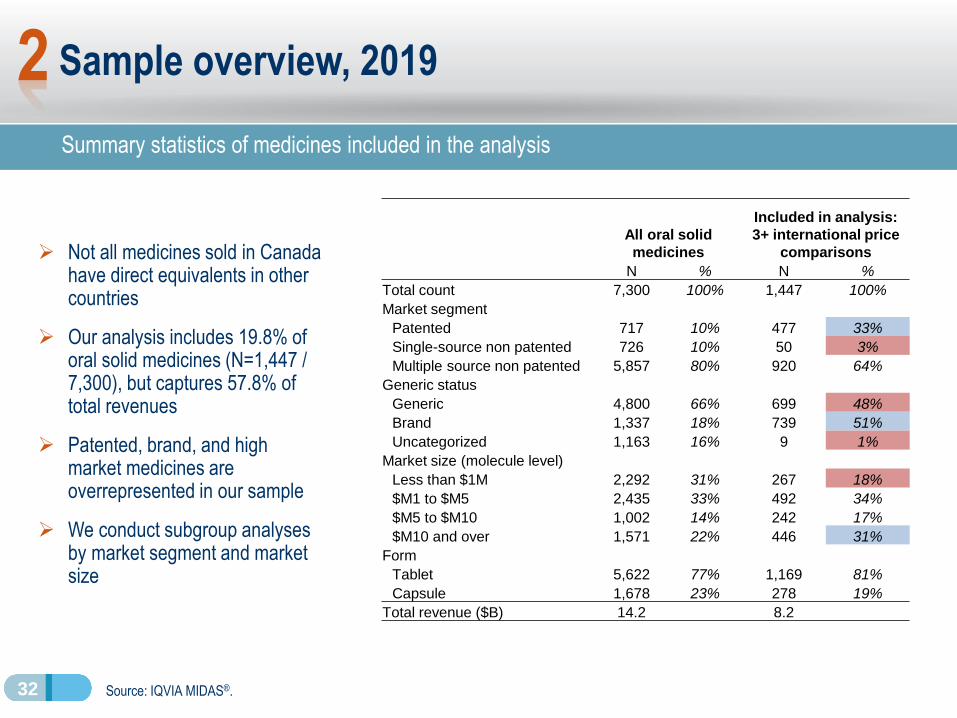
Summary statistics of medicines included in the analysis
Sample overview, 2019
Source: IQVIA MIDAS®.
➢ Not all medicines sold in Canada have direct equivalents in other countries
➢ Our analysis includes 19.8% of oral solid medicines (N=1,447 / 7,300), but captures 57.8% of total revenues
➢ Patented, brand, and high market medicines are overrepresented in our sample
➢ We conduct subgroup analyses by market segment and market size
All oral solid
medicines
Included in analysis:
3+ international price
comparisons
N % N %
Total count 7,300 100% 1,447 100%
Market segment
Patented 717 10% 477 33%
Single-source non patented 726 10% 50 3%
Multiple source non patented 5,857 80% 920 64%
Generic status
Generic 4,800 66% 699 48%
Brand 1,337 18% 739 51%
Uncategorized 1,163 16% 9 1%
Market size (molecule level)
Less than $1M 2,292 31% 267 18%
$M1 to $M5 2,435 33% 492 34%
$M5 to $M10 1,002 14% 242 17%
$M10 and over 1,571 22% 446 31%
Form
Tablet 5,622 77% 1,169 81%
Capsule 1,678 23% 278 19%
Total revenue ($B) 14.2 8.2
2
33
Foreign-to-Canadian price ratios (FTC)
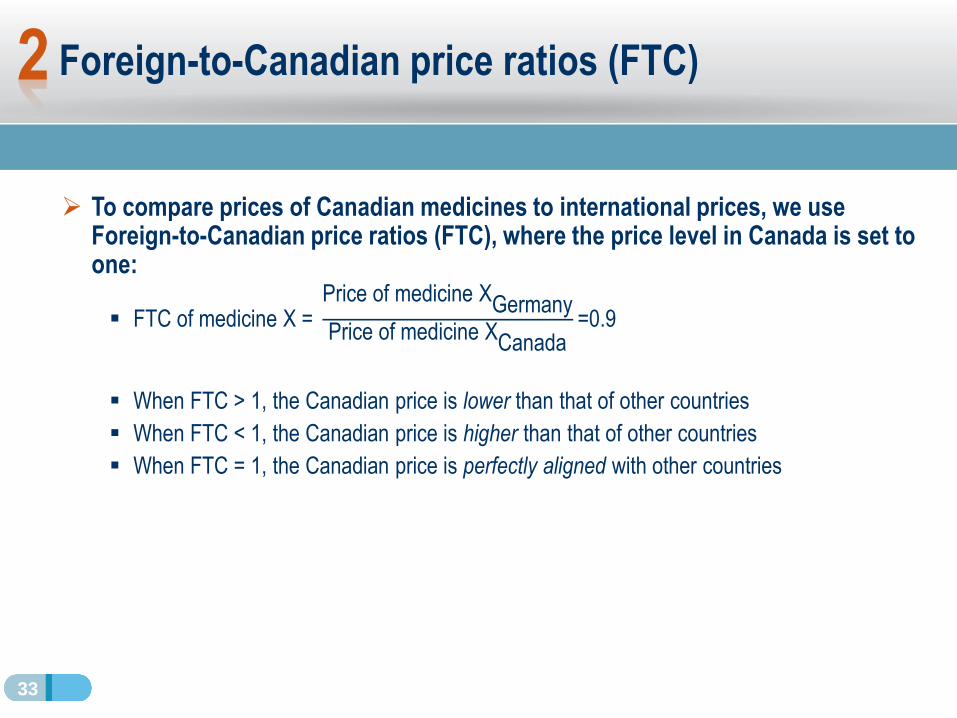
➢ To compare prices of Canadian medicines to international prices, we use Foreign-to-Canadian price ratios (FTC), where the price level in Canada is set to one:
▪ FTC of medicine X =Price of medicine XGermanyPrice of medicine XCanada
=0.9
▪ When FTC > 1, the Canadian price is lower than that of other countries
▪ When FTC < 1, the Canadian price is higher than that of other countries
▪ When FTC = 1, the Canadian price is perfectly aligned with other countries
2
34
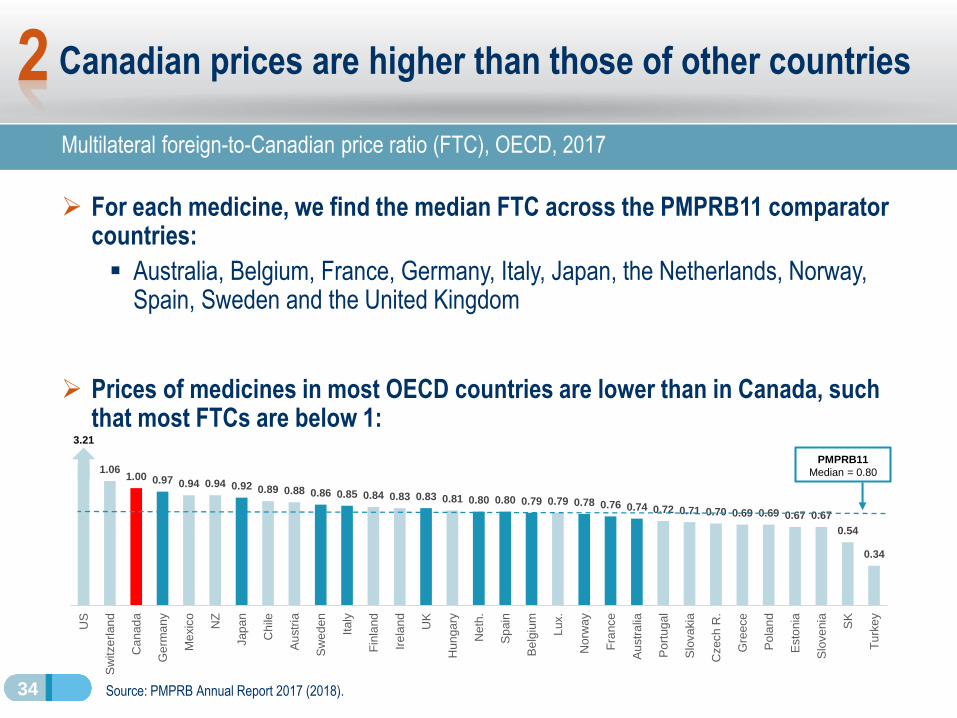
Multilateral foreign-to-Canadian price ratio (FTC), OECD, 2017
➢ For each medicine, we find the median FTC across the PMPRB11 comparator countries:
▪ Australia, Belgium, France, Germany, Italy, Japan, the Netherlands, Norway, Spain, Sweden and the United Kingdom
➢ Prices of medicines in most OECD countries are lower than in Canada, such that most FTCs are below 1:
Canadian prices are higher than those of other countries
Source: PMPRB Annual Report 2017 (2018).
2
1.061.00 0.97 0.94 0.94 0.92 0.89 0.88 0.86 0.85 0.84 0.83 0.83 0.81 0.80 0.80 0.79 0.79 0.78 0.76 0.74 0.72 0.71 0.70 0.69 0.69 0.67 0.67
0.54
0.34
US
Sw
itze
rlan
d
Ca
nad
a
Ge
rma
ny
Me
xic
o
NZ
Jap
an
Chile
Au
str
ia
Sw
ed
en
Italy
Fin
land
Ire
lan
d
UK
Hun
ga
ry
Neth
.
Sp
ain
Be
lgiu
m
Lux.
Norw
ay
Fra
nce
Au
str
alia
Po
rtug
al
Slo
va
kia
Czech
R.
Gre
ece
Po
lan
d
Esto
nia
Slo
ve
nia
SK
Tu
rke
y
3.21
PMPRB11
Median = 0.80
35
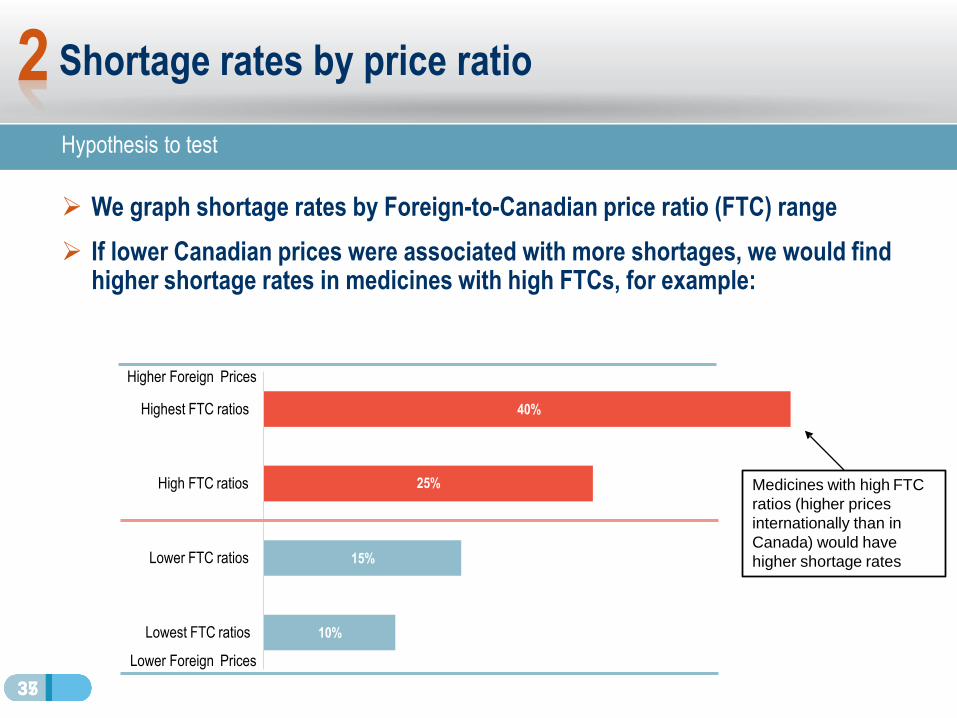
Hypothesis to test
➢ We graph shortage rates by Foreign-to-Canadian price ratio (FTC) range
➢ If lower Canadian prices were associated with more shortages, we would find higher shortage rates in medicines with high FTCs, for example:
Shortage rates by price ratio2
Lower FTC ratios
High FTC ratios
Higher Foreign Prices
Highest FTC ratios
Lowest FTC ratios
Lower Foreign Prices
37
Medicines with high FTC
ratios (higher prices
internationally than in
Canada) would have
higher shortage rates
40%
25%
15%
10%
36
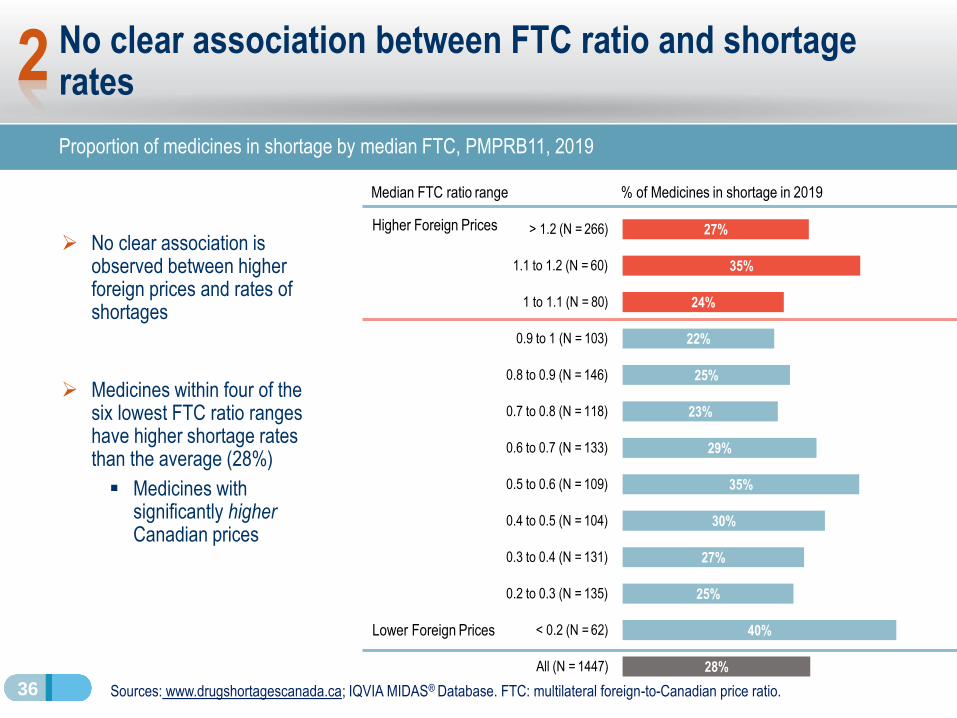
➢ No clear association is observed between higher foreign prices and rates of shortages
➢ Medicines within four of the six lowest FTC ratio ranges have higher shortage rates than the average (28%)
▪ Medicines with significantly higherCanadian prices
No clear association between FTC ratio and shortage rates
Proportion of medicines in shortage by median FTC, PMPRB11, 2019
Sources: www.drugshortagescanada.ca; IQVIA MIDAS® Database. FTC: multilateral foreign-to-Canadian price ratio.
2
Median FTC ratio range
Higher Foreign Prices
% of Medicines in shortage in 2019
28%
40%
25%
27%
30%
35%
29%
23%
25%
22%
24%
35%
27%
All (N = 1447)
< 0.2 (N = 62)
0.2 to 0.3 (N = 135)
0.3 to 0.4 (N = 131)
0.4 to 0.5 (N = 104)
0.5 to 0.6 (N = 109)
0.6 to 0.7 (N = 133)
0.7 to 0.8 (N = 118)
0.8 to 0.9 (N = 146)
0.9 to 1 (N = 103)
1 to 1.1 (N = 80)
1.1 to 1.2 (N = 60)
> 1.2 (N = 266)
Lower Foreign Prices
37
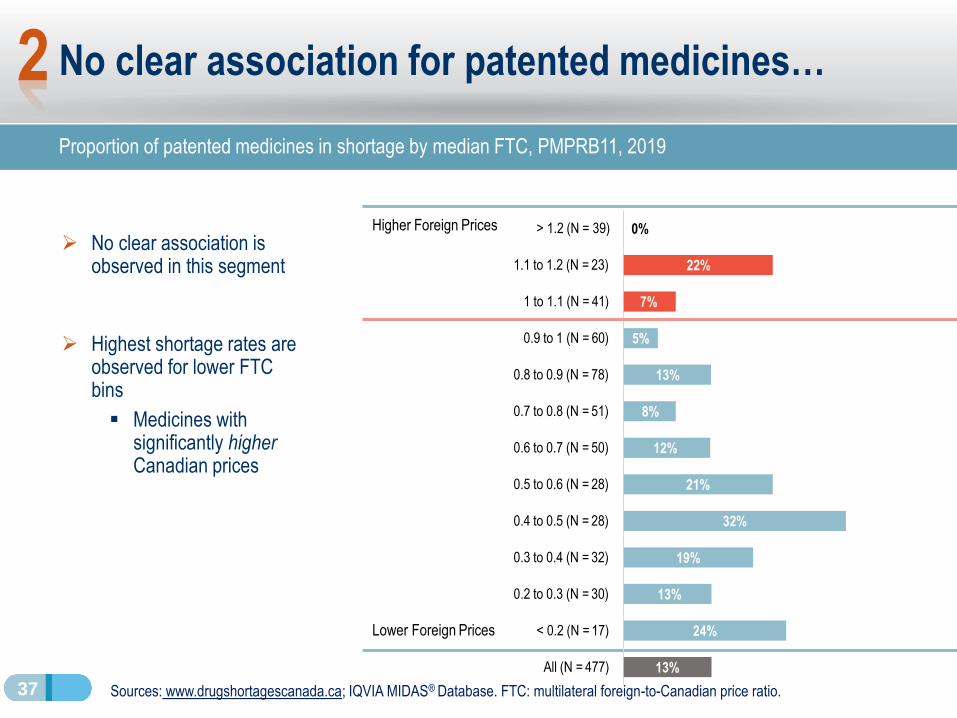
➢ No clear association is observed in this segment
➢ Highest shortage rates are observed for lower FTC bins
▪ Medicines with significantly higherCanadian prices
No clear association for patented medicines…
Proportion of patented medicines in shortage by median FTC, PMPRB11, 2019
Sources: www.drugshortagescanada.ca; IQVIA MIDAS® Database. FTC: multilateral foreign-to-Canadian price ratio.
2
Higher Foreign Prices
Lower Foreign Prices
13%
24%
13%
19%
32%
21%
12%
8%
13%
5%
7%
22%
All (N = 477)
< 0.2 (N = 17)
0.2 to 0.3 (N = 30)
0.3 to 0.4 (N = 32)
0.4 to 0.5 (N = 28)
0.5 to 0.6 (N = 28)
0.6 to 0.7 (N = 50)
0.7 to 0.8 (N = 51)
0.8 to 0.9 (N = 78)
0.9 to 1 (N = 60)
1 to 1.1 (N = 41)
1.1 to 1.2 (N = 23)
> 1.2 (N = 39) 0%
38
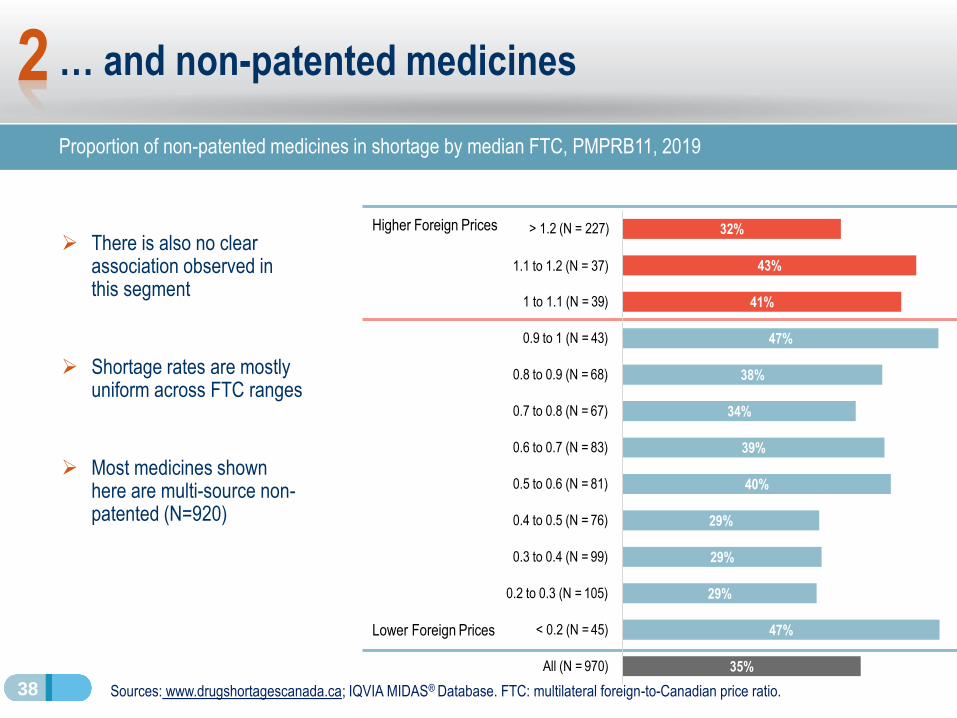
➢ There is also no clear association observed in this segment
➢ Shortage rates are mostly uniform across FTC ranges
➢ Most medicines shown here are multi-source non-patented (N=920)
… and non-patented medicines
Proportion of non-patented medicines in shortage by median FTC, PMPRB11, 2019
Sources: www.drugshortagescanada.ca; IQVIA MIDAS® Database. FTC: multilateral foreign-to-Canadian price ratio.
2
Higher Foreign Prices
47%
29%
29%
29%
40%
39%
34%
38%
47%
41%
43%
< 0.2 (N = 45)
0.2 to 0.3 (N = 105)
0.3 to 0.4 (N = 99)
0.4 to 0.5 (N = 76)
0.5 to 0.6 (N = 81)
0.6 to 0.7 (N = 83)
0.7 to 0.8 (N = 67)
0.8 to 0.9 (N = 68)
0.9 to 1 (N = 43)
1 to 1.1 (N = 39)
> 1.2 (N = 227) 32%
1.1 to 1.2 (N = 37)
Lower Foreign Prices
All (N = 970) 35%
39
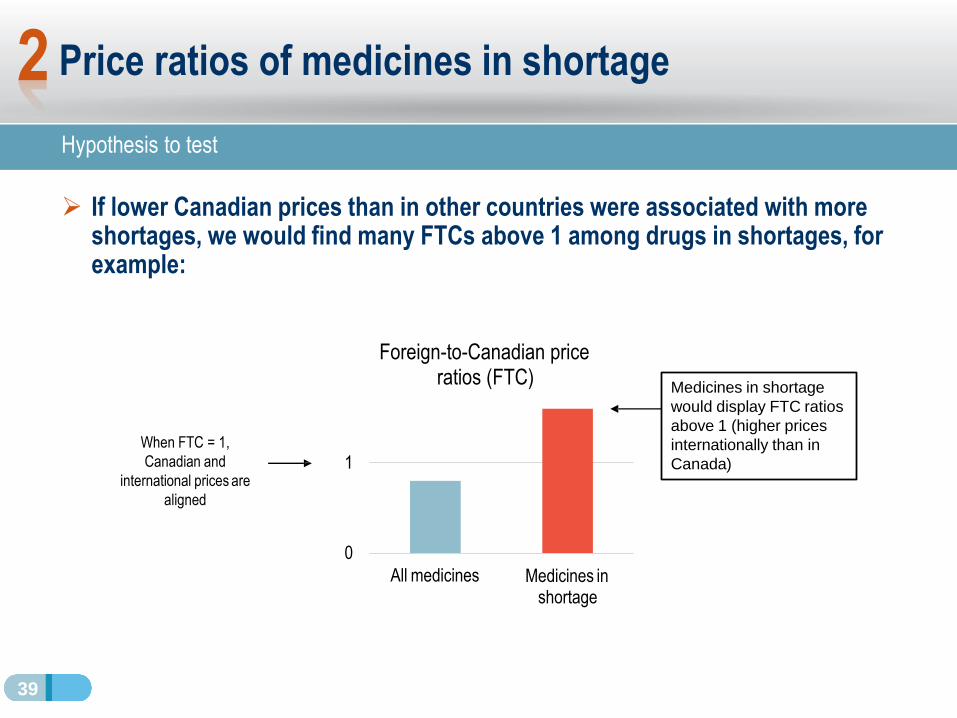
Hypothesis to test
➢ If lower Canadian prices than in other countries were associated with more shortages, we would find many FTCs above 1 among drugs in shortages, for example:
Price ratios of medicines in shortage
Medicines in shortage
would display FTC ratios
above 1 (higher prices
internationally than in
Canada)
When FTC = 1,
Canadian and
international prices are
aligned
0
1
All medicines Medicines in shortage
Foreign-to-Canadian price ratios (FTC)
2
40
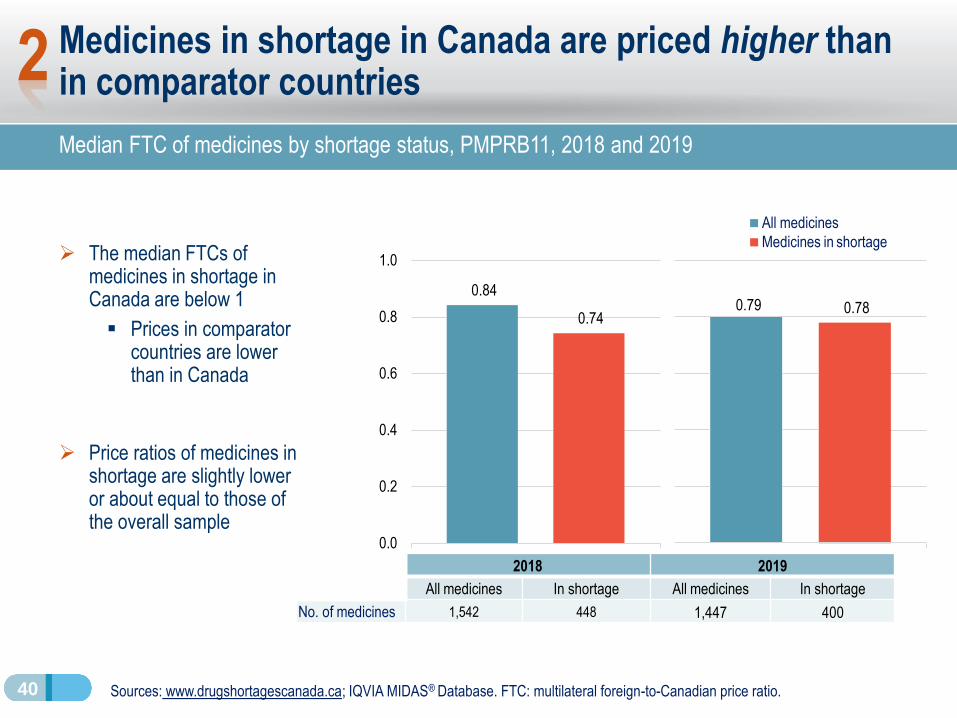
Medicines in shortage in Canada are priced higher than in comparator countries
Median FTC of medicines by shortage status, PMPRB11, 2018 and 2019
➢ The median FTCs of medicines in shortage in Canada are below 1
▪ Prices in comparator countries are lower than in Canada
➢ Price ratios of medicines in shortage are slightly lower or about equal to those of the overall sample
Sources: www.drugshortagescanada.ca; IQVIA MIDAS® Database. FTC: multilateral foreign-to-Canadian price ratio.
0.79 0.78
Median
0.84
0.74
0.0
0.2
0.4
0.6
0.8
1.0
Median
All medicines
Medicines in shortage
2018 2019
All medicines In shortage All medicines In shortage
No. of medicines 1,542 448 1,447 400
2
41
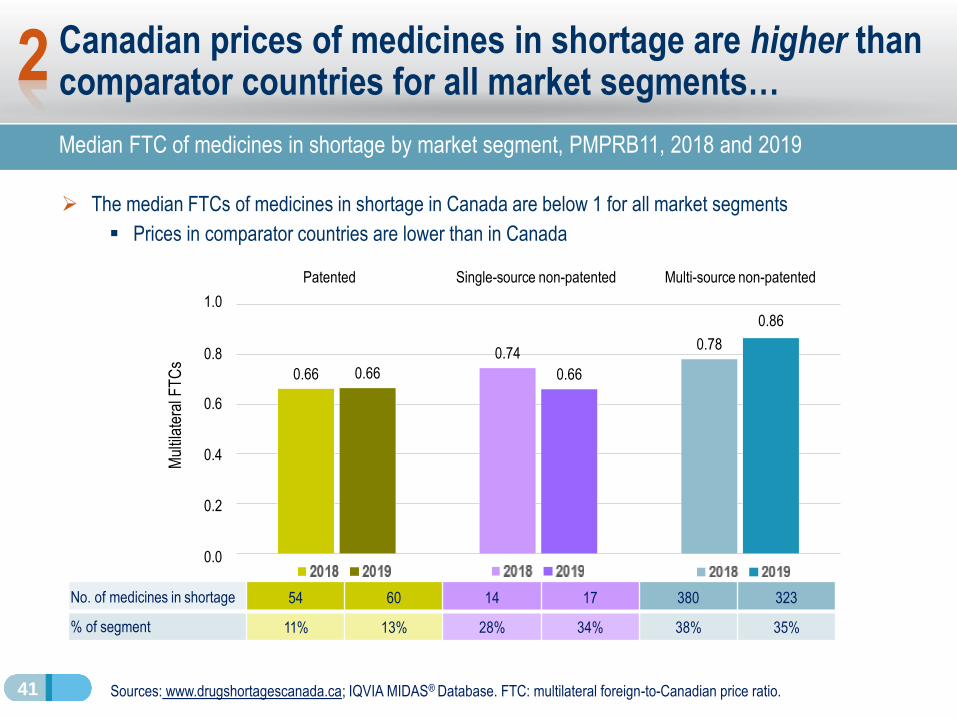
Canadian prices of medicines in shortage are higher than comparator countries for all market segments…
Median FTC of medicines in shortage by market segment, PMPRB11, 2018 and 2019
➢ The median FTCs of medicines in shortage in Canada are below 1 for all market segments
▪ Prices in comparator countries are lower than in Canada
Sources: www.drugshortagescanada.ca; IQVIA MIDAS® Database. FTC: multilateral foreign-to-Canadian price ratio.
0.66
0.740.78
0.66 0.66
0.6
0.4
0.2
0.0
0.8
Mul
tilat
eral
FT
Cs
No. of medicines in shortage 54 60 14 17 380 323
% of segment 11% 13% 28% 34% 38% 35%
Patented Single-source non-patented Multi-source non-patented
1.0
0.86
2
42
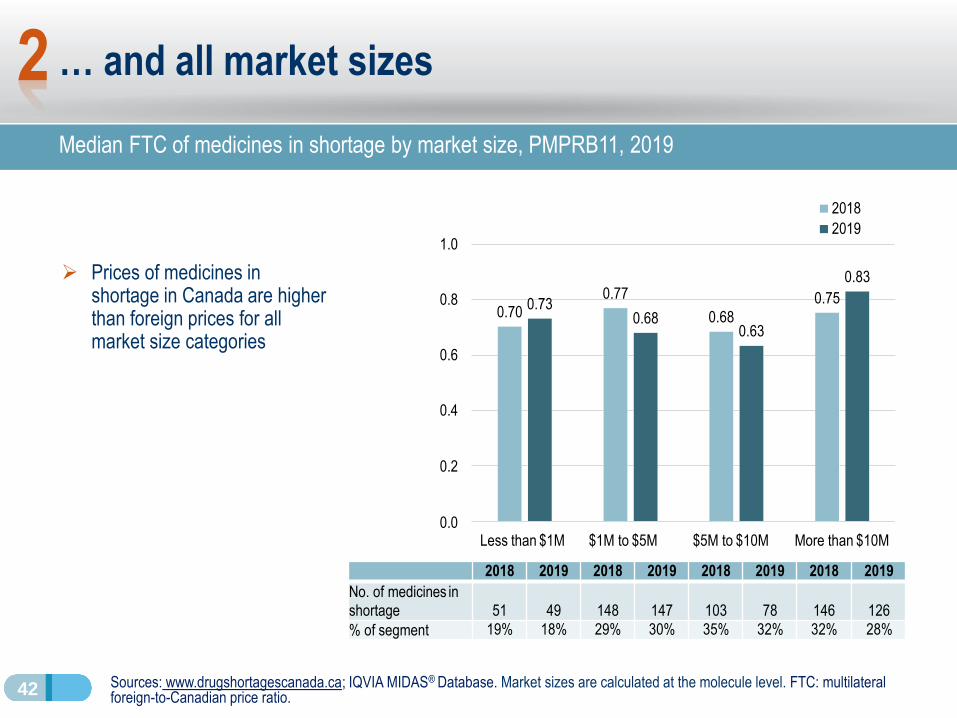
… and all market sizes
➢ Prices of medicines in shortage in Canada are higher than foreign prices for all market size categories
Sources: www.drugshortagescanada.ca; IQVIA MIDAS® Database. Market sizes are calculated at the molecule level. FTC: multilateral foreign-to-Canadian price ratio.
Median FTC of medicines in shortage by market size, PMPRB11, 2019
2018 2019 2018 2019 2018 2019 2018 2019
No. of medicines in shortage 51 49 148 147 103 78 146 126
% of segment 19% 18% 29% 30% 35% 32% 32% 28%
0.700.77
0.68
0.750.730.68
0.63
0.83
0.4
0.2
0.0
0.6
0.8
1.0
Less than $1M $1M to $5M $5M to $10M More than $10M
2018
2019
2
43
Conclusion
➢ We do not find an association between lower prices in Canada and drug shortages
➢ More work is needed to confirm and clarify our findings
▪ Conduct multivariate statistical analysis of the factors contributing to shortages
▪ Analyze price dynamics before and after shortages using quarterly data
− During a shortage, the supply contraction is expected to lead to higher prices
➢ Next steps will feature collaboration with stakeholders
▪ Health Canada and public insurers
A Canadian drug shortage case study with
international price comparisons
Brian O’Shea
July 16, 2020
Part 3
45
Amantadine case study: objectives and methods
➢Objectives:
1. Illustrate how the impact of a drug shortage in Canada can be seen across a variety of data sources throughout the supply chain
2. Compare the Canadian experience with price levels and unit volume changes in other countries
➢ Data sources used:
- Reports filed to Drug Shortages Canada website
- Wholesaler sales: IQVIA Canadian Drug Store and Hospital Purchases Audit (CDH)
- Retail sales: IQVIA Payer Insights database
- Public drug plan claims: NPDUIS Database from the Canadian Institute for Health Information (CIHI)
- International comparisons: IQVIA MIDAS® Database
46
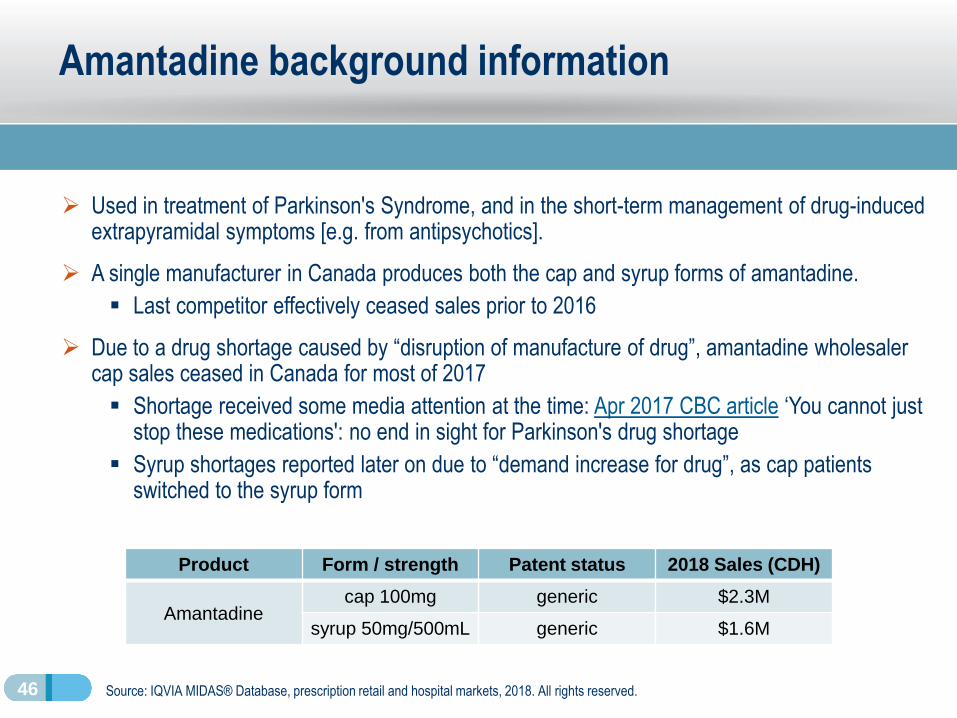
Amantadine background information
➢ Used in treatment of Parkinson's Syndrome, and in the short-term management of drug-induced extrapyramidal symptoms [e.g. from antipsychotics].
➢ A single manufacturer in Canada produces both the cap and syrup forms of amantadine.
▪ Last competitor effectively ceased sales prior to 2016
➢ Due to a drug shortage caused by “disruption of manufacture of drug”, amantadine wholesaler cap sales ceased in Canada for most of 2017
▪ Shortage received some media attention at the time: Apr 2017 CBC article ‘You cannot just stop these medications': no end in sight for Parkinson's drug shortage
▪ Syrup shortages reported later on due to “demand increase for drug”, as cap patients switched to the syrup form
Product Form / strength Patent status 2018 Sales (CDH)
Amantadinecap 100mg generic $2.3M
syrup 50mg/500mL generic $1.6M
Source: IQVIA MIDAS® Database, prescription retail and hospital markets, 2018. All rights reserved.
47
Shortage reports imply a shift to amantadine syrup due to shortage of the cap form
➢ Amantadine cap shortage (447 days):
▪ Nov 2016 to Feb 2018
▪ Reason for shortage: “Disruption of the manufacture of the drug.”
▪ Company comments on drug shortage report include “NOTE: limited stock available”
➢ Subsequent amantadine syrup shortages due to “Demand increase for the drug”:
1) Apr 18, 2017 to May 24, 2017 (36 days)
▪ Occurred a few months after cap shortage began, and was likely due to patients switching to the syrup from the cap
2) Nov 23, 2018 to Jan 7, 2019 (45 days)
▪ This shortage occurred months after the cap shortage was resolved in Feb 2018
▪ Company comments for this report: “AMANTADINE HCl 100mg CAPS 100 remain available.”
Source: Drug Shortages Canada database www.drugshortagescanada.ca
48
-
50,000
100,000
150,000
200,000
250,000
1 3 5 7 9 11 1 3 5 7 9 11 1 3 5 7 9 11
2016 2017 2018
De
fin
ed
Da
ily D
ose
s PMS-AMANTADINECAP 100MG100
PMS-AMANTADINESYRUP 50MG500ML
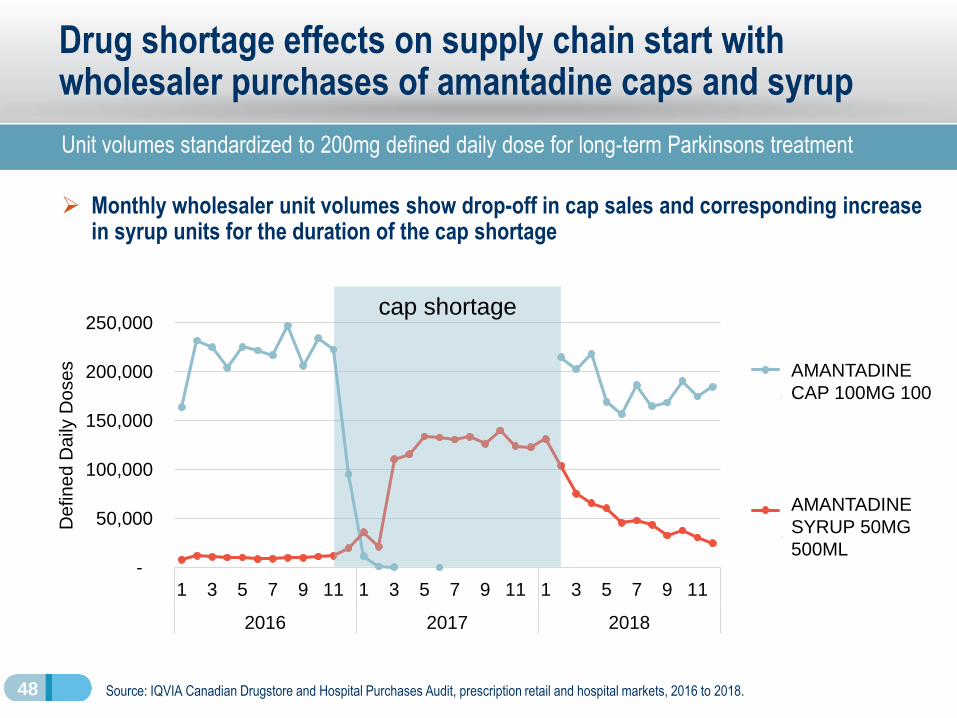
Drug shortage effects on supply chain start with wholesaler purchases of amantadine caps and syrup
➢ Monthly wholesaler unit volumes show drop-off in cap sales and corresponding increase in syrup units for the duration of the cap shortage
Source: IQVIA Canadian Drugstore and Hospital Purchases Audit, prescription retail and hospital markets, 2016 to 2018.
Unit volumes standardized to 200mg defined daily dose for long-term Parkinsons treatment
cap shortage
AMANTADINE
CAP 100MG 100
AMANTADINE
SYRUP 50MG
500ML
49
-
50,000
100,000
150,000
200,000
250,000
1 3 5 7 9 11 1 3 5 7 9 11 1 3 5 7 9 11
2016 2017 2018
De
fin
ed
Da
ily D
ose
s PMS-AMANTADINE -CAP
PMS-AMANTADINE -SYRUP
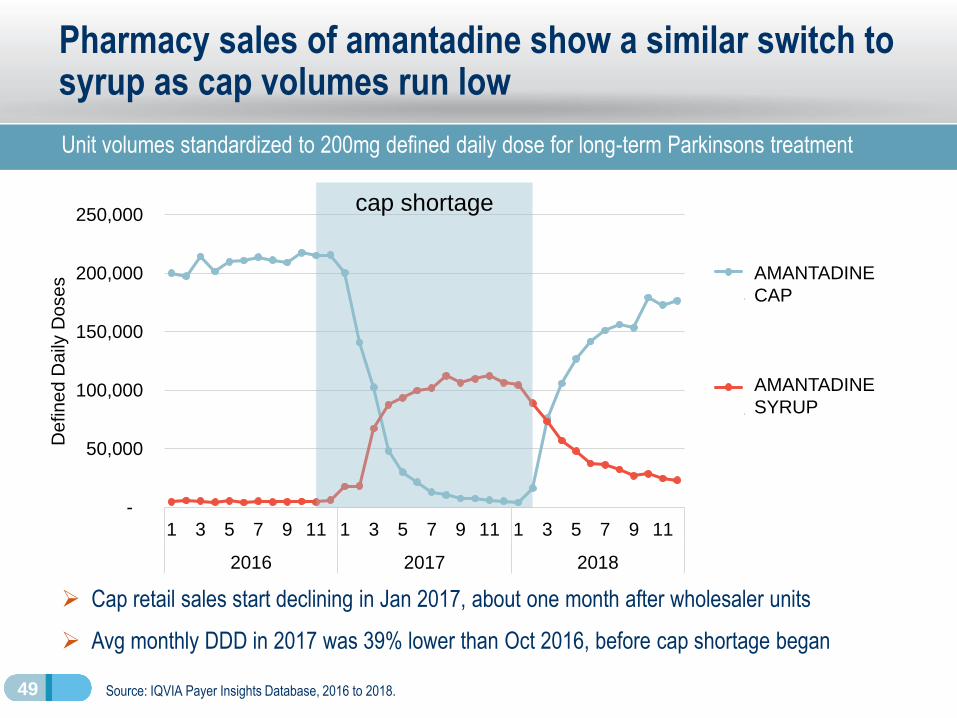
Pharmacy sales of amantadine show a similar switch to syrup as cap volumes run low
Unit volumes standardized to 200mg defined daily dose for long-term Parkinsons treatment
➢ Cap retail sales start declining in Jan 2017, about one month after wholesaler units
➢ Avg monthly DDD in 2017 was 39% lower than Oct 2016, before cap shortage began
Source: IQVIA Payer Insights Database, 2016 to 2018.
cap shortage
AMANTADINE
CAP
AMANTADINE
SYRUP
50
-
500
1,000
1,500
2,000
2,500
3,000
1 3 5 7 9 11 1 3 5 7 9 11 1 3 5 7 9 11
2016 2017 2018
Active
be
ne
ficia
rie
s
Amantadinecap
Amantadinesyrup
Total activebeneficiaries
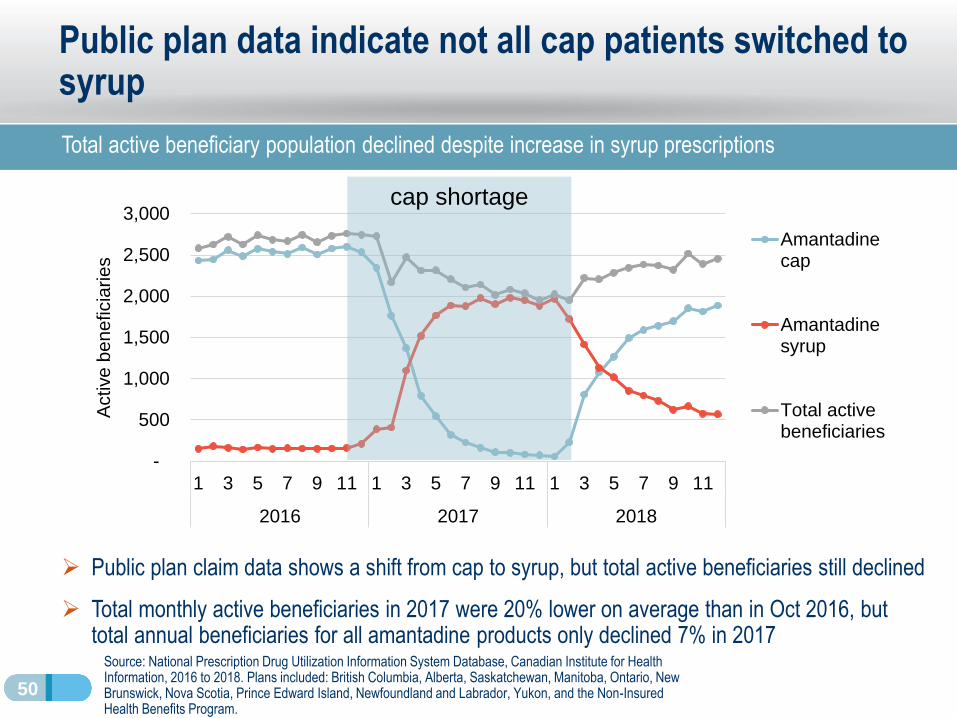
Public plan data indicate not all cap patients switched to syrup
Total active beneficiary population declined despite increase in syrup prescriptions
Source: National Prescription Drug Utilization Information System Database, Canadian Institute for Health Information, 2016 to 2018. Plans included: British Columbia, Alberta, Saskatchewan, Manitoba, Ontario, New Brunswick, Nova Scotia, Prince Edward Island, Newfoundland and Labrador, Yukon, and the Non-Insured Health Benefits Program.
➢ Public plan claim data shows a shift from cap to syrup, but total active beneficiaries still declined
➢ Total monthly active beneficiaries in 2017 were 20% lower on average than in Oct 2016, but total annual beneficiaries for all amantadine products only declined 7% in 2017
cap shortage
51
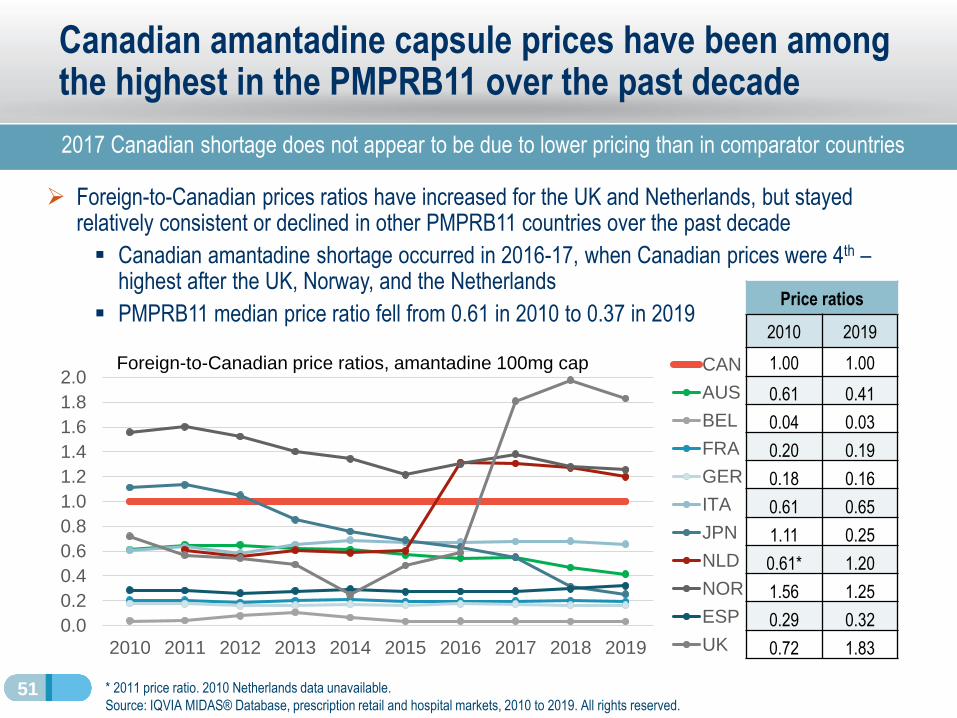
Canadian amantadine capsule prices have been among the highest in the PMPRB11 over the past decade
2017 Canadian shortage does not appear to be due to lower pricing than in comparator countries
➢ Foreign-to-Canadian prices ratios have increased for the UK and Netherlands, but stayed relatively consistent or declined in other PMPRB11 countries over the past decade
▪ Canadian amantadine shortage occurred in 2016-17, when Canadian prices were 4th –highest after the UK, Norway, and the Netherlands
▪ PMPRB11 median price ratio fell from 0.61 in 2010 to 0.37 in 2019
* 2011 price ratio. 2010 Netherlands data unavailable.
Source: IQVIA MIDAS® Database, prescription retail and hospital markets, 2010 to 2019. All rights reserved.
Price ratios
2010 2019
1.00 1.00
0.61 0.41
0.04 0.03
0.20 0.19
0.18 0.16
0.61 0.65
1.11 0.25
0.61* 1.20
1.56 1.25
0.29 0.32
0.72 1.83
0.0
0.2
0.4
0.6
0.8
1.0
1.2
1.4
1.6
1.8
2.0
2010 2011 2012 2013 2014 2015 2016 2017 2018 2019
Foreign-to-Canadian price ratios, amantadine 100mg cap CAN
AUS
BEL
FRA
GER
ITA
JPN
NLD
NOR
ESP
UK
52
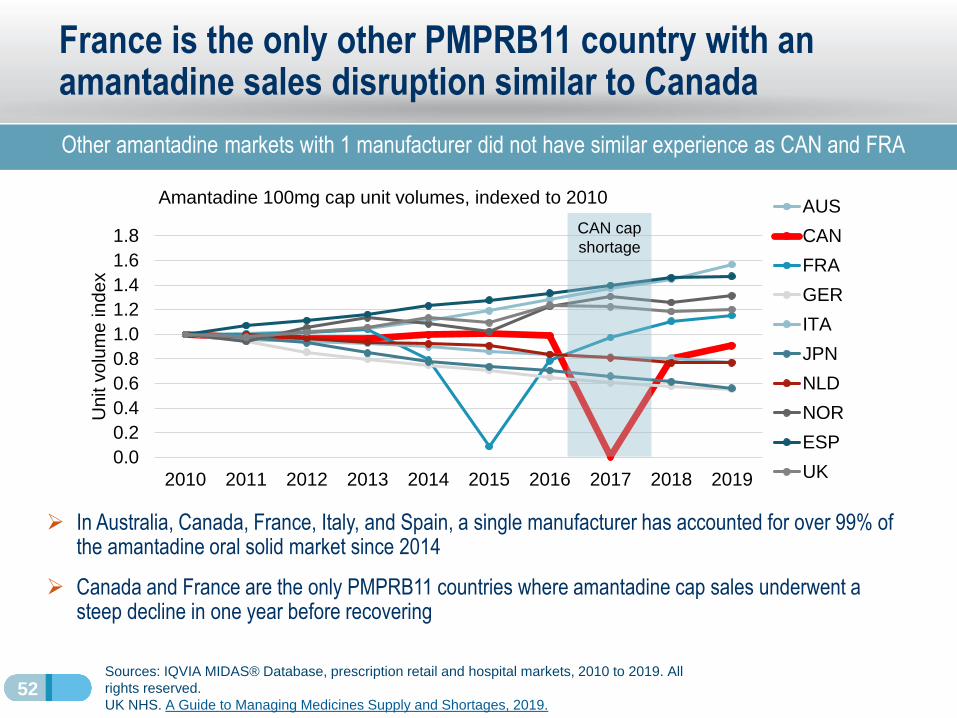
France is the only other PMPRB11 country with an amantadine sales disruption similar to Canada
Other amantadine markets with 1 manufacturer did not have similar experience as CAN and FRA
➢ In Australia, Canada, France, Italy, and Spain, a single manufacturer has accounted for over 99% of the amantadine oral solid market since 2014
➢ Canada and France are the only PMPRB11 countries where amantadine cap sales underwent a steep decline in one year before recovering
Sources: IQVIA MIDAS® Database, prescription retail and hospital markets, 2010 to 2019. All
rights reserved.
UK NHS. A Guide to Managing Medicines Supply and Shortages, 2019.
0.0
0.2
0.4
0.6
0.8
1.0
1.2
1.4
1.6
1.8
2010 2011 2012 2013 2014 2015 2016 2017 2018 2019
Un
it v
olu
me
in
de
x
Amantadine 100mg cap unit volumes, indexed to 2010AUS
CAN
FRA
GER
ITA
JPN
NLD
NOR
ESP
UK
CAN cap
shortage
53
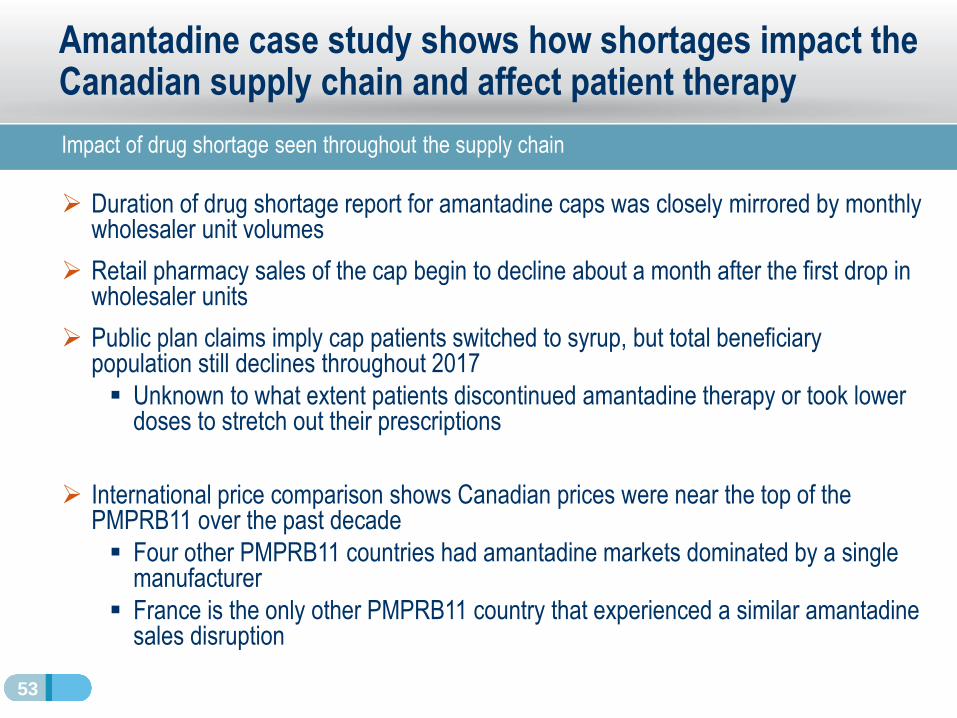
Amantadine case study shows how shortages impact the Canadian supply chain and affect patient therapy
Impact of drug shortage seen throughout the supply chain
➢ Duration of drug shortage report for amantadine caps was closely mirrored by monthly wholesaler unit volumes
➢ Retail pharmacy sales of the cap begin to decline about a month after the first drop in wholesaler units
➢ Public plan claims imply cap patients switched to syrup, but total beneficiary population still declines throughout 2017
▪ Unknown to what extent patients discontinued amantadine therapy or took lower doses to stretch out their prescriptions
➢ International price comparison shows Canadian prices were near the top of the PMPRB11 over the past decade
▪ Four other PMPRB11 countries had amantadine markets dominated by a single manufacturer
▪ France is the only other PMPRB11 country that experienced a similar amantadine sales disruption
Drug Shortages
in CanadaOverall conclusion
PMPRB Researcher Series
July 16, 2020
55
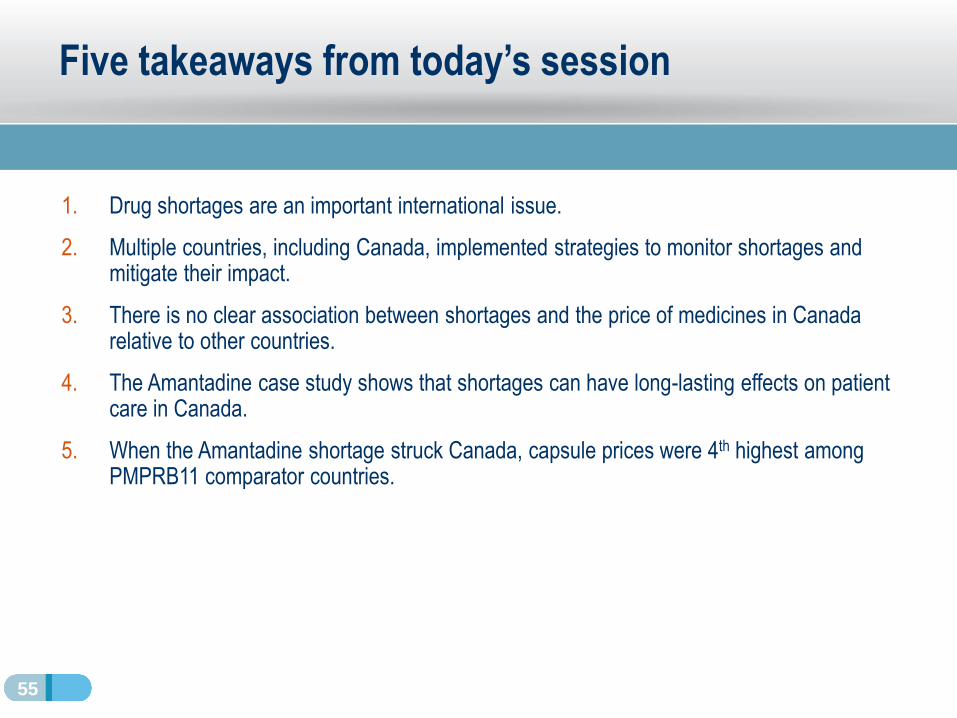
Five takeaways from today’s session
1. Drug shortages are an important international issue.
2. Multiple countries, including Canada, implemented strategies to monitor shortages and mitigate their impact.
3. There is no clear association between shortages and the price of medicines in Canada relative to other countries.
4. The Amantadine case study shows that shortages can have long-lasting effects on patient care in Canada.
5. When the Amantadine shortage struck Canada, capsule prices were 4th highest among PMPRB11 comparator countries.
56
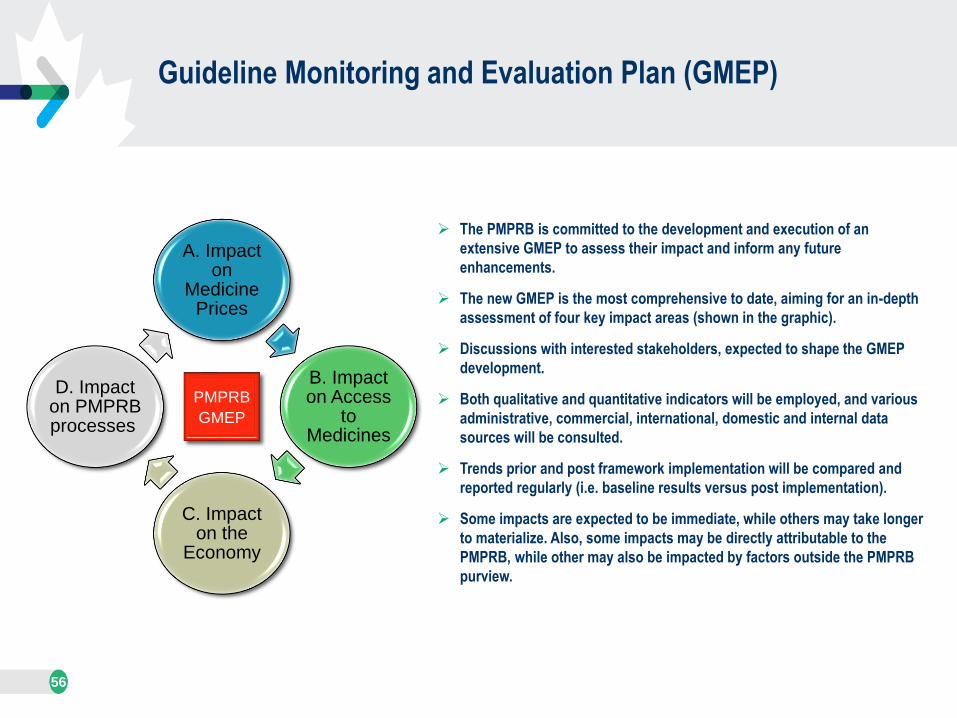
Guideline Monitoring and Evaluation Plan (GMEP)
➢ The PMPRB is committed to the development and execution of an
extensive GMEP to assess their impact and inform any future
enhancements.
➢ The new GMEP is the most comprehensive to date, aiming for an in-depth
assessment of four key impact areas (shown in the graphic).
➢ Discussions with interested stakeholders, expected to shape the GMEP
development.
➢ Both qualitative and quantitative indicators will be employed, and various
administrative, commercial, international, domestic and internal data
sources will be consulted.
➢ Trends prior and post framework implementation will be compared and
reported regularly (i.e. baseline results versus post implementation).
➢ Some impacts are expected to be immediate, while others may take longer
to materialize. Also, some impacts may be directly attributable to the
PMPRB, while other may also be impacted by factors outside the PMPRB
purview.
A. Impact on
Medicine Prices
B. Impact on Access
to Medicines
C. Impact on the
Economy
D. Impact on PMPRB processes
PMPRB
GMEP
QuestionsAnswers
&