drying control system for spray booth with optimization of fuel consumption
TRANSCRIPT
Applied Energy 88 (2011) 1586–1595
Contents lists available at ScienceDirect
Applied Energy
journal homepage: www.elsevier .com/ locate/apenergy
Drying control system for spray booth with optimization of fuel consumption
Zbigniew Ogonowski ⇑Institute of Automatic Control, Silesian University of Technology, Akademicka 16, 44-121 Gliwice, Poland
a r t i c l e i n f o
Article history:Received 20 May 2010Received in revised form 7 November 2010Accepted 26 November 2010Available online 28 December 2010
Keywords:Drying processHeat transfer controlOn-line process optimizationModel identification
0306-2619/$ - see front matter � 2010 Elsevier Ltd. Adoi:10.1016/j.apenergy.2010.11.038
⇑ Tel.: +48 32 237 10 84; fax: +48 32 237 21 27.E-mail address: [email protected]
a b s t r a c t
Two-layer control system of the spray booth is presented. Special attention is paid to the upper layerwhich optimizes operating point of the direct control layer to minimize the fuel consumption. The min-imization is done on-line using measurements of the process variables and off-line identified models. Inthis way the actual distance to the limits of the process variables can be determined and the constraintscan be shifted accordingly to determine a new set-point for the direct control layer. This algorithmassures safe performance of the system and minimizes the fuel consumption.
� 2010 Elsevier Ltd. All rights reserved.
1. Introduction
Drying processes are energy consuming. It is estimated thatover 10% of energy produced in developed countries is consumedby the drying processes [1]. Scientific research is therefore aimedat seeking solutions to energy-saving. They focus primarily onimproving the equipment used for drying. Solar dryers to dry fruitshas been studied by Fadhel et al. [2]; to improve efficiency of dry-ing process Rathore and Panwar [3] built walk-in type solar tunneldryer with heat protective north wall. This solution presents ahuge drying capacity and no additional running cost as that ofmechanical dryer. Fabric drying is an example of the problem ofhow to quickly reduce the moisture content at the lowest cost pos-sible. Termination control method which reduces over-drying hasbeen proposed in [4]. Yadav and Moon [5,6] studied the problemof fabric-drying process in domestic electrically driven dryers.They verified experimentally models of the drying process and pro-posed the method for predicting the overall performance of thedryer under a variety of load and ambient conditions. Bansalet al. [7] proposed a new concept in a household clothes tumblerdryer where heat exchanger is driven by the hot-water. In bothcases, the recirculation is applied: the heated air or water heatingthe exchanger. However, the ratio of fresh to waste stream is a de-sign parameter rather than a controlled variable.
Analysis of the drying process in the works cited above is madeon the basis of phenomenological models with parameters verifiedexperimentally. This paper focuses on control aspects of dryingprocess to improve the system performance therefore no change
ll rights reserved.
of the dryer construction is suggested. What is more data-driven(black-box) models are discussed in the paper. Main objective isto minimize energy consumption thus the key issue is to developa control structure where the optimization problem is stateddirectly.
Spray painting requires several successive phases of drying [9].The role of drying is not only to remove liquids from the paintedsurface but also to let the relevant chemical reactions occurred ina layer of paint and where it touches the surface. Therefore techno-logical requirements concerns temperatures to be maintained insucceeding phases, however, duration of the phases are usuallyconstant. Industrial spray booths (e.g. Italian USI ITALIA used indrying and hardening car painting processes [8]) serves as theexample. Every phase must be curried out under special conditions(air-take and temperature). To maintain the temperature at theappropriate level ventilation and heating systems has to be con-trolled. Usually simple on-off controllers or manual switching isused thus the process is led insufficiently if energy (fuel) consump-tion is concerned.
The process is exposed to disturbances. Ventilation is biased byairtight fit through ceiling filters and gaskets. The latter degrades intime and causes dust. Moreover big increases in the pressure dropin the circuit occur. Usually centrifugal, reverse-blade fans are usedand to keep constant air volume, about 15–20% over-power is ap-plied. On the other hand the heating system efficiency is extremelyaffected by the outer temperature, air-take, pressure and humiditychanges. Built-in control systems cause great variation of the tem-perature. This follows from the nature of on-off control which isusually applied, and also from a number of uncompensated distur-bances. Although variation of the temperature is permitted in somerange, it causes unnecessary over-consumption of the fuel.
Z. Ogonowski / Applied Energy 88 (2011) 1586–1595 1587
The paper presents the medium-sized Module-Master type ofthe spray booth assembled by USI-ITALIA (Section 2) which is usedfor car painting after tinsmith’s repairs and, two layered controlsystem (Section 3). The lower layer is a feedback system with spe-cially designed nonlinear predictive controller. The upper layeroptimizes operating points of the heating and ventilation systemsaccording to the outdoor temperature and other disturbances andreduces the fuel consumption. Both layers use models obtained onthe basis of data aggregated during long period system observa-tion. Depending on the phase of drying, single-input and single-output (SISO) models and two-input and two-output (TITO) non-linear models are used (Section 4). Formulation of the optimizationproblem refers to the system performance and is detailed in Sec-tion 5. Optimization algorithm uses the inner temperature mea-surement and allows for tracing the set-point temperature. Thisconstitutes long-horizon feedback optimization. Additional air-pressure measurement allows for outer air-take volume to be spec-ified. This constitutes gain-scheduling adaptive part of the controlsystem.
2. The spray booth
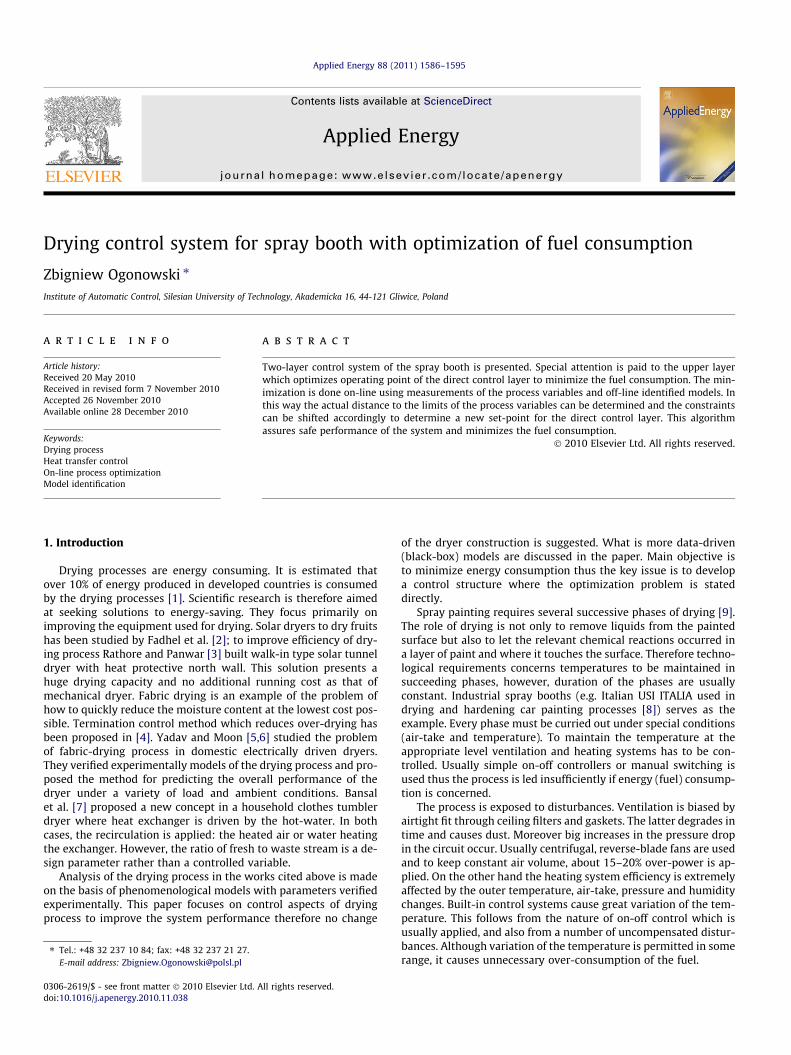
Fig. 1 presents scheme of the Module-Master USI-ITALIA typespray booth which is used for car painting. There are four statesof the booth: off-state, spraying phase, solvent drying and harden-ing phase. Period length of the processing phase depends on thesurface size to be painted (20 min up to 2.5 h). Maximal tempera-ture in the cabin-booth is 75 �C.
Existing control system measures only TF air-temperature usinga sensor placed close-above the heat exchanger which is heated bythe oil-fed furnace. The furnace control signal FP causes threestates of the unit: off, 196 [kW] and 250 kW of power.
Ventilation part consists of the air-take pipe with the valvewhich is positioned by the control signal VP. This signal allowsfor circulation (position A) or complete exhausting of the wasteair (position B). In-between positions are also possible. In-takenair is filtered and pumped up by reverse-blade fan. During allphases the fan is on (two-state signal FS is on). Hot air passesthrough the cabin via input (ceiling) and output (floor) filters.The control system changes position of the valve according to theprocess phase and keeps measured temperature close the respec-tive set-point.
Operational conditions depend on the process phase. During thefirst operational phase the valve is in the position B and requiredtemperature is 23 �C. The base and the spray is applied during thisphase. After finished, about 15 min break is necessary (secondphase) to let the solvent dry in a natural way. Still the requiredtemperature is equal 23 �C. Then the third phase begins duringwhich spray dries and the surface hardens. The valve is switchedto the position A thus approximately 90% of waste air is pumpedback into the cabin. The rest 10% of the air is exhausted. Operatingtemperature should be 63 �C and should not exceed 70 �C.
Fig. 1. Scheme of the Module-Master USI-ITALIA spray booth.
3. Two layered control system
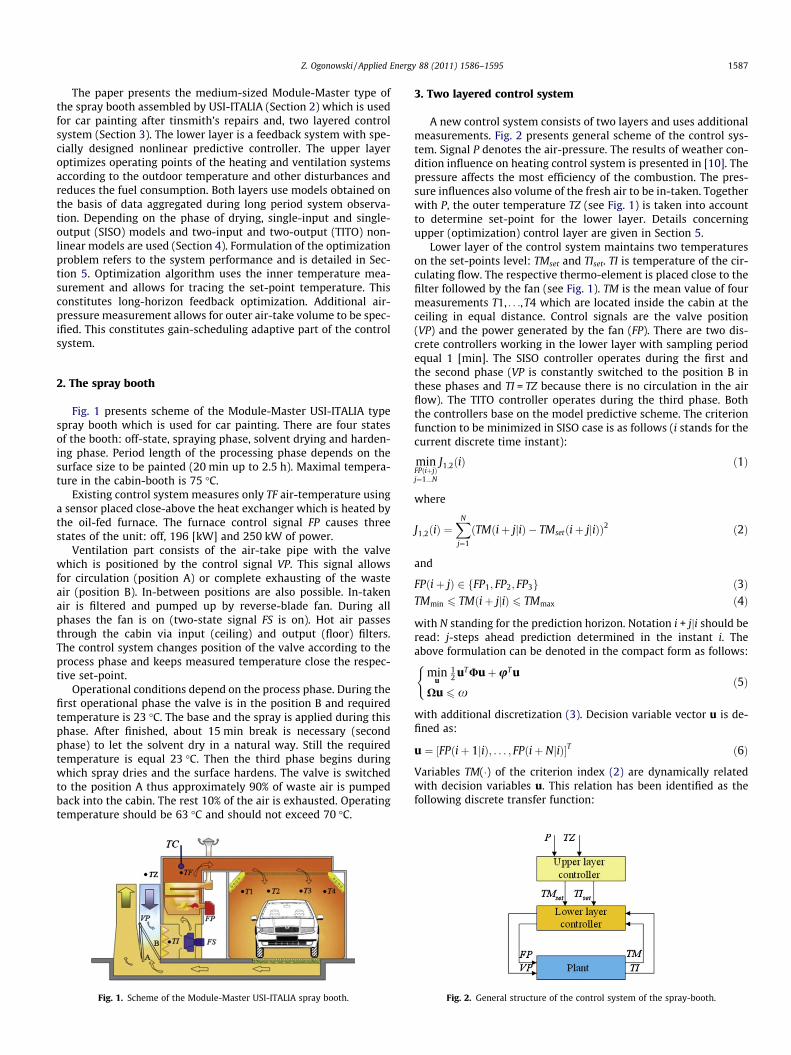
A new control system consists of two layers and uses additionalmeasurements. Fig. 2 presents general scheme of the control sys-tem. Signal P denotes the air-pressure. The results of weather con-dition influence on heating control system is presented in [10]. Thepressure affects the most efficiency of the combustion. The pres-sure influences also volume of the fresh air to be in-taken. Togetherwith P, the outer temperature TZ (see Fig. 1) is taken into accountto determine set-point for the lower layer. Details concerningupper (optimization) control layer are given in Section 5.
Lower layer of the control system maintains two temperatureson the set-points level: TMset and TIset. TI is temperature of the cir-culating flow. The respective thermo-element is placed close to thefilter followed by the fan (see Fig. 1). TM is the mean value of fourmeasurements T1, . . .,T4 which are located inside the cabin at theceiling in equal distance. Control signals are the valve position(VP) and the power generated by the fan (FP). There are two dis-crete controllers working in the lower layer with sampling periodequal 1 [min]. The SISO controller operates during the first andthe second phase (VP is constantly switched to the position B inthese phases and TI = TZ because there is no circulation in the airflow). The TITO controller operates during the third phase. Boththe controllers base on the model predictive scheme. The criterionfunction to be minimized in SISO case is as follows (i stands for thecurrent discrete time instant):
minFPðiþjÞj¼1...N
J1;2ðiÞ ð1Þ
where
J1;2ðiÞ ¼XN
j¼1
ðTMðiþ jjiÞ � TMsetðiþ jjiÞÞ2 ð2Þ
and
FPðiþ jÞ 2 fFP1; FP2; FP3g ð3ÞTMmin 6 TM iþ jjið Þ 6 TMmax ð4Þ
with N standing for the prediction horizon. Notation i + jji should beread: j-steps ahead prediction determined in the instant i. Theabove formulation can be denoted in the compact form as follows:
minu
12 uTUuþuT u
Xu 6 x
(ð5Þ
with additional discretization (3). Decision variable vector u is de-fined as:
u ¼ ½FPðiþ 1jiÞ; . . . ; FPðiþ NjiÞ�T ð6Þ
Variables TM(�) of the criterion index (2) are dynamically relatedwith decision variables u. This relation has been identified as thefollowing discrete transfer function:
Fig. 2. General structure of the control system of the spray-booth.
1 For interpretation of color in Fig. 3, the reader is referred to the web version ofis article.
1588 Z. Ogonowski / Applied Energy 88 (2011) 1586–1595
dTMðz�1ÞFPðz�1Þ ¼
�0:053þ 0:87z�1 þ 0:109z�2
1� 0:8479z�1 ð7Þ
where z�1 stands for one sampling period delay operator. Toimprove numerical conditioning of the identification, measured sig-nals have been scaled according to the steady state and nominalconditions to describe only deviations d. It was experimentallychecked that if FP is switched constantly to FP3 (furnace works withthe maximum power 250 kW) then the temperature TM rose byabout 28 �C in a steady state. Signal FP was then scaled (expressed)in the range [�5,5] with nominal value 0, while dTM remains ex-pressed in �C. Model (7) describes deviation dTM from nominal va-lue TM = 23 �C. It can be easily check that the gain of the model (7)is equal about 6.
Model (7) is used to calculate vector dTM = [dTM(i + 1ji), . . .,dTM(i + Nji)]T of predicted outputs as follows
dTM ¼ Guþ TM0 ð8Þ
where TM0 is the vector of initial conditions influence and G is low-er-triangular Toeplitz matrix with impulse response of (7). Now, ifone collect future set-points deviation in the vector
dTMset ¼ ½dTMsetðiþ 1jiÞ; . . . ; dTMsetðiþ NjiÞ�T
then the parameters of criterion index in (5) can be expressed asfollows:
U ¼ 2GT G; u ¼ 2GTðdTMset � TM0Þ ð9Þ
In the same way constrains of the optimization task (5) can be de-rived from (8) which results in:
X ¼ ½GT ;�GT �T ; x ¼ ðdTMmax � TM0ÞT ; ðTM0 � dTMminÞTh iT
ð10Þ
If, for example, N = 2 the following results are obtained:
G ¼�0:053 00:825 �0:053
� �ð11Þ
TM0 ¼0:08479dTMðiÞ þ 0:87FPði� 1Þ þ 0:109FPði� 2Þ0:719dTMðiÞ þ 0:821FPði� 1Þ þ 0:092FPði� 2Þ
� �ð12Þ
It is clear from the above discussion, that parameters of the optimi-zation problem (5) changes in every step. Well-known difficultythat predictive control suffer from [17] is necessity of solving ofthe optimization problem in every sampling period. Another diffi-culty arises from the fact that decision variable u of the optimiza-tion problem (5) belongs to a discrete space (Eq. (3)). A brute-force search is a complex combinatorial problem, e.g. 10 [min]ahead prediction needs checking of about 60,000 combinations.Non-linear integer programming methods is also time-consuming.Thus suboptimal (heuristic) method is proposed. Vector u is treatedas the element of N-dimensional Euclidean space. After optimum isfound, it is discretized to the values (3) by simple discrimination.Algorithm locating a minimum adapts active set method [11]. Therth iteration of the algorithm searches an increment Dur of the pre-viously established solution ur�1 to pick up a new one. In every iter-ation set of active constraints is determined (with subscript a). Therth iteration of the algorithm can be summarized as follows:
1. Active set is Xaur�1 = xa. Assuming the initial Dur, check thecondition: X(ur�1 + Dur) 6x, if YES then go to the next itera-tion else.
2. Find a 2 (0,1) such that ur = ur�1 + aDur satisfies the constraintsXur 6x and determine new active set.
3. Check the termination condition:
UuþXTk ¼ �u
Xuþ t ¼ xtTk ¼ 0t; k P 0
ð13Þ
if for non-active constraints ti > 0, ki = 0 and kj = 0 for active con-straints then FINISH, else change the active set: if kk < 0 then kthactive constraint make non-active.
4. Discretize actual control vector Dur by finding the closest valueto (3) for every element.
During the third phase position of the valve can change so theoutput TI can be controlled. TITO model predictive controller isthen applied. The model has been identified in a similar way asmodel (7). However, in TITO case so called common denominatorstructure has been applied as follows:
A1ðz�1ÞdTMðiÞ ¼ B11ðz�1ÞFPðiÞ þ B12ðz�1ÞVPðiÞA2ðz�1ÞdTIðiÞ ¼ B21ðz�1ÞFPðiÞ þ B22ðz�1ÞVPðiÞ
(ð14Þ
where A1, B11, B12, B21 and B22 are polynomials of z�1 operator.Structure (14) allows for identification using Least Square Method.Result of the identification is as follows:
A1ðz�1Þ ¼ 1� 0:8251z�1
A2ðz�1Þ ¼ 1� 0:359z�1
B11ðz�1Þ ¼ 0:891z�1 þ 0:1543z�2
B12ðz�1Þ ¼ 0:702z�1
B21ðz�1Þ ¼ 0:067z�1 þ 0:4z�2 þ 0:79z�3 þ 1:154z�4
B22ðz�1Þ ¼ 2:53
8>>>>>>>><>>>>>>>>:
ð15Þ
Signal FP was scaled to the range [�5,5] with nominal value 0. TM isexpressed in �C and model (15) describes dTM deviation from nom-inal value TM = 63 �C. Temperature TI is expressed in �C, and themodel (15) describes dTI deviation from nominal value TI = 44 �C.Control signal VP 2 [�2,2] and is expressed in % as deviation fromnominal position A of the valve which maintains the ratio 10–90%of the fresh to circulating air flow.
The algorithm is the same as in SISO case. The difference con-cerns criterion index, definition of the vector of decision variables,and constraints. In TITO case the criterion index has the form:
minFPðiþjÞ;VPðiþjÞ
j¼1...N
J3ðiÞ ð16Þ
where
J3ðiÞ ¼XN
j¼1
ðTMðiþ jjiÞ � TMsetðiþ jjiÞÞ2 þ ðTIðiþ jjiÞ � TIsetðiþ jjiÞÞ2
ð17Þ
and
FPðiþ jÞ 2 fFP1; FP2; FP3g ð18ÞVPðiþ jÞ 2 fVP1;VP2;VP3g ð19ÞTMmin 6 TMðiþ jjiÞ 6 TMmax ð20ÞTImin 6 TIðiþ jjiÞ 6 TImax ð21Þ
Again the problem can be formulated in the general form (5). Deci-sion variables are now arranged in the following vector:
u¼ ½FPrðiþ1jiÞ; . . . ;FPrðiþNjiÞ;VPrðiþ1jiÞ; . . . ;VPrðiþNjiÞ�T ð22Þ
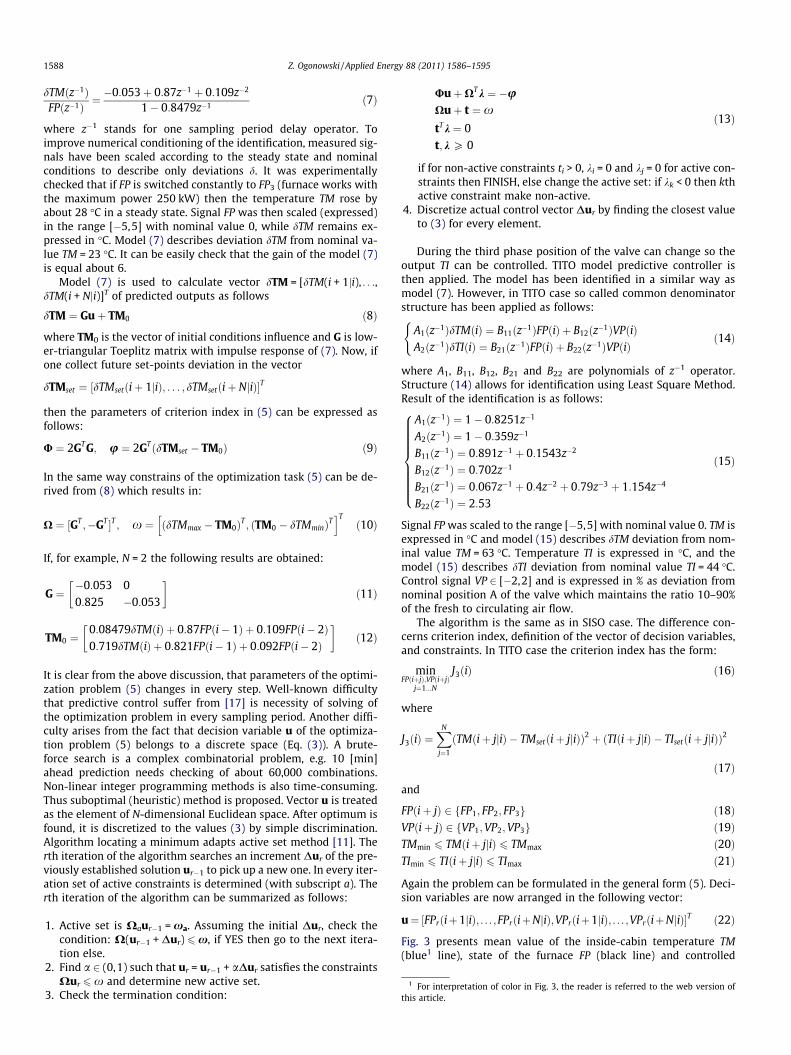
Fig. 3 presents mean value of the inside-cabin temperature TM(blue1 line), state of the furnace FP (black line) and controlled
th
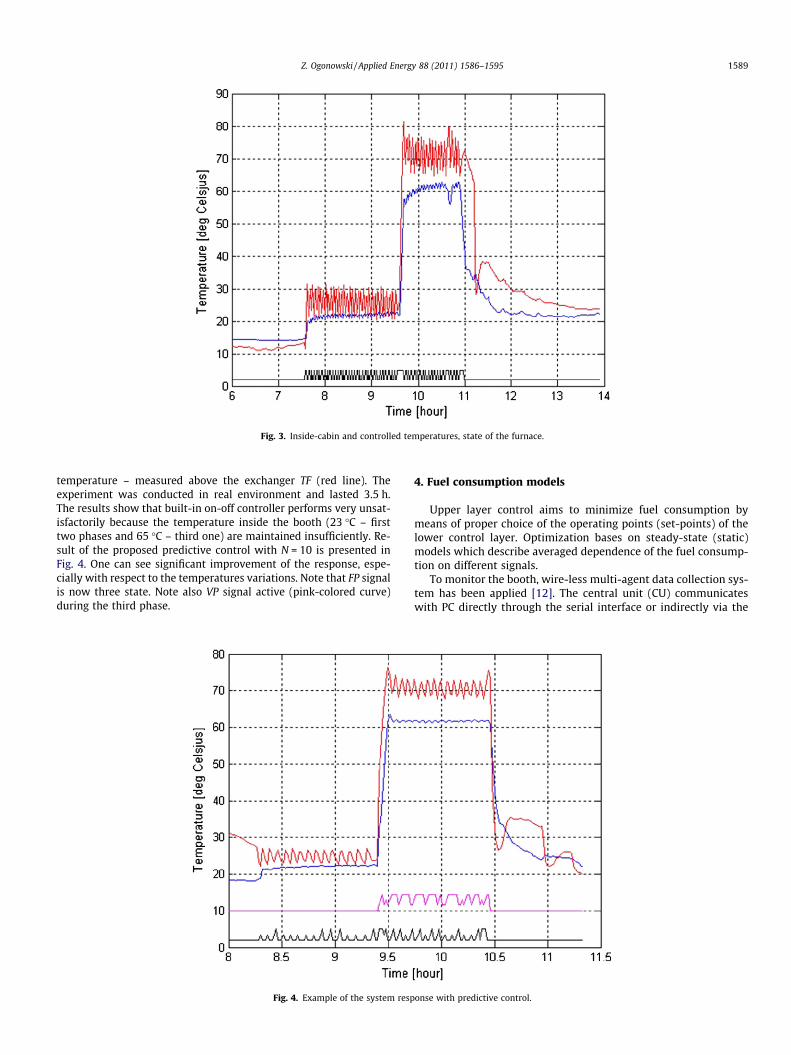
Fig. 3. Inside-cabin and controlled temperatures, state of the furnace.
Z. Ogonowski / Applied Energy 88 (2011) 1586–1595 1589
temperature – measured above the exchanger TF (red line). Theexperiment was conducted in real environment and lasted 3.5 h.The results show that built-in on-off controller performs very unsat-isfactorily because the temperature inside the booth (23 �C – firsttwo phases and 65 �C – third one) are maintained insufficiently. Re-sult of the proposed predictive control with N = 10 is presented inFig. 4. One can see significant improvement of the response, espe-cially with respect to the temperatures variations. Note that FP signalis now three state. Note also VP signal active (pink-colored curve)during the third phase.
Fig. 4. Example of the system resp
4. Fuel consumption models
Upper layer control aims to minimize fuel consumption bymeans of proper choice of the operating points (set-points) of thelower control layer. Optimization bases on steady-state (static)models which describe averaged dependence of the fuel consump-tion on different signals.
To monitor the booth, wire-less multi-agent data collection sys-tem has been applied [12]. The central unit (CU) communicateswith PC directly through the serial interface or indirectly via the
onse with predictive control.
1590 Z. Ogonowski / Applied Energy 88 (2011) 1586–1595
modem and the Internet. Using input–output interface, CU collectsdata from the booth. It also buffers data and transfers them out(e.g. to the PC). The wire-less communicator allows for the connec-tion of CU with radio-modules that can be used as a distributedmeasurement units.
During three months time observation number of three phasecar spraying and drying processes have been monitored. Influenceof different outer conditions has been observed. These data wasused to identify respective models of the spray booth as e.g. (7).
The most valuable data concerns the fuel consumption. Col-lected data are presented in [13]. Models of the fuel consumptionhas been identified according to the outer temperature TZ andthe inner temperature set-point TMset. The models are affected alsoby the air-pressure P and by the valve position VP (third phasemodel).
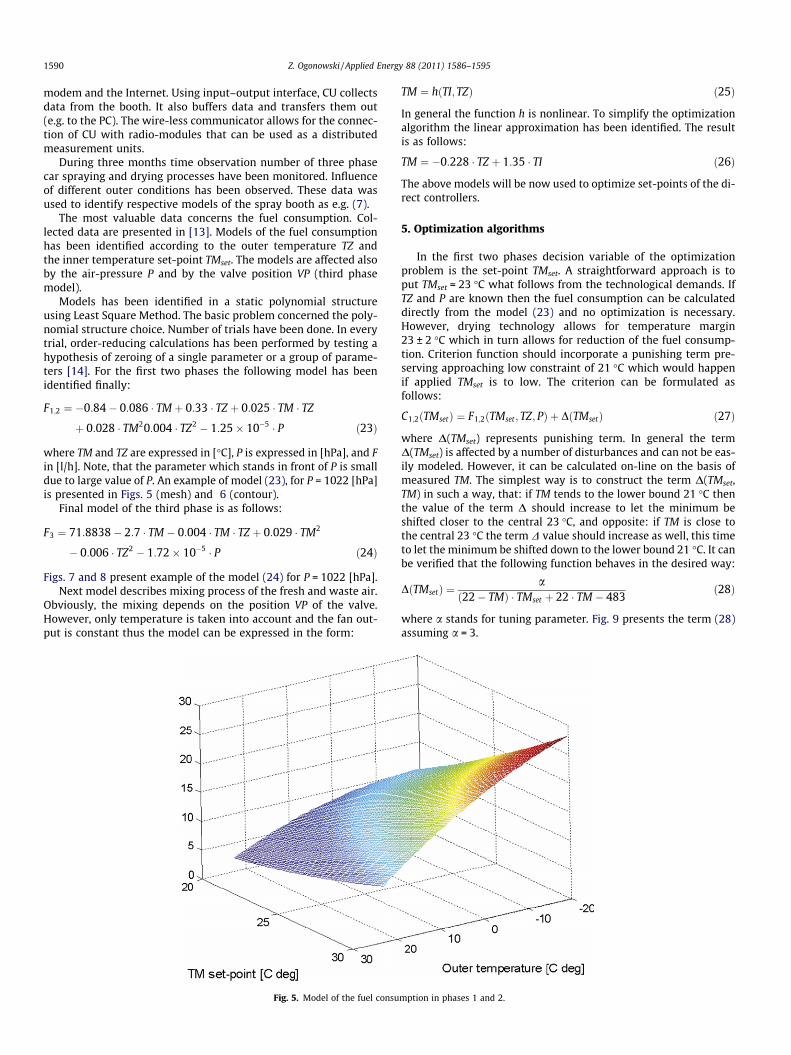
Models has been identified in a static polynomial structureusing Least Square Method. The basic problem concerned the poly-nomial structure choice. Number of trials have been done. In everytrial, order-reducing calculations has been performed by testing ahypothesis of zeroing of a single parameter or a group of parame-ters [14]. For the first two phases the following model has beenidentified finally:
F1;2 ¼ �0:84� 0:086 � TM þ 0:33 � TZ þ 0:025 � TM � TZ
þ 0:028 � TM20:004 � TZ2 � 1:25� 10�5 � P ð23Þ
where TM and TZ are expressed in [�C], P is expressed in [hPa], and Fin [l/h]. Note, that the parameter which stands in front of P is smalldue to large value of P. An example of model (23), for P = 1022 [hPa]is presented in Figs. 5 (mesh) and 6 (contour).
Final model of the third phase is as follows:
F3 ¼ 71:8838� 2:7 � TM � 0:004 � TM � TZ þ 0:029 � TM2
� 0:006 � TZ2 � 1:72� 10�5 � P ð24Þ
Figs. 7 and 8 present example of the model (24) for P = 1022 [hPa].Next model describes mixing process of the fresh and waste air.
Obviously, the mixing depends on the position VP of the valve.However, only temperature is taken into account and the fan out-put is constant thus the model can be expressed in the form:
Fig. 5. Model of the fuel consu
TM ¼ hðTI; TZÞ ð25Þ
In general the function h is nonlinear. To simplify the optimizationalgorithm the linear approximation has been identified. The resultis as follows:
TM ¼ �0:228 � TZ þ 1:35 � TI ð26Þ
The above models will be now used to optimize set-points of the di-rect controllers.
5. Optimization algorithms
In the first two phases decision variable of the optimizationproblem is the set-point TMset. A straightforward approach is toput TMset = 23 �C what follows from the technological demands. IfTZ and P are known then the fuel consumption can be calculateddirectly from the model (23) and no optimization is necessary.However, drying technology allows for temperature margin23 ± 2 �C which in turn allows for reduction of the fuel consump-tion. Criterion function should incorporate a punishing term pre-serving approaching low constraint of 21 �C which would happenif applied TMset is to low. The criterion can be formulated asfollows:
C1;2ðTMsetÞ ¼ F1;2ðTMset; TZ; PÞ þ DðTMsetÞ ð27Þ
where D(TMset) represents punishing term. In general the termD(TMset) is affected by a number of disturbances and can not be eas-ily modeled. However, it can be calculated on-line on the basis ofmeasured TM. The simplest way is to construct the term D(TMset,TM) in such a way, that: if TM tends to the lower bound 21 �C thenthe value of the term D should increase to let the minimum beshifted closer to the central 23 �C, and opposite: if TM is close tothe central 23 �C the term D value should increase as well, this timeto let the minimum be shifted down to the lower bound 21 �C. It canbe verified that the following function behaves in the desired way:
DðTMsetÞ ¼a
ð22� TMÞ � TMset þ 22 � TM � 483ð28Þ
where a stands for tuning parameter. Fig. 9 presents the term (28)assuming a = 3.
mption in phases 1 and 2.
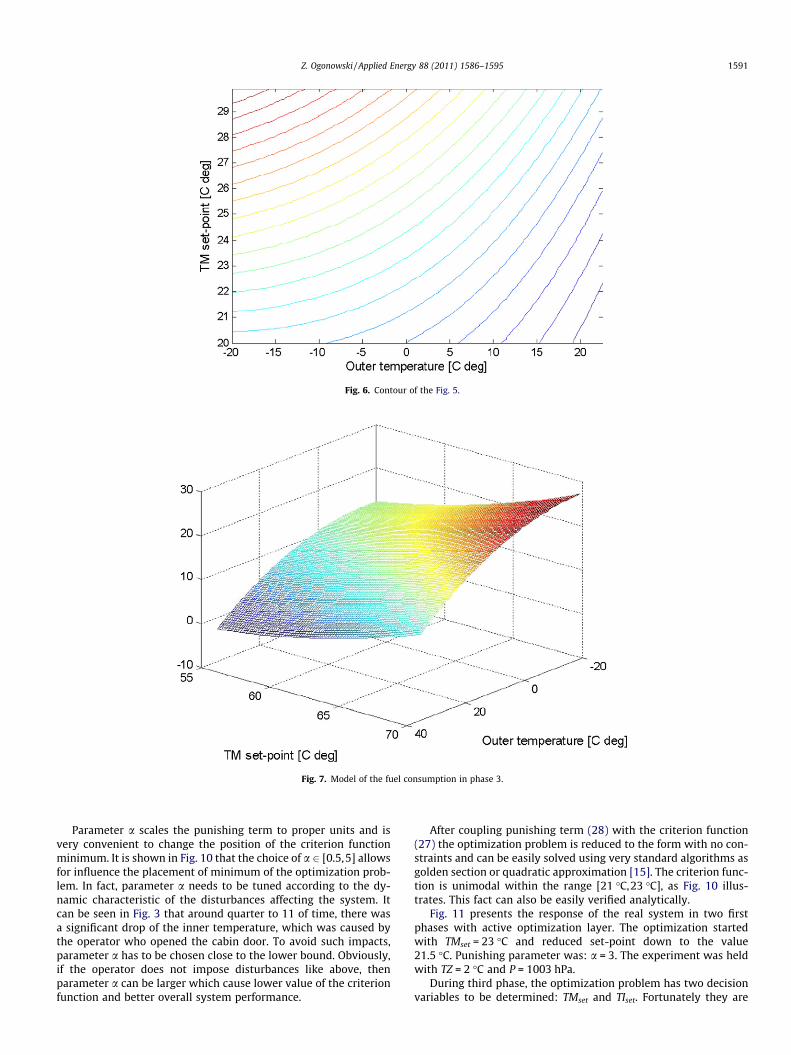
Fig. 6. Contour of the Fig. 5.
Fig. 7. Model of the fuel consumption in phase 3.
Z. Ogonowski / Applied Energy 88 (2011) 1586–1595 1591
Parameter a scales the punishing term to proper units and isvery convenient to change the position of the criterion functionminimum. It is shown in Fig. 10 that the choice of a 2 [0.5,5] allowsfor influence the placement of minimum of the optimization prob-lem. In fact, parameter a needs to be tuned according to the dy-namic characteristic of the disturbances affecting the system. Itcan be seen in Fig. 3 that around quarter to 11 of time, there wasa significant drop of the inner temperature, which was caused bythe operator who opened the cabin door. To avoid such impacts,parameter a has to be chosen close to the lower bound. Obviously,if the operator does not impose disturbances like above, thenparameter a can be larger which cause lower value of the criterionfunction and better overall system performance.
After coupling punishing term (28) with the criterion function(27) the optimization problem is reduced to the form with no con-straints and can be easily solved using very standard algorithms asgolden section or quadratic approximation [15]. The criterion func-tion is unimodal within the range [21 �C,23 �C], as Fig. 10 illus-trates. This fact can also be easily verified analytically.
Fig. 11 presents the response of the real system in two firstphases with active optimization layer. The optimization startedwith TMset = 23 �C and reduced set-point down to the value21.5 �C. Punishing parameter was: a = 3. The experiment was heldwith TZ = 2 �C and P = 1003 hPa.
During third phase, the optimization problem has two decisionvariables to be determined: TMset and TIset. Fortunately they are
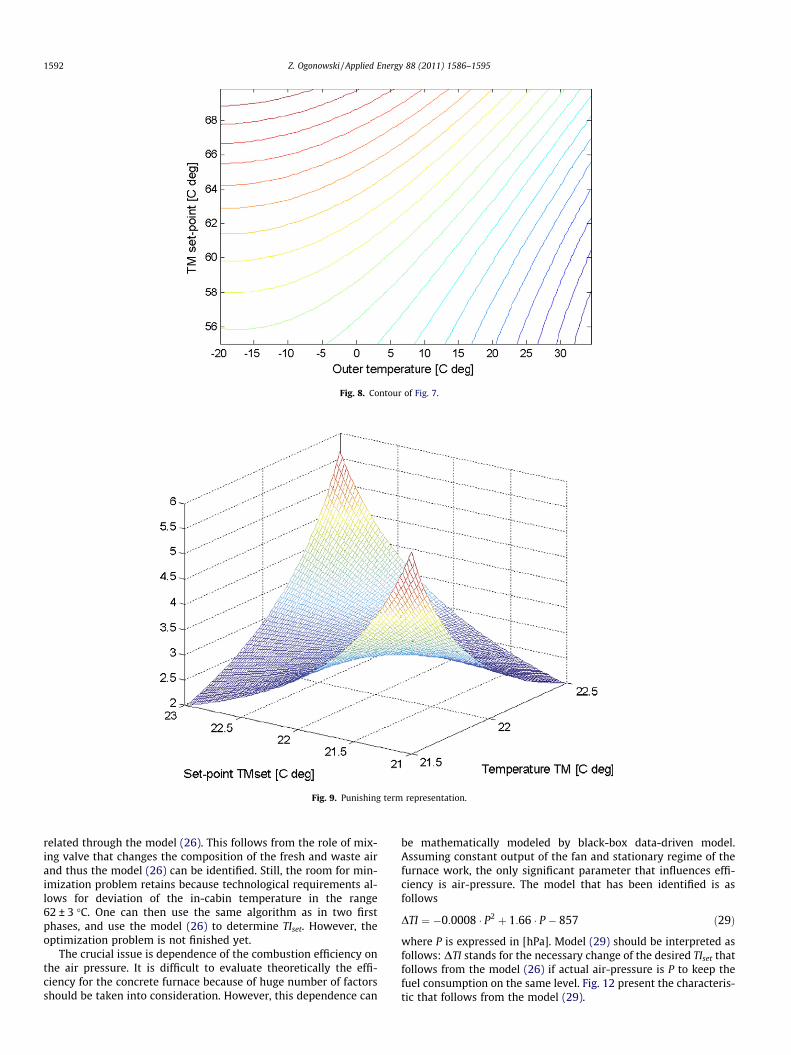
Fig. 8. Contour of Fig. 7.
Fig. 9. Punishing term representation.
1592 Z. Ogonowski / Applied Energy 88 (2011) 1586–1595
related through the model (26). This follows from the role of mix-ing valve that changes the composition of the fresh and waste airand thus the model (26) can be identified. Still, the room for min-imization problem retains because technological requirements al-lows for deviation of the in-cabin temperature in the range62 ± 3 �C. One can then use the same algorithm as in two firstphases, and use the model (26) to determine TIset. However, theoptimization problem is not finished yet.
The crucial issue is dependence of the combustion efficiency onthe air pressure. It is difficult to evaluate theoretically the effi-ciency for the concrete furnace because of huge number of factorsshould be taken into consideration. However, this dependence can
be mathematically modeled by black-box data-driven model.Assuming constant output of the fan and stationary regime of thefurnace work, the only significant parameter that influences effi-ciency is air-pressure. The model that has been identified is asfollows
DTI ¼ �0:0008 � P2 þ 1:66 � P � 857 ð29Þ
where P is expressed in [hPa]. Model (29) should be interpreted asfollows: DTI stands for the necessary change of the desired TIset thatfollows from the model (26) if actual air-pressure is P to keep thefuel consumption on the same level. Fig. 12 present the characteris-tic that follows from the model (29).
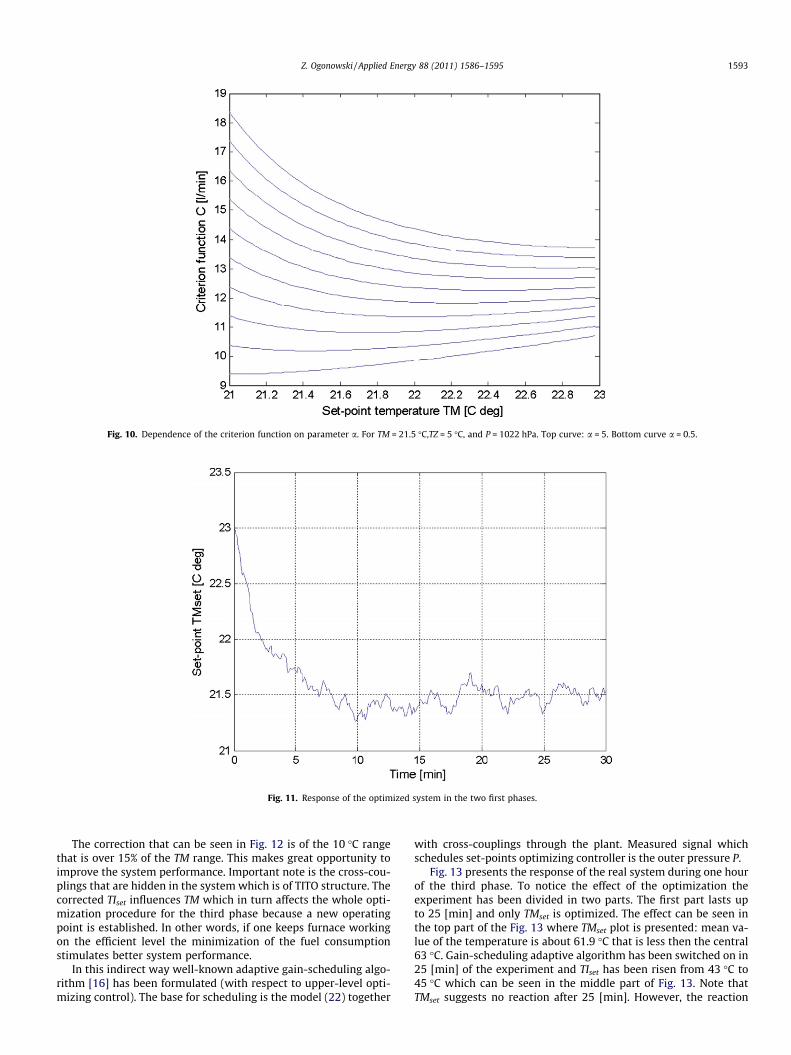
Fig. 10. Dependence of the criterion function on parameter a. For TM = 21.5 �C,TZ = 5 �C, and P = 1022 hPa. Top curve: a = 5. Bottom curve a = 0.5.
Fig. 11. Response of the optimized system in the two first phases.
Z. Ogonowski / Applied Energy 88 (2011) 1586–1595 1593
The correction that can be seen in Fig. 12 is of the 10 �C rangethat is over 15% of the TM range. This makes great opportunity toimprove the system performance. Important note is the cross-cou-plings that are hidden in the system which is of TITO structure. Thecorrected TIset influences TM which in turn affects the whole opti-mization procedure for the third phase because a new operatingpoint is established. In other words, if one keeps furnace workingon the efficient level the minimization of the fuel consumptionstimulates better system performance.
In this indirect way well-known adaptive gain-scheduling algo-rithm [16] has been formulated (with respect to upper-level opti-mizing control). The base for scheduling is the model (22) together
with cross-couplings through the plant. Measured signal whichschedules set-points optimizing controller is the outer pressure P.
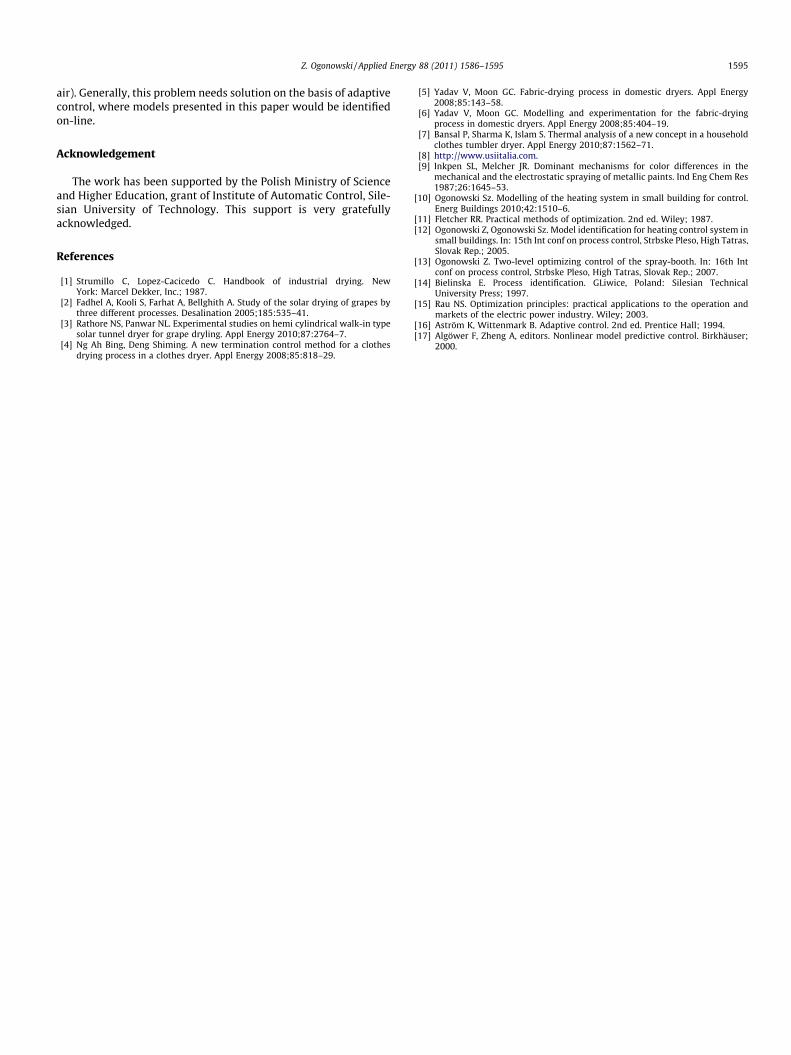
Fig. 13 presents the response of the real system during one hourof the third phase. To notice the effect of the optimization theexperiment has been divided in two parts. The first part lasts upto 25 [min] and only TMset is optimized. The effect can be seen inthe top part of the Fig. 13 where TMset plot is presented: mean va-lue of the temperature is about 61.9 �C that is less then the central63 �C. Gain-scheduling adaptive algorithm has been switched on in25 [min] of the experiment and TIset has been risen from 43 �C to45 �C which can be seen in the middle part of Fig. 13. Note thatTMset suggests no reaction after 25 [min]. However, the reaction
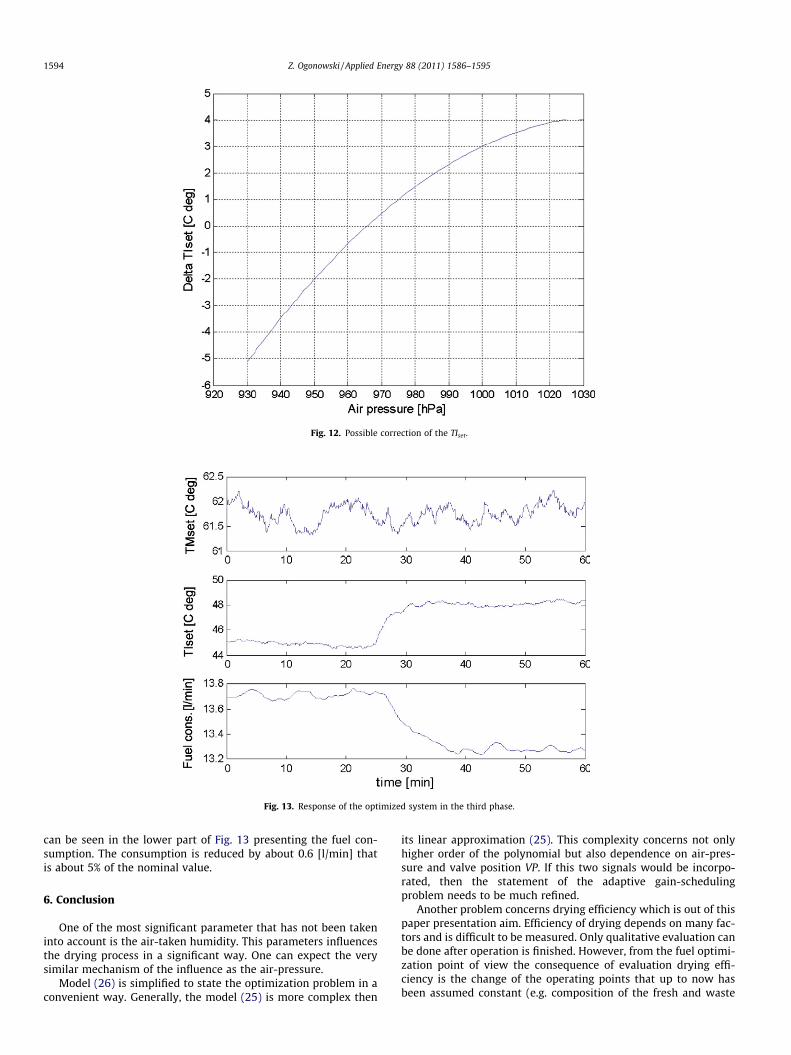
Fig. 12. Possible correction of the TIset.
Fig. 13. Response of the optimized system in the third phase.
1594 Z. Ogonowski / Applied Energy 88 (2011) 1586–1595
can be seen in the lower part of Fig. 13 presenting the fuel con-sumption. The consumption is reduced by about 0.6 [l/min] thatis about 5% of the nominal value.
6. Conclusion
One of the most significant parameter that has not been takeninto account is the air-taken humidity. This parameters influencesthe drying process in a significant way. One can expect the verysimilar mechanism of the influence as the air-pressure.
Model (26) is simplified to state the optimization problem in aconvenient way. Generally, the model (25) is more complex then
its linear approximation (25). This complexity concerns not onlyhigher order of the polynomial but also dependence on air-pres-sure and valve position VP. If this two signals would be incorpo-rated, then the statement of the adaptive gain-schedulingproblem needs to be much refined.
Another problem concerns drying efficiency which is out of thispaper presentation aim. Efficiency of drying depends on many fac-tors and is difficult to be measured. Only qualitative evaluation canbe done after operation is finished. However, from the fuel optimi-zation point of view the consequence of evaluation drying effi-ciency is the change of the operating points that up to now hasbeen assumed constant (e.g. composition of the fresh and waste
Z. Ogonowski / Applied Energy 88 (2011) 1586–1595 1595
air). Generally, this problem needs solution on the basis of adaptivecontrol, where models presented in this paper would be identifiedon-line.
Acknowledgement
The work has been supported by the Polish Ministry of Scienceand Higher Education, grant of Institute of Automatic Control, Sile-sian University of Technology. This support is very gratefullyacknowledged.
References
[1] Strumillo C, Lopez-Cacicedo C. Handbook of industrial drying. NewYork: Marcel Dekker, Inc.; 1987.
[2] Fadhel A, Kooli S, Farhat A, Bellghith A. Study of the solar drying of grapes bythree different processes. Desalination 2005;185:535–41.
[3] Rathore NS, Panwar NL. Experimental studies on hemi cylindrical walk-in typesolar tunnel dryer for grape dryling. Appl Energy 2010;87:2764–7.
[4] Ng Ah Bing, Deng Shiming. A new termination control method for a clothesdrying process in a clothes dryer. Appl Energy 2008;85:818–29.
[5] Yadav V, Moon GC. Fabric-drying process in domestic dryers. Appl Energy2008;85:143–58.
[6] Yadav V, Moon GC. Modelling and experimentation for the fabric-dryingprocess in domestic dryers. Appl Energy 2008;85:404–19.
[7] Bansal P, Sharma K, Islam S. Thermal analysis of a new concept in a householdclothes tumbler dryer. Appl Energy 2010;87:1562–71.
[8] http://www.usiitalia.com.[9] Inkpen SL, Melcher JR. Dominant mechanisms for color differences in the
mechanical and the electrostatic spraying of metallic paints. Ind Eng Chem Res1987;26:1645–53.
[10] Ogonowski Sz. Modelling of the heating system in small building for control.Energ Buildings 2010;42:1510–6.
[11] Fletcher RR. Practical methods of optimization. 2nd ed. Wiley; 1987.[12] Ogonowski Z, Ogonowski Sz. Model identification for heating control system in
small buildings. In: 15th Int conf on process control, Strbske Pleso, High Tatras,Slovak Rep.; 2005.
[13] Ogonowski Z. Two-level optimizing control of the spray-booth. In: 16th Intconf on process control, Strbske Pleso, High Tatras, Slovak Rep.; 2007.
[14] Bielinska E. Process identification. GLiwice, Poland: Silesian TechnicalUniversity Press; 1997.
[15] Rau NS. Optimization principles: practical applications to the operation andmarkets of the electric power industry. Wiley; 2003.
[16] Aström K, Wittenmark B. Adaptive control. 2nd ed. Prentice Hall; 1994.[17] Algöwer F, Zheng A, editors. Nonlinear model predictive control. Birkhäuser;
2000.