dryland cereals and household food security in tanzania: potential
TRANSCRIPT
1
Dryland Cereals and Household Food Security in Tanzania: Potential and
Constraints of Improved Sorghum Cultivars
Abstract
More than one third of the population in Africa is still facing undernourishment and
malnutrition. While poor and food-insecure people are most often living in unfavourable
agricultural zones, such as semi-arid areas, only few studies have assessed the potential
of well adapted dryland cereals to contribute to local food security. Here, we analyze the
case of sorghum in Tanzania, and particularly focus on the role of improved sorghum
cultivars. Using survey data from smallholder farmers and econometric techniques, we
show that sorghum contributes to the food supply of a household. Despite the promise of
higher yields and better resistance of improved sorghum cultivars to some biotic and
abiotic stresses, adoption rates are, however, still low. Our results indicate that access to
information and diversified networks constitute serious adoption constraints. National
extension systems are a major bottleneck in overcoming such constraints.
1. Introduction
Despite the fact that food security is one of the millennium developing goals, more than
one third of the population in Africa is still facing undernourishment and malnutrition
(Union Africaine, 2005). The food crisis in 2011 at the Horn of Africa stressed once more
the urgent need to address the roots of this problem. One essential step towards reducing
food insecurity is the improvement of farm level resilience to agricultural production
shocks. This holds particularly true for countries that are expected to face an increasing
risk of climatic shocks and in which a large share of the population depends on
agriculture, like in Tanzania (Cavatassi et al., 2011).
In developing countries, poor and food-insecure people are most often living in marginal
or unfavourable agricultural zones such as semi arid areas. Nevertheless, these regions
were often neglected in the past (Lipton, 2005; Pingali and Rosegrant, 1998). Instead,
efforts of national governments as well as of the international donor and development
2
cooperation community to improve agricultural production systems often focus on high
potential areas and crops only. While this might be a successful strategy for short term
successes, it is not a promising strategy to improve the food security situation in marginal
areas in the longterm (Edmeades et al., 2008). Moreover, it is widely argued that the
neglect of unfavourable areas worsens the situation in these areas (Lipton and Longhurst,
1989).
The agroecological conditions in semi-arid areas limit the production portfolio of a
farmer to only a number of crops. Moreover, semi-arid areas face a high risk of droughts,
which favours crops with a certain drought tolerance. Traditional crops like sorghum are
well adapted to both, the agroecological conditions of semi-arid areas and droughts (FAO
and ICRISAT, 1996). This makes them more resilient to production shocks as for
example maize. Moreover, sorghum can contribute to food security through its nutritional
quality. Sorghum has high calorie content and offers valuable nutritional ingredients, in
particular iron and zinc, which also makes it competitive with maize (Koenders, 2010). In
particular in the light of climatic change, that is expected to lead to higher temperatures,
more variable rainfall and extreme weather events, and thus negatively effects
agricultural production, the potential of sorghum to contribute to food security needs to
be further explored (IPCC, 2007).
On the other hand and when compared to other staple crops like maize, traditional crops
like sorghum often have the disadvantage of relatively low yields. This puts the farmer in
the dilemma to choose between relatively secure, but lower yields (sorghum) and
relatively insecure, but higher yields (maize) or a combination of both. In regard to
sustaining food security, each decision implies a certain risk (Rohrbach and Kiriwaggulu,
2007).
An important step to improve this situation is the introduction of new sorghum cultivars,
which among other aspects offer higher yields. Although traditional crops have been less
in the focus of research, compared to cotton and maize, the belief that sorghum can
contribute to food security in semi arid areas spurs a strong interest in the crop, and a
respectable number of new sorghum cultivars has been released in Sub Sahara Africa,
including Tanzania (Miller et al., 1996). In some situation in Sub-Sahara Africa e.g.,

3
early maturing varieties have been shown to reduce the downside production risk, thus
enabling a more productive use of land (Mekbib, 2006).
Despite the promise of higher yields and better resistance of improved sorghum cultivars
to some biotic and abiotic stresses, there is no guarantee that improved cultivars will be
widely adopted. Previous studies on adoption of new agricultural technologies have
found that technological, socioeconomic and other context specific constraints, unrelated
to specific varietal attributes, limit the dissemination of agricultural innovations (Feder et
al., 1985; Noltze et al., 2011; Schipmann and Qaim, 2010). Hence, it is important to
understand the motivation and constraints of farmers in adopting improved sorghum
varieties that are designed to reduce production risk and improve food security. However,
only few studies that assess the contribution of sorghum, and in particular improved
sorghum cultivars, to the food supply of a household are found and dissemination and
adoption patterns are not well understood (Cavatassi et al., 2011). Moreover, previous
studies on adoption of new technologies have often neglected the fact that not all farmers
in a given environment are exposed to the innovation under consideration. Thus, adoption
estimates in these studies can lead to biased results.
Our paper aims to address this research gap by analysing such aspects for the case of
sorghum cultivating farmers in Kondoa and Singida Rural district in Central Tanzania.
Both districts are semi arid areas with annual rainfall below 600mm. Sorghum is widely
cultivated in the districts and, as well as maize, an important food crop for rural
households. Building on primary survey data from Kondoa and Singida Rural district, we
analyse three main aspects. First, we look at consumption patterns of farmers in regard to
major staple crops to assess the contribution of sorghum in general and improved
varieties in particular for a households’ food supply. This is done by descriptive statistics.
Second, based on farmers stated reasons and constraints, we analyse current adoption
levels of improved sorghum cultivars and discuss adoption barriers. And third,
controlling for a possible exposure and selection bias, we estimate probit models to assess
the determinants of exposure to and adoption of new sorghum cultivars. The analysis will
allow policy recommendations about the current and potential contribution of sorghum to
the food supply in semi-arid areas as well as about dissemination barriers of improved
sorghum cultivars.
4
The paper proceeds as follows. The next section provides background information about
sorghum in the study area and the empirical database. Subsequently, the contribution of
sorghum to the food supply of a household is discussed. The fourth section provides an
overview about the adoption pattern and, based on farmers’ statements as well as by
estimating econometric models, analyses and discusses determinants of exposure and
adoption. The last section concludes.
2. Study Background and database
2.1 Background on sorghum in Tanzania
Tanzania is a least developed and food deficit country, in which more than 40% of the
population lives in chronic food deficit regions, where irregular rainfalls cause recurring
food shortages. In 2007, 34% of the population were undernourished and the amount of
food aid that the country received increased from 12,918 mt in the 1990-92 period to
54,051mt in the 2004–06 period (IFPRI, 2011; WFP, 2011). 80% of the work force of
Tanzania depends on agriculture, but the productivity of the sector is low. Increasing the
potential of dryland cereals like sorghum presents an opportunity in reversing this trend
and reducing the incidence of poverty and food insecurity (Cavatassi, 2011).
Globally, sorghum is the fifth most important cereal and a dietary staple for around 500
million people (Intsormil, 2009). In Tanzania, it is the second most widely grown cereal
grain crop, cultivated on an area of approximately 700,000 ha with an annual production
of about 500,000 mt. Kondoa and Singida Rural district are two of the areas, where
sorghum is primarily cultivated. Sorghum is almost entirely grown by smallholder
farmers on a subsistence level. Less than 2% of the harvest enters the formal market.
Thus, the main contribution of sorghum is to farm household food security (Rohrbach
and Kiriwaggulu, 2007). In recent years, a number of high yielding sorghum varieties,
which are also tolerant to other field problems such as pests, diseases and weeds have
been developed by the Department of Research an Development, Tanzania in
collaboration with international research organizations, e.g. ICRISAT. Despite research
efforts, adoption of new sorghum varieties by farmers and spread of improved sorghum
5
production and storage practices (i.e., fertilizers and insecticides for storage) have been
low. Thus local varieties are still widely grown (Mafuru et al., 2007).
2.2 Database
For our empirical study we conducted a household survey of 360 farmers in Kondoa and
Singida Rural district in Central Tanzania. The survey was carried out between October
and November 2010. Survey villages in the two districts were selected through a
multistage sampling procedure. In a first stage, a treatment, diffusion and control area
were defined in each district, consisting of two to three villages each. This sampling
framework was chosen, because the survey was part of a research project of ICRISAT
and serves as a baseline as well as a benchmark survey to assess the status quo and
monitor and evaluate project activities, respectively.
The treatment groups consist of seven villages in which ICRISAT plans to implement
activities to promote improved sorghum cultivars. Activities had not started at the time of
the survey. The diffusion groups consist of eight villages, which are neighbouring the
treatment villages, so that spillover effects from project activities can be expected. The
six villages in the control groups have the same agroecological conditions than villages in
the other two groups. However, they are that far away from the control and diffusion
villages that spillover effects are unlikely to occur. In each of the three groups,
households were randomly selected from a complete household list of all households in
the group. 90 households were selected in each treatment group and 45 households in
each diffusion and control group, respectively. Subsequently, a random sample of 360
households was selected for the detailed household survey from the six groups.
For the purpose of this paper, the differentiation in three groups is not of interest as
project activities have not yet started. As households in the two districts and different
groups face similar framework conditions, we analyse the data jointly.
3. Cropping patterns and sorghum’s contribution to the household’s food supply
3.1 Cropping pattern of major cereals
6
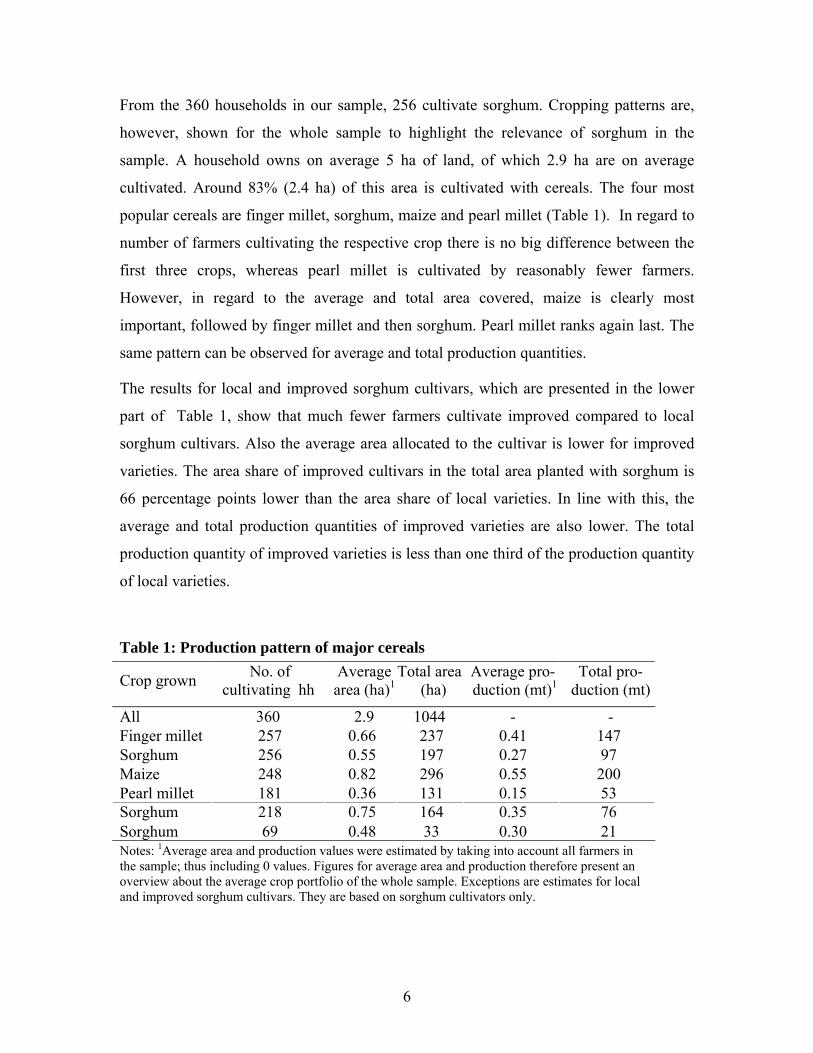
From the 360 households in our sample, 256 cultivate sorghum. Cropping patterns are,
however, shown for the whole sample to highlight the relevance of sorghum in the
sample. A household owns on average 5 ha of land, of which 2.9 ha are on average
cultivated. Around 83% (2.4 ha) of this area is cultivated with cereals. The four most
popular cereals are finger millet, sorghum, maize and pearl millet (Table 1). In regard to
number of farmers cultivating the respective crop there is no big difference between the
first three crops, whereas pearl millet is cultivated by reasonably fewer farmers.
However, in regard to the average and total area covered, maize is clearly most
important, followed by finger millet and then sorghum. Pearl millet ranks again last. The
same pattern can be observed for average and total production quantities.
The results for local and improved sorghum cultivars, which are presented in the lower
part of Table 1, show that much fewer farmers cultivate improved compared to local
sorghum cultivars. Also the average area allocated to the cultivar is lower for improved
varieties. The area share of improved cultivars in the total area planted with sorghum is
66 percentage points lower than the area share of local varieties. In line with this, the
average and total production quantities of improved varieties are also lower. The total
production quantity of improved varieties is less than one third of the production quantity
of local varieties.
Table 1: Production pattern of major cereals
Crop grown No. of cultivating hh
Average area (ha)1
Total area (ha)
Average pro-duction (mt)1
Total pro-duction (mt)
All 360 2.9 1044 - - Finger millet 257 0.66 237 0.41 147 Sorghum 256 0.55 197 0.27 97 Maize 248 0.82 296 0.55 200 Pearl millet 181 0.36 131 0.15 53 Sorghum 218 0.75 164 0.35 76 Sorghum 69 0.48 33 0.30 21 Notes: 1Average area and production values were estimated by taking into account all farmers in the sample; thus including 0 values. Figures for average area and production therefore present an overview about the average crop portfolio of the whole sample. Exceptions are estimates for local and improved sorghum cultivars. They are based on sorghum cultivators only.

7
This first overview indicates that sorghum is an important crop in the study area as it is
cultivated by the majority of farmers. However, far lesser resources are allocated to it
compared to other cereal crops, in particular maize and finger millet. The relevance of
improved varieties in sorghum cultivation is still low.
It is not possible, to directly conclude from the production pattern, how much a certain
crop contributes to the food supply of a household. We therefore examine in the
following section the consumption of cereal crops. As pearl millet plays only a minor role
in the study area, we will not consider pearl millet in the subsequent analysis.
3.2 The contribution of selected cereals to a households’ food supply
The most obvious information about the contribution of a cultivated crop to the food
supply of a household is the amount of harvest used for home consumption. We asked
farmers in the survey how much of their harvest of a respective crop they had consumed
at the time of the survey. As the survey was conducted five month after harvest,
consumption figures provided in Table 2 refer to consumption within this time period. It
can, however, be expected that farmers do not only consume e.g. maize in these months,
but throughout the year, as long as the crop is available. Thus, the annual share of harvest
used for home consumption will be higher.
Our analysis shows that finger millet is a cash crop1, whereas sorghum and maize are
clearly food crops. For the latter two, the share of harvest used for home consumption is
almost the same. However, as harvested quantities are higher for maize, a household
consumes in total values more maize. Thus maize from own production contributes more
to the food supply than sorghum. There are no major consumption differences in regard
to the different types, local and improved, of sorghum cultivars. Both are almost to the
same share used for home consumption. Thus improved varieties are not cultivated for
other purposes than local varieties and also contribute to the food supply of a household.
To further investigate the contribution of different cereal crops to the food supply of a
household, we have asked farmers in which months in an average year the harvested
1 Further analysis about the utilization of finger millet show that 82% of the harvest is sold.
8
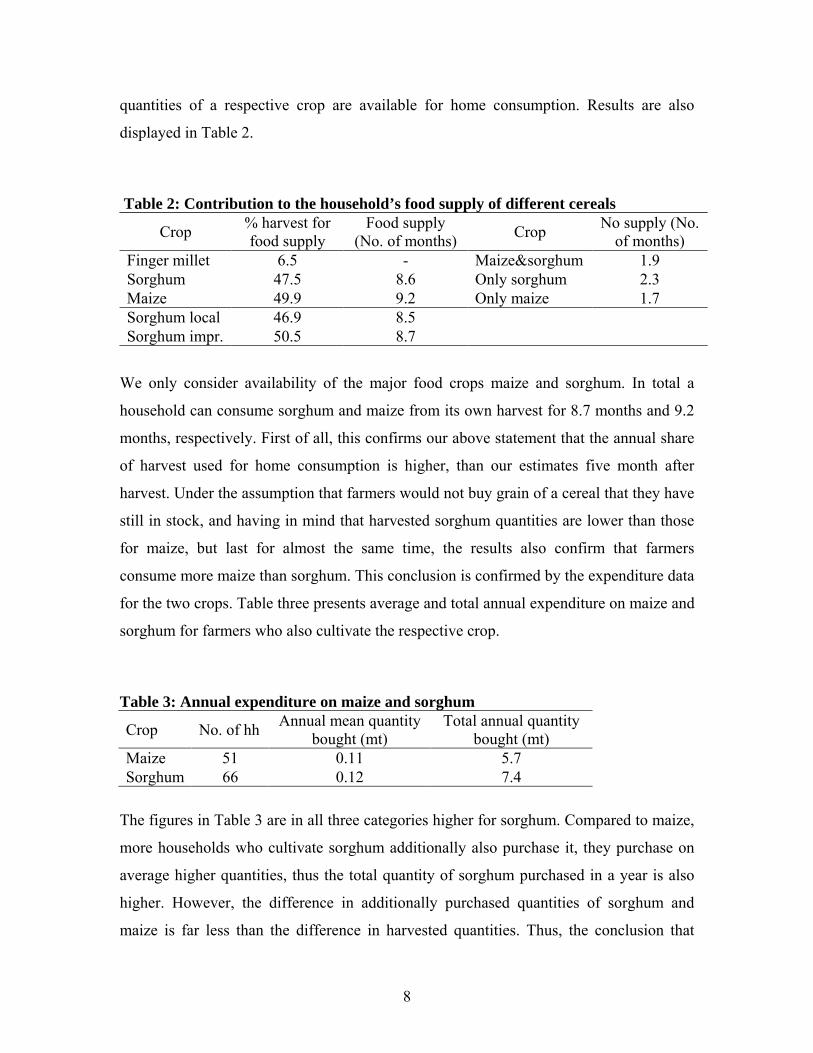
quantities of a respective crop are available for home consumption. Results are also
displayed in Table 2.
Table 2: Contribution to the household’s food supply of different cereals
Crop % harvest for food supply
Food supply (No. of months) Crop No supply (No.
of months) Finger millet 6.5 - Maize&sorghum 1.9 Sorghum 47.5 8.6 Only sorghum 2.3 Maize 49.9 9.2 Only maize 1.7 Sorghum local 46.9 8.5 Sorghum impr. 50.5 8.7
We only consider availability of the major food crops maize and sorghum. In total a
household can consume sorghum and maize from its own harvest for 8.7 months and 9.2
months, respectively. First of all, this confirms our above statement that the annual share
of harvest used for home consumption is higher, than our estimates five month after
harvest. Under the assumption that farmers would not buy grain of a cereal that they have
still in stock, and having in mind that harvested sorghum quantities are lower than those
for maize, but last for almost the same time, the results also confirm that farmers
consume more maize than sorghum. This conclusion is confirmed by the expenditure data
for the two crops. Table three presents average and total annual expenditure on maize and
sorghum for farmers who also cultivate the respective crop.
Table 3: Annual expenditure on maize and sorghum
Crop No. of hh Annual mean quantity bought (mt)
Total annual quantity bought (mt)
Maize 51 0.11 5.7 Sorghum 66 0.12 7.4
The figures in Table 3 are in all three categories higher for sorghum. Compared to maize,
more households who cultivate sorghum additionally also purchase it, they purchase on
average higher quantities, thus the total quantity of sorghum purchased in a year is also
higher. However, the difference in additionally purchased quantities of sorghum and
maize is far less than the difference in harvested quantities. Thus, the conclusion that
9
maize contributes more to the food supply of a household than sorghum is confirmed.
The fact that sorghum cultivating households also buy additional sorghum is, however, a
hint that households not necessarily prefer maize to sorghum2. This is further confirmed
when looking at the respective month of consumption of a crop. The data shows that in
most months both crops are consumed3. Thus, a household does not only consume
sorghum as a substitute of maize. This is a positive result, because consumption
preferences are an important driver for the adoption of a certain crop.
Another interesting result from Table 2 is that households cultivate neither enough maize,
nor enough sorghum to meet their annual consumption demand for the respective crop.
Besides different consumption needs discussed above, the results reflect a certain risk
coping strategy of a household. Rather than cultivating a higher area share with maize to
meet food consumption needs for this cereal, the farmer takes into account months of
shortage. This guarantees the farmer that in case of short rainfalls or even droughts,
which will effect the performance of maize more than the performance of sorghum, he at
least harvests a relatively high quantity of one staple crops.
Another interesting aspect to compare is the food shortage situation of households that
cultivate either both crops or only one of the two crops. As the household also consumes
pearl and finger millet and we are interested in the absolute food shortage, we overlaid
the months of consumption of the four major cereal crops and estimated the number of
months in which a household does not have any cereal crops from its own harvest
available. Results provided in Table 2 show that farmers who are cultivating both, maize
and sorghum, face on average 1.9 months of food shortage from their own production.
Interestingly, farmers who do not cultivate sorghum, but maize, can reduce their period of
food shortage by 0.2 months, whereas farmers who cultivate sorghum, but no maize,
increase their food shortage period by 0.4 month. Thus, in years of normal rainfalls,
cultivation of sorghum effects the food security of a household negatively. However,
2 We are aware that factors like availability, prices, etc. determine the demand for a certain crop. However, as maize is bought by a number of households, it can be assumed that all households have in general the option to choose between maize and sorghum and the higher purchased quantities reflect different consumption needs. Moreover, in Tanzania sorghum prices are on average not lower than maize prices (Ratin, 2011) 3 Data is not reflected in Table 2 and can be made available on request.

10
figures do not differ significantly. We did not differentiate results according to improved
and local sorghum cultivar growers, because there is no difference between the two.
In regard to expectations of less rainfall and reoccurring droughts, the figures show an
urgent need to introduce improved sorghum cultivars that offer high yields to enable
farmers to balance the crop failure of maize. In Tanzania some improved sorghum
cultivars have already been released. However, the take up of farmers is still relatively
poor. To better understand adoption behaviour and identify strategies how to push
improved varieties, the next section explores the adoption improved sorghum varieties by
farmers.
4. Explaining farmer’s adoption of improved sorghum cultivars
4.1 Overview about adoption patterns
Households in the sample know in total six different improved sorghum cultivars (Table
4). However, not all of the 256 sorghum cultivating households are aware of improved
sorghum cultivars and the 143 households who are know on average only 1.7 different
improved cultivars. Pato and Macia are the two most known varieties, followed by
Tegemeo and Serena. Only very few farmers know the varieties Sila and Lulu.
In contrast to the awareness about improved sorghum cultivars, 236 of the 256 sorghum
cultivating households know at least one local variety, with Langalanga being the most
popular one, followed by Udo and then other local varieties, which could not be named.
While almost all households (99%) who know a local variety have at some point in the
past also cultivated the respective variety, only 79% of the households who know an
improved variety have done so. The same pattern is reflected in the figures for the
2009/10 planting season. 94% of the households who have ever planted a local variety in
the past have planted it in the 2009/10 planting season, but for improved varieties, only
61% of the farmers did so (Table 4).

11
Table 4: Adoption of improved sorghum cultivars (N=256)
In regard to the total sample of 256 sorghum cultivating households this means that only
56% know an improved variety and only 27% (69 farmers) cultivated at least one in the
2009/10 planting season. These results suggest that adoption barriers exist on two levels.
First, access to information about improved varieties and second ability and/or interest to
cultivate known varieties.
4.2 Farmer’s stated reason for (non-) adoption
To further investigate adoption barriers, we have asked farmers for their reasons to (non-)
adopt a certain variety (local and improved). Results are displayed in Table 5.
Table 5: Reasons for (non-) adoption in % (N=256)
The three most important reasons for planting a specific local variety are that the variety
is best adapted (38%), that seeds for other varieties are not available (33 %) and yields
(19%). In contrast yield ranks first for improved varieties (41%), followed by best
Local varieties
Known (No.)
Planted (%)
Planted 2009/10 (%)
Improved varieties
Known (No.)
Planted (%)
Planted 2009/10 (%)
Langala 206 96 86 Pato 80 76 33 Udo 68 94 73 Macia 74 84 61Other 62 84 71 Tegemeo 46 67 19At least 236 99 94 Serena 30 3 75one Sila 8 100 32 Lulu 4 100 0
At least one 143 79 61
Reasons adoption Local Improved Reasons not planting Local Improved
Availability 33 5 Availability 16 39 Best adapted 38 31 Diseases and pests 32 36Yields 19 41 Low yields 11 5Recommended by 4 7 Poor taste 16 -Early maturity 2 14 Late maturity 11 -Best for brewing 4 2 Land shortage 5 11 Too expensive - 7
Other 9 2

12
adapted (31%) and early maturity (14%). The latter is in particular important in seasons
of short rainfalls.
Reasons for not planting a variety also differ between local and improved varieties. While
diseases and pests rank first for local varieties (32%), followed by non-availability and
poor taste (both 16%), non-availability of seeds ranks first (38%) for improved varieties.
Surprisingly, diseases and pests (36%) rank second, indicating that not all improved
varieties are well adapted to the conditions in the two districts. A third, but far less
important reason is land shortage (11%). This indicates a certain risk aversion of farmers.
They are not substituting local by improved varieties, but cultivate them additionally.
The results are supported by farmers’ answers to the question, which factors they
consider when purchasing seeds. Yield capacity was stated most often (65%), followed
by early maturity (18%) and drought resistance (12%). Two suggestions result from these
findings. First, farmers are interested in improved varieties, however, they are seed
constraint. Second, improved varieties must offer high yields and be well adapted to local
conditions to be attractive for farmers.
Concerning seed availability, seed sources are an important issue. In regard to the lack of
awareness of improved sorghum cultivars, information constraints need to be addressed.
We have asked farmers about their main seed source for specific varieties as well as
about their sources for information about new sorghum varieties. The latter was not asked
specifically for local and improved varieties. We have, however, in our analysis
distinguished answers from households who know only local varieties from those who
know at least one improved variety. Results for both questions are displayed in Table 6.
For both exposure groups, not knowing and knowing improved varieties, extension
officers are the most important source of information for new sorghum varieties. Other
farmers rank second in both groups, even though they are less important for farmers who
know improved varieties. Other actors like local leaders or agro dealers play for both
groups a minor role. Thus, access to extension officers is as such not the major barrier of
being informed about improved varieties. It is rather the quality of information provided
by an extension officer that seems to play a role. If extension officers are accessible, but
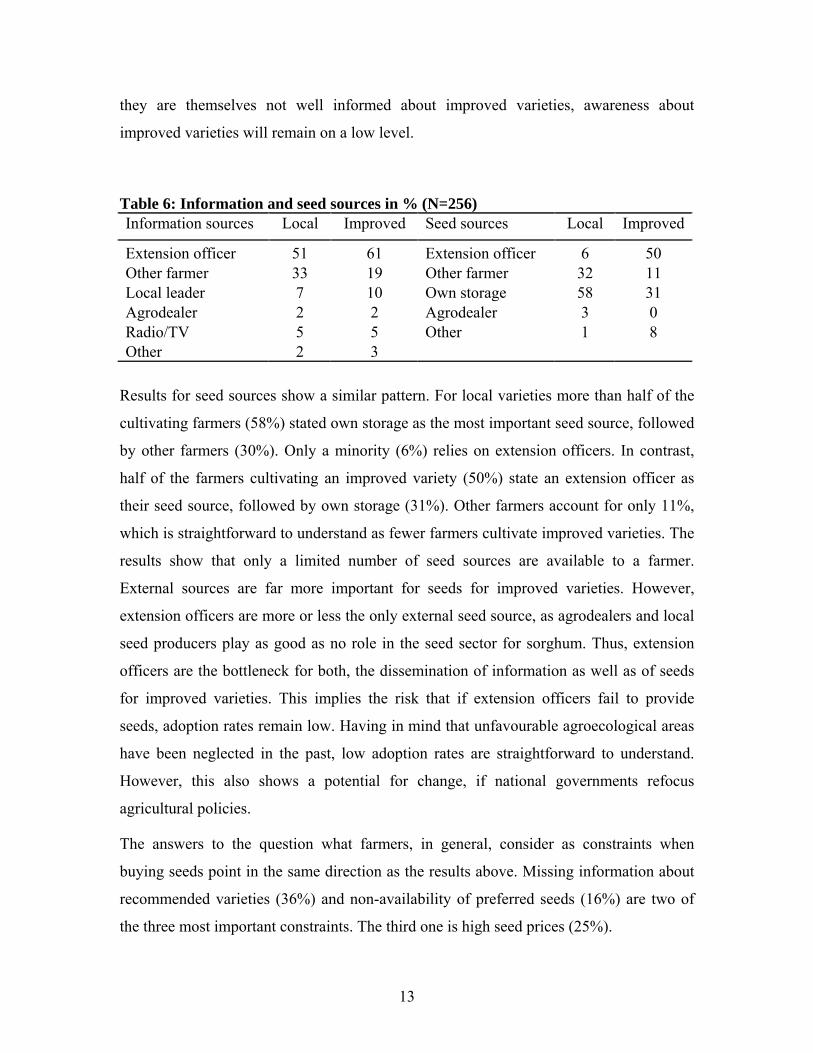
13
they are themselves not well informed about improved varieties, awareness about
improved varieties will remain on a low level.
Table 6: Information and seed sources in % (N=256) Information sources Local Improved Seed sources Local Improved
Extension officer 51 61 Extension officer 6 50 Other farmer 33 19 Other farmer 32 11 Local leader 7 10 Own storage 58 31 Agrodealer 2 2 Agrodealer 3 0 Radio/TV 5 5 Other 1 8 Other 2 3
Results for seed sources show a similar pattern. For local varieties more than half of the
cultivating farmers (58%) stated own storage as the most important seed source, followed
by other farmers (30%). Only a minority (6%) relies on extension officers. In contrast,
half of the farmers cultivating an improved variety (50%) state an extension officer as
their seed source, followed by own storage (31%). Other farmers account for only 11%,
which is straightforward to understand as fewer farmers cultivate improved varieties. The
results show that only a limited number of seed sources are available to a farmer.
External sources are far more important for seeds for improved varieties. However,
extension officers are more or less the only external seed source, as agrodealers and local
seed producers play as good as no role in the seed sector for sorghum. Thus, extension
officers are the bottleneck for both, the dissemination of information as well as of seeds
for improved varieties. This implies the risk that if extension officers fail to provide
seeds, adoption rates remain low. Having in mind that unfavourable agroecological areas
have been neglected in the past, low adoption rates are straightforward to understand.
However, this also shows a potential for change, if national governments refocus
agricultural policies.
The answers to the question what farmers, in general, consider as constraints when
buying seeds point in the same direction as the results above. Missing information about
recommended varieties (36%) and non-availability of preferred seeds (16%) are two of
the three most important constraints. The third one is high seed prices (25%).
14
4.3 Comparing adopters and non-adopters
Farmers stated reasons for (non-) adoption provide an overview about adoption barriers
and help to understand the low adoption rates. However, adoption of a new crop variety
confronts a farmer with various constraints, which cannot all be displayed by this
approach. Earlier studies show that adoption constraints differ according to the particular
innovation a farmer is confronted with as well as the general framework conditions (e.g.,
Feder et al., 1985). Based on Cavatassi et al. (2011), we identified the following
categories as in particular important when analysing adoption of improved sorghum
cultivars. First, household characteristics like age and education can hinder the adoption
of new cultivars. Second, farm assets like land constraints and agroecological conditions
may play a role. Another important aspect is the exposure to and accessibility of a new
cultivar. Fourth, the social capital of a farmer effects adoption decisions. Through social
networks farmers are more likely to learn from experiences from others and repeat those.
Regional effects, captured through the location of a farmer, can also act as a constraint.
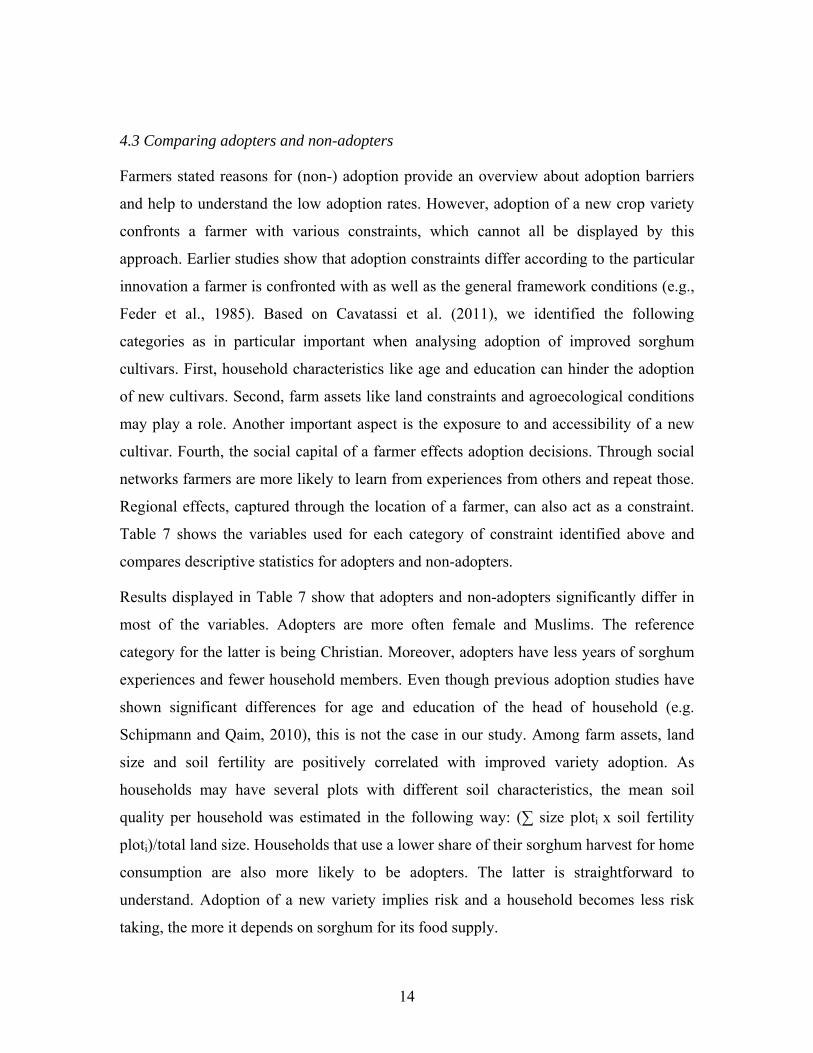
Table 7 shows the variables used for each category of constraint identified above and
compares descriptive statistics for adopters and non-adopters.
Results displayed in Table 7 show that adopters and non-adopters significantly differ in
most of the variables. Adopters are more often female and Muslims. The reference
category for the latter is being Christian. Moreover, adopters have less years of sorghum
experiences and fewer household members. Even though previous adoption studies have
shown significant differences for age and education of the head of household (e.g.
Schipmann and Qaim, 2010), this is not the case in our study. Among farm assets, land
size and soil fertility are positively correlated with improved variety adoption. As
households may have several plots with different soil characteristics, the mean soil
quality per household was estimated in the following way: (∑ size ploti x soil fertility
ploti)/total land size. Households that use a lower share of their sorghum harvest for home
consumption are also more likely to be adopters. The latter is straightforward to
understand. Adoption of a new variety implies risk and a household becomes less risk
taking, the more it depends on sorghum for its food supply.
15
Table 7: Descriptive statistics of adopters and non-adopters
Total (N=256)
Non-adopter (N=187)
Adopter (N=69)
Household characteristics Household head is female (%) 10.6 8.0 17.4** Age household head (years) 45.6 45.7 45.4 Moslem1 (%) 53.5 44.4 78.3*** Education (years) 6.4 6.5 6.3 Sorghum experiences (years) 20.1 21.4 16.5*** No. of household members 6.5 6.7 6.0*** Farm characteristics Total land (ha) 5.0 3.8 8.3*** Soil fertility (1= poor, 2= medium, 3= good) 2.1 2.0 2.2*** % consumption of sorghum harvest 79.1 83.9 66.0*** Exposure to new varieties 1st information source: other farmer (%) 35.0 28.3 15.9** 1st information source: extension officer (%) 57.8 57.8 58.0 1st information source: other source (%) 17.2 13.9 26.1** Farmer has no access to seed sources outside the village (%) 21.9 58.0 8.6***
Ownership mobile phone (%) 44.1 38.5 59.4*** Social capital Member in a farmer organization (%) 32.0 26.7 46.4*** No. of farmers knowing an improved variety on village level 8.2 8.3 7.8
No. of improved varieties known by a farmer 1.0 0.6 1.8***
Wards
Kingale 18.8 15.0 29.0** Kwamtoro 17.6 10.2 37.7*** Sanzaawa 14.4 15.0 13.0 Mungaa 34.0 39.6 18.8*** Ntuntu 15.2 20.0 1.5***
Notes: Mean values are shown. *, **, *** differences are significant at the 10%, 5%, and 1% level, respectively. T-test and chi-square are used for continuous and categorical variables, respectively. Differences are always tested between adopters and non-adopters. 1The reference variable is households who are Christian.
In terms of variables capturing exposure, the information source for new sorghum
cultivars plays an important role. Adopters rely significantly less on other farmers and

16
significantly more on other information sources, which comprises local leaders,
agrodealers and radio/tv. In line with our earlier findings, adopter groups cannot be
distinguished in regard to having extension officers as the most important information
source. This confirms our conclusion that quality of extension rather than access to it is a
constraint for farmers. The other two variables in this category also differ significantly.
Fewer adopters are seed constraint, which is reflected in the variable ‘no access to seed
sources outside the village’ and more adopters own a mobile phone. In regard to social
networks, adopters know more improved sorghum cultivars and more adopters are a
member of an organization. The latter is a common finding in the adoption literature (e.g.
Matuschke and Qaim, 2009) Four out of five regional variables also differ significantly.
A higher share of adopters lives in Kingale and Kwamtoro ward, whereas Mungaa and
Ntuntu ward host a lower share.
4.4 Specification of the adoption model
Differences in mean values should not be over-interpreted, since possible confounding
factors are not controlled for. This requires estimation of appropriate regression models.
In our study, as in many other cases, exposure to the new technology is a pre-condition
for a positive adoption outcome. While there is a broad literature on adoption behaviour
of smallholder farmers, few studies explicitly addressed this aspect (Diagne, 2006;
Simtowe, 2010). Earlier studies often analysed adoption of an innovation by applying
classical adoption models such as probit or tobit. However, the fact that not all farmers
are exposed to the new technology makes it difficult to obtain consistent estimates of the
determinants of adoption from these models (Diagne and Demont, 2007; Dimara and
Skuras, 2003).
The analysis in this paper is therefore based on the theoretical framework proposed by
Diagne and Demont (2007), which suggests the following argument. In an early stage of
an innovation, the target population is not necessarily fully exposed to it. Thus, classical
adoption models that do not account for the (non-) exposure lead to biased and
inconsistent estimates, even when based on a randomly selected sample. The reason is a
twofold selection bias. First, farmers who are not aware of an innovation cannot adopt it,

17
even though they might have done so in the case of knowing the innovation. Diagne and
Demont (2007) call this the non-exposure bias. Second, farmers who have a higher
propensity to be adopters might either self select to exposure or be particularly targeted
by an organization that introduces the innovation. This leads to a classical selection bias,
also known in other situations.
Diagne and Demont (2007) developed an approach to overcome this problem. Based on
different scenarios, they apply different assumptions and estimation procedures to
account for the non-exposure and self selection of part of the population. For a detailed
description see Diagne and Demont (2007).
In our case the conditional independence (CI) assumption holds true. It states that the
treatment status w is independent of the potential treatment outcomes y0 and y1 and
conditional on an observed set of covariates x. In other words, there is no targeted
exposure of part of the population. Thus, determinants of adoption can be derived
through parametric estimation procedures, e.g. probit models, from the subsample of only
exposed farmers. We apply the CI assumption, because there are currently no initiatives
that promote new sorghum cultivars to only part of the population in the two districts and
conditional on observed factors all farmers are assumed to have the same likelihood of
exposure. We have also estimated a two stage heckman model to test for the self selection
of farmers to exposure. The estimated coefficient of the inverse mills ratio was not
significant, indicating that there is no selection bias. We therefore estimate a simple
probit model based on the subsample of exposed farmers.
The dependent variable in our model is ‘adoption’. The variable is 1 if the household
cultivated at least one improved variety in the 2009/10 planting season and 0 otherwise.
The independent variables are those explained in Table 7. The general reduced form for
adoption of improved sorghum varieties can thus be written as follows:
AISV = f (HH, FA, Exp, Soc, Reg),
where adoption of an improved sorghum cultivar (AISV) is explained by household
characteristics (HH), farm assets (FA), exposure status (Exp), social capital (Soc) and
regional variables (Reg). In the adoption model, we apply the same underlying
assumption as Matuschke et al. (2007) that farmers base decisions on utility, rather than

18
profit maximization. This assumption is reasonable, because sorghum is grown on a
semi-subsistence basis, with an average of more than 80% of the produce kept for
consumption by the household (Table 2). In addition, farmers are assumed to be risk
averse, as the majority of them are smallholders who operate in a poverty- stricken
environment.
Our main interest lays in the explanation of adoption decisions. However, low adoption
rates might be caused by low information levels, or low actual adoption or a combination
of both. Each case demands for different policy interventions. If e.g. information levels
are low, more efforts are needed to make the variety known. However, if actual adoption
is low, dissemination constraints need to be overcome (Diagne, 2006). In this study, only
half of the sample population knows at least one improved sorghum variety. It is
therefore important to also understand the determinants of awareness about new sorghum
cultivars. For this purpose, we estimate a probit model with the dependent variable
‘awareness’. The dummy variable equals 1 if a household knows at least one improved
sorghum variety and 0 otherwise. Unless stated in the discussion of the results, the
independent variables are the same as for the adoption model.
4.5 Estimation Results
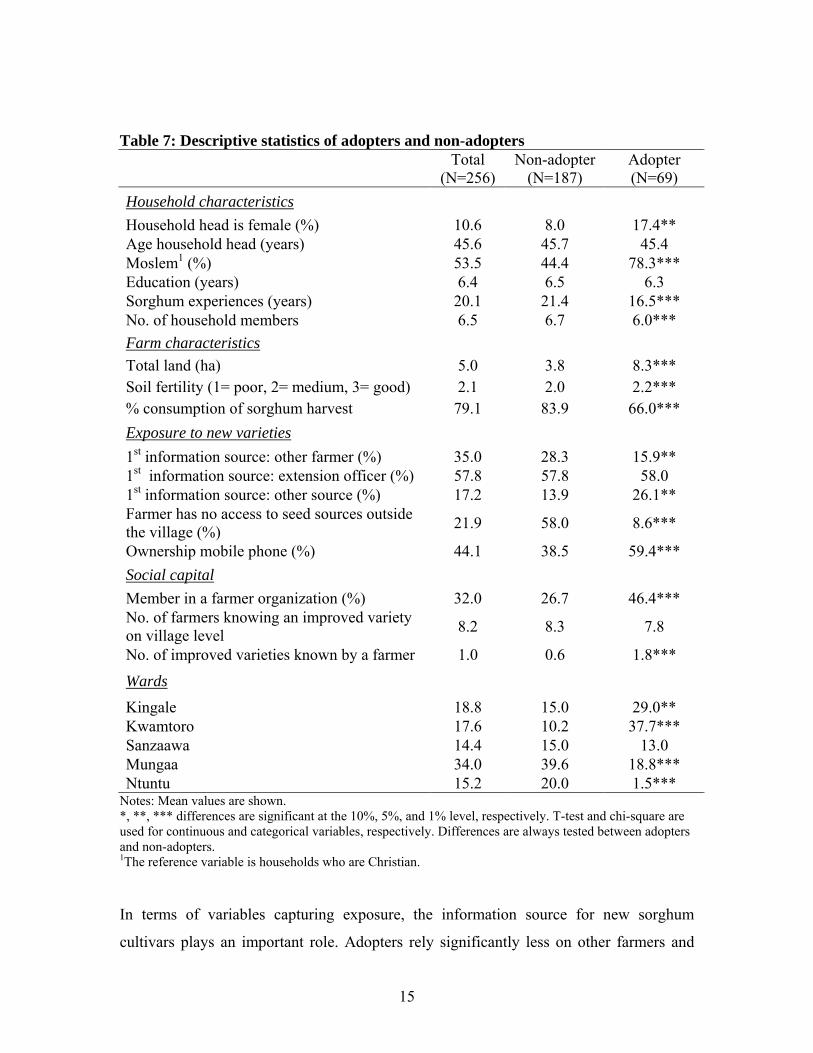
Results for both models, information and adoption, are displayed in Table 8. Coefficients
always reflect marginal effects.
We did not include the variables soil fertility and share of harvest used for home
consumption in the information model, as there is no relation between those two variables
and a potential awareness about improved sorghum cultivars. We obviously also did not
include the variable ‘number of improved varieties known by a farmer’ in the model.
Instead we included a variable that captures the number of farmers who know at least one
improved variety on a village level. Diagne and Demont (2007) used the number of
improved NERICA rice varieties known in a village in their study on rice in Cote
d’Ivoire. We also tested this variable and it leads to the same results.

19
Results for the information model show several significant variables. As in the
descriptive statistics, being a Muslim (compared to being a Christian) increases the
likelihood of knowing an improved variety. Muslims might be better organized in
internal or external networks, or might generally be more open to new information.
Interestingly, neither other household characteristics nor one of the farm asset variables
show a significant effect. Based on our findings above and also the findings from other
studies (e.g. Diagne, 2006), we expect exposure and network variables to have a
significant effect on knowing improved sorghum varieties. Indeed, two exposure and one
network variable show a significant effect. If other farmers are the main information
source for new varieties, the probability of knowing an improved variety is reduced. The
reference variable is farmers, who have extension officers as their main source of
information. This result is plausible and in line with the descriptive statistics. As few
farmers know improved varieties, knowledge is less likely disseminated through other
farmers. The same holds true for seed sources. If a farmer does not have access to seed
sources outside the village and thus relies on own storage or other farmers, the farmer is
less likely to be informed about new sorghum varieties. In contrast and as expected,
membership in an organization increases the likelihood that a farmer knows an improved
sorghum variety. The same was found by Simtowe et al. (2010) for improved groundnut
varieties in Malawi. Thus targeted information exchange as occurring in organizations
can promote the dissemination of information. In regard to regional effects, only the
dummy variable for Sanzaawa ward increases the likelihood of knowing an improved
variety. The reference variable is Ntuntu ward. Thus, regional effects are small.
We can conclude from these results that social networks, which comprise persons and
institutions, with which farmers regularly interact as well as those, to whom a farmer has
access for specific needs, e.g. seeds, have the greatest influence on information
dissemination. The more diversified these networks are, the higher the likelihood that a
farmers accesses information about new sorghum varieties.
Turning to the adoption model, we also find various significant variables. The household
characteristics years of education and years of sorghum experiences both effect adoption
negatively. While the latter could have been expected to increase the likelihood of
adoption, the opposite is also plausible. Farmers who are less experienced are often more
20
likely to experiment with innovations. The same was e.g. found by Odendo et al. (2010)
for the adoption of soil fertility enhancing technologies in Western Kenya.
Table 8: Modeling information and adoption of improved sorghum cultivars Information model Adoption model Variable dy/dx Stand. dev. dy/dx Stand. dev. Household head is female (d) -0.06 0.12 0.07 0.23 Age (years) 0.01 0.01 0.01 0.01 Education (years) 0.07 0.05 -0.19* 0.12 Muslim (d) 0.15 ** 0.08 -0.01 0.15 Sorghum experiences (years) -0.01 0.01 -0.02** 0.01 No. of household members -0.02 0.02 -0.02 0.03 Total land (ha) 0.01 0.01 0.01 0.01 Soil fertility (1= poor, 2= medium, 3= good) -0.23* 0.14 % consumption of sorghum harvest -0.01* 0.00 Major information source: other farmer (d) -0.14** 0.08 0.03 0.17 Major information source: other (d) -0.03 0.10 0.34* 0.13 Farmer has no access to seed sources outside the village (d) -0.17** 0.08 -0.73*** 0.07
Ownership mobile phone (d) -0.01 0.07 0.34** 0.13 Member in a farmer organization (d) 0.14** 0.07 0.17 0.13 No. of farmers knowing an improved variety on village level 0.01 0.01
No. of improved varieties known by a farmer 0.04 0.09 Kingale (d) 0.19 0.11 0.33 0.23 Kwamtoro (d) 0.15 0.12 0.47* 0.19 Sanzaawa (d) 0.22* 0.10 -0.12 0.31 Mungaa (d) 0.06 0.10 0.34 0.21 Constant -0.47 0.5 4.2** 1.9 N 256 143 LR chi2 42*** 109*** Pseudo R2 0.12 0.55
Notes: *, **, *** significant at the 10%, 5%, and 1%level, respectively. (d) = dummy variable.
The negative result for education is surprising. Usually, better educated farmers are more
open to innovations. In our case, however, these farmers might be more critical and thus
reluctant to cultivate new varieties. Although not significant, education had e.g. also in
the study of Diagne (2006) on the adoption of NERICA rice varieties in Cote d’Ivoire a
negative coefficient. Adoption is also negatively influenced by two farm asset variables.
First, the more fertile the soil, the less likely a farmer adopts new sorghum varieties.
There are two explanations for this. Local varieties, when cultivated on fertile soils,
21
might offer high yields, so that new varieties are less attractive. Moreover, when
relatively high potential soils are available, farmers might prefer to cultivate more maize.
Second, the share of sorghum harvest that is used for home consumption negatively
effects adoption decisions. As discussed earlier, farmers who depend more on sorghum
for their food supply are less likely to take any risk and experiment with new varieties. In
regard to exposure and social asset variables, the model reveals the following results. In
contrast to the negative effect depicted in the information model, having other farmers as
the main information source for new sorghum cultivars does not compromise adoption
decisions. On the other hand, having other information sources like local leaders or
agrodealers, positively influences adoption behaviour. The reference category for both
variables is having an extension officer as the main information source. While ‘other
sources’ do not seem to be more active than extension officers in the dissemination of
information, once knowledge is obtained, they are more likely to support adoption
decisions. In other words, information exchange with extension officers helps to
introduce knowledge about improved sorghum cultivars, but does not positively influence
actual adoption. This is plausible as not all farmers who are having extension officers as a
source of information, also obtain seeds from them. The latter is captured in the variable
for seed constraints, which indeed shows that farmers, who do not have an external seed
source are less likely to adopt a new sorghum variety. This raises the question, why
farmers who access extension officers for information exchange, do not access them for
seed supply. As farmers have mentioned non-availability of seeds as a major adoption
constraints, it might be that the extension service is not equipped with enough seed for all
interested farmers. Matuschke and Qaim (2008) have e.g. shown for the case of hybrid
pearl millet adoption in India that adoption rates increased when the formerly state
controlled seed market was liberalized and private companies started to supply seeds.
Ownership of a mobile phone, which did not show an effect in the information model,
does positively influence adoption. Farmers who own a mobile phone, which is also a
new technology, might be more progressive farmers, which are also more likely to adopt
other innovations. Moreover, mobile phones are an important communication tool, which
can broaden the networks of farmers. Regional effects are again limited. Interestingly,
even though farmers in Sanzaawa ward are more likely to know improved varieties, they
22
are not more likely to adopt them. The situation is the opposite way round in Kwamtoro
ward. To better understand these effects, results need to be discussed with stakeholders in
the respective ward.
In general, the adoption model confirms our earlier findings. Once information barriers
are overcome, other adoption barriers exist. These are found on two levels. First, the
interest of farmers, reflected e.g. in the fact that better educated and more experienced
farmers less likely adopt new varieties. Second the adoption ability of farmers, reflected
in various access constraints.
5. Conclusions
We have analysed the contribution of sorghum to the food supply of a household and
determinants of adoption of improved sorghum cultivars among smallholder farmers in
Central Tanzania. Sorghum is an important staple crop in the semi-arid areas of Tanzania
and cultivated by many farmers. However, in regard to total area cultivated and total
production quantities, maize is even more important. Accordingly, maize currently also
contributes more to the food supply of a household. While sorghum is better adapted to
production risks like droughts that occur regularly in semi-arid areas, it is not a high
yielding crop. To improve food security in drought prone areas, the introduction of
improved sorghum varieties that offer competitive yields is therefore necessary. While a
number of improved varieties has been released in Tanzania, only around 50% of the
sample population know at least one improved sorghum variety. Adoption rates are even
lower.
We displayed farmers’ stated reasons and applied econometric techniques to understand
the determinants of both, awareness and adoption of improved sorghum cultivars. Our
analysis has shown that farmers can only access a limited number of sources to obtain
information about new sorghum cultivars. Strikingly, at an early stage of an innovation
diffusion process, access to relevant information sources is a major success factor for the
dissemination of an innovation. Schipmann and Qaim (2010) found the same result for
sweet pepper adoption in Thailand. However, most farmers rely on other farmers as an
information source, who are most often also not aware about new sorghum cultivars.

23
Moreover, our analysis has shown that access to extension officers and membership in an
organization increases the likelihood of knowing improved sorghum varieties.
Despite the lack of awareness, adoption is restricted by seed constraints and other social
network variables. Moreover, some household characteristics hinder adoption. The fact
that better educated and more experienced farmers are less likely to adopt new varieties
might be a hint that the currently available varieties cannot offer obvious advantages over
local varieties. Results from farmers’ stated reasons about non-adoption point in the same
direction. We have not explicitly assessed yield superiority and other advantages of
improved sorghum cultivars in this study. However, this question needs to be addressed
in the future.
Two policy recommendations are proposed to realize the potential of sorghum to
contribute to the food supply of a household and thus to local food security. First, new
sorghum varieties need to be well adapted to local agro-ecological conditions and need to
show a clear yield advantage over local varieties. This advantage must also be widely
demonstrated to farmers. Second, efforts to address information and adoption constraints
need to be increased. As the national extension system plays herein a major role, more
public sector involvement in promoting improved sorghum cultivars is necessary.
Extension officers must themselves be well informed about new sorghum cultivars and
must be accessible for all farmers. Moreover, seed supply systems need to be improved.
This includes the involvement of other stakeholders, like local agrodealers. As our
analysis showed that some farmers are more likely to adopt innovations than others, in
particular progressive farmers should be exposed to information. Additionally the
effective provision of appropriate information through various information channels
needs to be established and networks of information exchange strengthened. Although it
is difficult to directly influence the network of farmers, the provision of different
platforms, like e.g. agricultural fairs, can be a step in the right direction.
24
References Cavatassi, R., L. Lipper, and U. Narloch (2011). ‘Modern variety adoption and risk
management in drought prone areas: insights from sorghum farmers of eastern Ethiopia’. Agricultural Economics, 42(3), 279-292.
Diagne, A. (2006). Diffusion and adoption of NERICA rice varieties in Côte d’Ivoire. The Developing Economies, XLIV-2, 208-231.
Diagne, A., and M. Demont (2007). ‘Taking a new look at empirical models of adoption: average treatment effect estimation of adoption rate and its determinants’. Agricultural Economics, 37(1-2), 201-210.
Dimara, E., and D. Skuras (2003). ‘Adoption of agricultural innovations as a two-stage partial observability process’. Agricultural Economics, 28(3), 187-196.
Edmeades, S., D.J. Phaneuf, M. Smale, and M. Renkow (2008). ‘Modelling the crop variety demand of semi-subsistence households: Bananas in Uganda’. Journal of Agricultural Economics, 59(2), 329–349.
FAO (Food and Agricultural Organization of the United Nations) and ICRISAT (International Crops Research Institute of the Semi-Arid Tropics) (1996). The world sorghum economies: facts, trends and outlook. FAO, Rome, Italy and ICRISAT, Andhra Pradesh, India.
Feder, G., R.E. Just, and D. Zilberman (1985). ‘The adoption of agricultural innovations in developing countries: A survey’. Economic Development and Cultural Change, 33(2), 255–298.
IFPRI (International Food Policy Research Institute) (2011). Food security portal, Tanzania. Accessed at 14 October 2011. http://www.foodsecurityportal.org/tanzania
IPCC (International Panel of Climate Change) (2007). Climate Change 2007: Synthesis Report. IPCC Secretariat, Geneva, Switzerland.
Intsormil (2009). Atlas of sorghum. Production in Eastern and Southern Africa. University of Nebraska, Lincoln.
Koenders, D. (2010). Feasibility study to include sorghum and meat into the WFP basket in Kenya. Report for the WFP, Kenya.
Lipton, M. (2005). ‘What priorities for improved agricultural technology?’. Presentation at the Future Agricultures Consortium on Achieving pro poor growth through agriculture: The challenges. London.
Lipton M., and R. Longhurst (1989). New seeds and poor people. London: Routledge.
Mafuru, J.M., D.W. Norman, and J.S. Fox (2007). ‘Consumer perception of sorghum variety attributes in the Lake Zone Tanzania’. Conference proceedings, Association of African Agricultural Economics, 171-176.
Matuschke, I., and M. Qaim (2009). ‘The impact of social networks on hybrid seed adoption in India’. Agricultural Economics, 40, 493-505.
25
Matuschke, I., and M. Qaim (2008). ‘Seed market privatisation and farmers’ access to crop technologies: the case of hybrid pearl millet adoption in India’. Journal of Agricultural Economics, 59(3), 498–515.
Matuschke, I., R.R. Mishra, and M. Qaim (2007). ‘Adoption and impact of hybrid wheat in India’. World Development, 35(8), 1422-1435.
Mekbib, F. (2006). “’Farmer and formal breeding of sorghum (Sorghum bicolour (L.) Moench) and the implications for integrated plant breeding’. Euphytica 152, 163–176.
Miller, F.R., L. Cisse, E. Hanak-Freud, and J.H. Sanders (1996). Report of the Center Commissioned External Review (CCER) of the ICRISAT Western and Central African Region. ICRISAT, Andhra Pradesh, India.
Noltze, M., S. Schwarze, and M. Qaim (2011). Understanding the adoption of systemic innovations in smallholder agriculture: the System of Rice Intensification (SRI) in Timor Leste. Paper prepared for presentation at the EAAE 2011 Congress, August 30 to September 2, ETH Zurich, Zurich, Switzerland
Odendo, M., G. Obare, and B. Salasya (2010). Determinants of the speed of adoption of soil fertility enhancing technologies in Western Kenya. Contributed Paper presented at the Joint 3rd African Association of Agricultural Economists (AAAE) and 48th Agricultural Economists Association of South Africa (AEASA) Conference, Cape Town, South Africa, September 19-23.
Pingali, P.L., and M.W. Rosegrant (1998). ‘Supplying wheat for Asia’s increasingly westernized diets’. American Journal of Agricultural Economics, 80(5), 954–959.
Ratin (2011). Monthly price data. Accessed at 14 October 2011. http://www.ratin.net/
Rohrbach, D.D., and J.A.B. Kiriwaggulu (2007). ‘Commercialization prospects for sorghum and pearl millet in Tanzania’. Working paper series no. 7. Journal of SAT Agricultural Research.
Schipmann, C., and M. Qaim (2010). ‘Spillovers from modern supply chains to traditional markets: product innovation and adoption by smallholders’. Agricultural Economics, 42 (3-4), 361-371.
Simtowe, F., S. Asfaw, A. Diagne, and B. Shiferaw (2010). Determinants of Agricultural Technology adoption: the case of improved groundnut varieties in Malawi. Paper presented at the Joint 3rd African Association of Agricultural Economists (AAAE) and 48th Agricultural Economists Association of South Africa (AEASA) Conference, Cape Town, South Africa, September 19-23.
Union Africaine (2005). Situation de la Sécurité Alimentaire et Perspectives pour le Développement de l’Agriculture en Afrique. Conférence des Ministres de l’Agriculture de l’Union Africaine 31 Janvier au 1er Février, 2006 Bamako, Mali.
WFP (World Food Programme) (2011). Country profile Tanzania. Accessed at 14 October 2011. http://www.wfp.org/countries/Tanzania--United-Republic-Of/Overview