dryland pastures - lincoln university · dr derrick moot. professor of plant science. dryland...
TRANSCRIPT
Dr Derrick MootProfessor of Plant Science
Dryland pastures
Delaware 17th November 2015
This work by the Lincoln University Dryland Pastures Research Team is licensed under a Creative Commons Attribution-NonCommercial-NoDerivatives 4.0 International License.
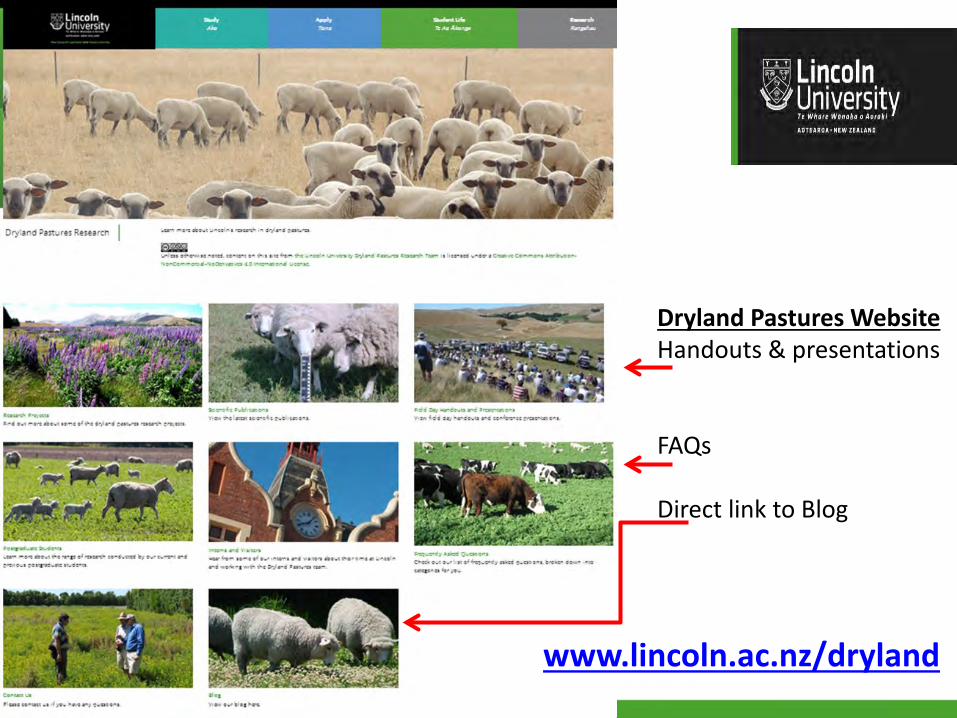
www.lincoln.ac.nz/dryland
Dryland Pastures WebsiteHandouts & presentations
FAQs
Direct link to Blog

Dry matter yield and botanical composition of the ‘MaxClover’ grazing experiment at Lincoln University, Canterbury, New Zealand
PHOTO DIARY - 2002/03 to 2010/11
Funded by:
Prepared by: DJ Moot; A Mills; RJ Lucas; KM Pollock; M SmithLincoln University Dryland Pastures Research TeamAvailable at: http://www.lincoln.ac.nz/Lincoln-Home/Research/Current-Research/Dryland-Pastures-Research/Research-Projects/MaxClover-Grazing-Experiment/
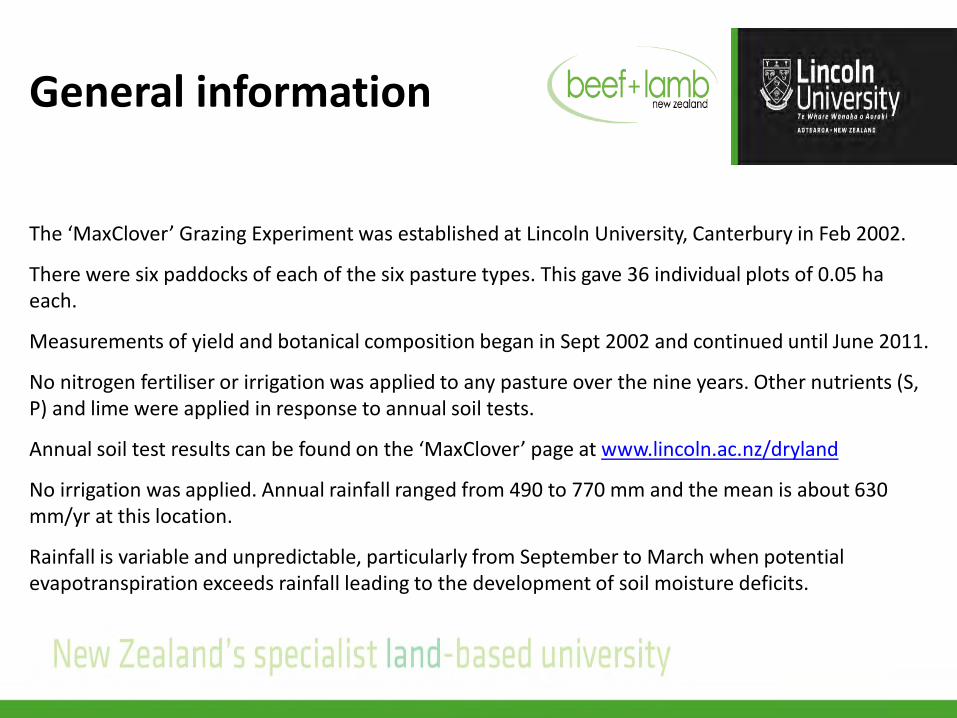
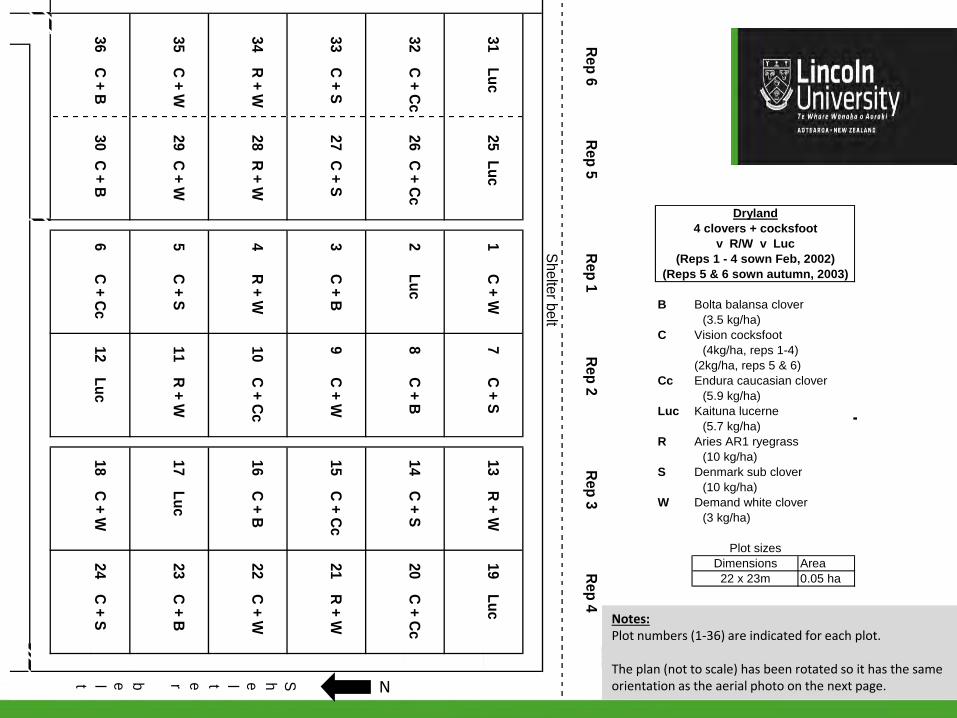
The ‘MaxClover’ Grazing Experiment was established at Lincoln University, Canterbury in Feb 2002.
There were six paddocks of each of the six pasture types. This gave 36 individual plots of 0.05 ha each.
Measurements of yield and botanical composition began in Sept 2002 and continued until June 2011.
No nitrogen fertiliser or irrigation was applied to any pasture over the nine years. Other nutrients (S, P) and lime were applied in response to annual soil tests.
Annual soil test results can be found on the ‘MaxClover’ page at www.lincoln.ac.nz/dryland
No irrigation was applied. Annual rainfall ranged from 490 to 770 mm and the mean is about 630 mm/yr at this location.
Rainfall is variable and unpredictable, particularly from September to March when potential evapotranspiration exceeds rainfall leading to the development of soil moisture deficits.
General information
Rep 6Rep 5
Rep 1Rep 2
Rep 3Rep 4
Shelter belt
LucLuc
C + WC + S
R + WLuc
C + Cc
C + CcLuc
C + BC + S
C + Cc
C + SC + S
C + BC + W
C + CcR + W
R + WR + W
R + WC + Cc
C + BC + W
C + WC + W
C + SR + W
LucC + B
C + B
C + BC + Cc
LucC + W
C + S12
1824
3630
6
1016
22
3529
511
1723
Shelter belt
3327
39
1521
3428
4
713
19
3226
28
1420
3125
1
N
B Bolta balansa clover(3.5 kg/ha)
C Vision cocksfoot (4kg/ha, reps 1-4)
(2kg/ha, reps 5 & 6)Cc Endura caucasian clover
(5.9 kg/ha) Luc Kaituna lucerne
(5.7 kg/ha)R Aries AR1 ryegrass
(10 kg/ha) S Denmark sub clover
(10 kg/ha)W Demand white clover
(3 kg/ha)
Dimensions Area22 x 23m 0.05 ha
Plot sizes
(Reps 5 & 6 sown autumn, 2003)
Dryland4 clovers + cocksfoot
v R/W v Luc(Reps 1 - 4 sown Feb, 2002)
Notes:Plot numbers (1-36) are indicated for each plot.
The plan (not to scale) has been rotated so it has the same orientation as the aerial photo on the next page.

The ‘MaxClover’ Grazing experiment in paddock H19 at Lincoln University
RG/WcLucerneCF/SubCF/BalansaCF/CcCF/Wc

Grazing management
Lucerne was always rotationally grazed.
Grass-based pastures underwent a period of set stocking, short (2-paddock) or intermediate (3-paddock) rotational grazing in early spring before being rotationally grazed in a six paddock rotation until insufficient feed supply led to destocking of the pastures (drought or low winter temperatures).
Pastures were generally destocked in winter when there was insufficient feed. This simulated a commercial farm system when sheep would be removed to graze winter forage crops or a smaller area of the farm set aside for winter grazing.
For pastures with annual clovers (sub or balansa) stock were removed to allow re-seeding. The timing differed as pastures were closed sequentially as the rotation progressed.
When necessary, ewes were used to hard graze annual clover pastures in early autumn to open the sward in preparation for the germination of annual clover seedlings after autumn rains.

0
300
600
900
1200
1500(a) CF/Sub (b) CF/Bal (c) CF/Wc
Tota
l ann
ual L
W p
rodu
ctio
n (k
g/ha
)
0
300
600
900
1200
1500(e) RG/Wc(d) CF/Cc (f) Luc
04/05 05/06 06/07 07/08 08/09 09/10 10/1103/0402/03
Not
det
erm
ined
Not
det
erm
ined
Not
det
erm
ined
Not
det
erm
ined
Not
det
erm
ined
Not
det
erm
ined
04/05 05/06 06/07 07/08 08/09 09/10 10/1103/0402/03 04/05 05/06 06/07 07/08 08/09 09/10 10/1103/0402/03
Spring Summer Autumn
Mills et al. 2014b

Total spring LWt production
04/05 05/06 06/07 07/08 08/09 09/10 10/1103/0402/03
CF/SubCF/BalCF/WcCF/CcRG/WcLuc
Not
det
erm
ined
Spr
ing
LWt (
kg/h
a)
0
200
400
600
800
1000
Mills et al. 2014b

Sum
mer
LW
t (kg
/ha)
0
200
400
600
800
1000
Total summer LWt production
04/05 05/06 06/07 07/08 08/09 09/10 10/1103/0402/03
CF/SubCF/BalCF/WcCF/CcRG/WcLuc
Not
det
erm
ined
Mills et al. 2014b

Aut
umn
LWt (
kg/h
a)
0
200
400
600
800
1000
Total autumn LWt production
04/05 05/06 06/07 07/08 08/09 09/10 10/1103/0402/03
CF/SubCF/BalCF/WcCF/CcRG/WcLuc
Not
det
erm
ined
Mills et al. 2014b

Yield and composition of six dryland pastures over nine growth seasons
• Lucerne produced more DM than all grass based pastures in most years.
• Its tap-root enabled access to water from lower soil layers but it also used water more efficiently than the grass based pastures - especially in spring.
• CF/Sub clover was the highest yielding grass based pastures in Years 6-9.
• Yields of all pastures declined over time.
Mills et al. 2014a

Date
Jul02 Jan03 Jul03 Jan04 Jul04 Jan05 Jul05 Jan06 Jul06 Jan07 Jul07 Jan08 Jul08 Jan09 Jul09 Jan10 Jul10 Jan11 Jul11
Tota
l ann
ual a
ccum
ulat
ed D
M y
ield
(t D
M/h
a/y)
0
5
10
15
17.8
12.9
10.5 9.8
8.9
13.1
11.5
10.5
8.4
18.5
11.2
10.0 9.0
11.5
10.0
8.0
17.4
10.810.0
8.4
14.0
11.2
9.0
7.1
14.0
9.0
6.6
5.2
Year 12002/03
Year 32004/05
Year 42005/06
Year 52006/07
Year 62007/08
Year 72008/09
Year 22003/04
Year 82009/10
Year 92010/11
12.8
9.5
8.4
6.7
12.9
8.7
5.8
461 mm 493 mm 635 mm 601 mm 643 mm 651 mm 767 mm 612 mm 602 mm
Figure 1. Total annual accumulated dry matter production
Rainfall
CF/SubCF/Bal CF/Wc CF/Cc RG/Wc Luc
Source: Moot 2012

Summary of yields in Figure 1
• RG/Wc yield declined from 10.5 to 6.6 t/ha in Year 9.
• Lucerne yield was over 17 t/ha in 3 years and 12.9 t/ha in Year 9.
• CF/Sub yield declined from 12 t/ha to 8.7 t/ha in Year 9.
• CF/Wc, CF/Cc, CF/Bal yields were lower than CF/Sub in most years.

Growth season1 2 3 4 5 6 7 8 9
Prop
ortio
n of
sow
n co
mpo
nent
s
0.0
0.2
0.4
0.6
0.8
1.0
2002/03 2003/04 2004/05 2005/06 2006/07 2007/08 2008/09 2009/10 2010/11
All the cocksfoot pastures lost sown components at about 3% per annum
The perennial ryegrass/white clover pasture lost RG+Wc at about 10% per annum
Source: Mills et al., 2014a
Figure 2. Change in the proportion of originally sown pasture components (grass + clover) over time

Summary of Figure 2
• After 9 years about 10% of the RG/Wc pasture was from originally sown species compared with about 60% in the cocksfoot based pastures. Lucerne (not shown) was about 85% pure due to winter weed control.
• In Years 1-3 the RG/Wc pastures maintained a high proportion of ryegrass and white clover. Most experiments only run for 3 years – this long-term experiment shows how this pasture deteriorated from Year 4 to Year 9.
• By Year 5-6 only about half the yield in RG/Wc pastures is from the sown species. Ideally pasture renewal would be recommended at this point.
• By Year 9 only about 10% of the 6.6 t DM/ha that was produced was from RG or Wc.
• For cocksfoot, sown pasture species decreased by about 3% per year. This meant after 9 years about 60% of the total yield produced by the four cocksfoot based pastures was from the originally sown pasture species.
• Cocksfoot was persistent but pasture vigour had declined. These pastures did not require renovation but had the potential for increased production. We recommend overdrilling in autumn with 10 kg/ha sub clover plus 1 kg/ha white clover to increase clover content and nitrogen fertility which would stimulate production from the existing cocksfoot component.

Unsown species <5% in Year 1 ….…>45% in Year 6RG/Wc pastures
Annual grassesTaprooted dicot weeds

20 kg DM/ha/mmGrass only
13 kg DM/ha/mm
Lucerne
Spring WUE
Water use (mm)0 100 200 300
Accu
mul
ated
DM
(t/h
a)
0
2
4
6 28 kg DM/ha/mmGrass/clover
Moot et al. 2008
Lucerne Objectives
• Describe management to maximise production, quality and persistence
• Describe key establishment issues
• Examples of lucerne on farm.

Development:is the ‘age’ or maturity of the regrowth crop
e.g. leaf appearance, flowering
Growth:is dry matter accumulation as a result of light interception and photosynthesis
Growth and development are both influenced by environmental signals
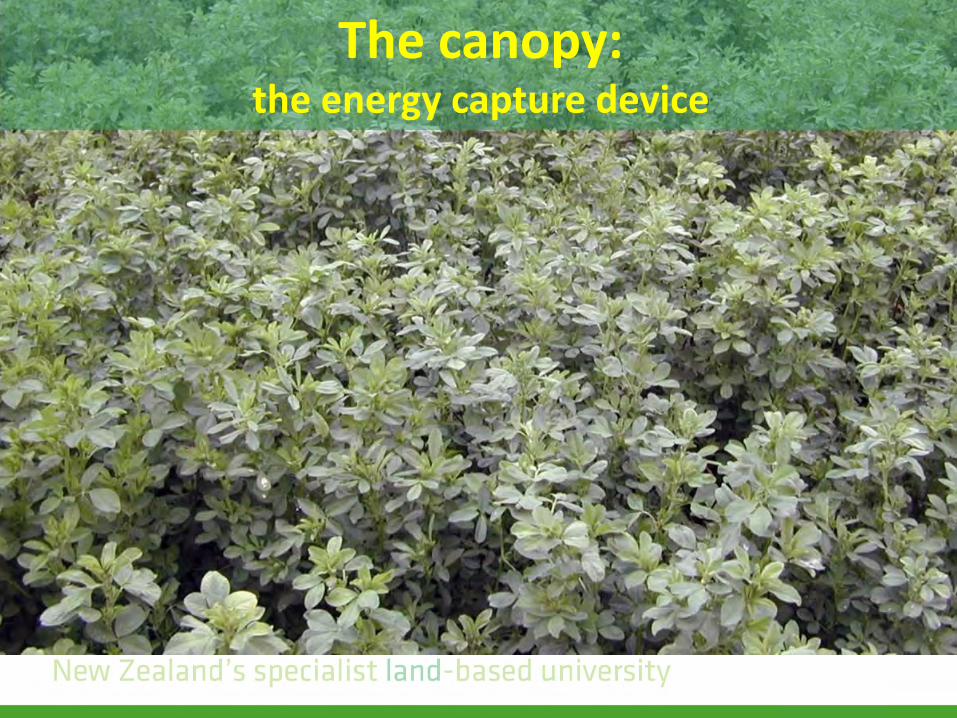
The canopy: the energy capture device

Spring Feb
Jan
Vegetative growth
Mean temperature (oC)0 8 12 16
Gro
wth
rate
(kg
DM/h
a/d)
0
40
80
120
AutumnJuly
Moot et al. 2003

Experiment 2flexible grazing
25 days resting
3 days grazing
38 days resting
4 days grazing

What’s going on down there?

Partitioning to roots
A S O N D J F M A
1.5
2.0
2.5
3.0
3.5
Tap
root
dry
wei
ght (
t/ha
)
Month
42-day
Moot et al. 2003
28-day
Spring
Growing point at the top of the plant
Seasonal grazing management
• 1st rotation aided by root reserves to produce high quality vegetative forage.
• can graze before flowers appear (~1500 kg DM/ha) ideally ewes and lambs but
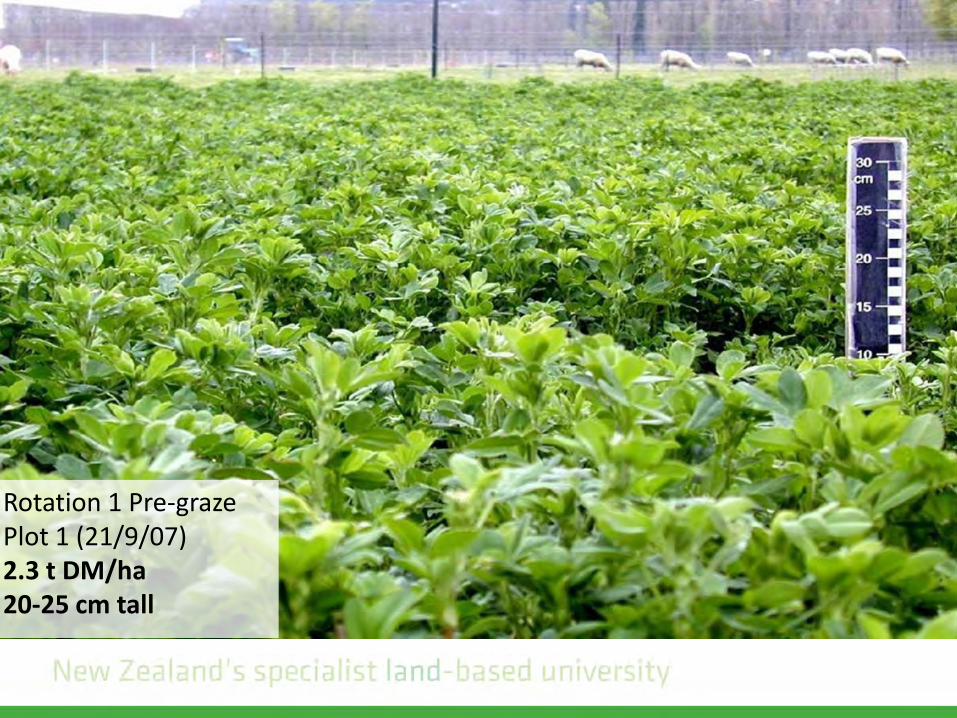
Rotation 1 Pre-grazePlot 1 (21/9/07) 2.3 t DM/ha20-25 cm tall
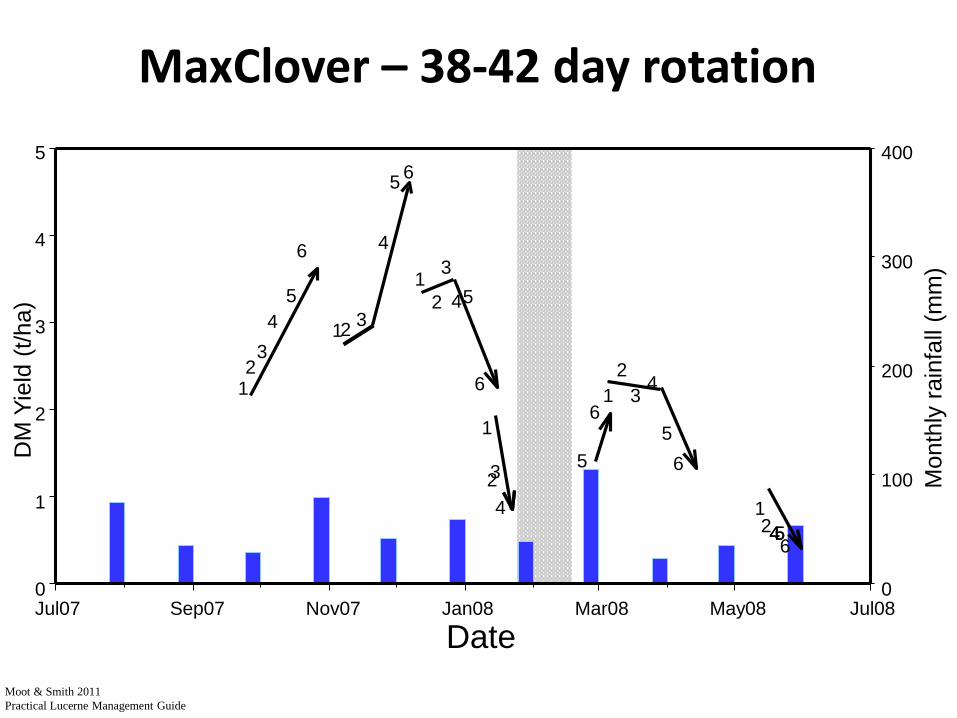
DateJul07 Sep07 Nov07 Jan08 Mar08 May08 Jul08
Mon
thly
rain
fall
(mm
)
DM
Yie
ld (t
/ha)
454
0
1
2
3
4
5
0
100
200
300
400
4
32
1
45
6
321
4
5 6
3
21
45
6
325
16
32
4
5
1
6
2 56
1
MaxClover – 38-42 day rotation
Moot & Smith 2011Practical Lucerne Management Guide

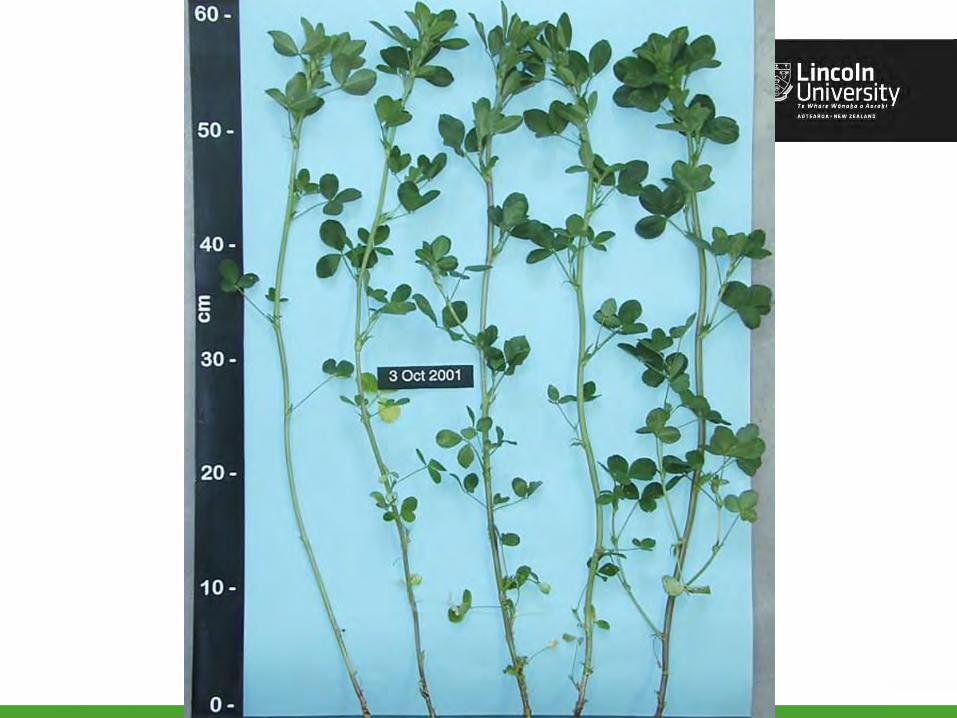
Rotation 2 Pre-grazePlot 1 (2/11/07, 38 d) 2.9 t DM/ha35-40 cm tall
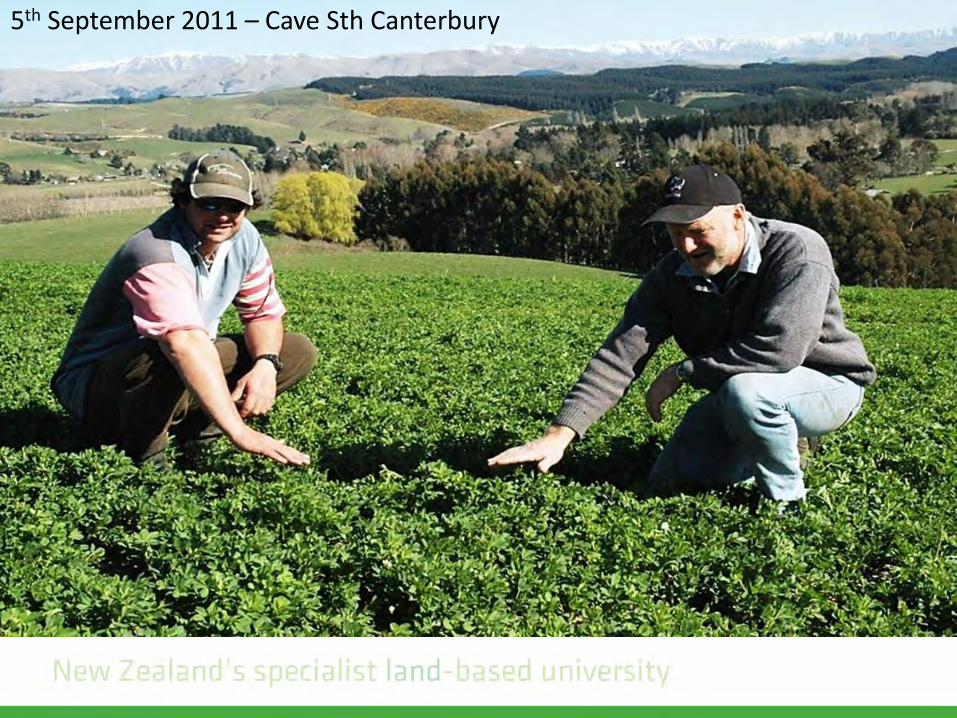
5th September 2011 – Cave Sth Canterbury

• Spring 14 ewes plus twins/ha
• Summer 70 lambs/ha
• Ideally 7-14 days maximum on any one paddock
• Less intensive systems – don’t open the canopy
Stocking rates in New Zealand

Spring grazing
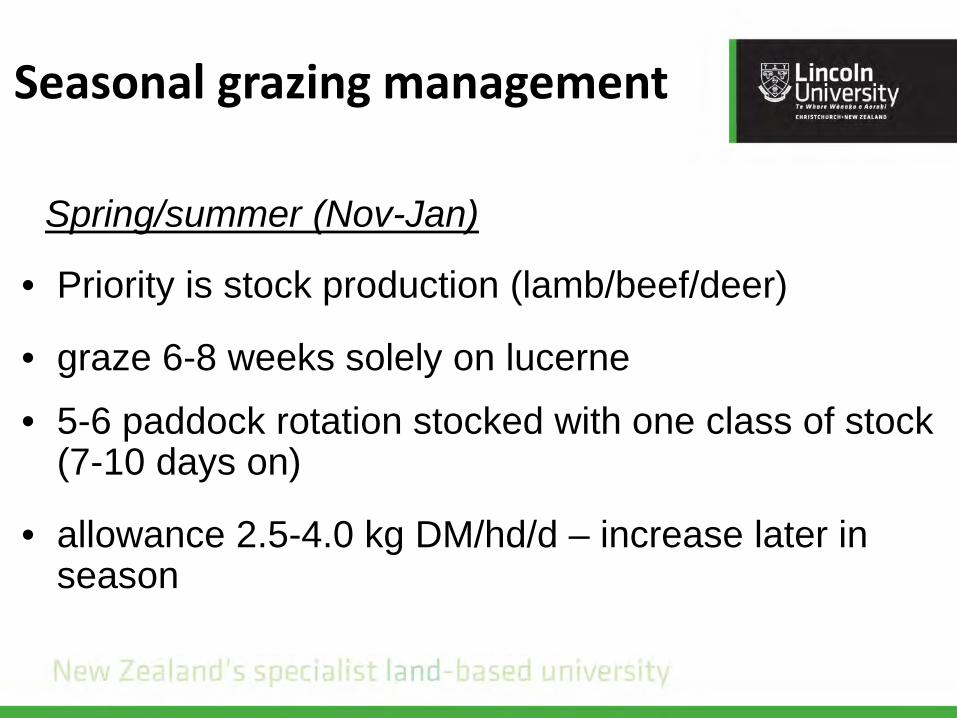
Spring/summer (Nov-Jan)
Seasonal grazing management
• Priority is stock production (lamb/beef/deer)
• graze 6-8 weeks solely on lucerne
• 5-6 paddock rotation stocked with one class of stock (7-10 days on)
• allowance 2.5-4.0 kg DM/hd/d – increase later in season

14 ewes + twins/ha
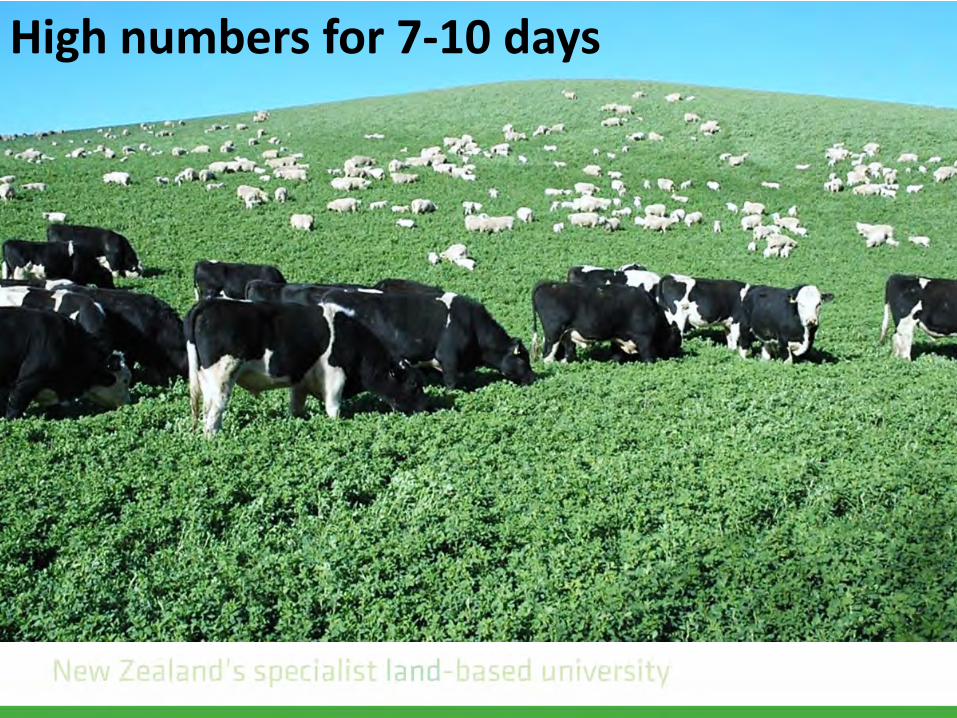
High numbers for 7-10 days
Fibre and salt

Maximize reliable spring growth – high priority stock

Early autumn (Feb-April)
Seasonal grazing management
⇒ build-up root reserves for spring growth and increase stand persistence
• terminal drought ⇒ graze standing herbage
• allow 50% flowering
• long rotation (42 days) somewhere between Jan and end of May.

Rotation 4 Pre-graze Plot 6 (28/2/08)
2.0 t DM/ha produced in 51 d
Autumn = flowering plantsBut don’t flush on this!

Leaves
Stem
0 1 2 3 4 5
ME
(MJ/
kg D
M)
0
4
8
12
16
Yield (t DM /ha)
Metabolisable energy of lucerne
Brown & Moot 2004

• Clostridial bacteria: vaccinate
• Cobalt: vitamin B12 injection
• Worm haven: Camping on small area – river edge?
• Avoid flushing if: leaf spots or flowering lucerne - new regrowth or tops only are O.K.
Animal health

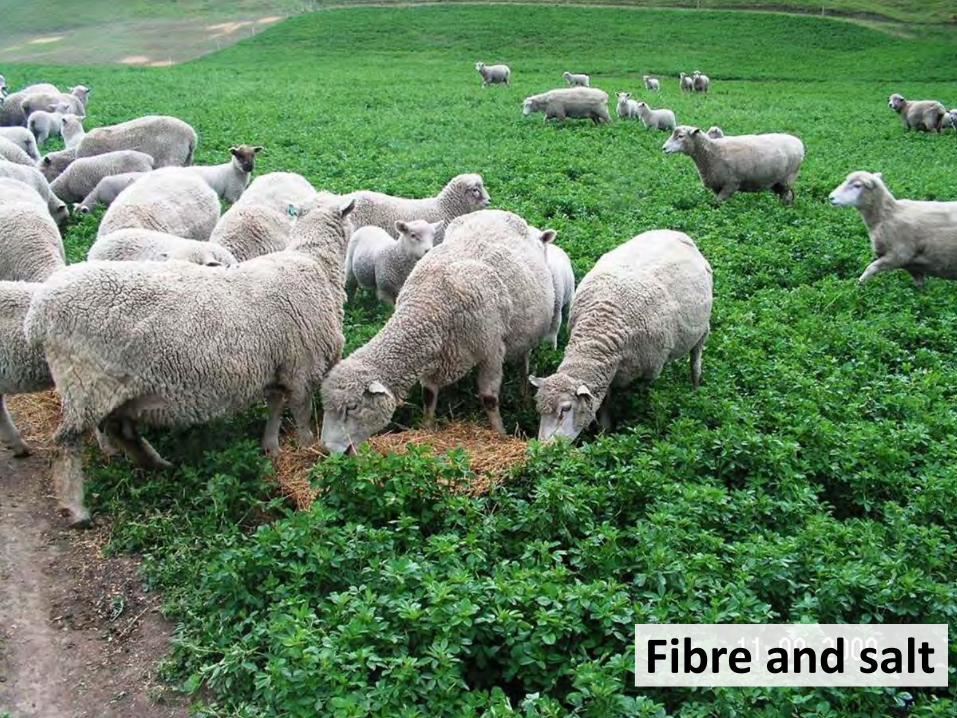
• Redgut: problem on high quality feeds – fibre
• Bloat: cattle more than sheep – capsules
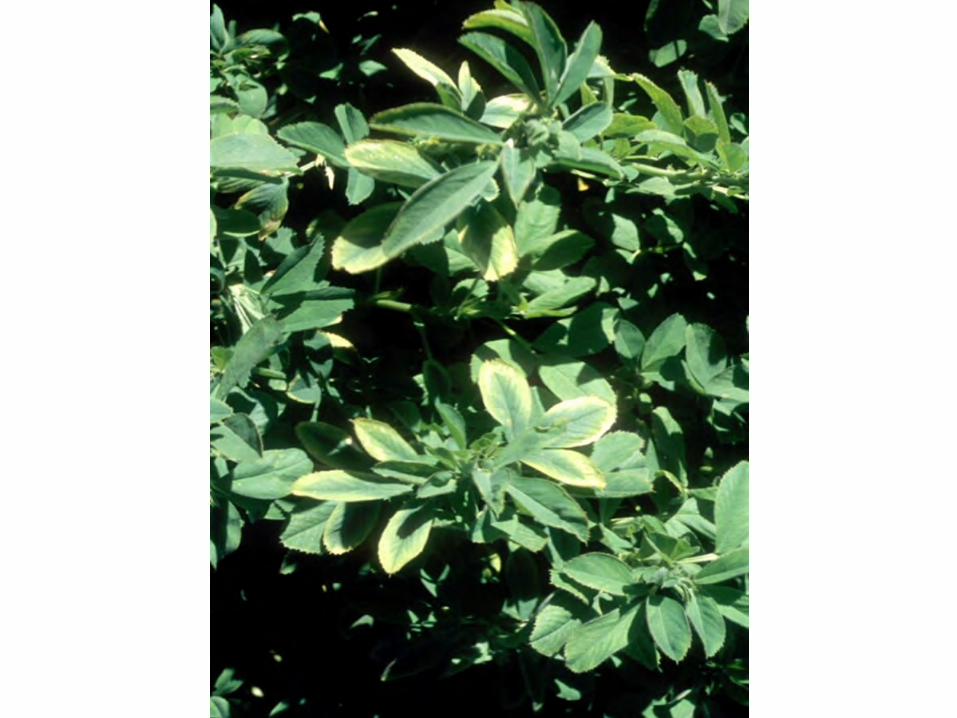
• Na def. (0.03%): salt licks/fence-line weeds/pasture
• Require 0.11% Na - sheep/beef/dairy
Animal health

Autumn SprayingTiming is Critical
Most important toolGlyphosate, granstar, penetrant
Key Results Conserve soil moistureKill mass root systems
Kearney et al. 2010

Drilling seed with fertiliserDirect drilling = seed + fertiliser
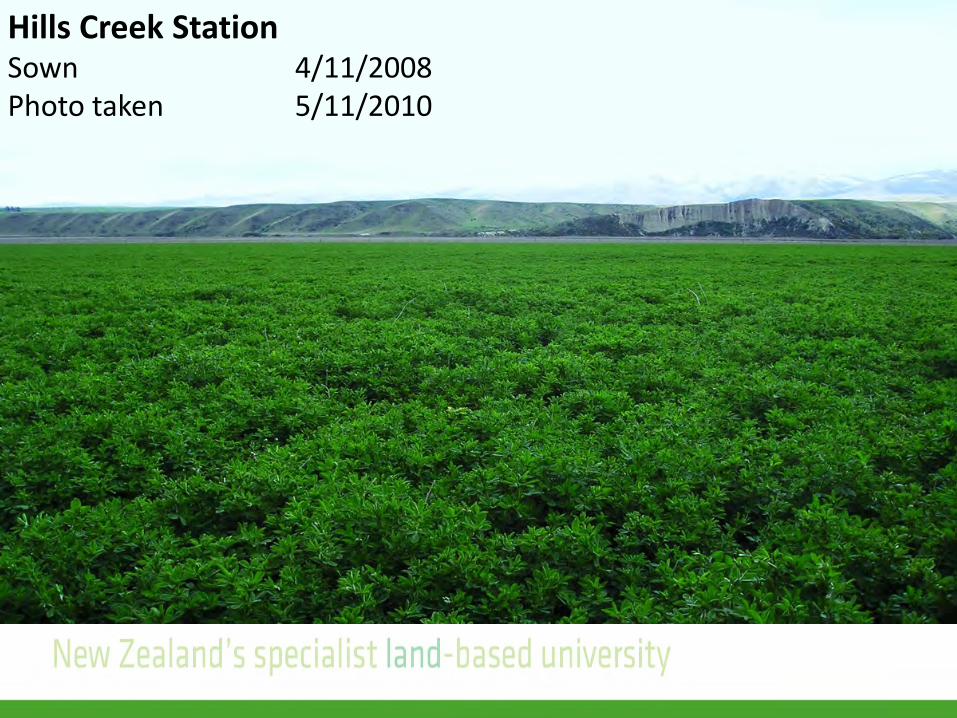
Hills Creek StationSown 4/11/2008Photo taken 5/11/2010

Over 60,000 ha sown and doubling of lucerne seed sales over 10 years
“35% Rate of return on investment”
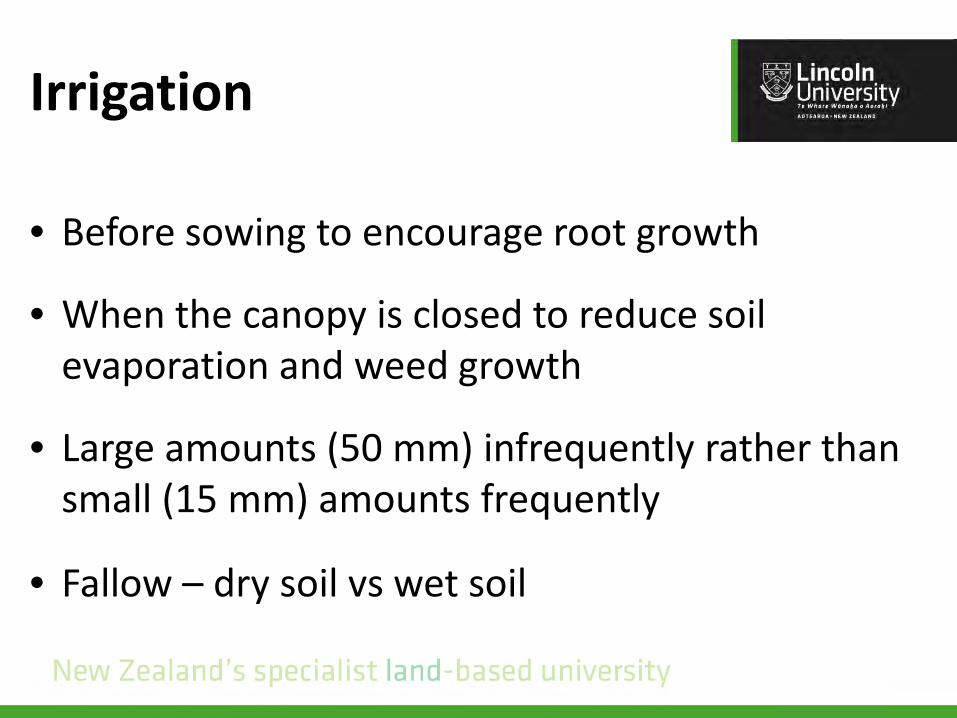
Irrigation
• Before sowing to encourage root growth
• When the canopy is closed to reduce soil evaporation and weed growth
• Large amounts (50 mm) infrequently rather than small (15 mm) amounts frequently
• Fallow – dry soil vs wet soil

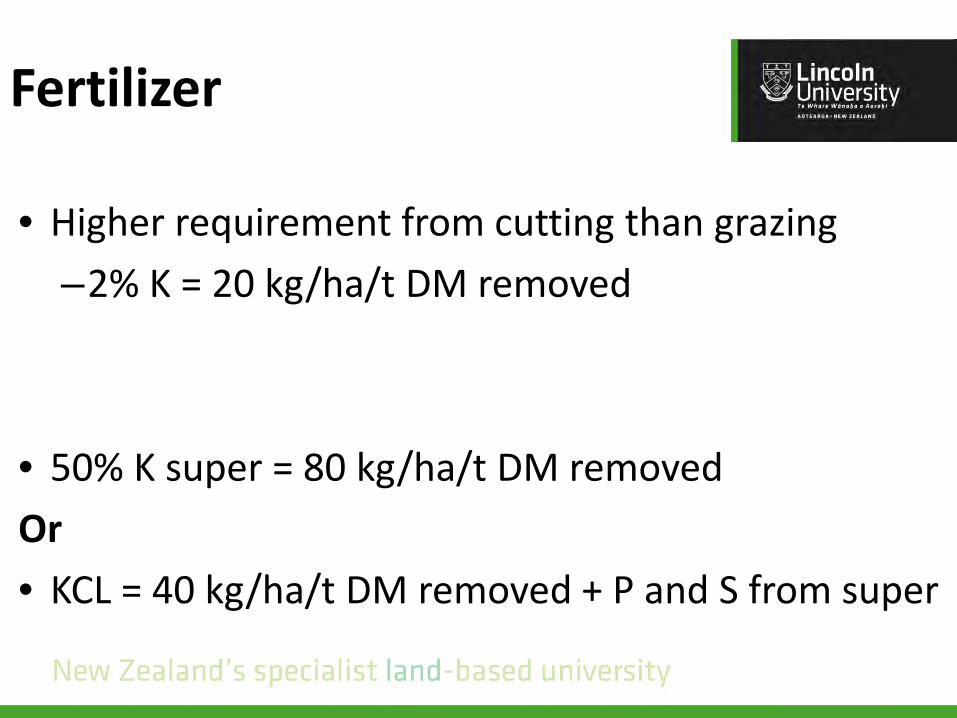
Fertilizer
• Higher requirement from cutting than grazing–2% K = 20 kg/ha/t DM removed
• 50% K super = 80 kg/ha/t DM removedOr• KCL = 40 kg/ha/t DM removed + P and S from super

Integrating lucerne into a high country merino system
D. Anderson, L. Anderson, D.J. Moot and G.I. Ogle
Anderson et al. 2014


Landscape farming

Bog Roy change in system performance
Anderson et al. 2014
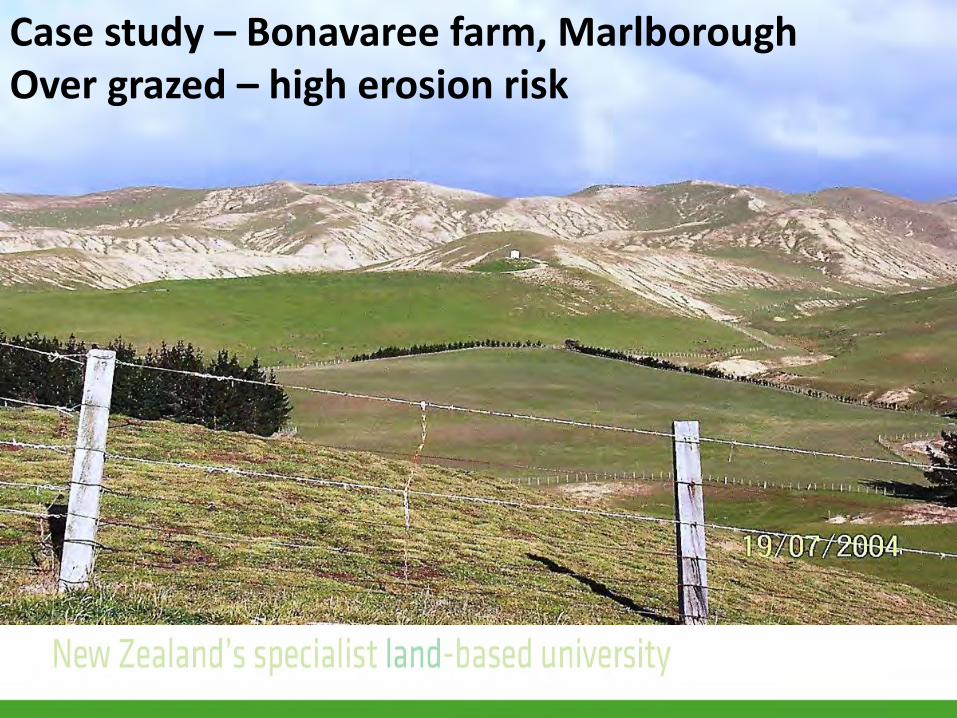
Case study – Bonavaree farm, MarlboroughOver grazed – high erosion risk
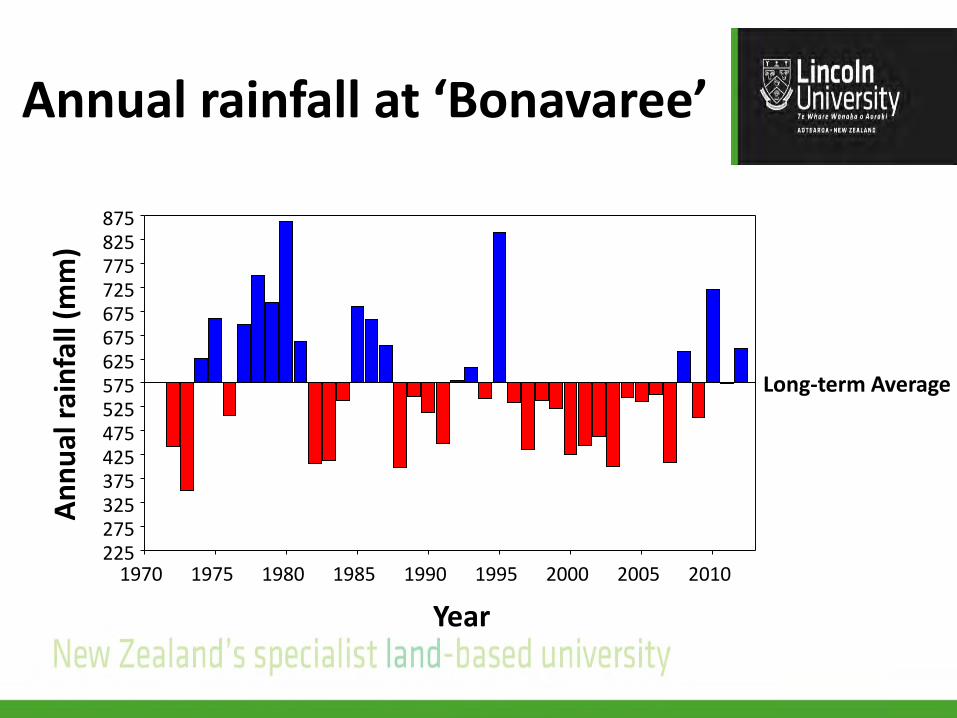
Year1970 1975 1980 1985 1990 1995 2000 2005 2010
Annu
al ra
infa
ll (m
m)
225275325375425475525575625675675725775825875
Annual rainfall at ‘Bonavaree’
Long-term Average
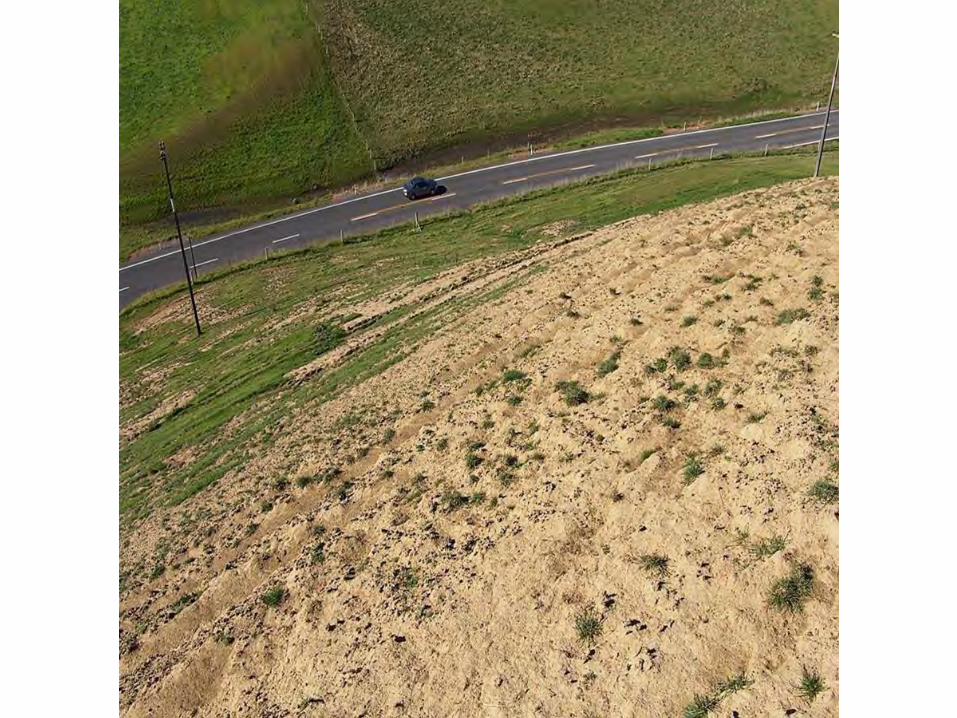

Salt bush
Young lucerne
Chemically fallowed land
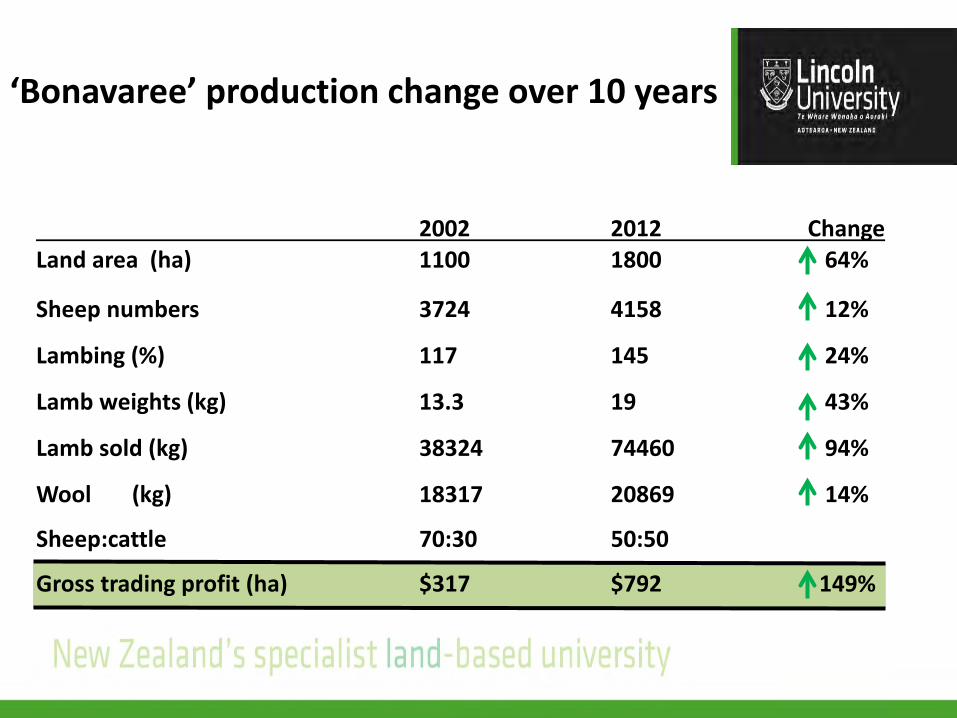
‘Bonavaree’ production change over 10 years
2002 2012 ChangeLand area (ha) 1100 1800 64%
Sheep numbers 3724 4158 12%
Lambing (%) 117 145 24%
Lamb weights (kg) 13.3 19 43%
Lamb sold (kg) 38324 74460 94%
Wool (kg) 18317 20869 14%
Sheep:cattle 70:30 50:50
Gross trading profit (ha) $317 $792 149%
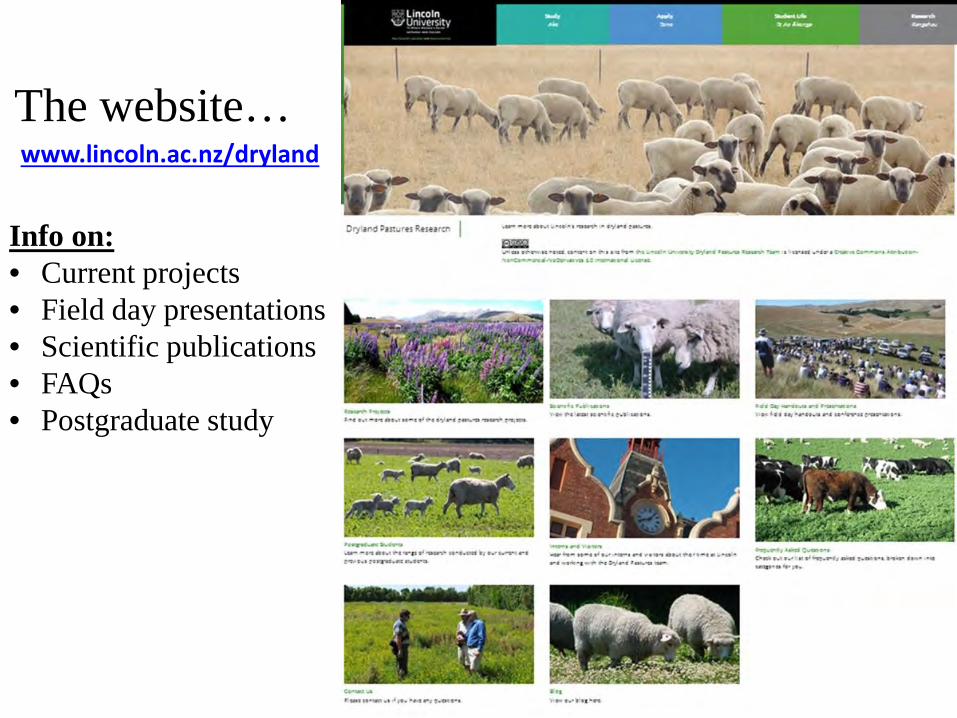
The website…www.lincoln.ac.nz/dryland
Info on:• Current projects• Field day presentations• Scientific publications• FAQs• Postgraduate study
Conclusions
• Lucerne growth rate is seasonal based on storage and remobilization of reserves
• Lucerne can be grazed or cut and carried based on yield – not time of flowering
• Replace nutrients removed through cut and carry (K)
• Minimize soil evaporation by timing of irrigation

Links & References
Dryland Pastures Website: http://www.lincoln.ac.nz/drylandDryland Pastures Blog: https://blogs.lincoln.ac.nz/dryland/
Anderson, D., Anderson, L., Moot, D. J. and Ogle, G. I. 2014. Integrating lucerne (Medicago sativa L.) into a high country merino system. Proceedings of the New Zealand Grassland Association, 76, 29-34.
Brown, H. E. and Moot, D. J. 2004. Quality and quantity of chicory, lucerne and red clover production under irrigation. Proceedings of the New Zealand Grassland Association, 66, 257-264.
Kearney, J. K., Moot, D. J. and Pollock, K. M. 2010. On-farm comparison of pasture production in relation to rainfall in Central Otago. Proceedings of the New Zealand Grassland Association, 72, 121-126.
Mills, A., Lucas, R. J. and Moot, D. J. 2014. ‘MaxClover’ Grazing Experiment: I. Annual yields, botanical composition and growth rates of six dryland pastures over nine years. Grass and Forage Science, In Press (DOI 10.1111/gfs.12132).
Mills, A., Lucas, R. J. and Moot, D. J. 2014. ‘MaxClover’ Grazing Experiment. II. Sheep liveweight production from six grazed dryland pastures over eight years. New Zealand Journal of Agricultural Research, XX, XXX-XXX (In Press).
Moot, D. J. 2012. An overview of dryland legume research in New Zealand. Crop and Pasture Science, 63, 726–733.Moot, D. J., Brown, H. E., Pollock, K. and Mills, A. 2008. Yield and water use of temperate pastures in summer dry
environments. Proceedings of the New Zealand Grassland Association, 70, 51-57.Moot, D. J., Brown, H. E., Teixeira, E. I. and Pollock, K. M. 2003. Crop growth and development affect seasonal priorities for
lucerne management. In: D. J. Moot (ed). Legumes for Dryland Pastures Proceedings of a New Zealand Grassland Association Inc Symposium held at Lincoln University, 18-19 November, 2003. Christchurch: New Zealand Grassland Association, 201-208.
Moot, D. J. and Smith, M. 2011. Practical Lucerne Management Guide. 9 pp.