dtrace user guide - dartmouth computer...
TRANSCRIPT

DTraceUserGuide
SunMicrosystems, Inc.4150Network CircleSanta Clara, CA95054U.S.A.
Part No: 819–5488–10May 2006

Copyright 2006 SunMicrosystems, Inc. 4150Network Circle, Santa Clara, CA95054U.S.A. All rights reserved.
SunMicrosystems, Inc. has intellectual property rights relating to technology embodied in the product that is described in this document. In particular, and withoutlimitation, these intellectual property rights may include one ormore U.S. patents or pending patent applications in the U.S. and in other countries.
U.S. Government Rights – Commercial software. Government users are subject to the SunMicrosystems, Inc. standard license agreement and applicable provisionsof the FAR and its supplements.
This distributionmay includematerials developed by third parties.
Parts of the product may be derived fromBerkeley BSD systems, licensed from the University of California. UNIX is a registered trademark in the U.S. and othercountries, exclusively licensed through X/Open Company, Ltd.
Sun, SunMicrosystems, the Sun logo, the Solaris logo, the Java Coffee Cup logo, docs.sun.com, Java, and Solaris are trademarks or registered trademarks of SunMicrosystems, Inc. in the U.S. and other countries.All SPARC trademarks are used under license and are trademarks or registered trademarks of SPARCInternational, Inc. in the U.S. and other countries. Products bearing SPARC trademarks are based upon an architecture developed by SunMicrosystems, Inc.
TheOPEN LOOK and Sun™Graphical User Interface was developed by SunMicrosystems, Inc. for its users and licensees. Sun acknowledges the pioneering efforts ofXerox in researching and developing the concept of visual or graphical user interfaces for the computer industry. Sun holds a non-exclusive license fromXerox to theXerox Graphical User Interface, which license also covers Sun’s licensees who implement OPEN LOOKGUIs and otherwise comply with Sun’s written licenseagreements.
Products covered by and information contained in this publication are controlled by U.S. Export Control laws andmay be subject to the export or import laws inother countries. Nuclear, missile, chemical or biological weapons or nuclearmaritime end uses or end users, whether direct or indirect, are strictly prohibited. Exportor reexport to countries subject to U.S. embargo or to entities identified onU.S. export exclusion lists, including, but not limited to, the denied persons and speciallydesignated nationals lists is strictly prohibited.
DOCUMENTATION IS PROVIDED “AS IS”ANDALLEXPRESSOR IMPLIEDCONDITIONS, REPRESENTATIONSANDWARRANTIES, INCLUDINGANYIMPLIEDWARRANTYOFMERCHANTABILITY, FITNESS FORAPARTICULAR PURPOSEORNON-INFRINGEMENT,AREDISCLAIMED, EXCEPTTOTHE EXTENTTHAT SUCHDISCLAIMERSAREHELDTOBE LEGALLY INVALID.
Copyright 2006 SunMicrosystems, Inc. 4150Network Circle, Santa Clara, CA95054U.S.A. Tous droits réservés.
SunMicrosystems, Inc. détient les droits de propriété intellectuelle relatifs à la technologie incorporée dans le produit qui est décrit dans ce document. En particulier,et ce sans limitation, ces droits de propriété intellectuelle peuvent inclure un ou plusieurs brevets américains ou des applications de brevet en attente aux Etats-Unis etdans d’autres pays.
Cette distribution peut comprendre des composants développés par des tierces personnes.
Certaines composants de ce produit peuvent être dérivées du logiciel Berkeley BSD, licenciés par l’Université de Californie. UNIX est unemarque déposée auxEtats-Unis et dans d’autres pays; elle est licenciée exclusivement par X/Open Company, Ltd.
Sun, SunMicrosystems, le logo Sun, le logo Solaris, le logo Java Coffee Cup, docs.sun.com, Java et Solaris sont desmarques de fabrique ou desmarques déposées deSunMicrosystems, Inc. aux Etats-Unis et dans d’autres pays. Toutes les marques SPARC sont utilisées sous licence et sont desmarques de fabrique ou desmarquesdéposées de SPARC International, Inc. aux Etats-Unis et dans d’autres pays. Les produits portant les marques SPARC sont basés sur une architecture développée parSunMicrosystems, Inc.
L’interface d’utilisation graphique OPEN LOOK et Sun a été développée par SunMicrosystems, Inc. pour ses utilisateurs et licenciés. Sun reconnaît les efforts depionniers de Xerox pour la recherche et le développement du concept des interfaces d’utilisation visuelle ou graphique pour l’industrie de l’informatique. Sun détientune licence non exclusive de Xerox sur l’interface d’utilisation graphique Xerox, cette licence couvrant également les licenciés de Sun quimettent en place l’interfaced’utilisation graphique OPEN LOOK et qui, en outre, se conforment aux licences écrites de Sun.
Les produits qui font l’objet de cette publication et les informations qu’il contient sont régis par la legislation américaine enmatière de contrôle des exportations etpeuvent être soumis au droit d’autres pays dans le domaine des exportations et importations. Les utilisations finales, ou utilisateurs finaux, pour des armes nucléaires,desmissiles, des armes chimiques ou biologiques ou pour le nucléairemaritime, directement ou indirectement, sont strictement interdites. Les exportations ouréexportations vers des pays sous embargo des Etats-Unis, ou vers des entités figurant sur les listes d’exclusion d’exportation américaines, y compris, mais demanièrenon exclusive, la liste de personnes qui font objet d’un ordre de ne pas participer, d’une façon directe ou indirecte, aux exportations des produits ou des services quisont régis par la legislation américaine enmatière de contrôle des exportations et la liste de ressortissants spécifiquement designés, sont rigoureusement interdites.
LADOCUMENTATIONEST FOURNIE "EN L’ETAT" ET TOUTESAUTRES CONDITIONS, DECLARATIONS ETGARANTIES EXPRESSESOUTACITESSONT FORMELLEMENTEXCLUES, DANS LAMESUREAUTORISEE PAR LALOIAPPLICABLE, YCOMPRISNOTAMMENTTOUTEGARANTIEIMPLICITE RELATIVEALAQUALITEMARCHANDE,AL’APTITUDEAUNEUTILISATIONPARTICULIEREOUAL’ABSENCEDECONTREFACON.
060328@14558

Contents
Preface ............................................................................................................................................................. 5
1 Introduction .................................................................................................................................................... 9DTrace Capabilities ........................................................................................................................................ 9Architecture overview ..................................................................................................................................10
DTrace Providers ..................................................................................................................................10DTrace Probes .......................................................................................................................................10DTrace Predicates ................................................................................................................................. 11DTraceActions ...................................................................................................................................... 11D Scripting Language ........................................................................................................................... 11
2 DTrace Basics ................................................................................................................................................13Listing Probes ................................................................................................................................................13Specifying Probes in DTrace ........................................................................................................................15Enabling Probes ............................................................................................................................................16DTraceAction Basics ....................................................................................................................................18
Data RecordingActions .......................................................................................................................20DestructiveActions ..............................................................................................................................22
DTraceAggregations ....................................................................................................................................24DTraceAggregation Syntax .................................................................................................................24
3 ScriptingWith the D Language .................................................................................................................27Writing D Scripts ..........................................................................................................................................27
Executable D Scripts .............................................................................................................................27D Literal Strings ....................................................................................................................................28Creating D Scripts That UseArguments ............................................................................................29
DTrace Built-in Variables ............................................................................................................................32
3

4 Using DTrace .................................................................................................................................................37PerformanceMonitoring .............................................................................................................................37
Examining Performance ProblemsWith The sysinfo Provider ...................................................37Tracing User Processes .................................................................................................................................43
Using the copyin() and copyinstr() Subroutines .........................................................................43Eliminating dtrace Interference ........................................................................................................44syscall Provider ..................................................................................................................................45The ustack()Action ...........................................................................................................................46The pid Provider ...................................................................................................................................47
Anonymous Tracing .....................................................................................................................................51Anonymous Enablings .........................................................................................................................51ClaimingAnonymous State .................................................................................................................51Anonymous Tracing Examples ...........................................................................................................52
Speculative Tracing .......................................................................................................................................54Speculation Interfaces ..........................................................................................................................55Creating a Speculation .........................................................................................................................55Using a Speculation ..............................................................................................................................55Committing a Speculation ...................................................................................................................56Discarding a Speculation .....................................................................................................................56Speculation Example ............................................................................................................................57
Index ..............................................................................................................................................................63
Contents
DTrace User Guide • May 20064

Preface
TheDTrace User Guide is a lightweight introduction to the powerful tracing and analysis toolDTrace. In this book, you will find a description of DTrace and its capabilities, as well as directions onhow to use DTrace to perform relatively simple and common tasks.
WhoShouldUse This BookDTrace is a comprehensive dynamic tracing facility that is built into Solaris. You can use the DTracefacility can be used to examine the behavior of user programs or the behavior of the operatingsystem. DTrace can be used by system administrators or application developers on live productionsystems.
DTrace allows Solaris developers and administrators to:
� Implement custom scripts that use the DTrace facility� Implement layered tools that use DTrace to retrieve trace data
This book is not a comprehensive guide to DTrace or the D scripting language. Please refer to theSolaris Dynamic Tracing Guide for in-depth reference information.
BeforeYouReadThis BookBasic familiarity with a programming language such as C or a scripting language such as awk(1) orperl(1) will help you learn DTrace and the D programming language faster, but you need not be anexpert in any of these areas. If you have never written a program or script before in any language,“Related Books” on page 5 provides references to other documents youmight find useful.
RelatedBooksFor an in depth reference to DTrace, see the Solaris Dynamic Tracing Guide. These books and papersare recommended and related to the tasks that you need to performwith DTrace:
� Kernighan, BrianW. and Ritchie, DennisM. The C Programming Language. Prentice Hall, 1988.ISBN 0–13–110370–9
� Mauro, Jim andMcDougall, Richard. Solaris Internals: Core Kernel Components. SunMicrosystems Press, 2001. ISBN 0-13-022496-0
5

� Vahalia, Uresh.UNIX Internals: The New Frontiers. Prentice Hall, 1996. ISBN 0-13-101908-2
Documentation, Support, andTrainingThe Sunweb site provides information about the following additional resources:
� Documentation (http://www.sun.com/documentation/)� Support (http://www.sun.com/support/)� Training (http://www.sun.com/training/)
Typographic ConventionsThe following table describes the typographic conventions that are used in this book.
TABLE P–1TypographicConventions
Typeface Meaning Example
AaBbCc123 The names of commands, files, and directories,and onscreen computer output
Edit your .login file.
Use ls -a to list all files.
machine_name% you have mail.
AaBbCc123 What you type, contrasted with onscreencomputer output
machine_name% su
Password:
aabbcc123 Placeholder: replace with a real name or value The command to remove a file is rmfilename.
AaBbCc123 Book titles, new terms, and terms to beemphasized
Read Chapter 6 in theUser’s Guide.
A cache is a copy that is storedlocally.
Do not save the file.
Note: Some emphasized itemsappear bold online.
Shell Prompts in CommandExamplesThe following table shows the default UNIX® system prompt and superuser prompt for the C shell,Bourne shell, and Korn shell.
Documentation, Support, and Training
DTrace User Guide • May 20066

TABLE P–2Shell Prompts
Shell Prompt
C shell machine_name%
C shell for superuser machine_name#
Bourne shell and Korn shell $
Bourne shell and Korn shell for superuser #
Shell Prompts in Command Examples
7

8

Introduction
DTrace is a comprehensive dynamic tracing facility that is built into Solaris. DTrace can be used byadministrators and developers, and can safely be used on live production systems. DTrace enablesyou to examine the behavior of user programs as well as the behavior of the operating system. Usersof DTrace can create custom programs with the D scripting language. Custom programs provide theability to dynamically instrument the system. Custom programs provide immediate, concise answersto specific questions about the behavior of particular applications.
DTrace CapabilitiesTheDTrace framework provides instrumentation points that are called probes. ADTrace user can usea probe to record and display relevant information about a kernel or user process. EachDTrace probeis activated by a specific behavior. This probe activation is referred to as firing. As an example,consider a probe that fires on entry into an arbitrary kernel function. This example probe can displaythe following information:
� Any argument that is passed to the function� Any global variable in the kernel� Atimestamp that indicates when the function was called� Astack trace that indicates the section of code that called the function� The process that was running at the time the function was called� The thread that made the function call
When a probe fires, you can specify a particular action for DTrace to take.ADTrace action usuallyrecords an interesting aspect of system behavior, such as a timestamp or a function argument.
Probes are implemented by providers. Aprobe provider is a kernel module that enables a given probeto fire. For example, the function boundary tracing provider fbt provides entry and return probesfor almost every function in every kernel module.
DTrace has significant datamanagement capabilities. These capabilities enable DTrace users toprune the data reported by probes, avoiding the overhead involved in generating and then filteringunwanted data. DTrace also providesmechanisms for tracing during the boot process and for
1C H A P T E R 1
9

retrieving data from a kernel crash dump.All of the instrumentation in DTrace is dynamic. Probesare enabled discretely at the time that the probes are used, and inactive probes present noinstrumented code.
ADTrace consumer is any process that interacts with the DTrace framework.While dtrace(1M) isthe primary DTrace consumer, other consumers exist. These additional consumersmostly consist ofnew versions of existing utilities such as lockstat(1M). The DTrace framework has no limit on thenumber of concurrent consumers.
The behavior of DTrace can bemodified with the use of scripts that are written in the D language,which is structured similarly to C. The D language provides access to kernel C types and kernel staticand kernel global variables. The D language supportsANSI C operators.
Architecture overviewTheDTrace facility consists of the following components:
� User level consumer programs such as dtrace� Providers, packaged as kernel modules, that provide probes to gather tracing data� Alibrary interface that consumer programs use to access the DTrace facility through the
dtrace(7D) kernel driver
DTraceProvidersAprovider represents amethodology for instrumenting the system. Providers make probes availableto the DTrace framework. DTrace sends information to a provider regarding when to enable a probe.When an enabled probe fires, the provider transfers control to DTrace.
Providers are packaged as a set of kernel modules. Eachmodule performs a particular kind ofinstrumentation to create probes.When you use DTrace, each provider has the ability to publish theprobes it can provide to the DTrace framework. You can enable and bind tracing actions to any of thepublished probes.
Some providers have the capability to create new probes based on the user’s tracing requests.
DTraceProbesAprobe has the following attributes:
� It is made available by a provider� It identifies themodule and the function that it instruments� It has a name
These four attributes define a 4–tuple that serves as a unique identifier for each probe, in the formatprovider:module:function:name. Each probe also has a unique integer identifier.
Architecture overview
DTrace User Guide • May 200610

DTracePredicatesPredicates are expressions that are enclosed in slashes / /. Predicates are evaluated at probe firingtime to determine whether the associated actions should be executed. Predicates are the primaryconditional construct used for buildingmore complex control flow in a D program. You can omit thepredicate section of the probe clause entirely for any probe. If the predicate section is omitted, theactions are always executed when the probe fires.
Predicate expressions can use any of the previously describedD operators. Predicate expressionsrefer to D data objects such as variables and constants. The predicate expressionmust evaluate to avalue of integer or pointer type.As with all D expressions, a zero value is interpreted as false and anynon-zero value is interpreted as true.
DTraceActionsActions are user-programmable statements that the DTrace virtual machine executes within thekernel.Actions have the following properties:
� Actions are taken when a probe fires� Actions are completely programmable in the D scripting language� Most actions record a specified system state� An action can change the state of the system in a precisely described way. Such actions are called
destructive actions. Destructive actions are not allowed by default.� Many actions use expressions in the D scripting language
DScripting LanguageYou can invoke the DTrace framework directly from the command line with the dtrace commandfor simple functions. To use DTrace to performmore complex functions, write a script in the Dscripting language. Use the -s option to load a specified script for DTrace to use. See Chapter 3 forinformation about using the D scripting language.
Architecture overview
Chapter 1 • Introduction 11

12

DTrace Basics
This chapter provides a tour of the DTrace facility and provides examples of several basic tasks.
ListingProbesYou can list all DTrace probes by passing the -l option to the dtrace command:
# dtrace -lID PROVIDER MODULE FUNCTION NAME
1 dtrace BEGIN
2 dtrace END
3 dtrace ERROR
4 syscall nosys entry
5 syscall nosys return
6 syscall rexit entry
7 syscall rexit return
8 syscall forkall entry
9 syscall forkall return
10 syscall read entry
11 syscall read return
...
To count all the probes that are available on your system, you can type the following command:
# dtrace -l | wc -l
The number of probes reported will vary depending on your operating platform and the softwareyou have installed. Some probes do not list an entry under the MODULE or FUNCTION columns, such asthe BEGIN and END probes in the previous example. Probes with blank entries in these fields do notcorrespond to a specifically instrumented program function or location. These probes refer tomoreabstract concepts, such as the end of a tracing request.Aprobe that has amodule and function as partof its name is called an anchored probe. Aprobe that is not associated with amodule and function iscalled an unanchored probe.
You can use additional options to list specific probes, as seen in the following examples.
2C H A P T E R 2
13

EXAMPLE 2–1 Listing Probes by Specific Function
You can list probes that are associated with a specific function by passing that function name toDTrace with the -f option.
# dtrace -l -f cv_waitID PROVIDER MODULE FUNCTION NAME
12921 fbt genunix cv_wait entry
12922 fbt genunix cv_wait return
EXAMPLE 2–2 Listing Probes by SpecificModule
You can list probes that are associated with a specificmodule by passing that module name to DTracewith the -m option.
# dtrace -l -m sdID PROVIDER MODULE FUNCTION NAME
17147 fbt sd sdopen entry
17148 fbt sd sdopen return
17149 fbt sd sdclose entry
17150 fbt sd sdclose return
17151 fbt sd sdstrategy entry
17152 fbt sd sdstrategy return
...
EXAMPLE 2–3 Listing Probes by SpecificName
You can list probes that have a specific name by passing that name to DTrace with the -n option.
# dtrace -l -n BEGINID PROVIDER MODULE FUNCTION NAME
1 dtrace BEGIN
EXAMPLE 2–4 Listing Probes by Provider ofOrigin
You can list probes that are originate from a specific provider by passing the provider name to DTracewith the -P option.
# dtrace -l -P lockstatID PROVIDER MODULE FUNCTION NAME
469 lockstat genunix mutex_enter adaptive-acquire
470 lockstat genunix mutex_enter adaptive-block
471 lockstat genunix mutex_enter adaptive-spin
472 lockstat genunix mutex_exit adaptive-release
473 lockstat genunix mutex_destroy adaptive-release
474 lockstat genunix mutex_tryenter adaptive-acquire
...
Listing Probes
DTrace User Guide • May 200614

EXAMPLE 2–5Multiple Providers Supporting a Specific Function orModule
Aspecific function or specificmodule can be supported bymultiple providers, as the followingexample shows.
# dtrace -l -f readID PROVIDER MODULE FUNCTION NAME
10 syscall read entry
11 syscall read return
4036 sysinfo genunix read readch
4040 sysinfo genunix read sysread
7885 fbt genunix read entry
7886 fbt genunix read return
As the previous examples show, the output for a listing of probes displays the following information:
� The probe’s uniquely assigned integer probe ID
Note –The probe ID is only unique within a given release or patch level of the Solaris operatingsystem.
� The provider name� Themodule name, if applicable� The function name, if applicable� The probe name
SpecifyingProbes inDTraceYou can fully specify a probe by listing each component of the 4–tuple that uniquely identifies thatprobe. The format for the probe specification is provider:module:function:name. An emptycomponent in a probe specificationmatches anything. For example, the specificationfbt::alloc:entry specifies a probe with the following attributes:
� The probemust be from the fbt provider� The probemay be in anymodule� The probemust be in the alloc function� The probemust be named entry
Elements on the left hand side of the 4–tuple are optional. The probe specification ::open:entry isequivalent to the specification open:entry. Either specification will match probes from all providersand kernel modules that have a function name of open and are named entry.
# dtrace -l -n open:entryID PROVIDER MODULE FUNCTION NAME
14 syscall open entry
7386 fbt genunix open entry
Specifying Probes in DTrace
Chapter 2 • DTrace Basics 15

You can also describe probes with a patternmatching syntax that is similar to the syntax that isdescribed in the File Name Generation section of the sh(1)man page. The syntax supports thespecial characters *, ?, [, and ]. The probe description syscall::open*:entrymatches both theopen and open64 system calls. The ? character represents any single character in the name. The [ and] characters are used to specify a set of specific characters in the name.
EnablingProbesYou enable probes with the dtrace command by specifying the probes without the -l option.Without further directions, DTrace performs the default action when the specified probe fires. Thedefault probe action indicates only that the specified probe has fired and does not record any otherdata. The following code example enables every probe in the sdmodule.
EXAMPLE 2–6Enabling Probes byModule
# dtrace -m sdCPU ID FUNCTION:NAME
0 17329 sd_media_watch_cb:entry
0 17330 sd_media_watch_cb:return
0 17167 sdinfo:entry
0 17168 sdinfo:return
0 17151 sdstrategy:entry
0 17152 sdstrategy:return
0 17661 ddi_xbuf_qstrategy:entry
0 17662 ddi_xbuf_qstrategy:return
0 17649 xbuf_iostart:entry
0 17341 sd_xbuf_strategy:entry
0 17385 sd_xbuf_init:entry
0 17386 sd_xbuf_init:return
0 17342 sd_xbuf_strategy:return
0 17177 sd_mapblockaddr_iostart:entry
0 17178 sd_mapblockaddr_iostart:return
0 17179 sd_pm_iostart:entry
0 17365 sd_pm_entry:entry
0 17366 sd_pm_entry:return
0 17180 sd_pm_iostart:return
0 17181 sd_core_iostart:entry
0 17407 sd_add_buf_to_waitq:entry
...
The output in this example shows that the default action displays the CPUwhere the probe fired, theinteger probe ID that is assigned byDTrace, the function where the probe fired, and the probe name.
EXAMPLE 2–7Enabling Probes by Provider
# dtrace -P syscalldtrace: description ’syscall’ matched 452 probes
CPU ID FUNCTION:NAME
Enabling Probes
DTrace User Guide • May 200616

EXAMPLE 2–7Enabling Probes by Provider (Continued)
0 99 ioctl:return
0 98 ioctl:entry
0 99 ioctl:return
0 98 ioctl:entry
0 99 ioctl:return
0 234 sysconfig:entry
0 235 sysconfig:return
0 234 sysconfig:entry
0 235 sysconfig:return
0 168 sigaction:entry
0 169 sigaction:return
0 168 sigaction:entry
0 169 sigaction:return
0 98 ioctl:entry
0 99 ioctl:return
0 234 sysconfig:entry
0 235 sysconfig:return
0 38 brk:entry
0 39 brk:return
...
EXAMPLE 2–8Enabling Probes byName
# dtrace -n zfoddtrace: description ’zfod’ matched 3 probes
CPU ID FUNCTION:NAME
0 4080 anon_zero:zfod
0 4080 anon_zero:zfod
^C
EXAMPLE 2–9Enabling Probes by Fully SpecifiedName
# dtrace -n clock:entrydtrace: description ’clock:entry’ matched 1 probe
CPU ID FUNCTION:NAME
0 4198 clock:entry
^C
Enabling Probes
Chapter 2 • DTrace Basics 17

DTraceActionBasicsActions enable DTrace to interact with the system outside of the DTrace framework. Themostcommon actions record data to a DTrace buffer. Other actions can stop the current process, raise aspecific signal on the current process, or cease tracing.Actions that change the system state areconsidered destructive actions. Data recording actions record data to the principal buffer by default.The principal buffer is present in every DTrace invocation and is always allocated on a per-CPUbasis. Tracing and buffer allocation can be restricted to a single CPU by using the -cpu option. SeeChapter 11, “Buffers and Buffering,” in Solaris Dynamic Tracing Guide for more information aboutDTrace buffering.
The examples in this section use D expressions that consist of built-in D variables. Some of themostcommonly usedD variables are listed below:
pid This variable contains the current process ID.
execname This variable contains the current executable name.
timestamp This variable contains the time since boot, expressed in nanoseconds.
curthread This variable contains a pointer to the kthread_t structure that represents thecurrent thread.
probemod This variable contains themodule name of the current probe.
probefunc This variable contains the function name of the current probe.
probename This variable contains the name of the current probe.
For a complete list of the built-in variables of the D scripting language, see Variables.
The D scripting language also provides built-in functions that perform specific actions. You can finda complete list of these built-in functions at Chapter 10, “Actions and Subroutines,” in SolarisDynamic Tracing Guide. The trace() function records the result of a D expression to the trace buffer,as in the following examples:
� trace(pid) traces the current process ID� trace(execname) traces the name of the current executable� trace(curthread->t_pri) traces the t_pri field of the current thread� trace(probefunc) traces the function name of the probe
To indicate a particular action you want a probe to take, type the name of the action between {}
characters, as in the following example.
EXAMPLE 2–10 Specifying a Probe’sAction
# dtrace -n ’readch {trace(pid)}’dtrace: description ’readch ’ matched 4 probes
CPU ID FUNCTION:NAME
0 4036 read:readch 2040
0 4036 read:readch 2177
DTrace Action Basics
DTrace User Guide • May 200618

EXAMPLE 2–10 Specifying a Probe’sAction (Continued)
0 4036 read:readch 2177
0 4036 read:readch 2040
0 4036 read:readch 2181
0 4036 read:readch 2181
0 4036 read:readch 7
...
Since the requested action is trace(pid), the process identification number (PID) appears in the lastcolumn of the output.
EXAMPLE 2–11Tracing anExecutableName
# dtrace -m ’ufs {trace(execname)}’dtrace: description ’ufs ’ matched 889 probes
CPU ID FUNCTION:NAME
0 14977 ufs_lookup:entry ls
0 15748 ufs_iaccess:entry ls
0 15749 ufs_iaccess:return ls
0 14978 ufs_lookup:return ls
...
0 15007 ufs_seek:entry utmpd
0 15008 ufs_seek:return utmpd
0 14963 ufs_close:entry utmpd
^C
EXAMPLE 2–12TracingASystemCall’s Time of Entry
# dtrace -n ’syscall:::entry {trace(timestamp)}’dtrace: description ’syscall:::entry ’ matched 226 probes
CPU ID FUNCTION:NAME
0 312 portfs:entry 157088479572713
0 98 ioctl:entry 157088479637542
0 98 ioctl:entry 157088479674339
0 234 sysconfig:entry 157088479767243
...
0 98 ioctl:entry 157088481033225
0 60 fstat:entry 157088481050686
0 60 fstat:entry 157088481074680
^C
EXAMPLE 2–13 SpecifyingMultipleActions
To specifymultiple actions, list the actions separated by the ; character.
DTrace Action Basics
Chapter 2 • DTrace Basics 19

EXAMPLE 2–13 SpecifyingMultipleActions (Continued)
# dtrace -n ’zfod {trace(pid);trace(execname)}’dtrace: description ’zfod ’ matched 3 probes
CPU ID FUNCTION:NAME
0 4080 anon_zero:zfod 2195 dtrace
0 4080 anon_zero:zfod 2195 dtrace
0 4080 anon_zero:zfod 2195 dtrace
0 4080 anon_zero:zfod 2195 dtrace
0 4080 anon_zero:zfod 2195 dtrace
0 4080 anon_zero:zfod 2197 bash
0 4080 anon_zero:zfod 2207 vi
0 4080 anon_zero:zfod 2207 vi
...
DataRecordingActionsThe actions in this section record data to the principal buffer by default, but each actionmay also beused to record data to speculative buffers. See “Speculative Tracing” on page 54 formore details onspeculative buffers.
The trace() functionvoid trace(expression)
Themost basic action is the trace() action, which takes a D expression as its argument and tracesthe result to the directed buffer.
The tracemem() functionvoid tracemem(address, size_t nbytes)
The tracemem() action copies data from an address inmemory to a buffer . The number of bytes thatthis action copies is specified in nbytes. The address that the data is copied from is specified in addr asa D expression. The buffer that the data is copied to is specified in buf.
The printf() functionvoid printf(string format, ...)
Like the trace() action, the printf() action traces D expressions. However, the printf() actionlets you control formatting in ways similar to the printf(3C) function. Like the printf function, theparameters consists of a format string followed by a variable number of arguments. By default, thearguments are traced to the directed buffer. The arguments are later formatted for output by thedtrace command according to the specified format string.
DTrace Action Basics
DTrace User Guide • May 200620

Formore information on the printf() action, see Chapter 12, “Output Formatting,” in SolarisDynamic Tracing Guide.
The printa() functionvoid printa(aggregation)void printa(string format, aggregation)
The printa() action enables you to display and format aggregations. See Chapter 9, “Aggregations,”in Solaris Dynamic Tracing Guide for more detail on aggregations. If a format value is not provided,the printa() action only traces a directive to the DTrace consumer. The consumer that receives thatdirective processes and displays the aggregation with the default format. See Chapter 12, “OutputFormatting,” in Solaris Dynamic Tracing Guide for amore detailed description of the printa()format string.
The stack() functionvoid stack(int nframes)void stack(void)
The stack() action records a kernel stack trace to the directed buffer. The depth of the kernel stack isgiven by the value given in nframes. If no value is given for nframes, the stack action records anumber of stack frames specified by the stackframes option.
The ustack() functionvoid ustack(int nframes, int strsize)void ustack(int nframes)void ustack(void)
The ustack() action records a user stack trace to the directed buffer. The depth of the user stack isequal to the value specified in nframes. If there is no value for nframes, the ustack action records anumber of stack frames that is specified by the ustackframes option. The ustack() actiondetermines the address of the calling frames when the probe fires. The ustack() action does nottranslate the stack frames into symbols until the DTrace consumer processes the ustack() action atthe user level. If a value for strsize is specified and not zero, the ustack() action allocates the specifiedamount of string space and uses it to perform address-to-symbol translation directly from the kernel.
The jstack() functionvoid jstack(int nframes, int strsize)void jstack(int nframes)void jstack(void)
DTrace Action Basics
Chapter 2 • DTrace Basics 21

The jstack() action is an alias for ustack() that uses the value specified by the jstackframesoption for the number of stack frames. The jstack action uses the value specified by thejstackstrsize option to determine the string space size. The jstacksize action defaults to anon-zero value.
DestructiveActionsYoumust explicitly enable destructive actions in order to use them. You can enable destructiveactions by using the -w option. If you attempt to use destructive actions in dtracewithout explicitlyenabling them, dtrace fails with amessage similar to the following example:
dtrace: failed to enable ’syscall’: destructive actions not allowed
Formore information onDTrace actions, including destructive actions, see Chapter 10, “Actionsand Subroutines,” in Solaris Dynamic Tracing Guide.
ProcessDestructiveActionsSome actions are destructive only to a particular process. These actions are available to users with thedtrace_proc or dtrace_user privileges. See Chapter 35, “Security,” in Solaris Dynamic TracingGuide for details onDTrace security privileges.
The stop() function
When a probe fires with the stop() action enabled, the process that fired that probe stops uponleaving the kernel. This process stops in the same way as a process that is stopped by a proc(4) action.
The raise() functionvoid raise(int signal)
The raise() action sends the specified signal to the currently running process.
The copyout() functionvoid copyout(void *buf, uintptr_t addr, size_t nbytes)
The copyout() action copies data from a buffer to an address inmemory. The number of bytes thatthis action copies is specified in nbytes. The buffer that the data is copied from is specified in buf. Theaddress that the data is copied to is specified in addr. That address is in the address space of theprocess that is associated with the current thread.
The copyoutstr() functionvoid copyoutstr(string str, uintptr_t addr, size_t maxlen)
DTrace Action Basics
DTrace User Guide • May 200622

The copyoutstr() action copies a string to an address inmemory. The string to copy is specified instr. The address that the string is copied to is specified in addr. That address is in the address space ofthe process that is associated with the current thread.
The system() functionvoid system(string program, ...)
The system() action causes the program specified by program to be executed by the system as if itwere given to the shell as input.
KernelDestructiveActionsSome destructive actions are destructive to the entire system. Use these actions with caution. Theseactions affect every process on the system andmay affect other systems, depending upon the affectedsystem’s network services.
The breakpoint() functionvoid breakpoint(void)
The breakpoint() action induces a kernel breakpoint, causing the system to stop and transfercontrol to the kernel debugger. The kernel debugger will emit a string that denotes the DTrace probethat triggered the action.
The panic() functionvoid panic(void)
When a probe with the panic() action triggers, the kernel panics. This action can force a systemcrash dump at a time of interest. You can use this action in conjunction with ring buffering andpostmortem analysis to diagnose a system problem. Formore information, see Chapter 11, “Buffersand Buffering,” in Solaris Dynamic Tracing Guide and Chapter 37, “PostmortemTracing,” in SolarisDynamic Tracing Guide respectively.
The chill() functionvoid chill(int nanoseconds)
When a probe with the chill() action triggers, DTrace spins for the specified number ofnanoseconds. The chill() action is useful for exploring problems related to timing. Becauseinterrupts are disabled while in DTrace probe context, any use of chill()will induce interruptlatency, scheduling latency, dispatch latency.
DTrace Action Basics
Chapter 2 • DTrace Basics 23

DTraceAggregationsFor performance-related questions, aggregated data is oftenmore useful than individual data points.DTrace provides several built-in aggregating functions.When an aggregating function is applied tosubsets of a collection of data, then applied again to the results of the analysis of those subsets, theresults are identical to the results returned by the aggregating function when it is applied to thecollection as a whole.
The DTrace facility stores a running count of data items for aggregations. The aggregating functionsstore only the current intermediate result and the new element that the function is being applied to.The intermediate results are allocated on a per-CPU basis. Because this allocation scheme does notrequire locks, the implementation is inherently scalable.
DTraceAggregation SyntaxADTrace aggregation takes the following general form:
@name[ keys ] = aggfunc( args );
In this general form, the variables are defined as follows:
name The name of the aggregation, preceded by the @ character.
keys Acomma-separated list of D expressions.
aggfunc One of the DTrace aggregating functions.
args Acomma-separated list of arguments appropriate to the aggregating function.
TABLE 2–1DTraceAggregating Functions
FunctionName Arguments Result
count none The number of times that the count function is called.
sum scalar expression The total value of the specified expressions.
avg scalar expression The arithmetic average of the specified expressions.
min scalar expression The smallest value among the specified expressions.
max scalar expression The largest value among the specified expressions.
lquantize scalar expression,lower bound, upperbound, step value
A linear frequency distribution of the values of the specifiedexpressions that is sized by the specified range. This aggregatingfunction increments the value in the highest bucket that is lessthan the specified expression.
DTrace Aggregations
DTrace User Guide • May 200624

TABLE 2–1DTraceAggregating Functions (Continued)FunctionName Arguments Result
quantize scalar expression Apower-of-two frequency distribution of the values of thespecified expressions. This aggregating function increments thevalue in the highest power-of-two bucket that is less than thespecified expression.
EXAMPLE 2–14Using anAggregating Function
This example uses the count aggregating function to count the number of write(2) system calls perprocess. The aggregation does not output any data until the dtrace command is terminated. Theoutput data represents a summary of the data collected during the time that the dtrace commandwas active.
# cat writes.d
#!/usr/sbin/dtrace -s
syscall::write:entry]
{ @numWrites[execname] = count();
}
# ./writes.d
dtrace: script ’writes.d’ matched 1 probe
^C
dtrace 1
date 1
bash 3
grep 20
file 197
ls 201
DTrace Aggregations
Chapter 2 • DTrace Basics 25

26

Scripting With the D Language
This chapter discusses the basic information that you need to start writing your ownD languagescripts.
WritingDScriptsComplex sets of DTrace probes can become difficult tomanage on the command line. The dtracecommand supports scripts. You can specify a script by passing the -s option, along with the script’sfile name, to the dtrace command. You can also create executable DTrace interpreter files.ADTraceinterpreter file always begins with the line #!/usr/sbin/dtrace -s.
ExecutableDScriptsThis example script, named syscall.d, traces the executable name every time the executable enterseach system call:
syscall:::entry
{
trace(execname);
}
Note that the filename ends with a .d suffix. This is the conventional ending for D scripts. You canrun this script off the DTrace command line with the following command:
# dtrace -s syscall.ddtrace: description ’syscall ’ matched 226 probes
CPU ID FUNCTION:NAME
0 312 pollsys:entry java
0 98 ioctl:entry dtrace
0 98 ioctl:entry dtrace
0 234 sysconfig:entry dtrace
0 234 sysconfig:entry dtrace
3C H A P T E R 3
27

0 168 sigaction:entry dtrace
0 168 sigaction:entry dtrace
0 98 ioctl:entry dtrace
^C
You can run the script by entering the filename at the command line by following two steps. First,verify that the first line of the file invokes the interpreter. The interpreter invocation line is#!/usr/sbin/dtrace -s. Then set the execute permission for the file.
EXAMPLE 3–1Running aD Script from theCommand Line
# cat syscall.d#!/usr/sbin/dtrace -s
syscall:::entry
{
trace(execname);
}
# chmod +x syscall.d# ls -l syscall.d-rwxr-xr-x 1 root other 62 May 12 11:30 syscall.d
# ./syscall.ddtrace: script ’./syscall.d’ matched 226 probes
CPU ID FUNCTION:NAME
0 98 ioctl:entry dtrace
0 98 ioctl:entry dtrace
0 312 pollsys:entry java
0 312 pollsys:entry java
0 312 pollsys:entry java
0 98 ioctl:entry dtrace
0 98 ioctl:entry dtrace
0 234 sysconfig:entry dtrace
0 234 sysconfig:entry dtrace
^C
DLiteral StringsTheD language supports literal strings. DTrace represents strings as an array of charactersterminated by a null byte. The visible part of the string varies in length depending on the location ofthe null byte. DTrace stores each string in a fixed-size array to ensure that each probe traces aconsistent amount of data. Strings cannot exceed the length of the predefined string limit. The limitcan bemodified in your D program or on the dtrace command line by tuning the strsize option.Refer to Chapter 16, “Options and Tunables,” in Solaris Dynamic Tracing Guide for moreinformation on tunable DTrace options. The default string limit is 256 bytes.
Writing D Scripts
DTrace User Guide • May 200628

The D language provides an explicit string type rather than using the type char * to refer to strings.See Chapter 6, “Strings,” in Solaris Dynamic Tracing Guide for more information about D literalstrings.
EXAMPLE 3–2UsingDLiteral StringsWith The trace() Function
# cat string.d
#!/usr/sbin/dtrace -s
fbt::bdev_strategy:entry
{
trace(execname);
trace(" is initiating a disk I/O\n");
}
The \n symbol at the end of the literal string produces a new line. To run this script, enter thefollowing command:
# dtrace -s string.ddtrace: script ’string.d’ matched 1 probes
CPU ID FUNCTION:NAME
0 9215 bdev_strategy:entry bash is initiating a disk I/O
0 9215 bdev_strategy:entry vi is initiating a disk I/O
0 9215 bdev_strategy:entry vi is initiating a disk I/O
0 9215 bdev_strategy:entry sched is initiating a disk I/O
^C
The -q option of the dtrace command only records the actions that are explicitly stated in the scriptor command line invocation. This option suppresses the default output that the dtrace commandnormally produces.
# dtrace -q -s string.dls is initiating a disk I/O
cat is initiating a disk I/O
fsflush is initiating a disk I/O
vi is initiating a disk I/O
^C
CreatingDScripts ThatUseArgumentsYou can use the dtrace command to create executable interpreter files. The filemust have executepermission. The initial line of the file must be #!/usr/sbin/dtrace -s. You can specify otheroptions to the dtrace command on this line. Youmust specify the options with only one dash (-).List the s option last, as in the following example.
Writing D Scripts
Chapter 3 • Scripting With the D Language 29
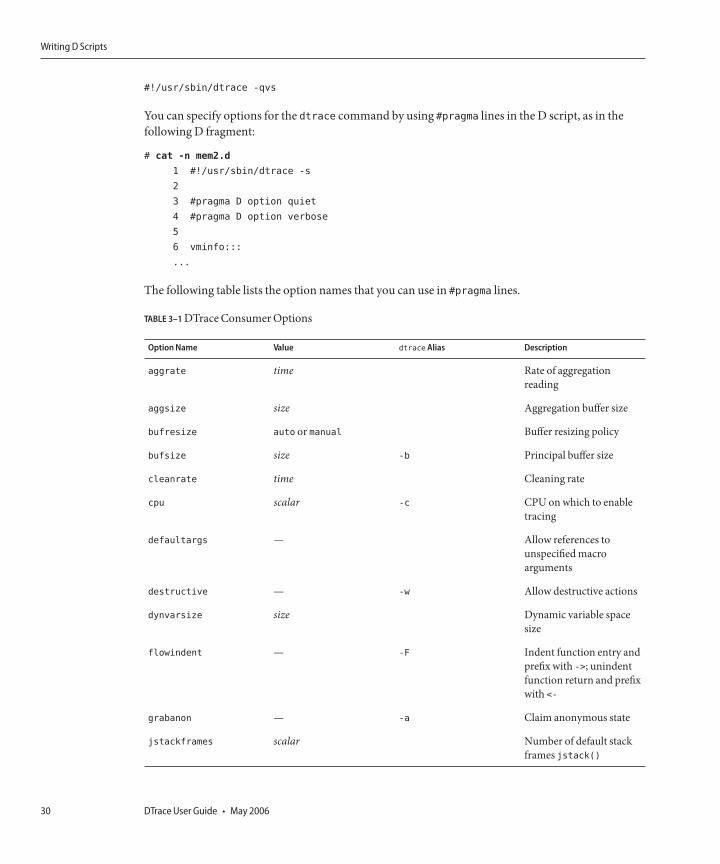
#!/usr/sbin/dtrace -qvs
You can specify options for the dtrace command by using #pragma lines in the D script, as in thefollowing D fragment:
# cat -n mem2.d
1 #!/usr/sbin/dtrace -s
2
3 #pragma D option quiet
4 #pragma D option verbose
5
6 vminfo:::
...
The following table lists the option names that you can use in #pragma lines.
TABLE 3–1DTraceConsumerOptions
OptionName Value dtraceAlias Description
aggrate time Rate of aggregationreading
aggsize size Aggregation buffer size
bufresize auto or manual Buffer resizing policy
bufsize size -b Principal buffer size
cleanrate time Cleaning rate
cpu scalar -c CPU onwhich to enabletracing
defaultargs — Allow references tounspecifiedmacroarguments
destructive — -w Allow destructive actions
dynvarsize size Dynamic variable spacesize
flowindent — -F Indent function entry andprefix with ->; unindentfunction return and prefixwith <-
grabanon — -a Claim anonymous state
jstackframes scalar Number of default stackframes jstack()
Writing D Scripts
DTrace User Guide • May 200630

TABLE 3–1DTraceConsumerOptions (Continued)OptionName Value dtraceAlias Description
jstackstrsize scalar Default string space sizefor jstack()
nspec scalar Number of speculations
quiet — -q Output only explicitlytraced data
specsize size Speculation buffer size
strsize size String size
stackframes scalar Number of stack frames
stackindent scalar Number of whitespacecharacters to use whenindenting stack() andustack() output
statusrate time Rate of status checking
switchrate time Rate of buffer switching
ustackframes scalar Number of user stackframes
AD script can refer to a set of built inmacro variables. Thesemacro variables are defined by the Dcompiler.
$[0-9]+ Macro arguments
$egid Effective group-ID
$euid Effective user-ID
$gid Real group-ID
$pid Process ID
$pgid Process group ID
$ppid Parent process ID
$projid Project ID
$sid Session ID
$target Target process ID
$taskid Task ID
$uid Real user-ID
Writing D Scripts
Chapter 3 • Scripting With the D Language 31

EXAMPLE 3–3PIDArgument Example
This example passes the PID of a running vi process to the syscalls2.dD script. The D scriptterminates when the vi command exits.
# cat -n syscalls2.d
1 #!/usr/sbin/dtrace -qs
2
3 syscall:::entry
4 /pid == $1/
5 {
6 @[probefunc] = count();
7 }
8 syscall::rexit:entry
9 {
10 exit(0);
11 }
# pgrep vi
2208
# ./syscalls2.d 2208
rexit 1
setpgrp 1
creat 1
getpid 1
open 1
lstat64 1
stat64 1
fdsync 1
unlink 1
close 1
alarm 1
lseek 1
sigaction 1
ioctl 1
read 1
write 1
DTraceBuilt-in VariablesThe following list includes all of the built-in variables for the DTrace framework.
DTrace Built-in Variables
DTrace User Guide • May 200632

int64_t arg0, ..., arg9 The first ten input arguments to a probe represented as raw 64-bitintegers. If fewer than ten arguments are passed to the current probe,the remaining variables return zero.
args[] The typed arguments to the current probe, if any. The args[] arrayis accessed using an integer index, but each element is defined to bethe type corresponding to the given probe argument. For example, ifthe args[] array is referenced by a read(2) system call probe,args[0] is of type int, args[1] is of type void *, and args[2] is oftype size_t.
uintptr_t caller The program counter location of the current thread just beforeentering the current probe.
chipid_t chip The CPU chip identifier for the current physical chip. See Chapter26, “sched Provider,” in Solaris Dynamic Tracing Guide for moreinformation.
processorid_t cpu The CPU identifier for the current CPU. See Chapter 26, “schedProvider,” in Solaris Dynamic Tracing Guide for more information.
cpuinfo_t *curcpu The CPU information for the current CPU. See Chapter 26, “schedProvider,” in Solaris Dynamic Tracing Guide for more information.
lwpsinfo_t *curlwpsinfo The lightweight process (LWP) state of the LWP associated with thecurrent thread. This structure is described in further detail in theproc(4) man page.
psinfo_t *curpsinfo The process state of the process associated with the current thread.This structure is described in further detail in the This structure isdescribed in further detail in the proc(4) man page.
kthread_t *curthread The address of the operating system kernel’s internal data structurefor the current thread, the kthread_t. The kthread_t is defined in<sys/thread.h>. Refer to Solaris Internals for more information onthis variable and other operating system data structures.
string cwd The name of the current working directory of the process associatedwith the current thread.
uint_t epid The enabled probe ID (EPID) for the current probe. This integeruniquely identifiers a particular probe that is enabled with a specificpredicate and set of actions.
int errno The error value returned by the last system call executed by thisthread.
string execname The name that was passed to exec(2) to execute the current process.
gid_t gid The real group ID of the current process.
DTrace Built-in Variables
Chapter 3 • Scripting With the D Language 33

uint_t id The probe ID for the current probe. This ID is the system-wideunique identifier for the probe as published byDTrace and listed inthe output of dtrace -l.
uint_t ipl The interrupt priority level (IPL) on the current CPU at the time thatthe probe fires. Refer to Solaris Internals for more information oninterrupt levels and interrupt handling in the Solaris operatingsystem kernel.
lgrp_id_t lgrp The locality group ID for the latency group of which the currentCPU is amember. See Chapter 26, “sched Provider,” in SolarisDynamic Tracing Guide for more information on CPUmanagementin DTrace. See Chapter 4, “Locality GroupAPIs,” in ProgrammingInterfaces Guide for more information about locality groups.
pid_t pid The process ID of the current process.
pid_t ppid The parent process ID of the current process.
string probefunc The function name portion of the current probe’s description.
string probemod Themodule name portion of the current probe’s description.
string probename The name portion of the current probe’s description.
string probeprov The provider name portion of the current probe’s description.
psetid_t pset The processor set ID for the processor set that contains the currentCPU. See Chapter 26, “sched Provider,” in Solaris Dynamic TracingGuide for more information.
string root The name of the root directory of the process associated with thecurrent thread.
uint_t stackdepth The current thread’s stack frame depth at probe firing time.
id_t tid The thread ID of the current thread. For threads that are associatedwith user processes, this value is equal to the result of a call topthread_self(3C).
uint64_t timestamp The current value of a nanosecond timestamp counter. This counterincrements from an arbitrary point in the past and should only beused for relative computations.
uid_t uid The real user ID of the current process.
uint64_t uregs[] The current thread’s saved user-mode register values at probe firingtime. Use of the uregs[] array is discussed in Chapter 33, “UserProcess Tracing,” in Solaris Dynamic Tracing Guide.
uint64_t vtimestamp The current value of a nanosecond timestamp counter. The counteris virtualized to the amount of time that the current thread has beenrunning on a CPU. The counter does not include the time that is
DTrace Built-in Variables
DTrace User Guide • May 200634

spent in DTrace predicates and actions. This counter incrementsfrom an arbitrary point in the past and should only be used forrelative time computations.
uint64_t walltimestamp The current number of nanoseconds since 00:00 UniversalCoordinated Time, January 1, 1970.
DTrace Built-in Variables
Chapter 3 • Scripting With the D Language 35

36

Using DTrace
This chapter examines the use of DTrace for common basic tasks, and has information on severaldifferent types of tracing.
PerformanceMonitoringSeveral DTrace providers implement probes that correspond to existing performancemonitoringtools:
� The vminfo provider implements probes that correspond to the vmstat(1M) tool� The sysinfo provider implements probes that correspond to the mpstat(1M) tool� The io provider implements probes that correspond to the iostat(1M) tool� The syscall provider implements probes that correspond to the truss(1) tool
You can use the DTrace facility to extract the same information that the bundled tools provide, butwith greater flexibility. The DTrace facility provides arbitrary kernel information that is available atthe time that the probes fire. The DTrace facility enables you to receive information such as processidentification, thread identification, and stack traces.
ExaminingPerformanceProblemsWith The sysinfoProviderThe sysinfo providermakes available probes that correspond to the sys kernel statistics. Thesestatistics provide the input for systemmonitoring utilities such as mpstat. The sysinfo providerprobes fire immediately before the sys named kstat increments. The probes that are provided by thesysinfo provider are in the following list.
bawrite Probe that fires whenever a buffer is about to be asynchronously written outto a device.
4C H A P T E R 4
37

bread Probe that fires whenever a buffer is physically read from a device. breadfires after the buffer has been requested from the device, but before blockingpending its completion.
bwrite Probe that fires whenever a buffer is about to be written out to a device,whether synchronously or asynchronously.
cpu_ticks_idle Probe that fires when the periodic system clock hasmade the determinationthat a CPU is idle. Note that this probe fires in the context of the system clockand therefore fires on the CPU running the system clock. The cpu_targument (arg2) indicates the CPU that has been deemed idle.
cpu_ticks_kernel Probe that fires when the periodic system clock hasmade the determinationthat a CPU is executing in the kernel. This probe fires in the context of thesystem clock and therefore fires on the CPU running the system clock. Thecpu_t argument (arg2) indicates the CPU that has been deemed to beexecuting in the kernel.
cpu_ticks_user Probe that fires when the periodic system clock hasmade the determinationthat a CPU is executing in user mode. This probe fires in the context of thesystem clock and therefore fires on the CPU running the system clock. Thecpu_t argument (arg2) indicates the CPU that has been deemed to berunning in user-mode.
cpu_ticks_wait Probe that fires when the periodic system clock hasmade the determinationthat a CPU is otherwise idle, but some threads are waiting for I/O on theCPU. This probe fires in the context of the system clock and therefore fireson the CPU running the system clock. The cpu_t argument (arg2) indicatesthe CPU that has been deemedwaiting on I/O.
idlethread Probe that fires whenever a CPU enters the idle loop.
intrblk Probe that fires whenever an interrupt thread blocks.
inv_swtch Probe that fires whenever a running thread is forced to involuntarily give upthe CPU.
lread Probe that fires whenever a buffer is logically read from a device.
lwrite Probe that fires whenever a buffer is logically written to a device
modload Probe that fires whenever a kernel module is loaded.
modunload Probe that fires whenever a kernel module is unloaded.
msg Probe that fires whenever a msgsnd(2) or msgrcv(2) system call is made, butbefore themessage queue operations have been performed.
mutex_adenters Probe that fires whenever an attempt is made to acquire an owned adaptivelock. If this probe fires, one of the lockstat provider’s adaptive-block oradaptive-spin probes also fires.
namei Probe that fires whenever a name lookup is attempted in the filesystem.
Performance Monitoring
DTrace User Guide • May 200638

nthreads Probe that fires whenever a thread is created.
phread Probe that fires whenever a raw I/O read is about to be performed.
phwrite Probe that fires whenever a raw I/Owrite is about to be performed.
procovf Probe that fires whenever a new process cannot be created because thesystem is out of process table entries.
pswitch Probe that fires whenever a CPU switches from executing one thread toexecuting another.
readch Probe that fires after each successful read, but before control is returned tothe thread that is performing the read.Aread can occur through the read(2),readv(2) or pread(2) system calls. arg0 contains the number of bytes thatwere successfully read.
rw_rdfails Probe that fires whenever an attempt is made to read-lock a reader or writerwhen the lock is held by a writer or desired by a writer. If this probe fires, thelockstat provider’s rw-block probe also fires.
rw_wrfails Probe that fires whenever an attempt is made to write-lock a reader or writerlock when the lock is held by readers or by another writer. If this probe fires,the lockstat provider’s rw-block probe also fires.
sema Probe that fires whenever a semop(2) system call is made, but before anysemaphore operations have been performed.
sysexec Probe that fires whenever an exec(2) system call is made.
sysfork Probe that fires whenever a fork(2) system call is made.
sysread Probe that fires whenever a read, readv, or pread system call is made.
sysvfork Probe that fires whenever a vfork(2) system call is made.
syswrite Probe that fires whenever a write(2), writev(2), or pwrite(2) system call ismade.
trap Probe that fires whenever a processor trap occurs. Note that someprocessors, in particular UltraSPARC variants, handle some lightweighttraps through amechanism that does not cause this probe to fire.
ufsdirblk Probe that fires whenever a directory block is read from the UFS file system.See ufs(7FS) for details onUFS.
ufsiget Probe that fires whenever an inode is retrieved. See ufs(7FS) for details onUFS.
ufsinopage Probe that fires after an in-core inodewithout any associated data pages hasbeenmade available for reuse. See ufs(7FS) for details onUFS.
Performance Monitoring
Chapter 4 • Using DTrace 39

ufsipage Probe that fires after an in-core inodewith associated data pages has beenmade available for reuse. This probe fires after the associated data pages havebeen flushed to disk. See ufs(7FS) for details onUFS.
wait_ticks_io Probe that fires when the periodic system clock hasmade the determinationthat a CPU is otherwise idle but some threads are waiting for I/O on theCPU. This probe fires in the context of the system clock and therefore fireson the CPU running the system clock. The cpu_t argument (arg2) indicatesthe CPU that is described as waiting for I/O. No semantic difference betweenwait_ticks_io and cpu_ticks_wait; wait_ticks_io exists solely forhistorical reasons.
writech Probe that fires after each successful write, but before control is returned tothe thread performing the write.Awrite can occur through the write,writev, or pwrite system calls. arg0 contains the number of bytes that weresuccessfully written.
xcalls Probe that fires whenever a cross-call is about to bemade.Across-call is theoperating system’s mechanism for one CPU to request immediate work ofanother CPU.
EXAMPLE 4–1Using the quantizeAggregation FunctionWith the sysinfo Probes
The quantize aggregation function displays a power-of-two frequency distribution bar graph of itsargument. The following example uses the quantize function to determine the size of the read callsthat are performed by all processes on the system over a period of ten seconds. The arg0 argumentfor the sysinfo probes states the amount by which to increment the statistic. This value is 1 for mostsysinfo probes. Two exceptions are the readch and writech probes. For these probes, the arg0argument is set to the actual number of bytes that are read or are written, respectively.
# cat -n read.d
1 #!/usr/sbin/dtrace -s
2 sysinfo:::readch
3 {
4 @[execname] = quantize(arg0);
5 }
6
7 tick-10sec
8 {
9 exit(0);
10 }
# dtrace -s read.d
dtrace: script ’read.d’ matched 5 probes
CPU ID FUNCTION:NAME
0 36754 :tick-10sec
bash
value ---------- Distribution ---------- count
Performance Monitoring
DTrace User Guide • May 200640

EXAMPLE 4–1Using the quantizeAggregation FunctionWith the sysinfo Probes (Continued)
0 | 0
1 |@@@@@@@@@@@@@@@@@@@@@@@@@@@@@@@@@@ 13
2 | 0
file
value ---------- Distribution ---------- count
-1 | 0
0 | 2
1 | 0
2 | 0
4 | 6
8 | 0
16 | 0
32 | 6
64 | 6
128 |@@ 16
256 |@@@@ 30
512 |@@@@@@@@@@@@@@@@@@@@@@@@@@@@@ 199
1024 | 0
2048 | 0
4096 | 1
8192 | 1
16384 | 0
grep
value ---------- Distribution ---------- count
-1 | 0
0 |@@@@@@@@@@@@@@@@@@@ 99
1 | 0
2 | 0
4 | 0
8 | 0
16 | 0
32 | 0
64 | 0
128 | 1
256 |@@@@ 25
512 |@@@@ 23
1024 |@@@@ 24
2048 |@@@@ 22
4096 | 4
8192 | 3
16384 | 0
Performance Monitoring
Chapter 4 • Using DTrace 41

EXAMPLE 4–2 Finding the Source of Cross-Calls
In this example, consider the following output form the mpstat(1M) command:
CPU minf mjf xcal intr ithr csw icsw migr smtx srw syscl usr sys wt idl
0 2189 0 1302 14 1 215 12 54 28 0 12995 13 14 0 73
1 3385 0 1137 218 104 195 13 58 33 0 14486 19 15 0 66
2 1918 0 1039 12 1 226 15 49 22 0 13251 13 12 0 75
3 2430 0 1284 220 113 201 10 50 26 0 13926 10 15 0 75
The values in the xcal and syscl columns are atypically high, reflecting a possible drain on systemperformance. The system is relatively idle and is not spending an unusual amount of time waiting forI/O. The numbers in the xcal column are scaled per second and are read from the xcalls field of thesys kstat. To see which executables are responsible for the cross-calls, enter the following dtracecommand:
# dtrace -n ’xcalls {@[execname] = count()}’
dtrace: description ’xcalls ’ matched 3 probes
^C
find 2
cut 2
snmpd 2
mpstat 22
sendmail 101
grep 123
bash 175
dtrace 435
sched 784
xargs 22308
file 89889
#
This output indicates that the bulk of the cross calls are originating from file(1) and xargs(1)processes. You can find these processes with the pgrep(1) and ptree(1) commands.
# pgrep xargs
15973
# ptree 15973
204 /usr/sbin/inetd -s
5650 in.telnetd
5653 -sh
5657 bash
15970 /bin/sh ./findtxt configuration
15971 cut -f1 -d:
15973 xargs file
16686 file /usr/bin/tbl /usr/bin/troff /usr/bin/ul /usr/bin/vgrind /usr/bin/catman
This output indicates that the xargs and file commands form part of a custom user shell script. Tolocate this script, you can perform the following commands:
Performance Monitoring
DTrace User Guide • May 200642

EXAMPLE 4–2 Finding the Source of Cross-Calls (Continued)
# find / -name findtxt
/usrs1/james/findtxt
# cat /usrs1/james/findtxt
#!/bin/sh
find / -type f | xargs file | grep text | cut -f1 -d: > /tmp/findtxt$$
cat /tmp/findtxt$$ | xargs grep $1
rm /tmp/findtxt$$
#
This script runsmany process concurrently.A large amount of interprocess communication ishappening through pipes. The number of pipesmakes the script resource intensive. The scriptattempts to find every text file on the system and then searches each file for a specific text.
TracingUser ProcessesThis section focuses on the DTrace facilities that are useful for tracing user process activity andprovides examples to illustrate their use.
Using the copyin() and copyinstr() SubroutinesDTrace probes execute in the Solaris kernel. Probes use the copyin() or copyinstr() subroutines tocopy user process data into the kernel’s address space.
Consider the following write() system call:
ssize_t write(int fd, const void *buf, size_t nbytes);
The following D program illustrates an incorrect attempt to print the contents of a string that ispassed to the write system call:
syscall::write:entry
{
printf("%s", stringof(arg1)); /* incorrect use of arg1 */
}
When you run this script, DTrace produces errormessages similar to the following example.
dtrace: error on enabled probe ID 1 (ID 37: syscall::write:entry): \
invalid address (0x10038a000) in action #1
The arg1 variable is an address that refers tomemory in the process that is executing the system call.Use the copyinstr() subroutine to read the string at that address. Record the result with theprintf() action:
Tracing User Processes
Chapter 4 • Using DTrace 43

syscall::write:entry
{
printf("%s", copyinstr(arg1)); /* correct use of arg1 */
The output of this script shows all of the strings that are passed to the write system call.
Avoiding ErrorsThe copyin() and copyinstr() subroutines cannot read from user addresses which have not yetbeen touched.Avalid address might cause an error if the page that contains that address has not beenfaulted in by an access attempt. Consider the following example:
# dtrace -n syscall::open:entry’{ trace(copyinstr(arg0)); }’
dtrace: description ’syscall::open:entry’ matched 1 probe
CPU ID FUNCTION:NAME
dtrace: error on enabled probe ID 2 (ID 50: syscall::open:entry): invalid address
(0x9af1b) in action #1 at DIF offset 52
In the output from the previous example, the application was functioning properly and the addressin arg0was valid. However, the address in arg0 referred to a page that the corresponding process hadnot accessed. To resolve this issue, wait for the kernel or application to use the data before tracing thedata. For example, youmight wait until the system call returns to apply copyinstr(), as shown inthe following example:
# dtrace -n syscall::open:entry’{ self->file = arg0; }’ \
-n syscall::open:return’{ trace(copyinstr(self->file)); self->file = 0; }’
dtrace: description ’syscall::open:entry’ matched 1 probe
CPU ID FUNCTION:NAME
2 51 open:return /dev/null
Eliminating dtrace InterferenceIf you trace every call to the write system call, you will cause a cascade of output. Each call to thewrite() function causes the dtrace command to call the write() function as it displays the output.This feedback loop is a good example of how the dtrace command can interfere with the desireddata. You can use a simple predicate to avoid this behavior, as shown in the following example:
syscall::write:entry
/pid != $pid/
{
printf("%s", stringof(copyin(arg1, arg2)));
}
The $pidmacro variable expands to the process identifier of the process that enabled the probes. Thepid variable contains the process identifier of the process whose thread was running on the CPUwhere the probe was fired. The predicate /pid != $pid/ ensures that the script does not trace anyevents related to the running of this script.
Tracing User Processes
DTrace User Guide • May 200644

syscallProviderThe syscall provider enables you to trace every system call entry and return. You can use theprstat(1M) command to see examine process behavior.
$ prstat -m -p 31337
PID USERNAME USR SYS TRP TFL DFL LCK SLP LAT VCX ICX SCL SIG PROCESS/NLWP
13499 user1 53 44 0.0 0.0 0.0 0.0 2.5 0.0 4K 24 9K 0 mystery/6
This example shows that the process is consuming a large amount of system time. One possibleexplanation for this behavior is that the process is executing a large number of system calls. You canuse a simple D program specified on the command line to see which system calls are happeningmostoften:
# dtrace -n syscall:::entry’/pid == 31337/{ @syscalls[probefunc] = count(); }’
dtrace: description ’syscall:::entry’ matched 215 probes
^C
open 1
lwp_park 2
times 4
fcntl 5
close 6
sigaction 6
read 10
ioctl 14
sigprocmask 106
write 1092
This report shows a large number of system calls to the write() function. You can use the syscallprovider to further examine the source of all the write() system calls:
# dtrace -n syscall::write:entry’/pid == 31337/{ @writes[arg2] = quantize(); }’
dtrace: description ’syscall::write:entry’ matched 1 probe
^C
value ------------- Distribution ------------- count
0 | 0
1 |@@@@@@@@@@@@@@@@@@@@@@@@@@@@@@@@@@@@@@ 1037
2 |@ 3
4 | 0
8 | 0
16 | 0
32 |@ 3
64 | 0
128 | 0
256 | 0
512 | 0
1024 |@ 5
Tracing User Processes
Chapter 4 • Using DTrace 45

2048 | 0
The output shows that the process is executingmany write() system calls with a relatively smallamount of data.
The ustack()ActionThe ustack() action traces the user thread’s stack. If a process that opensmany files occasionallyfails in the open() system call, you can use the ustack() action to discover the code path thatexecutes the failed open():
syscall::open:entry
/pid == $1/
{
self->path = copyinstr(arg0);
}
syscall::open:return
/self->path != NULL && arg1 == -1/
{
printf("open for ’%s’ failed", self->path);
ustack();
}
This script also illustrates the use of the $1macro variable. This macro variable takes the value of thefirst operand that is specified on the dtrace command line:
# dtrace -s ./badopen.d 31337
dtrace: script ’./badopen.d’ matched 2 probes
CPU ID FUNCTION:NAME
0 40 open:return open for ’/usr/lib/foo’ failed
libc.so.1‘__open+0x4
libc.so.1‘open+0x6c
420b0
tcsh‘dosource+0xe0
tcsh‘execute+0x978
tcsh‘execute+0xba0
tcsh‘process+0x50c
tcsh‘main+0x1d54
tcsh‘_start+0xdc
The ustack() action records program counter (PC) values for the stack. The dtrace commandresolves those PC values to symbol names by looking though the process’s symbol tables. The dtracecommand prints out PC values that cannot be resolved as hexadecimal integers.
When a process exits or is killed before the ustack() data is formatted for output, the dtracecommandmight be unable to convert the PC values in the stack trace to symbol names. In that event
Tracing User Processes
DTrace User Guide • May 200646

the dtrace command displays these values as hexadecimal integers. To work around this limitation,specify a process of interest with the -c or -p option to dtrace. If the process ID or command is notknown in advance, the following example D program that can be used to work around the limitation.The example uses the open system call probe, but this technique can be used with any script that usesthe ustack action.
syscall::open:entry
{
ustack();
stop_pids[pid] = 1;
}
syscall::rexit:entry
/stop_pids[pid] != 0/
{
printf("stopping pid %d", pid);
stop();
stop_pids[pid] = 0;
}
The previous script stops a process just before the process exits, if the ustack() action has beenapplied to a thread in that process. This technique ensures that the dtrace command can resolve thePC values to symbolic names. The value of stop_pids[pid] is set to 0 after clearing the dynamicvariable.
The pidProviderThe pid provider enables you to trace any instruction in a process. Unlikemost other providers, pidprobes are created on demand, based on the probe descriptions found in your D programs.
User FunctionBoundary TracingThe simplest mode of operation for the pid provider is as the user space analogue to the fbt provider.The following example program traces all function entries and returns that aremade from a singlefunction. The $1macro variable expands to the first operand on the command line. This macrovariable is the process ID for the process to trace. The $2macro variable expands to the secondoperand on the command line. This macro variable is the name of the function that all function callsare traced from.
EXAMPLE 4–3 userfunc.d: TraceUser Function Entry andReturn
pid$1::$2:entry
{
self->trace = 1;
}
Tracing User Processes
Chapter 4 • Using DTrace 47

EXAMPLE 4–3 userfunc.d: TraceUser Function Entry andReturn (Continued)
pid$1::$2:return
/self->trace/
{
self->trace = 0;
}
pid$1:::entry,
pid$1:::return
/self->trace/
{
}
This script produces output that is similar to the following example:
# ./userfunc.d 15032 execute
dtrace: script ’./userfunc.d’ matched 11594 probes
0 -> execute
0 -> execute
0 -> Dfix
0 <- Dfix
0 -> s_strsave
0 -> malloc
0 <- malloc
0 <- s_strsave
0 -> set
0 -> malloc
0 <- malloc
0 <- set
0 -> set1
0 -> tglob
0 <- tglob
0 <- set1
0 -> setq
0 -> s_strcmp
0 <- s_strcmp
...
The pid provider can only be used on processes that are already running. You can use the $targetmacro variable and the dtrace options -c and -p to create and instrument processes of interest usingthe dtrace facility. The following D script determines the distribution of function calls that aremadeto libc by a particular subject process:
pid$target:libc.so::entry
{
Tracing User Processes
DTrace User Guide • May 200648
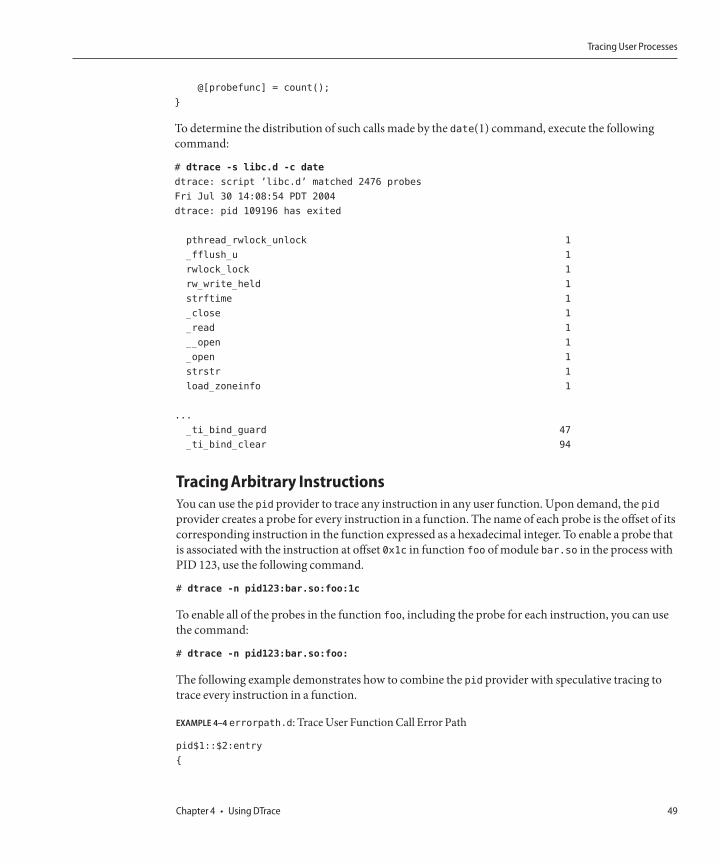
@[probefunc] = count();
}
To determine the distribution of such calls made by the date(1) command, execute the followingcommand:
# dtrace -s libc.d -c date
dtrace: script ’libc.d’ matched 2476 probes
Fri Jul 30 14:08:54 PDT 2004
dtrace: pid 109196 has exited
pthread_rwlock_unlock 1
_fflush_u 1
rwlock_lock 1
rw_write_held 1
strftime 1
_close 1
_read 1
__open 1
_open 1
strstr 1
load_zoneinfo 1
...
_ti_bind_guard 47
_ti_bind_clear 94
TracingArbitrary InstructionsYou can use the pid provider to trace any instruction in any user function. Upon demand, the pidprovider creates a probe for every instruction in a function. The name of each probe is the offset of itscorresponding instruction in the function expressed as a hexadecimal integer. To enable a probe thatis associated with the instruction at offset 0x1c in function foo ofmodule bar.so in the process withPID 123, use the following command.
# dtrace -n pid123:bar.so:foo:1c
To enable all of the probes in the function foo, including the probe for each instruction, you can usethe command:
# dtrace -n pid123:bar.so:foo:
The following example demonstrates how to combine the pid provider with speculative tracing totrace every instruction in a function.
EXAMPLE 4–4 errorpath.d: TraceUser FunctionCall Error Path
pid$1::$2:entry
{
Tracing User Processes
Chapter 4 • Using DTrace 49

EXAMPLE 4–4 errorpath.d: TraceUser FunctionCall Error Path (Continued)
self->spec = speculation();
speculate(self->spec);
printf("%x %x %x %x %x", arg0, arg1, arg2, arg3, arg4);
}
pid$1::$2:
/self->spec/
{
speculate(self->spec);
}
pid$1::$2:return
/self->spec && arg1 == 0/
{
discard(self->spec);
self->spec = 0;
}
pid$1::$2:return
/self->spec && arg1 != 0/
{
commit(self->spec);
self->spec = 0;
}
When errorpath.d executes, the output of the script is similar to the following example.
# ./errorpath.d 100461 _chdir
dtrace: script ’./errorpath.d’ matched 19 probes
CPU ID FUNCTION:NAME
0 25253 _chdir:entry 81e08 6d140 ffbfcb20 656c73 0
0 25253 _chdir:entry
0 25269 _chdir:0
0 25270 _chdir:4
0 25271 _chdir:8
0 25272 _chdir:c
0 25273 _chdir:10
0 25274 _chdir:14
0 25275 _chdir:18
0 25276 _chdir:1c
0 25277 _chdir:20
0 25278 _chdir:24
0 25279 _chdir:28
0 25280 _chdir:2c
0 25268 _chdir:return
Tracing User Processes
DTrace User Guide • May 200650

Anonymous TracingThis section describes tracing that is not associated with anyDTrace consumer.Anonymous tracingis used in situations when noDTrace consumer processes can run. Only the super usermay create ananonymous enabling. Only one anonymous enabling can exist at any time.
Anonymous EnablingsTo create an anonymous enabling, use the -A option with a dtrace command invocation thatspecifies the desired probes, predicates, actions and options. The dtrace command adds a series ofdriver properties that represent your request to the configuration file for the dtrace(7D) driver. Theconfiguration file is typically /kernel/drv/dtrace.conf. The dtrace driver reads these propertieswhen the driver is loaded. The driver enables the specified probes with the specified actions andcreates an anonymous state to associate with the new enabling. The dtrace driver is normally loadedon demand, along with any drivers that act as dtrace providers. To allow tracing during boot, thedtrace drivermust be loaded as early as possible. The dtrace command adds the necessaryforceload statements to /etc/system (see system(4) for each required dtrace provider and for thedtrace driver.
When the system boots, the dtrace driver sends amessage indicating that the configuration file hasbeen successfully processed.An anonymous enabling can set any of the options that are availableduring normal use of the dtrace command.
To remove an anonymous enabling, specify the -A option to the dtrace commandwithout any probedescriptions.
ClaimingAnonymous StateWhen themachine has completely booted, you can claim an existing anonymous state by specifyingthe -a option with the dtrace command. By default, the -a option claims the anonymous state andprocesses the existing data, then continues to run. To consume the anonymous state and exit, add the-e option.
When the anonymous state has been consumed from the kernel, the anonymous state cannot bereplaced. If you attempt to claim an anonymous tracing state that does not exist, the dtracecommand generates amessage that is similar to the following example:
dtrace: could not enable tracing: No anonymous tracing state
If drops or errors occur, the dtrace command generates the appropriate messages when theanonymous state is claimed. Themessages for drops and errors are the same for both anonymousand non-anonymous state.
Anonymous Tracing
Chapter 4 • Using DTrace 51

Anonymous Tracing ExamplesThe following example shows an anonymous DTrace enabling for every probe in the iprb(7D)module:
# dtrace -A -m iprb
dtrace: saved anonymous enabling in /kernel/drv/dtrace.conf
dtrace: added forceload directives to /etc/system
dtrace: run update_drv(1M) or reboot to enable changes
# reboot
After rebooting, the dtrace driver prints amessage on the console to indicate that the driver isenabling the specified probes:
...
Copyright 1983-2003 Sun Microsystems, Inc. All rights reserved.
Use is subject to license terms.
NOTICE: enabling probe 0 (:iprb::)
NOTICE: enabling probe 1 (dtrace:::ERROR)
configuring IPv4 interfaces: iprb0.
...
After rebooting themachine, specifying the -a option with the dtrace command consumes theanonymous state:
# dtrace -a
CPU ID FUNCTION:NAME
0 22954 _init:entry
0 22955 _init:return
0 22800 iprbprobe:entry
0 22934 iprb_get_dev_type:entry
0 22935 iprb_get_dev_type:return
0 22801 iprbprobe:return
0 22802 iprbattach:entry
0 22874 iprb_getprop:entry
0 22875 iprb_getprop:return
0 22934 iprb_get_dev_type:entry
0 22935 iprb_get_dev_type:return
0 22870 iprb_self_test:entry
0 22871 iprb_self_test:return
0 22958 iprb_hard_reset:entry
0 22959 iprb_hard_reset:return
0 22862 iprb_get_eeprom_size:entry
0 22826 iprb_shiftout:entry
0 22828 iprb_raiseclock:entry
0 22829 iprb_raiseclock:return
...
The following example focuses only on functions that are called from iprbattach().
Anonymous Tracing
DTrace User Guide • May 200652

fbt::iprbattach:entry
{
self->trace = 1;
}
fbt:::
/self->trace/
{}
fbt::iprbattach:return
{
self->trace = 0;
}
Run the following commands to clear the previous settings from the driver configuration file, installthe new anonymous tracing request, and reboot:
# dtrace -AFs iprb.d
dtrace: cleaned up old anonymous enabling in /kernel/drv/dtrace.conf
dtrace: cleaned up forceload directives in /etc/system
dtrace: saved anonymous enabling in /kernel/drv/dtrace.conf
dtrace: added forceload directives to /etc/system
dtrace: run update_drv(1M) or reboot to enable changes
# reboot
After rebooting, the dtrace driver prints a different message on the console to indicate the slightlydifferent enabling:
...
Copyright 1983-2003 Sun Microsystems, Inc. All rights reserved.
Use is subject to license terms.
NOTICE: enabling probe 0 (fbt::iprbattach:entry)
NOTICE: enabling probe 1 (fbt:::)
NOTICE: enabling probe 2 (fbt::iprbattach:return)
NOTICE: enabling probe 3 (dtrace:::ERROR)
configuring IPv4 interfaces: iprb0.
...
After themachine has finished booting, run the dtrace commandwith the -a and the -e options toconsume the anonymous data and then exit.
# dtrace -ae
CPU FUNCTION
0 -> iprbattach
0 -> gld_mac_alloc
0 -> kmem_zalloc
0 -> kmem_cache_alloc
0 -> kmem_cache_alloc_debug
0 -> verify_and_copy_pattern
Anonymous Tracing
Chapter 4 • Using DTrace 53

0 <- verify_and_copy_pattern
0 -> tsc_gethrtime
0 <- tsc_gethrtime
0 -> getpcstack
0 <- getpcstack
0 -> kmem_log_enter
0 <- kmem_log_enter
0 <- kmem_cache_alloc_debug
0 <- kmem_cache_alloc
0 <- kmem_zalloc
0 <- gld_mac_alloc
0 -> kmem_zalloc
0 -> kmem_alloc
0 -> vmem_alloc
0 -> highbit
0 <- highbit
0 -> lowbit
0 <- lowbit
0 -> vmem_xalloc
0 -> highbit
0 <- highbit
0 -> lowbit
0 <- lowbit
0 -> segkmem_alloc
0 -> segkmem_xalloc
0 -> vmem_alloc
0 -> highbit
0 <- highbit
0 -> lowbit
0 <- lowbit
0 -> vmem_seg_alloc
0 -> highbit
0 <- highbit
0 -> highbit
0 <- highbit
0 -> vmem_seg_create
...
Speculative TracingThis section discusses the DTrace facility for speculative tracing. Speculative tracing is the ability totentatively trace data and decide whether to commit the data to a tracing buffer or discard it. Theprimarymechanism to filter out uninteresting events is the predicatemechanism. Predicates are
Speculative Tracing
DTrace User Guide • May 200654

useful when you know at the time that a probe fires whether or not the probe event is of interest.Predicates are not well suited to dealing with situations where you do not know if a given probe eventis of interest or not until after the probe fires.
If a system call is occasionally failing with a common error code, youmight want to examine the codepath that leads to the error condition. You can use the speculative tracing facility to tentatively tracedata at one ormore probe locations, then decide to commit the data to the principal buffer at anotherprobe location. The resulting trace data contains only the output of interest and requires nopostprocessing.
Speculation InterfacesThe following table describes the DTrace speculation functions.
TABLE 4–1DTrace SpeculationFunctions
FunctionName Arguments Description
speculation None Returns an identifier for a new speculative buffer
speculate ID Denotes that the remainder of the clause should betraced to the speculative buffer specified by ID
commit ID Commits the speculative buffer that is associatedwith ID
discard ID Discards the speculative buffer associated with ID
Creating a SpeculationThe speculation() function allocates a speculative buffer and returns a speculation identifier. Usethe speculation identifier in subsequent calls to the speculate() function.Aspeculation identifier ofzero is always invalid, but can be passed to speculate(), commit() or discard(). If a call tospeculation() fails, the dtrace command generates amessage that is similar to the followingexample.
dtrace: 2 failed speculations (no speculative buffer space available)
Using a SpeculationTo use a speculation, use a clause to pass an identifier that has been returned from speculation() tothe speculate() function before any data-recording actions.All data-recording actions in a clausethat contains a speculate() are speculatively traced. The D compiler generates a compile-time errorif a call to speculate() follows data recording actions in a D probe clause. Clauses can contain eitherspeculative tracing requests or non-speculative tracing requests, but not both.
Speculative Tracing
Chapter 4 • Using DTrace 55

Aggregating actions, destructive actions, and the exit actionmay never be speculative.Any attemptto take one of these actions in a clause that contains a speculate() results in a compile-time error.Aspeculate() functionmay not follow a previous speculate() function. Only one speculation ispermitted per clause.Aclause that contains only a speculate() function will speculatively trace thedefault action, which is defined to trace only the enabled probe ID.
The typical use of the speculation() function is to assign the result of the speculation() functionto a thread-local variable. That thread-local variable acts as a subsequent predicate to other probes, aswell as an argument to speculate().
EXAMPLE 4–5Typical Use of The speculation() Function
syscall::open:entry
{
self->spec = speculation();
}
syscall:::
/self->spec/
{
speculate(self->spec);
printf("this is speculative");
}
Committing a SpeculationCommit speculations by using the commit() function.When you commit a speculative buffer thebuffer’s data is copied into the principal buffer. If the data in the speculative buffer exceeds theavailable space in the principal buffer, no data is copied and the drop count for the buffer increments.If the buffer has been speculatively traced onmore than one CPU, the speculative data on thecommitting CPU is copied immediately, while speculative data on other CPUs is copied after thecommit().
A speculative buffer that is being committed is not available to subsequent speculation() calls untileach per-CPU speculative buffer is completely copied into its corresponding per-CPU principalbuffer. Subsequent attempts to write the results of a speculate() function call to the committingbuffer discard the data without generating an error. Subsequent calls to commit() or discard() alsofail without generating an error.Aclause that contains a commit() function cannot contain a datarecording action, but a clause can containmultiple commit() calls to commit disjoint buffers.
Discarding a SpeculationDiscard speculations by using the discard() function. If the speculation has only been active on theCPU that is calling the discard() function, the buffer is immediately available for subsequent callsto the speculation() function. If the speculation has been active onmore than one CPU, the
Speculative Tracing
DTrace User Guide • May 200656

discarded buffer will be available for subsequent calls to the speculation() function after the call todiscard(). If no speculative buffers are available at the time that the speculation() function iscalled adtracemessage that is similar to the following example is generated:
dtrace: 905 failed speculations (available buffer(s) still busy)
Speculation ExampleOne potential use for speculations is to highlight a particular code path. The following exampleshows the entire code path under the open(2) system call when the open() fails.
EXAMPLE 4–6 specopen.d: Code Flow for Failed open()
#!/usr/sbin/dtrace -Fs
syscall::open:entry,
syscall::open64:entry
{
/*
* The call to speculation() creates a new speculation. If this fails,
* dtrace(1M) will generate an error message indicating the reason for
* the failed speculation(), but subsequent speculative tracing will be
* silently discarded.
*/
self->spec = speculation();
speculate(self->spec);
/*
* Because this printf() follows the speculate(), it is being
* speculatively traced; it will only appear in the data buffer if the
* speculation is subsequently commited.
*/
printf("%s", stringof(copyinstr(arg0)));
}
fbt:::
/self->spec/
{
/*
* A speculate() with no other actions speculates the default action:
* tracing the EPID.
*/
speculate(self->spec);
}
syscall::open:return,
syscall::open64:return
/self->spec/
Speculative Tracing
Chapter 4 • Using DTrace 57

EXAMPLE 4–6 specopen.d: Code Flow for Failed open() (Continued)
{
/*
* To balance the output with the -F option, we want to be sure that
* every entry has a matching return. Because we speculated the
* open entry above, we want to also speculate the open return.
* This is also a convenient time to trace the errno value.
*/
speculate(self->spec);
trace(errno);
}
syscall::open:return,
syscall::open64:return
/self->spec && errno != 0/
{
/*
* If errno is non-zero, we want to commit the speculation.
*/
commit(self->spec);
self->spec = 0;
}
syscall::open:return,
syscall::open64:return
/self->spec && errno == 0/
{
/*
* If errno is not set, we discard the speculation.
*/
discard(self->spec);
self->spec = 0;
}
When you run the previous script, the script generates output that is similar to the followingexample.
# ./specopen.d
dtrace: script ’./specopen.d’ matched 24282 probes
CPU FUNCTION
1 => open /var/ld/ld.config
1 -> open
1 -> copen
1 -> falloc
1 -> ufalloc
1 -> fd_find
1 -> mutex_owned
Speculative Tracing
DTrace User Guide • May 200658

1 <- mutex_owned
1 <- fd_find
1 -> fd_reserve
1 -> mutex_owned
1 <- mutex_owned
1 -> mutex_owned
1 <- mutex_owned
1 <- fd_reserve
1 <- ufalloc
1 -> kmem_cache_alloc
1 -> kmem_cache_alloc_debug
1 -> verify_and_copy_pattern
1 <- verify_and_copy_pattern
1 -> file_cache_constructor
1 -> mutex_init
1 <- mutex_init
1 <- file_cache_constructor
1 -> tsc_gethrtime
1 <- tsc_gethrtime
1 -> getpcstack
1 <- getpcstack
1 -> kmem_log_enter
1 <- kmem_log_enter
1 <- kmem_cache_alloc_debug
1 <- kmem_cache_alloc
1 -> crhold
1 <- crhold
1 <- falloc
1 -> vn_openat
1 -> lookupnameat
1 -> copyinstr
1 <- copyinstr
1 -> lookuppnat
1 -> lookuppnvp
1 -> pn_fixslash
1 <- pn_fixslash
1 -> pn_getcomponent
1 <- pn_getcomponent
1 -> ufs_lookup
1 -> dnlc_lookup
1 -> bcmp
1 <- bcmp
1 <- dnlc_lookup
1 -> ufs_iaccess
1 -> crgetuid
1 <- crgetuid
1 -> groupmember
1 -> supgroupmember
Speculative Tracing
Chapter 4 • Using DTrace 59

1 <- supgroupmember
1 <- groupmember
1 <- ufs_iaccess
1 <- ufs_lookup
1 -> vn_rele
1 <- vn_rele
1 -> pn_getcomponent
1 <- pn_getcomponent
1 -> ufs_lookup
1 -> dnlc_lookup
1 -> bcmp
1 <- bcmp
1 <- dnlc_lookup
1 -> ufs_iaccess
1 -> crgetuid
1 <- crgetuid
1 <- ufs_iaccess
1 <- ufs_lookup
1 -> vn_rele
1 <- vn_rele
1 -> pn_getcomponent
1 <- pn_getcomponent
1 -> ufs_lookup
1 -> dnlc_lookup
1 -> bcmp
1 <- bcmp
1 <- dnlc_lookup
1 -> ufs_iaccess
1 -> crgetuid
1 <- crgetuid
1 <- ufs_iaccess
1 -> vn_rele
1 <- vn_rele
1 <- ufs_lookup
1 -> vn_rele
1 <- vn_rele
1 <- lookuppnvp
1 <- lookuppnat
1 <- lookupnameat
1 <- vn_openat
1 -> setf
1 -> fd_reserve
1 -> mutex_owned
1 <- mutex_owned
1 -> mutex_owned
1 <- mutex_owned
1 <- fd_reserve
1 -> cv_broadcast
Speculative Tracing
DTrace User Guide • May 200660

1 <- cv_broadcast
1 <- setf
1 -> unfalloc
1 -> mutex_owned
1 <- mutex_owned
1 -> crfree
1 <- crfree
1 -> kmem_cache_free
1 -> kmem_cache_free_debug
1 -> kmem_log_enter
1 <- kmem_log_enter
1 -> tsc_gethrtime
1 <- tsc_gethrtime
1 -> getpcstack
1 <- getpcstack
1 -> kmem_log_enter
1 <- kmem_log_enter
1 -> file_cache_destructor
1 -> mutex_destroy
1 <- mutex_destroy
1 <- file_cache_destructor
1 -> copy_pattern
1 <- copy_pattern
1 <- kmem_cache_free_debug
1 <- kmem_cache_free
1 <- unfalloc
1 -> set_errno
1 <- set_errno
1 <- copen
1 <- open
1 <= open 2
Speculative Tracing
Chapter 4 • Using DTrace 61

62

Index
Aactions
data recording, 20destructive, 22
breakpoint, 23chill, 23copyout, 22copyoutstr, 23panic, 23raise, 22stop, 22system, 23
jstack, 22printa, 21printf, 20stack, 21trace, 20tracemem, 20ustack, 21
anonymous enabling, 51anonymous tracing, 51
claiming anonymous state, 51example of use, 52
Ccopyin(), 43copyinstr(), 43
Ddata recording actions, 20
destructive actions, 22kernel, 23process, 22
dtrace interference, 44
Eexamples
anonymous tracing, 52speculation, 57
Ffunction boundary testing (FBT), 47
Ppid provider, 47, 49predicates, 11probes, syscall(), 45
Sspeculation, 55
committing, 56creating, 55discarding, 56example of use, 57use, 55
63

speculation() function, 55strings, 28
type, 29subroutines
copyin(), 43copyinstr(), 43
Ttracing instructions, 49
Uuser process tracing, 43ustack(), 46
Index
DTrace User Guide • May 200664