du in education trust advancing to completion hispanics 2012
TRANSCRIPT
W W W . C O L L E G E R E S U L T S . O R G | S E P T E M B E R 2 0 1 2
Advancing to Completion: Increasing degree attainment by improving graduation rates and closing gaps for Hispanic studentsB Y M A R Y N G U Y E N , E R I N WA R D B I B O , A N D J E N N I F E R E N G L E
Concerns over the rising cost of college, crushing debt burdens,
and lowered educational standards have unleashed a tsunami of
mixed messages about the value of college. For some critics, this
onslaught of conflicting signals is an opportunity to yell, “Hit
the brakes! Enough with this college-for-all nonsense.” Instead,
they argue, “college for some” is a more tenable solution.
By preying on the anxieties of students and families, these cyn-
ics are working against the progress postsecondary institutions
in the United States have made in expanding access to higher
education, including for our country’s underrepresented minor-
ity and low-income students. Given the rapidly changing demo-
graphics of our K-12 system, we cannot afford for this progress
to falter. Consider this: Over the past 20 years, the proportion of
white students in our public K-12 schools has decreased to just
over half the total student enrollment, whereas the population
of Hispanic students has almost doubled to nearly a quarter.1
Yet, while nearly 40 percent of white 25- to 29-year-olds have
attained at least a bachelor’s degree, attainment among young
Hispanics is only one-third that rate.2 These disparities are unac-
ceptable. If America is to restore its status as first-in-the-world
in degree attainment, colleges need to do more to ensure that
all of their students — especially Hispanic students — graduate
from college.
Fortunately, the evidence is unequivocal: Current trends in col-
lege graduation rates are not inevitable. We must not fall into
the defeatist “college for some” frame of mind simply because
the task at hand appears too difficult. We know that what col-
leges do matters. And we know that many schools have already
increased success and closed graduation-rate gaps for underrep-
resented students. We simply need more colleges and universi-
ties to validate and replicate the equity-minded policies and
practices of those institutions that are getting it done.
This study updates previous Education Trust briefs that looked
at public, four-year colleges that successfully improved minority
graduation rates and narrowed graduation-rate gaps.3 This new
report examines which four-year, nonprofit colleges — public
and private — have made the most improvements for Hispanic
students (see Figure 1 for the population of schools included in
this study).4 Because for-profit institutions are a distinct subset
of colleges, we have explored trends in their outcomes in a
separate report.5 In a companion brief, we profile colleges that
have made the most progress for another important group of
underrepresented students: African Americans. By highlighting
this diverse set of institutions, we find that:
• Institutionscanbenchmarktheirprogresstowardproduc-
ing more degrees in two ways: Some colleges can focus on
making gains in graduation rates for their Hispanic students,
while others can focus on closing gaps between Hispanic
students and white students.
• Thestartingpointdoesn’tmatter:Progressispossibleforall
types of institutions. Some can start by making substantial
gains in graduation rates, while others can sustain previous
progress made; still others can narrow gaps between His-
panic students and their white peers even if they’ve had large
gaps in the past.
• Onlywhencollegesinstitutionalizethepoliciesandprac-
tices that make programs for underrepresented students
successful will they bring about a transformative process that
benefits all students, and Hispanic students in particular.
Mary Nguyen is a higher education research and policy analyst at The Education Trust. Erin Ward Bibo was a consultant on this project. Jennifer Engle is director of higher education research and policy at The Education Trust. © Copyright 2012 The Education Trust.
2 THE EDUCATION TRUST | ADVANCING TO COMPLETION: HISPANICS | SEPTEMBER 2012
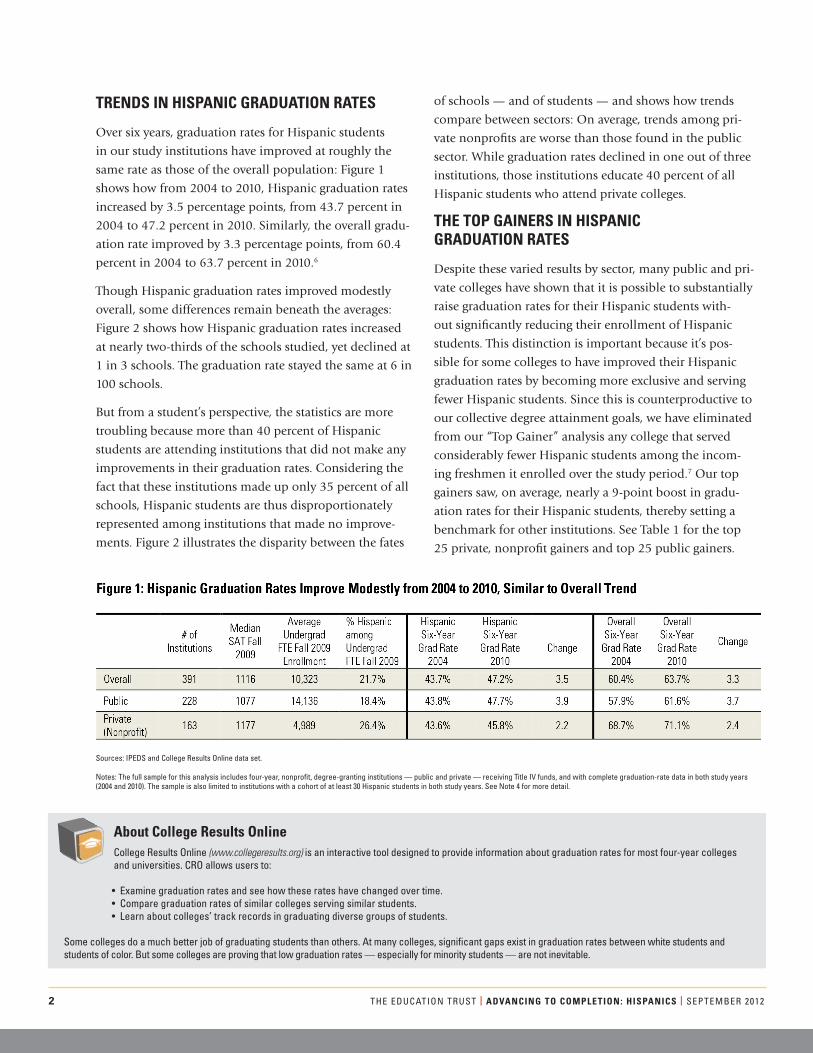
TRENDS IN HISPANIC GRADUATION RATES
Over six years, graduation rates for Hispanic students
in our study institutions have improved at roughly the
same rate as those of the overall population: Figure 1
shows how from 2004 to 2010, Hispanic graduation rates
increased by 3.5 percentage points, from 43.7 percent in
2004 to 47.2 percent in 2010. Similarly, the overall gradu-
ation rate improved by 3.3 percentage points, from 60.4
percent in 2004 to 63.7 percent in 2010.6
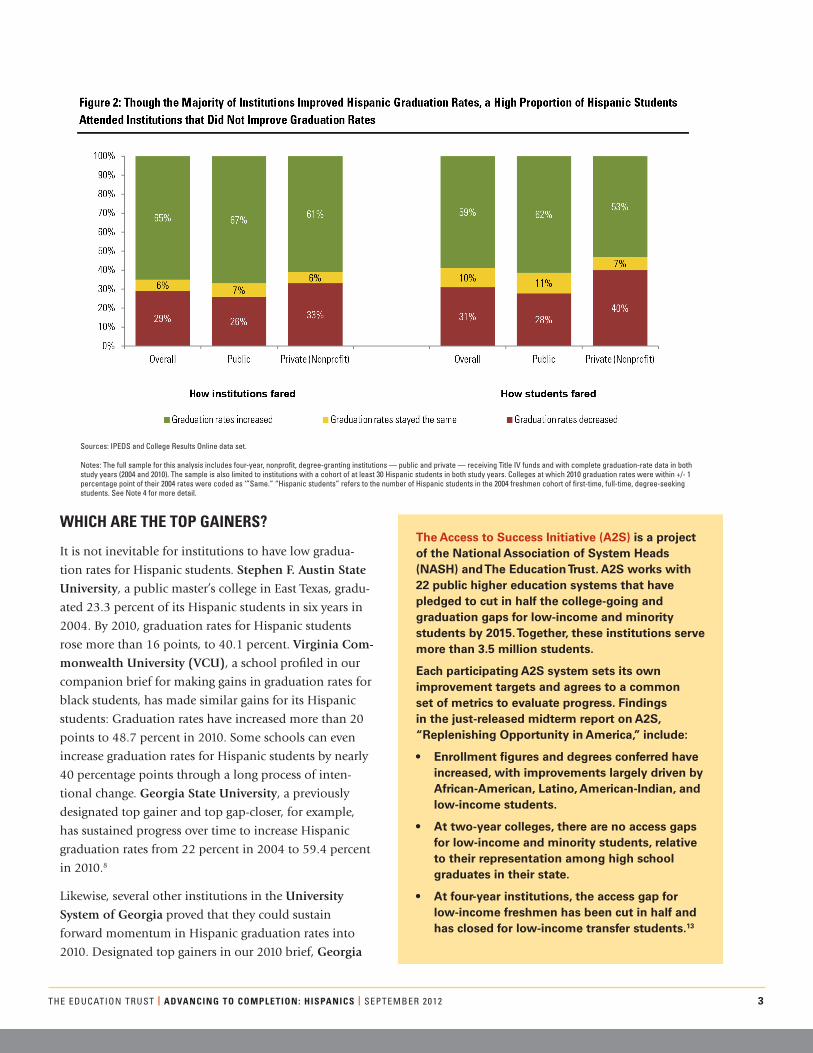
Though Hispanic graduation rates improved modestly
overall, some differences remain beneath the averages:
Figure 2 shows how Hispanic graduation rates increased
at nearly two-thirds of the schools studied, yet declined at
1 in 3 schools. The graduation rate stayed the same at 6 in
100 schools.
But from a student’s perspective, the statistics are more
troubling because more than 40 percent of Hispanic
students are attending institutions that did not make any
improvements in their graduation rates. Considering the
fact that these institutions made up only 35 percent of all
schools, Hispanic students are thus disproportionately
represented among institutions that made no improve-
ments. Figure 2 illustrates the disparity between the fates
of schools — and of students — and shows how trends
compare between sectors: On average, trends among pri-
vate nonprofits are worse than those found in the public
sector. While graduation rates declined in one out of three
institutions, those institutions educate 40 percent of all
Hispanic students who attend private colleges.
THE TOP GAINERS IN HISPANIC GRADUATION RATES
Despite these varied results by sector, many public and pri-
vate colleges have shown that it is possible to substantially
raise graduation rates for their Hispanic students with-
out significantly reducing their enrollment of Hispanic
students. This distinction is important because it’s pos-
sible for some colleges to have improved their Hispanic
graduation rates by becoming more exclusive and serving
fewer Hispanic students. Since this is counterproductive to
our collective degree attainment goals, we have eliminated
from our “Top Gainer” analysis any college that served
considerably fewer Hispanic students among the incom-
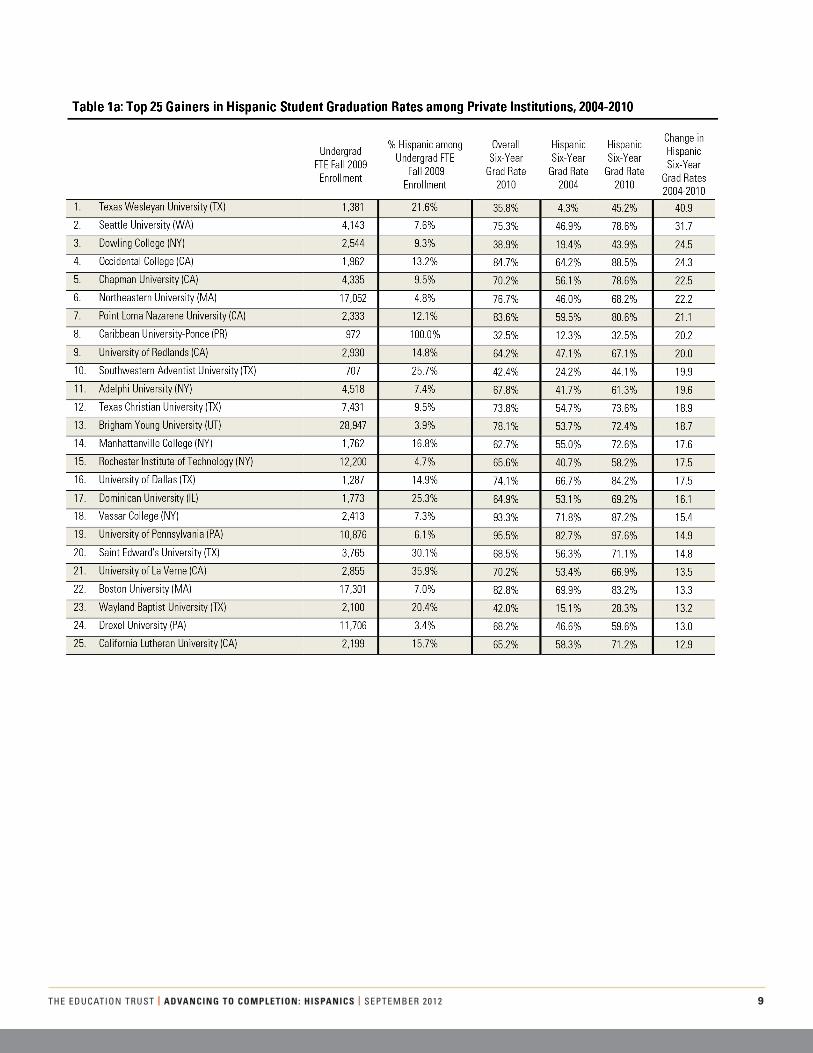
ing freshmen it enrolled over the study period.7 Our top
gainers saw, on average, nearly a 9-point boost in gradu-
ation rates for their Hispanic students, thereby setting a
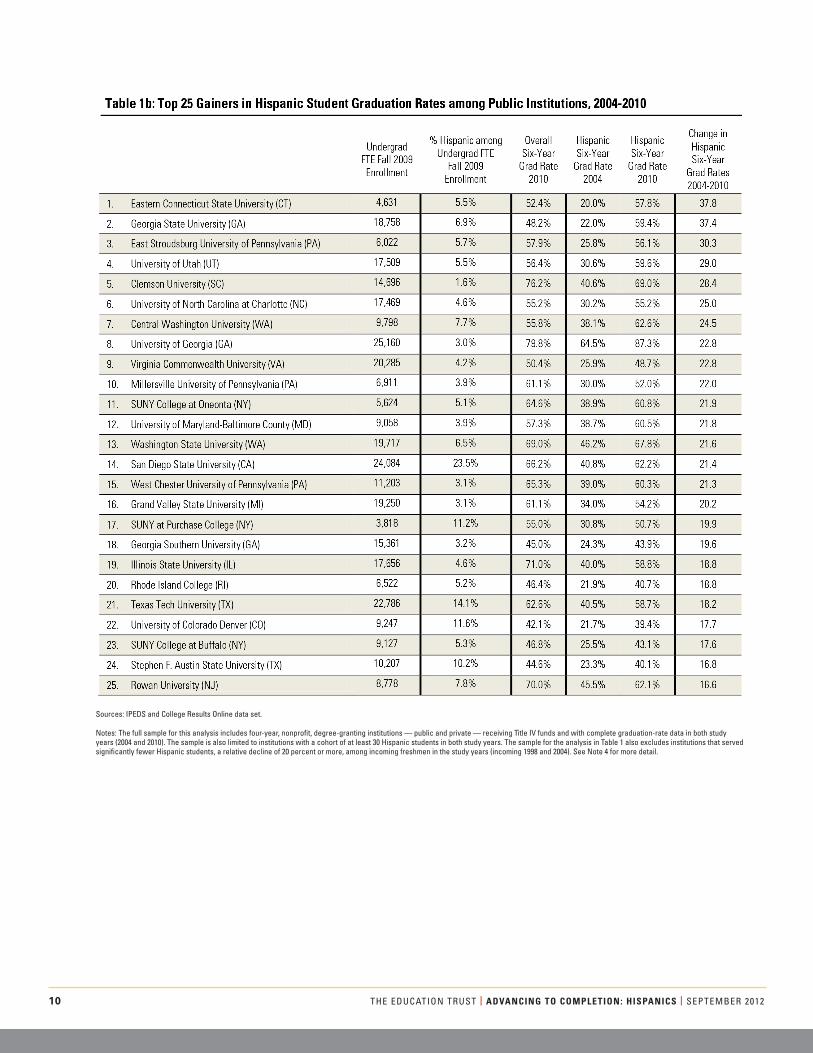
benchmark for other institutions. See Table 1 for the top
25 private, nonprofit gainers and top 25 public gainers.
About College Results OnlineCollege Results Online (www.collegeresults.org) is an interactive tool designed to provide information about graduation rates for most four-year colleges and universities. CRO allows users to:
• Examine graduation rates and see how these rates have changed over time. • Compare graduation rates of similar colleges serving similar students. • Learn about colleges’ track records in graduating diverse groups of students.
Some colleges do a much better job of graduating students than others. At many colleges, significant gaps exist in graduation rates between white students and students of color. But some colleges are proving that low graduation rates — especially for minority students — are not inevitable.
Sources: IPEDS and College Results Online data set.
Notes: The full sample for this analysis includes four-year, nonprofit, degree-granting institutions — public and private — receiving Title IV funds, and with complete graduation-rate data in both study years (2004 and 2010). The sample is also limited to institutions with a cohort of at least 30 Hispanic students in both study years. See Note 4 for more detail.
THE EDUCATION TRUST | ADVANCING TO COMPLETION: HISPANICS | SEPTEMBER 2012 3
WHICH ARE THE TOP GAINERS?
It is not inevitable for institutions to have low gradua-
tion rates for Hispanic students. Stephen F. Austin State
University, a public master’s college in East Texas, gradu-
ated 23.3 percent of its Hispanic students in six years in
2004. By 2010, graduation rates for Hispanic students
rose more than 16 points, to 40.1 percent. Virginia Com-
monwealth University (VCU), a school profiled in our
companion brief for making gains in graduation rates for
black students, has made similar gains for its Hispanic
students: Graduation rates have increased more than 20
points to 48.7 percent in 2010. Some schools can even
increase graduation rates for Hispanic students by nearly
40 percentage points through a long process of inten-
tional change. Georgia State University, a previously
designated top gainer and top gap-closer, for example,
has sustained progress over time to increase Hispanic
graduation rates from 22 percent in 2004 to 59.4 percent
in 2010.8
Likewise, several other institutions in the University
System of Georgia proved that they could sustain
forward momentum in Hispanic graduation rates into
2010. Designated top gainers in our 2010 brief, Georgia
The Access to Success Initiative (A2S) is a project of the National Association of System Heads (NASH) and The Education Trust. A2S works with 22 public higher education systems that have pledged to cut in half the college-going and graduation gaps for low-income and minority students by 2015. Together, these institutions serve more than 3.5 million students.
Each participating A2S system sets its own improvement targets and agrees to a common set of metrics to evaluate progress. Findings in the just-released midterm report on A2S, “Replenishing Opportunity in America,” include:
• Enrollmentfiguresanddegreesconferredhaveincreased, with improvements largely driven by African-American, Latino, American-Indian, and low-income students.
• Attwo-yearcolleges,therearenoaccessgapsfor low-income and minority students, relative to their representation among high school graduates in their state.
• Atfour-yearinstitutions,theaccessgapforlow-income freshmen has been cut in half and has closed for low-income transfer students.13
Sources: IPEDS and College Results Online data set.
Notes: The full sample for this analysis includes four-year, nonprofit, degree-granting institutions — public and private — receiving Title IV funds and with complete graduation-rate data in both study years (2004 and 2010). The sample is also limited to institutions with a cohort of at least 30 Hispanic students in both study years. Colleges at which 2010 graduation rates were within +/- 1 percentage point of their 2004 rates were coded as ‘”Same.” “Hispanic students” refers to the number of Hispanic students in the 2004 freshmen cohort of first-time, full-time, degree-seeking students. See Note 4 for more detail.
4 THE EDUCATION TRUST | ADVANCING TO COMPLETION: HISPANICS | SEPTEMBER 2012
Southern University and the University of Georgia join
Georgia State University in continuing to improve their
Hispanic student graduation rates. What’s notable about
these colleges is that they serve a wide range of students,
in terms of academic preparation, and they have all nearly
doubled their undergraduate enrollment of Hispanic
students from 2004 and 2010. These institutions all show
that it is possible to serve greater numbers of Hispanic
students and to help them perform well.
Our Top Gainers lists also include five Hispanic-Serving
Institutions (HSIs) and five emerging HSIs.9 Unlike His-
torically Black Colleges and Universities (HBCUs), which
began with the explicit mission of serving African-Amer-
ican students, most HSIs are defined primarily by their
Hispanic, full-time equivalent, undergraduate enrollment
(greater than or equal to 25 percent).10
Saint Edward’s University, a private Catholic college
in Texas, is one example of an HSI making consistent
improvements. In 2010, we profiled Saint Edward’s for
having small gaps, and it has continued to improve
by raising its Hispanic graduation rate by 15 percent-
age points since 2004.11 San Diego State University, an
example of an emerging HSI where Hispanic enrollment
is approaching 25 percent, is also graduating Hispanic stu-
dents in greater numbers than ever before: Its graduation
rates have increased steadily from 40.8 percent in 2004 to
62.2 percent in 2010.
Notably, San Diego State belongs to the California State
University (CSU) System, a system we highlighted in
our companion brief for making strong gains across most
of its institutions in African-American graduation rates,
and for participating in The Education Trust’s Access to
Success Initiative (see A2S, pg. 3). In particular, San Diego
State has stood out among CSU campuses for cutting
both access gaps and success gaps among underrepresented
minority students, and for raising graduation rates and
narrowing gaps between low-income students and their
peers. Campus leaders attribute their improvement to fos-
tering a culture of success that raised expectations of stu-
dents (by making orientation mandatory, force-registering
students into gateway courses, and advising students to
take a full-credit course load), putting in place critical sup-
ports so that student success was no longer left to chance,
and structuring second chances, when necessary.12
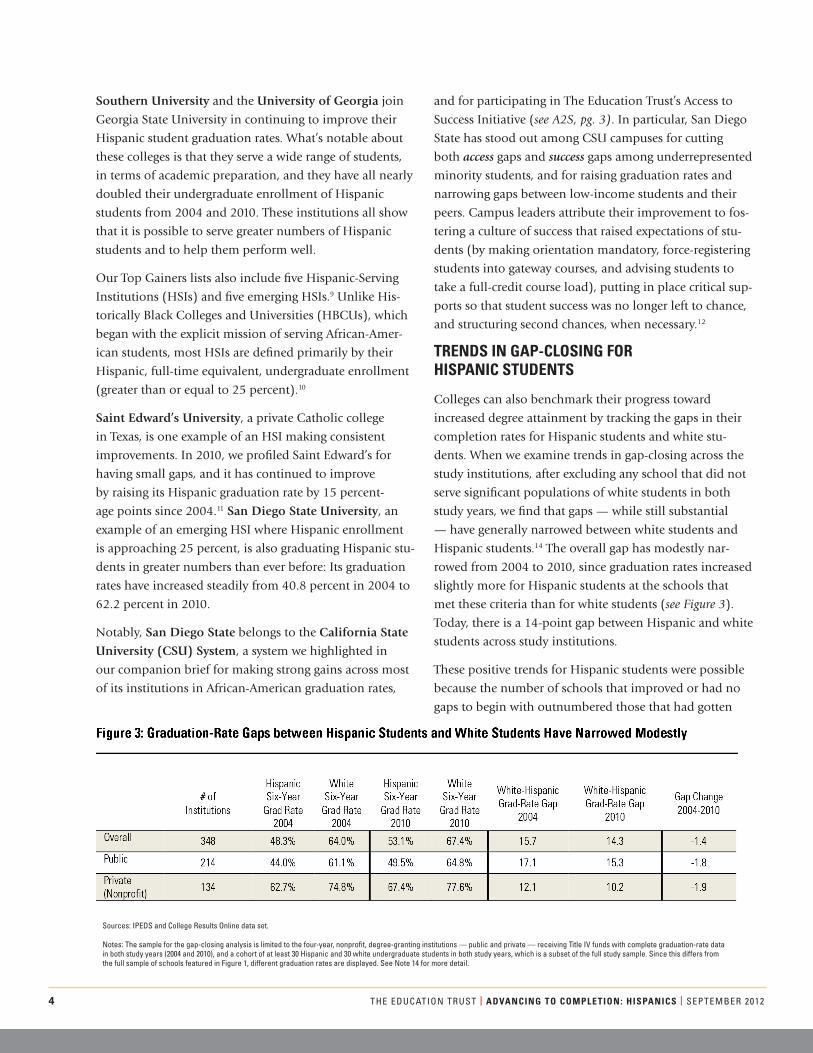
TRENDS IN GAP-CLOSING FOR HISPANIC STUDENTS
Colleges can also benchmark their progress toward
increased degree attainment by tracking the gaps in their
completion rates for Hispanic students and white stu-
dents. When we examine trends in gap-closing across the
study institutions, after excluding any school that did not
serve significant populations of white students in both
study years, we find that gaps — while still substantial
— have generally narrowed between white students and
Hispanic students.14 The overall gap has modestly nar-
rowed from 2004 to 2010, since graduation rates increased
slightly more for Hispanic students at the schools that
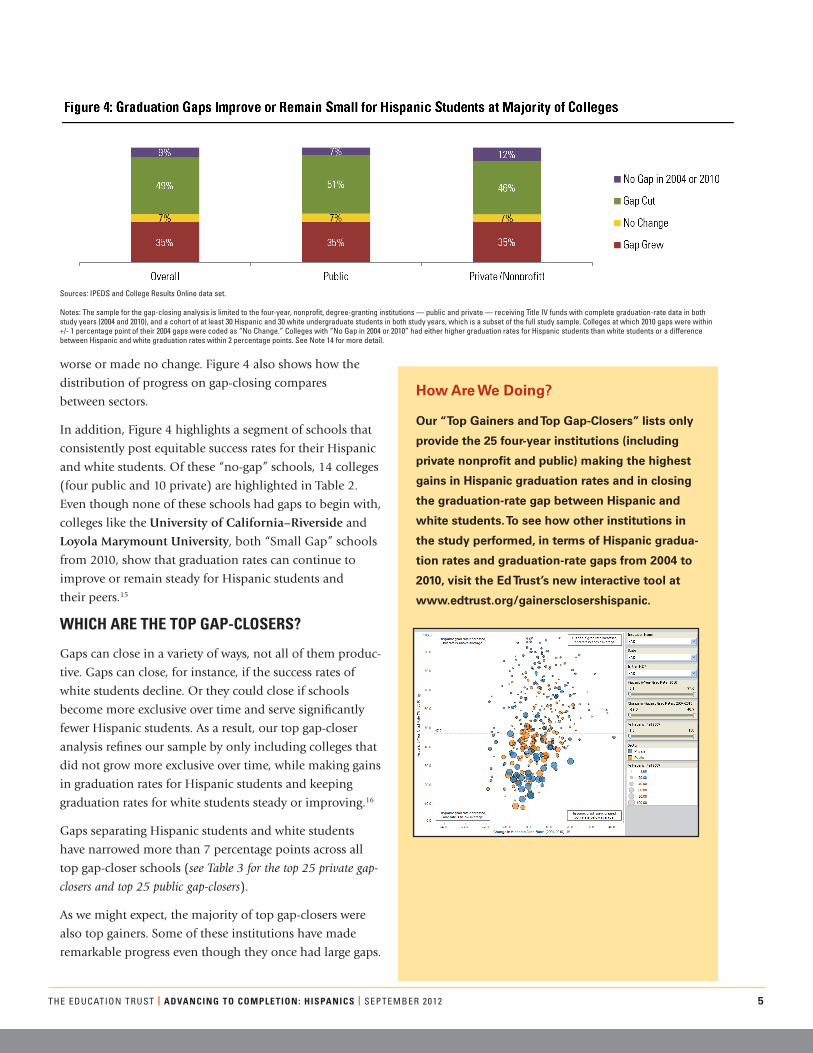
met these criteria than for white students (see Figure 3).
Today, there is a 14-point gap between Hispanic and white
students across study institutions.
These positive trends for Hispanic students were possible
because the number of schools that improved or had no
gaps to begin with outnumbered those that had gotten
Sources: IPEDS and College Results Online data set.
Notes: The sample for the gap-closing analysis is limited to the four-year, nonprofit, degree-granting institutions — public and private — receiving Title IV funds with complete graduation-rate data in both study years (2004 and 2010), and a cohort of at least 30 Hispanic and 30 white undergraduate students in both study years, which is a subset of the full study sample. Since this differs from the full sample of schools featured in Figure 1, different graduation rates are displayed. See Note 14 for more detail.
THE EDUCATION TRUST | ADVANCING TO COMPLETION: HISPANICS | SEPTEMBER 2012 5
worse or made no change. Figure 4 also shows how the
distribution of progress on gap-closing compares
between sectors.
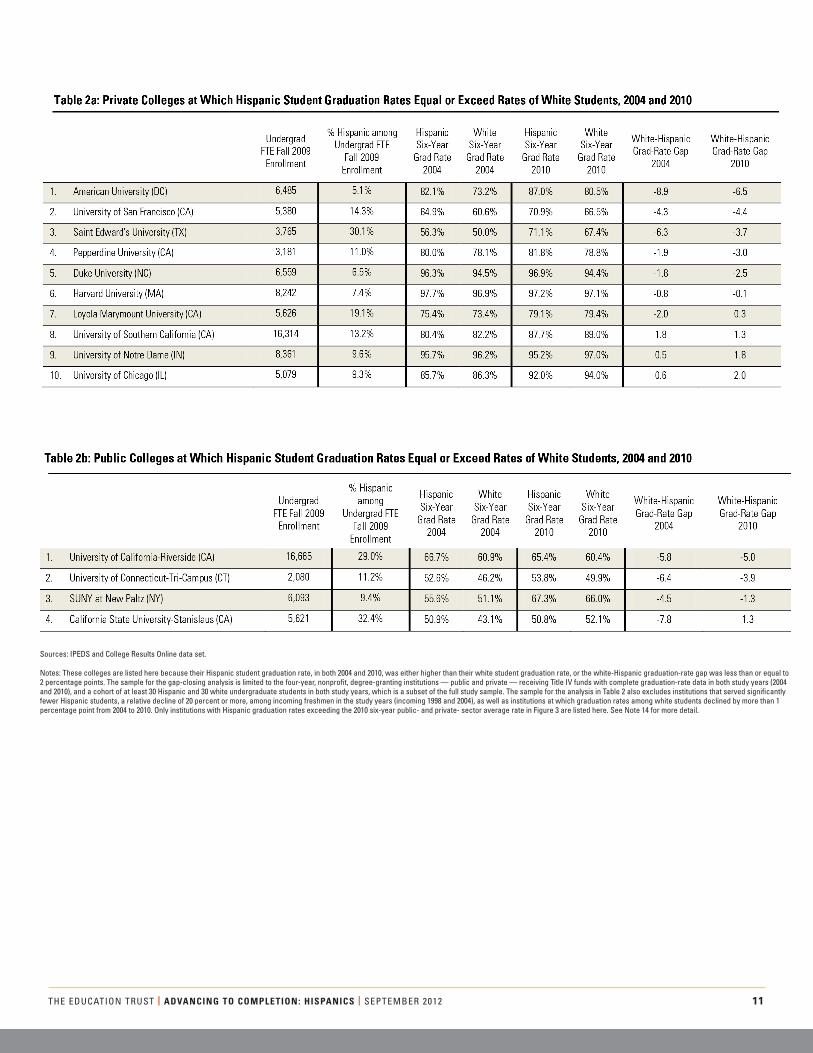
In addition, Figure 4 highlights a segment of schools that
consistently post equitable success rates for their Hispanic
and white students. Of these “no-gap” schools, 14 colleges
(four public and 10 private) are highlighted in Table 2.
Even though none of these schools had gaps to begin with,
colleges like the University of California–Riverside and
Loyola Marymount University, both “Small Gap” schools
from 2010, show that graduation rates can continue to
improve or remain steady for Hispanic students and
their peers.15
WHICH ARE THE TOP GAP-CLOSERS?
Gaps can close in a variety of ways, not all of them produc-
tive. Gaps can close, for instance, if the success rates of
white students decline. Or they could close if schools
become more exclusive over time and serve significantly
fewer Hispanic students. As a result, our top gap-closer
analysis refines our sample by only including colleges that
did not grow more exclusive over time, while making gains
in graduation rates for Hispanic students and keeping
graduation rates for white students steady or improving.16
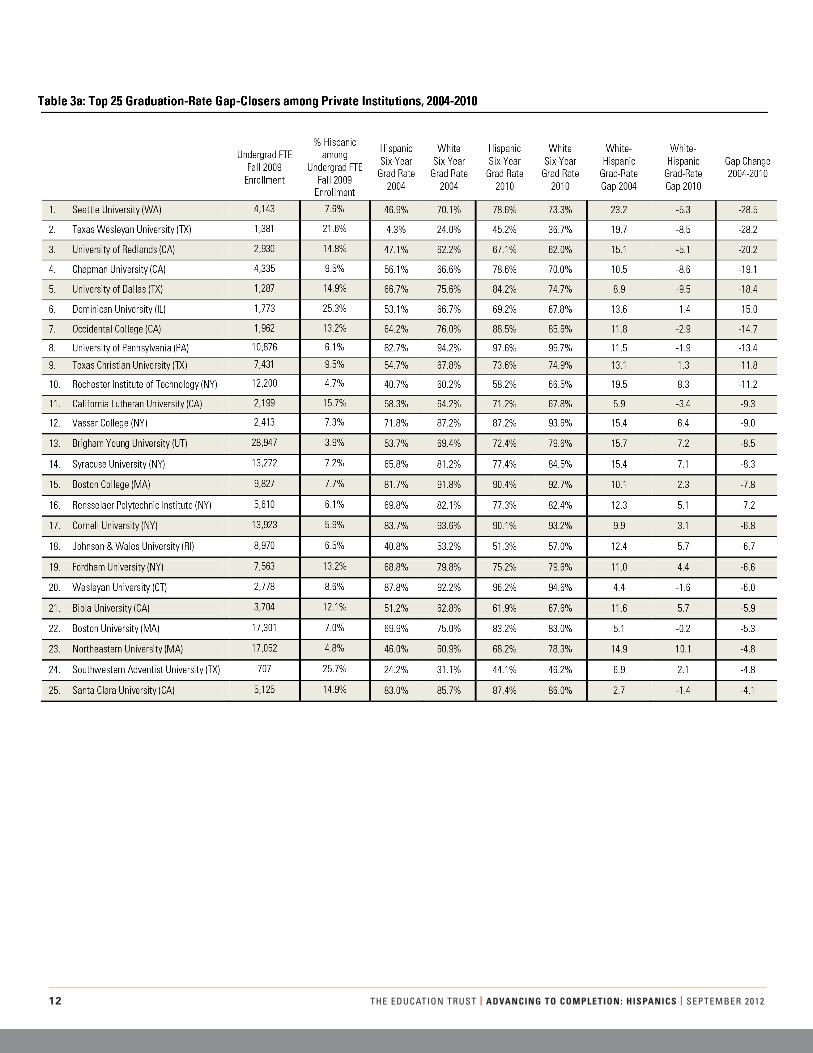
Gaps separating Hispanic students and white students
have narrowed more than 7 percentage points across all
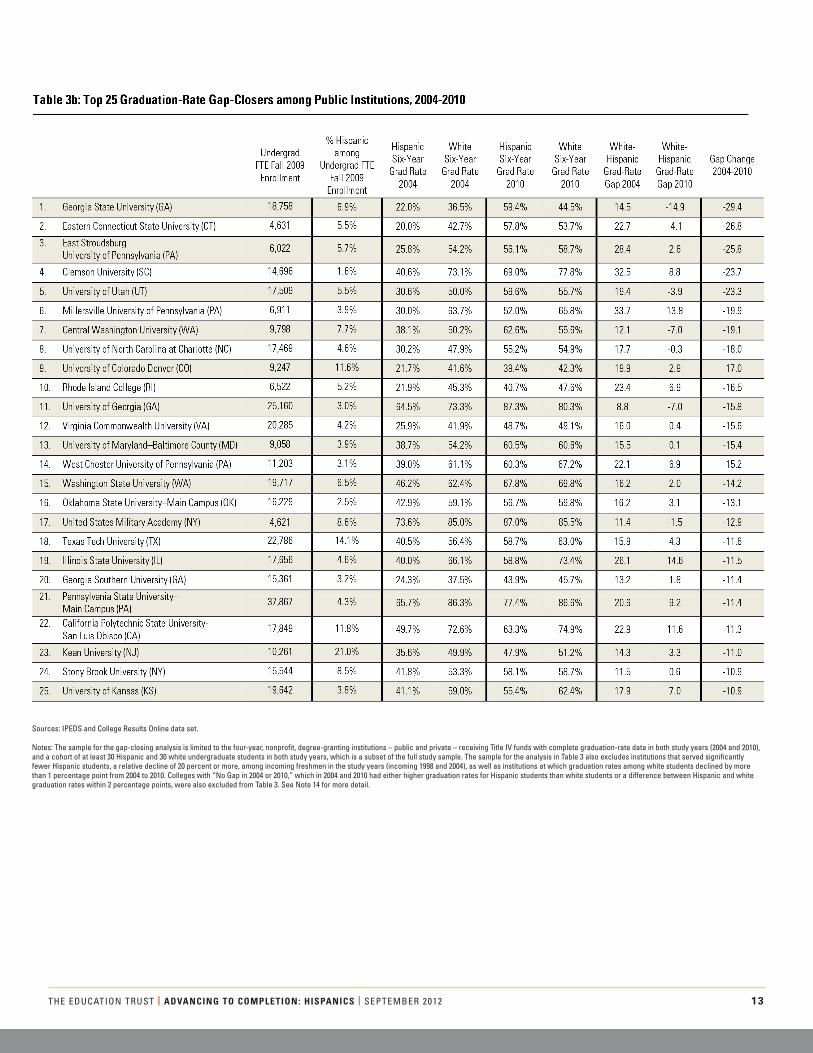
top gap-closer schools (see Table 3 for the top 25 private gap-
closers and top 25 public gap-closers).
As we might expect, the majority of top gap-closers were
also top gainers. Some of these institutions have made
remarkable progress even though they once had large gaps.
How Are We Doing?
Our “Top Gainers and Top Gap-Closers” lists only
provide the 25 four-year institutions (including
privatenonprofitandpublic)makingthehighest
gains in Hispanic graduation rates and in closing
the graduation-rate gap between Hispanic and
white students. To see how other institutions in
the study performed, in terms of Hispanic gradua-
tion rates and graduation-rate gaps from 2004 to
2010, visit the Ed Trust’s new interactive tool at
www.edtrust.org/gainersclosershispanic. Hispanic Gainers Bubble Chart
Hispanic Gap Closers Bubble Chart
Sources: IPEDS and College Results Online data set.
Notes: The sample for the gap-closing analysis is limited to the four-year, nonprofit, degree-granting institutions — public and private — receiving Title IV funds with complete graduation-rate data in both study years (2004 and 2010), and a cohort of at least 30 Hispanic and 30 white undergraduate students in both study years, which is a subset of the full study sample. Colleges at which 2010 gaps were within +/- 1 percentage point of their 2004 gaps were coded as “No Change.” Colleges with “No Gap in 2004 or 2010” had either higher graduation rates for Hispanic students than white students or a difference between Hispanic and white graduation rates within 2 percentage points. See Note 14 for more detail.
6 THE EDUCATION TRUST | ADVANCING TO COMPLETION: HISPANICS | SEPTEMBER 2012
Texas Christian University, for example, was designated a
“Big Gap” private school in our 2010 brief.17 From 2004 to
2010, Texas Christian managed to increase its Hispanic stu-
dent graduation rate by nearly 20 points, to 73.6 percent,
closing the gap with white students.
Also, nearly 45 percent of top gap-closer institutions have
succeeded in matching the success goal systems in our
A2S initiative strive to meet, which is to cut graduation-
rate gaps in half by no later than 2015. These institutions
include the University of Kansas, a 2010 gap-closer, for
narrowing its gap by 60 percent. What’s even more impres-
sive are the other 50 percent of top gap-closers that have
managed to eliminate their gaps completely. Washington
State University, for example, cut its 16-point gap in 2004
to 2 points in 2010. To learn how some schools have man-
aged to close their gaps completely, let’s see what their
leaders have to say.
Stony Brook University, a research university in the SUNY
system, is one example. From 2004 to 2010, graduation
rates increased for Hispanic students by more than 16
points, from 41.8 percent to 58.1 percent. In so doing,
they have completely closed an 11.5 percentage point gap
with white students over six years. Stony Brook, remark-
ably, has also consistently achieved equitable success for
its black students, who have outperformed their white
peers nearly every year from 2004 to 2010. What could
explain such significant progress at a school with more
than 15,000 undergraduates, where over a third receive
PellGrantsand15percentcomefromunderrepresented
minority backgrounds?
It turns out that Stony Brook has succeeded in creating
“communities of engagement that empower students and
involve faculty,” explains David Ferguson, chair of the
Department of Technology and Society, and director of the
STEMSmartPrograms.Thesecommunitiesaremanifestin
strong support programs, particularly in the STEM fields,
that target low-income and first-generation students and
that engage minority students rather than isolate and mar-
ginalizethem,Fergusonsays.
The Educational Opportunity Program(EOP)atStony
Brook, for example, has received wide attention for help-
ing its nearly 600 low-income students and students of
color gain access to — and graduate from — college.18
Startedin1968ontheStonyBrookcampus,EOPbelongs
to a state-sponsored program created to provide access to
higher education for economically disadvantaged students
who possess the potential to go to college but whose high
school experience has not fully prepared them to suc-
ceedincollege.EOPprovidesanarrayofsupportservices,
including a five-week summer “boot camp” program,
personal counseling and academic advising at least three
times a semester, and a mandatory study skill workshop
for students falling behind, which includes an academic
success contract to get back on track.
CherylHamilton,EOPdirector,describestheEOPcom-
munity as a family of students whose members extend out
into the university as campus leaders and who become
role models for other students. Students echo this familial
sentiment: “The counselors are always there for support.
It’s not like I’m a number. … Each advisor knows you
by your first, middle, and last name. They call me on my
birthday. [Stony Brook] wouldn’t be the same experience
without it.”
In the end, these intensive services pay off: Even though
EOPstudentsentercollegelessacademicallyprepared
than their peers, they end up graduating at higher rates
than other Stony Brook students.19
Stony Brook’s laser focus on science and technology has
also translated into a multitude of STEM programs serving
a considerable number of students that aim to increase
diversity in STEM education and careers. STEM Smart, the
umbrella outreach program at Stony Brook, includes over
10 programs funded by the National Science Foundation,
the National Institutes for Health, and NASA, among
others. These programs provide mentors, internship and
research opportunities, career preparation workshops, and
tutoring services for students all along the STEM pipeline
frommiddleschooltoPh.D.LikeEOP,studentsinthese
outreach programs tend to have retention and completion
rates substantially higher than the institution as a whole.
Forexample,80percentofarecentcohortofLSAMP
(LouisStokesAllianceforMinorityParticipation)stu-
dents received their bachelor’s degrees within four years.20
LSAMPhasachievedthisbyprovidingafour-yearcur-
riculum that aims to increase the numbers of underrepre-
sented minority students pursuing degrees in STEM majors
anddoctoraldegreesintheLSAMPBridgetotheDoctorate
program. The bridge program then provides students with
a full NSF fellowship, health insurance, and tuition and
fees for the first two years of graduate study.
THE EDUCATION TRUST | ADVANCING TO COMPLETION: HISPANICS | SEPTEMBER 2012 7
“A main limitation of these programs, however, is that they
have not yet achieved transformative potential,” Ferguson
says. “There have been a lot of people doing a lot of great
things, but the next step is to talk about institutional sus-
tainability. Similar to how there is an infrastructure that sup-
ports the university’s research agenda, we need an infrastruc-
ture to support diversity to move our institution forward.”
Ferguson concludes that the classroom is where real trans-
formation happens. He argues for helping faculty embrace
the kinds of active and collaborative learning strategies
employed in the various programs that engage students in
their studies in meaningful ways. To that end, a core group
offacultyinthesciences—Chemistry,Biology,andPhysics
— has begun implementing “scientific teaching,” a pedagog-
ical method in which teaching and learning are approached
with the same rigor as science itself. The express aim of the
method is to inspire a larger, more diverse population of
college students to pursue majors and careers in science, a
goal to which Stony Brook is well-positioned to contribute
both locally and nationally.21
Leaders at Texas Tech University, located in Lubbock,
Texas,saytheircampushasfoundawaytoinstitutionalize
their efforts to increase equity and excellence. Like Stony
Brook, Texas Tech is a public research university serving
more than 24,000 undergraduates, a quarter of whom are
Pellrecipientsandone-fifthofwhomcomefromunder-
represented minority backgrounds. Moreover, the Hispanic
undergraduate population at Texas Tech has grown more
than 30 percent from 2004 to 2010, to approximately 14
percent of undergraduate students in 2010. While Texas
Tech has not yet completely closed the gap for Hispanic
students, it’s pretty close: Only 4 percentage points separate
the difference in graduation rates for Hispanic students and
their white peers, and black students outperform their white
peers. Over six years, Texas Tech has managed to raise gradu-
ation rates for Hispanic students more than 18 points, from
40.5 percent in 2004 to 58.7 in 2010. As a result, the univer-
sity’sgapin2010isroughlyone-quarterthesizeofits2004
gap.Thekeytoitssuccess?“Organizationalleverage,”says
JuanMuñoz,thevicepresidentforInstitutionalDiversity,
Equity, and Community Engagement, and vice provost for
Undergraduate Education and Student Affairs.
AtTexasTech,organizationalleveragemeansavisiblepres-
ence in the administrative leadership to represent diversity
concerns. “A spokesperson to be held accountable on issues
of diversity and equity at an executive administrative level,”
Muñozexplains.LikeStonyBrook,TexasTechoriginallyhad
discrete and dispersed programs but no discernible organi-
zationalstructureunderwhichtoaggregatethem.GuyBai-
ley, president of Texas Tech from 2009 to 2012, was once a
first-generation college student, and subsequently approved
a proposal for the Division of Institutional Diversity, Equity,
andCommunityEngagement.HeappointedMuñozvice
president to provide leverage to the intentional recruit-
ment, support, and persistence and graduation of diverse
students. As a result, the division has provided the admin-
istrative assets necessary to work across the entire campus
to create a climate that supports efforts and initiatives to
advanceequityandexcellenceatTexasTech.EvenMuñoz’s
title symbolically endorses the institution’s intention to link
support for affirming diversity as essential to undergraduate
education,saysValeriePaton,theviceprovostforPlanning
and Assessment.
What’s even more vital is the notion of “critical mass,” as
manifest in a diverse student body, in faculty, and in deci-
sionmakers,Patonstresses.Sheunderscorestheimportance
of a critical mass in decision makers, including a strong
diversityadvocateinSeniorVicePresidentandProvost
Bob Smith, which helps change the university’s strategic
plan and the programs that emanate from it, and results
in a campus culture that fully supports and affirms diverse
students.Muñozstressesthesignificanceofacriticalmass
among faculty who are explicitly hired and trained to be
“retention agents.” In establishing this critical mass, Texas
Tech wanted to create “such intentional redundancy, to
make diversity so common, so routine, so that it would
become part of the normative fabric of the campus,”
Muñozsays.
Patoncreditstheimpetusforchangetoleadershipand
vision not only from the institution’s administrators but
also from Texas policymakers for instituting a statewide stra-
tegic plan to close gaps in participation, success, excellence,
and research by 2015. Notably, the Texas Higher Education
CoordinatingBoardemphasizedstatefinancialresources
and “institutional creativeness and initiative to meet insti-
tutional targets for 2005, 2010, and 2015.”22 The state then
developed a performance system to provide the public with
an annual progress report to help identify successful institu-
tions and encourage them to share their strategies with oth-
ers. A closer look reveals carefully documented actual and
target benchmarks in the number of overall credentials, and
by race and degree for every institution.
8 THE EDUCATION TRUST | ADVANCING TO COMPLETION: HISPANICS | SEPTEMBER 2012
“Supporting the values of equity, diversity, and the success
of underrepresented students is embedded in the strategic
planoftheinstitutionasawhole,”Munozconcludes.
“It’s not a compensatory program. We do this to help the
institution,thestate,andthecountry.It’snotazero-sum
game; it benefits all.”
As the leaders of these institutions suggest, having discrete
programs for underrepresented students may be a neces-
sary, but not sufficient, condition for improving student
success.But,institutionalizingthepoliciesandpractices
that make these programs successful can bring about a
transformative process that benefits all students, especially
black and Hispanic students. Our case studies of Stony
Brook and Texas Tech universities show that progress can
be made everywhere and for all groups of students: They
can start small, then grow larger into the overarching stra-
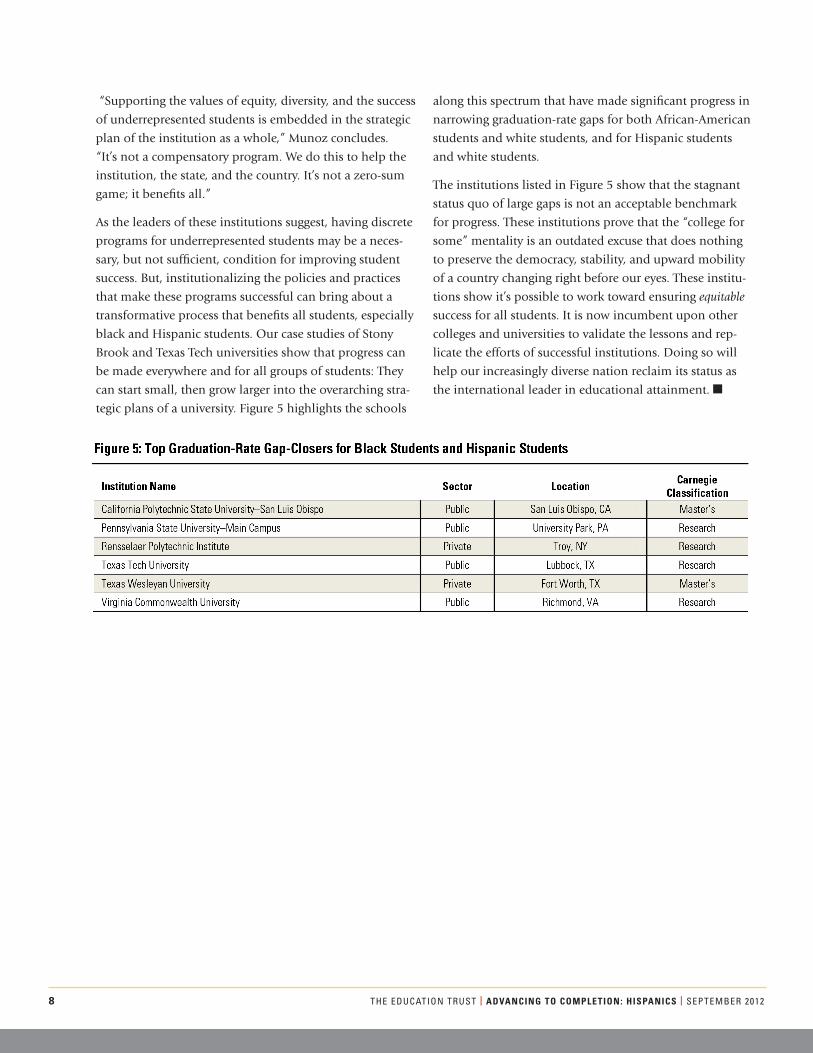
tegic plans of a university. Figure 5 highlights the schools
along this spectrum that have made significant progress in
narrowing graduation-rate gaps for both African-American
students and white students, and for Hispanic students
and white students.
The institutions listed in Figure 5 show that the stagnant
status quo of large gaps is not an acceptable benchmark
for progress. These institutions prove that the “college for
some” mentality is an outdated excuse that does nothing
to preserve the democracy, stability, and upward mobility
of a country changing right before our eyes. These institu-
tions show it’s possible to work toward ensuring equitable
success for all students. It is now incumbent upon other
colleges and universities to validate the lessons and rep-
licate the efforts of successful institutions. Doing so will
help our increasingly diverse nation reclaim its status as
the international leader in educational attainment.
THE EDUCATION TRUST | ADVANCING TO COMPLETION: HISPANICS | SEPTEMBER 2012 9
10 THE EDUCATION TRUST | ADVANCING TO COMPLETION: HISPANICS | SEPTEMBER 2012
Sources: IPEDS and College Results Online data set.
Notes: The full sample for this analysis includes four-year, nonprofit, degree-granting institutions — public and private — receiving Title IV funds and with complete graduation-rate data in both study years (2004 and 2010). The sample is also limited to institutions with a cohort of at least 30 Hispanic students in both study years. The sample for the analysis in Table 1 also excludes institutions that served significantly fewer Hispanic students, a relative decline of 20 percent or more, among incoming freshmen in the study years (incoming 1998 and 2004). See Note 4 for more detail.
THE EDUCATION TRUST | ADVANCING TO COMPLETION: HISPANICS | SEPTEMBER 2012 11
Sources: IPEDS and College Results Online data set.
Notes: These colleges are listed here because their Hispanic student graduation rate, in both 2004 and 2010, was either higher than their white student graduation rate, or the white-Hispanic graduation-rate gap was less than or equal to 2 percentage points. The sample for the gap-closing analysis is limited to the four-year, nonprofit, degree-granting institutions — public and private — receiving Title IV funds with complete graduation-rate data in both study years (2004 and 2010), and a cohort of at least 30 Hispanic and 30 white undergraduate students in both study years, which is a subset of the full study sample. The sample for the analysis in Table 2 also excludes institutions that served significantly fewer Hispanic students, a relative decline of 20 percent or more, among incoming freshmen in the study years (incoming 1998 and 2004), as well as institutions at which graduation rates among white students declined by more than 1 percentage point from 2004 to 2010. Only institutions with Hispanic graduation rates exceeding the 2010 six-year public- and private- sector average rate in Figure 3 are listed here. See Note 14 for more detail.
12 THE EDUCATION TRUST | ADVANCING TO COMPLETION: HISPANICS | SEPTEMBER 2012
THE EDUCATION TRUST | ADVANCING TO COMPLETION: HISPANICS | SEPTEMBER 2012 13
Sources: IPEDS and College Results Online data set.
Notes: The sample for the gap-closing analysis is limited to the four-year, nonprofit, degree-granting institutions – public and private – receiving Title IV funds with complete graduation-rate data in both study years (2004 and 2010), and a cohort of at least 30 Hispanic and 30 white undergraduate students in both study years, which is a subset of the full study sample. The sample for the analysis in Table 3 also excludes institutions that served significantly fewer Hispanic students, a relative decline of 20 percent or more, among incoming freshmen in the study years (incoming 1998 and 2004), as well as institutions at which graduation rates among white students declined by more than 1 percentage point from 2004 to 2010. Colleges with “No Gap in 2004 or 2010,” which in 2004 and 2010 had either higher graduation rates for Hispanic students than white students or a difference between Hispanic and white graduation rates within 2 percentage points, were also excluded from Table 3. See Note 14 for more detail.
NOTES
1. U.S.DepartmentofEducation,NationalCenterforEducationStatistics.“Indicator6:Racial/EthnicEnrollmentinPublicSchools,”TheCondition of Education 2012 (NCES 2012-045) (Washington, D.C., 2012).
2. U.S. Department of Education, National Center for Education Statistics, “The Condition of Education 2010” (NCES 2010-028) (Washing-ton, D.C., 2010). U.S. Census Bureau, “Educational Attainment in the United States.”
3. J.EngleandC.Theokas.“TopGainers:SomePublicFour-YearCollegesandUniversitiesMakeBigImprovementsinMinorityGraduationRates”(Washington,D.C.:TheEducationTrust,2010).J.EngleandC.Theokas.“TopGapClosers:SomePublicFour-YearCollegesandUniversitiesHaveMadeGoodProgressinClosingGraduationRateGaps”(Washington,D.C.:TheEducationTrust,2010).
4. The sample for this analysis includes four-year, nonprofit, degree-granting institutions — public and private — receiving Title IV funds and with complete graduation-rate data in both study years (2004 and 2010). The sample is also limited to institutions with a cohort of at least 30 Hispanic students in both study years, the minimum number of cases required by accepted statistical standards. The full sample contains 391 institutions.
5. M.Lynch,J.Engle,andJ.Cruz.“SubprimeOpportunity:TheUnfulfilledPromiseofFor-ProfitCollegesandUniversities”(Washington,D.C.: The Education Trust, 2010).
6. The Education Trust analysis takes a “weighted” graduation rate to see how many students actually graduate, rather than taking institutional averages that may bias against larger institutions that may have lower graduation rates. The Education Trust divided the sum of all students, and of Hispanic students, in the 2004 and 2010 completer cohort (for the 1998 and 2004 entering cohort) by the sum of all students, and of Hispanic students, in the 1998 and 2004 entering cohort.
7. To account for the fact that some colleges might have improved their graduation-rate performance by becoming more selective in their admissions, rather than improving academically, we chose to eliminate any college that grew more exclusive by serving significantly fewer Hispanic students among incoming freshmen, a relative decline of 20 percent or more, in the study years (incoming 1998 and 2004). We chosetorefineoursampleusingthismetricbecauseSATdatawereincompleteduringourstudyperiod.Therevisedsamplesizefellfrom391 to 367 institutions.
8. J.EngleandC.Theokas.“TopGainers:SomePublicFour-YearCollegesandUniversitiesMakeBigImprovementsinMinorityGraduationRates.”(Washington,D.C.:TheEducationTrust,2010).J.EngleandC.Theokas.“TopGapClosers:SomePublicFour-YearCollegesandUniversitiesHaveMadeGoodProgressinClosingGraduationRateGaps”(Washington,D.C.:TheEducationTrust,2010).
9. Emerging Hispanic-Serving Institutions (HSIs) are institutions that do not yet meet the HSI enrollment threshold of 25 percent but that are within the critical mass range of 15-24 percent and have the potential to become HSIs in the next few years. See D.A. Santiago and S.J. Andrade, “Emerging Hispanic-Serving Institutions (HSIs): Serving Latino Students” (Washington, D.C.: Excelencia in Education, 2010).
10. See D. Santiago, “Inventing Hispanic-Serving Institutions (HSIs): The Basics” (Washington, D.C.: Excelencia in Education, 2006).
11. M. Lynch and J. Engle. “Big Gaps, Small Gaps: Some Colleges and Universities Do Better Than Others in Graduating Hispanic Students” (Washington, D.C.: The Education Trust, 2010).
12.J.Engle,J.Yeado,R.Brusi,andJ.Cruz.,“ReplenishingOpportunityinAmerica:The2012MidtermReportofPublicHigherEducationSystems in the Access to Success Initiative” (Washington, D.C.: The Education Trust, 2012). “Building a Corridor to Graduation: San Diego State University: Replenishing Opportunity in America Case Study” (Washington, D.C.: The Education Trust). “Walking the Walk on Student Retention.” Washington, D.C.: The Education Trust, http://www.edtrust.org/dc/press-room/news/walking-the-walk-on-student-retention.
13.J.Engleetal.,“ReplenishingOpportunityinAmerica:The2012MidtermReportofPublicHigherEducationSystemsintheAccesstoSuc-cess Initiative.”
14. The gap-closer sample includes four-year, nonprofit, degree-granting institutions — public and private — receiving Title IV funds with com-plete graduation-rate data in both study years (2004 and 2010) and a cohort of at least 30 Hispanic and 30 white undergraduate students in both study years, the minimum number of cases required by accepted statistical standards. The gap-closer sample contains 348 schools.
15. M. Lynch and J. Engle, “Big Gaps, Small Gaps: Some Colleges and Universities Do Better than Others in Graduating Hispanic Students.”
16. Top gap-closer institutions have a cohort of at least 30 Hispanic and 30 white undergraduate students in both study years, 2004 and 2010, the minimum number of cases required by accepted statistical standards. To account for the fact that some colleges might have improved their graduation-rate performance by becoming more selective in their admissions, rather than improving academically, we chose to elimi-nate any college that grew more exclusive by serving significantly fewer Hispanic students among incoming freshmen, a relative decline of 20 percent or more, in the study years (incoming 1998 and 2004). We also exclude any institution where graduation rates among white students declined by more than 1 percentage point from 2004 to 2010. The revised sample fell from 348 institutions to 282 institutions.
17. M. Lynch and J. Engle, “Big Gaps, Small Gaps: Some Colleges and Universities Do Better Than Others in Graduating Hispanic Students.”
18.PBSNewsHourSpecial.“ProgramAimstoIncreaseNumberofMinorityCollegeGraduates,”http://www.pbs.org/newshour/bb/education/july-dec10/minorities_09-28.html.
19. Stony Brook graduation-rate analysis conducted by Stony Brook’s Office of Institutional Research.
20.StonyBrook,StateUniversityofNewYork.“STEMSmart:PromotingInclusivityandExcellenceinSTEM.”
21.CenterforScientificTeachingatYaleUniversity,http://cst.yale.edu/.WisconsinProgramforScientificThinking,http://biology.wisc.edu/UniversityEducators-ProgramsandOpportunities-WPST.htm.
22.TexasHigherEducationCoordinatingBoard.“HistoryofthePlan:ClosingtheGapsHigherEducationPlan,”http://www.thecb.state.tx.us

1250 H STREET N.W., SUITE 700 WASHINGTON, D.C. 20005 T 202/293-1217 F 202/293-2605 WWW.EDTRUST.ORG
The Education Trust promotes high academic achievement for all students at all levels—pre-kindergarten through college. We work alongside parents, educators, and community and business leaders across the country in transforming schools and colleges into institutions that serve all students well. Lessons learned in these efforts, together with unflinching data analyses, shape our state and national policy agendas. Our goal is to close the gaps in opportunity and achievement that consign far too many young people—especially those who are black, Latino, American Indian, or from low-income families—to lives on the margins of the American mainstream.
The Education Trust is grateful to Lumina Foundation for generously supporting our work. The views expressed in this publication are those of the authors and do not necessarily represent those of the foundation, its officers, or employees.