dual band versatility - metageek
TRANSCRIPT
Technical Specifications
RequirementsOS
Mac OSX VirtualizationFrameworkResolution
RAMProcessor
Wireless Card
Windows 7, Vista or XP (SP3)VMware Fusion, ParallelsMicrosoft .Net 3.51024 x 768 (or greater)1 GB (Rec. minimum)1 GHz (Rec. minimum)Windows Zero Configuration (WZC)
Maximum Zoom:Capture Limit:
Frequency Range:Amplitude Range:
Amplitude Resolution:Resolution Bandwidth:
2.4 GHz band5 GHz band
Sweep Time*:(2.4 GHz) band(Lower 5 GHz)
(Mid 5 GHz)(Upper 5 GHz)
1.0 MHzDependant on hard disk space2.400 to 2.495 GHz, 5.150 to 5.850 GHz-100 dBm to -6.5 dBm0.5 dBm
58.036 to 812.500 KHz53.571 to 750.000 KHz
507 msec (default)
1242 msec (default)
1587 msec (default)
641 msec (default)
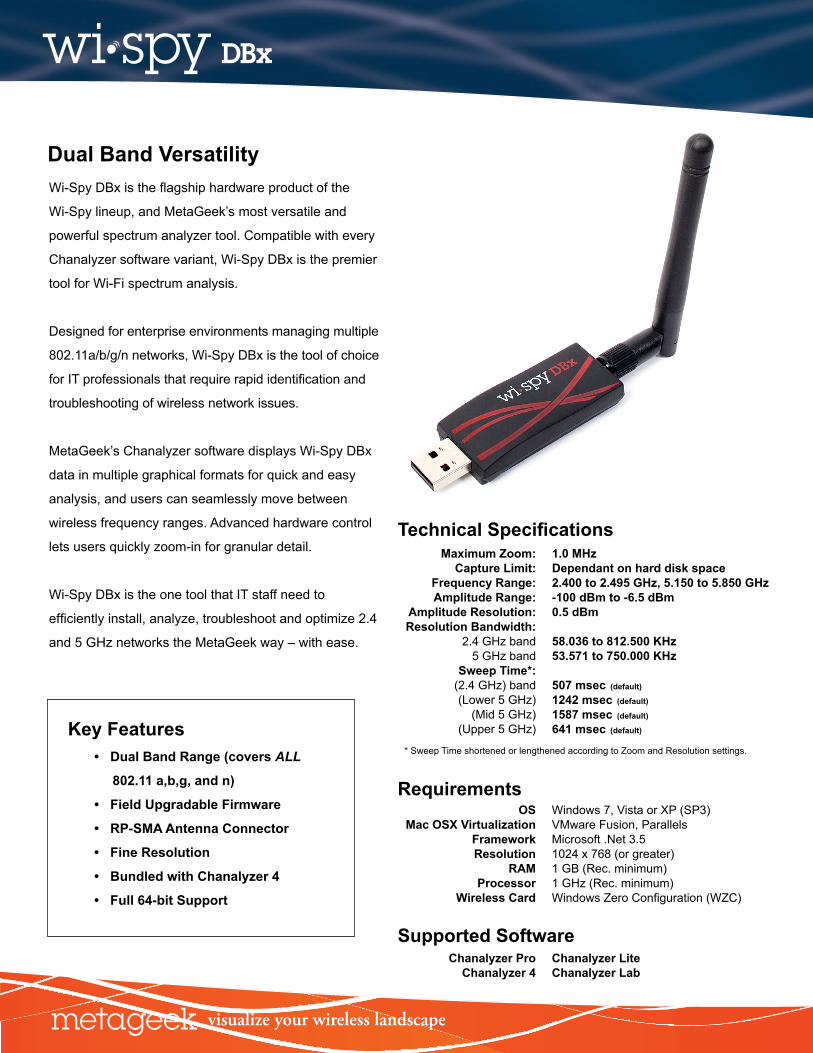
Wi-Spy DBx is the flagship hardware product of the
Wi-Spy lineup, and MetaGeek’s most versatile and
powerful spectrum analyzer tool. Compatible with every
Chanalyzer software variant, Wi-Spy DBx is the premier
tool for Wi-Fi spectrum analysis.
Designed for enterprise environments managing multiple
802.11a/b/g/n networks, Wi-Spy DBx is the tool of choice
for IT professionals that require rapid identification and
troubleshooting of wireless network issues.
MetaGeek’s Chanalyzer software displays Wi-Spy DBx
data in multiple graphical formats for quick and easy
analysis, and users can seamlessly move between
wireless frequency ranges. Advanced hardware control
lets users quickly zoom-in for granular detail.
Wi-Spy DBx is the one tool that IT staff need to
efficiently install, analyze, troubleshoot and optimize 2.4
and 5 GHz networks the MetaGeek way – with ease.
Key Features• Dual Band Range (covers ALL
802.11 a,b,g, and n)
• Field Upgradable Firmware
• RP-SMA Antenna Connector
• Fine Resolution
• Bundled with Chanalyzer 4
• Full 64-bit Support
Dual Band Versatility
Supported SoftwareChanalyzer Pro
Chanalyzer 4Chanalyzer LiteChanalyzer Lab
* Sweep Time shortened or lengthened according to Zoom and Resolution settings.

MetaGeek, Wi-Spy, Chanalyzer, and “Visualize Your Wireless Landscape” are registered trademarks of MetaGeek, LLC.
Density ViewDensity View displays raw spectrum data by frequency and amplitude point over a user-defined timeframe. The brighter the color, the more RF activity present. Density View is great for catching transmitters over time, and for finding interference trends.
Waterfall ViewThe Waterfall View displays RF activity over a defined timeframe in a rolling “waterfall.” The brighter, or more red the color, the noisier the frequency. The Waterfall View shows when interference occurred and it’s duration.
Planar ViewThe Planar View graphically displays the maximum, average and current RF activity on a Density graph. The Planar View is a staple of traditional spectrum analyzers, and is included in Chanalyzer Pro with user-defined colors for complete customization.
Wi-Fi Channels TableThe Wi-Fi Channels Table plots average, current and maximum values, as well as the Noise Floor reading and number of placed Access Points to calculate a “grade” for each Wi-Fi or ZigBee channel.
Wi-Fi OverlaysUsing the wireless NIC in the computer, Chanalyzer Pro collects Wi-Fi data such as SSID, RSSI and channel of networks in the area. Data is overlaid on a Density View to provide a correlation between known Wi-Fi sources and everything else (non-Wi-Fi) transmitting in the band.
MetaGeek, Wi-Spy, Chanalyzer, and “Visualize Your Wireless Landscape” are registered trademarks of MetaGeek, LLC.
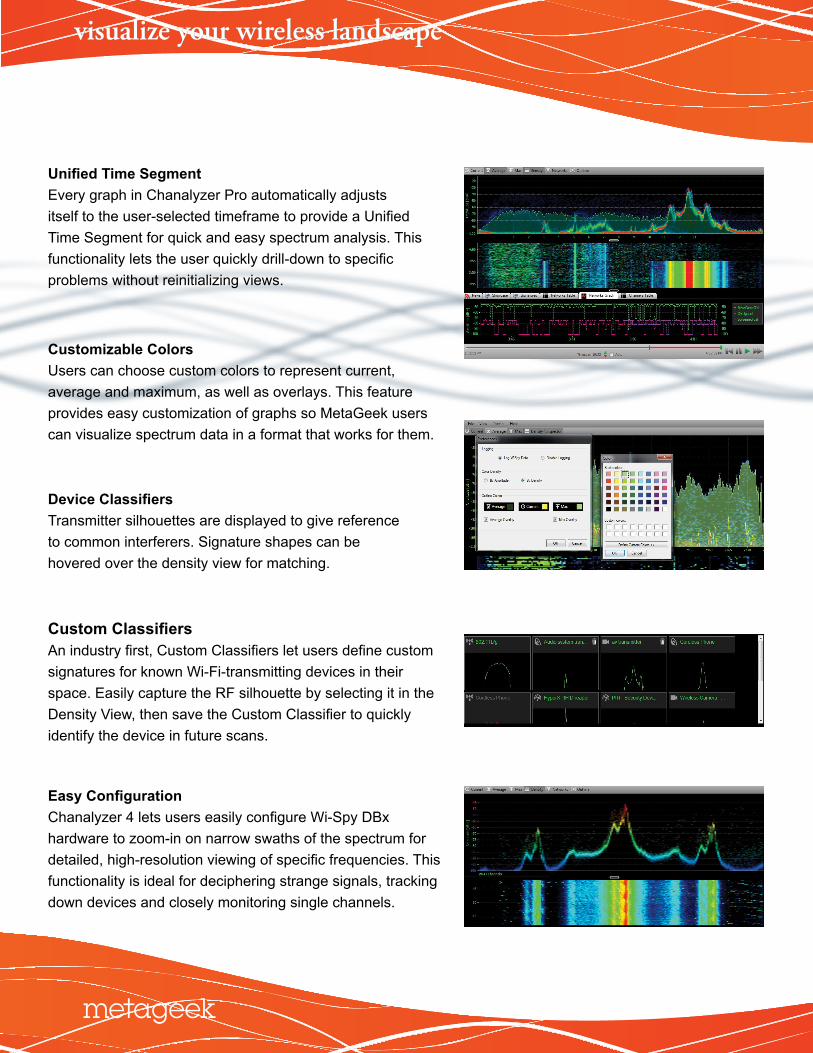
Unified Time SegmentEvery graph in Chanalyzer Pro automatically adjusts itself to the user-selected timeframe to provide a Unified Time Segment for quick and easy spectrum analysis. This functionality lets the user quickly drill-down to specific problems without reinitializing views.
Customizable ColorsUsers can choose custom colors to represent current, average and maximum, as well as overlays. This feature provides easy customization of graphs so MetaGeek users can visualize spectrum data in a format that works for them.
Device ClassifiersTransmitter silhouettes are displayed to give reference to common interferers. Signature shapes can be hovered over the density view for matching.
Easy ConfigurationChanalyzer 4 lets users easily configure Wi-Spy DBx hardware to zoom-in on narrow swaths of the spectrum for detailed, high-resolution viewing of specific frequencies. This functionality is ideal for deciphering strange signals, tracking down devices and closely monitoring single channels.
Custom ClassifiersAn industry first, Custom Classifiers let users define custom signatures for known Wi-Fi-transmitting devices in their space. Easily capture the RF silhouette by selecting it in the Density View, then save the Custom Classifier to quickly identify the device in future scans.