dual-comb spectroscopy in the spectral fingerprint region ... · dual-comb spectroscopy in the...
TRANSCRIPT

Dual-comb spectroscopy in the spectral fingerprint region using OPGaP optical parametric oscillators
OGUZHAN KARA,1 LUKE MAIDMENT,1 TOM GARDINER,2 PETER G. SCHUNEMANN,3 AND DERRYCK T. REID
1,* 1Scottish Universities Physics Alliance (SUPA), Institute of Photonics and Quantum Sciences, School of Engineering and Physical Sciences, Heriot-Watt University, Edinburgh EH14 4AS, UK 2National Physical Laboratory, Hampton Road, Teddington, London TW11 0LW, UK 3BAE Systems, Inc., MER15-1813, P.O. Box 868, Nashua, NH, USA *[email protected]
Abstract: The new material orientation patterned gallium phosphide (OPGaP) enables coherent and broadband infrared spectroscopy in the spectral fingerprint region from 6 to 12 µm, accessing the largest molecular absorption cross-sections and permitting sensitive, quantitative and species-specific measurements. Here, we show how dual-comb spectroscopy—a form of high-speed Fourier-transform spectroscopy involving no moving parts and capable of very high resolutions—can be extended to the 6–8 µm wavelength band using femtosecond optical parametric oscillators (OPOs). By acquiring dual-comb interferograms in a time comparable with the mutual decoherence time of the OPO combs we implement cross-correlation-based spectral averaging to obtain high-fidelity spectra of H2O and CH4 at approximately 0.3 cm−1 resolutions from 1285 to 1370 cm−1 and 1500–1585 cm−1. Published by The Optical Society under the terms of the Creative Commons Attribution 4.0 License. Further distribution of this work must maintain attribution to the author(s) and the published article’s title, journal citation, and DOI.
OCIS codes: (300.6300) Spectroscopy, Fourier transforms; (300.6390) Spectroscopy, molecular; (120.6200) Spectrometers and spectroscopic instrumentation; (190.4970) Parametric oscillators and amplifiers.
References and links
1. F. Keilmann, C. Gohle, and R. Holzwarth, “Time-domain mid-infrared frequency-comb spectrometer,” Opt. Lett. 29(13), 1542–1544 (2004).
2. I. Coddington, N. R. Newbury, and W. C. Swann, “Dual-comb spectroscopy,” Optica 3(4), 414–426 (2016).3. G. B. Rieker, F. R. Giorgetta, W. C. Swann, J. Kofler, A. M. Zolot, L. C. Sinclair, E. Baumann, C. Cromer, G.
Petron, C. Sweeney, P. P. Tans, I. Coddington, and N. R. Newbury, “Frequency-comb-based remote sensing ofgreenhouse gases over kilometer air paths,” Optica 1(5), 290–298 (2014).
4. I. Coddington, W. C. Swann, and N. R. Newbury, “Coherent Multiheterodyne Spectroscopy Using Stabilized Optical Frequency Combs,” Phys. Rev. Lett. 100(1), 013902 (2008).
5. I. Coddington, W. C. Swann, and N. R. Newbury, “Coherent dual-comb spectroscopy at high signal-to-noise ratio,” Phys. Rev. A 82(4), 043817 (2010).
6. I. Coddington, W. C. Swann, and N. R. Newbury, “Time-domain spectroscopy of molecular free-inductiondecay in the infrared,” Opt. Lett. 35(9), 1395–1397 (2010).
7. L. C. Sinclair, I. Coddington, W. C. Swann, G. B. Rieker, A. Hati, K. Iwakuni, and N. R. Newbury, “Operationof an optically coherent frequency comb outside the metrology lab,” Opt. Express 22(6), 6996–7006 (2014).
8. J. Lee, K. Lee, Y.-S. Jang, H. Jang, S. Han, S.-H. Lee, K.-I. Kang, C.-W. Lim, Y.-J. Kim, and S.-W. Kim,“Testing of a femtosecond pulse laser in outer space,” Sci. Rep. 4(1), 5134 (2014).
9. L. C. Sinclair, J.-D. Deschênes, L. Sonderhouse, W. C. Swann, I. H. Khader, E. Baumann, N. R. Newbury, and I. Coddington, “Invited Article: A compact optically coherent fiber frequency comb,” Rev. Sci. Instrum. 86(8), 081301 (2015).
10. A. Schliesser, M. Brehm, F. Keilmann, and D. van der Weide, “Frequency-comb infrared spectrometer for rapid, remote chemical sensing,” Opt. Express 13(22), 9029–9038 (2005).
11. E. Baumann, F. R. Giorgetta, W. C. Swann, A. M. Zolot, I. Coddington, and N. R. Newbury, “Spectroscopy of the methane ν3 band with an accurate midinfrared coherent dual-comb spectrometer,” Phys. Rev. A 84(6),062513 (2011).
Vol. 25, No. 26 | 25 Dec 2017 | OPTICS EXPRESS 32713
#308460 https://doi.org/10.1364/OE.25.032713 Journal © 2017 Received 13 Oct 2017; revised 27 Nov 2017; accepted 4 Dec 2017; published 15 Dec 2017
12. F. C. Cruz, D. L. Maser, T. Johnson, G. Ycas, A. Klose, F. R. Giorgetta, I. Coddington, and S. A. Diddams, “Mid-infrared optical frequency combs based on difference frequency generation for molecular spectroscopy,” Opt. Express 23(20), 26814–26824 (2015).
13. F. Zhu, A. Bicer, R. Askar, J. Bounds, A. A. Kolomenskii, V. Kelessides, M. Amani, and H. A. Schuessler, “Mid-infrared dual frequency comb spectroscopy based on fiber lasers for the detection of methane in ambient air,” Laser Phys. Lett. 12(9), 095701 (2015).
14. Y. Wang, M. G. Soskind, W. Wang, and G. Wysocki, “High-resolution multi-heterodyne spectroscopy based on Fabry-Perot quantum cascade lasers,” Appl. Phys. Lett. 104(3), 031114 (2014).
15. G. Villares, J. Wolf, D. Kazakov, M. J. Süess, A. Hugi, M. Beck, and J. Faist, “On-chip dual-comb based on quantum cascade laser frequency combs,” Appl. Phys. Lett. 107(25), 251104 (2015).
16. G. Villares, A. Hugi, S. Blaser, and J. Faist, “Dual-comb spectroscopy based on quantum-cascade-laser frequency combs,” Nat. Commun. 5, 5192 (2014).
17. M. Yu, Y. Okawachi, A. G. Griffith, N. Picqué, M. Lipson, and A. L. Gaeta, “Silicon-chip-based mid-infrared dual-comb spectroscopy,” arXiv:1610.01121.
18. Z. Zhang, C. Gu, J. Sun, C. Wang, T. Gardiner, and D. T. Reid, “Asynchronous midinfrared ultrafast optical parametric oscillator for dual-comb spectroscopy,” Opt. Lett. 37(2), 187–189 (2012).
19. Z. Zhang, T. Gardiner, and D. T. Reid, “Mid-infrared dual-comb spectroscopy with an optical parametric oscillator,” Opt. Lett. 38(16), 3148–3150 (2013).
20. Y. Jin, S. M. Cristescu, F. J. M. Harren, and J. Mandon, “Two-crystal mid-infrared optical parametric oscillator for absorption and dispersion dual-comb spectroscopy,” Opt. Lett. 39(11), 3270–3273 (2014).
21. Y. Jin, S. M. Cristescu, F. J. M. Harren, and J. Mandon, “Femtosecond optical parametric oscillators toward real-time dual-comb spectroscopy,” Appl. Phys. B 119(1), 65–74 (2015).
22. V. O. Smolski, H. Yang, J. Xu, and K. L. Vodopyanov, Massively parallel dual-comb molecular detection with subharmonic optical parametric oscillators,” arXiv:1608.07318.
23. T. Ideguchi, S. Holzner, B. Bernhardt, G. Guelachvili, N. Picqué, and T. W. Hänsch, “Coherent Raman spectro-imaging with laser frequency combs,” Nature 502(7471), 355–358 (2013).
24. K. J. Mohler, B. J. Bohn, M. Yan, G. Mélen, T. W. Hänsch, and N. Picqué, “Dual-comb coherent Raman spectroscopy with lasers of 1-GHz pulse repetition frequency,” Opt. Lett. 42(2), 318–321 (2017).
25. T. Ideguchi, B. Bernhardt, G. Guelachvili, T. W. Hänsch, and N. Picqué, “Raman-induced Kerr-effect dual-comb spectroscopy,” Opt. Lett. 37(21), 4498–4500 (2012).
26. A. Hangauer, J. Westberg, E. Zhang, and G. Wysocki, “Wavelength modulated multiheterodyne spectroscopy using Fabry-Pérot quantum cascade lasers,” Opt. Express 24(22), 25298–25307 (2016).
27. L. A. Sterczewski, J. Westberg, and G. Wysocki, “Molecular dispersion spectroscopy based on Fabry-Perot quantum cascade lasers,” Opt. Lett. 42(2), 243–246 (2017).
28. J. Westberg, L. A. Sterczewski, and G. Wysocki, “Mid-infrared multiheterodyne spectroscopy with phase-locked quantum cascade lasers,” Appl. Phys. Lett. 110(14), 141108 (2017).
29. L. Maidment, P. G. Schunemann, and D. T. Reid, “Molecular fingerprint-region spectroscopy from 5 to 12 μm using an orientation-patterned gallium phosphide optical parametric oscillator,” Opt. Lett. 41(18), 4261–4264 (2016).
30. C. H. Knapp and G. C. Carter, “The generalized correlation method for estimation of time delay,” IEEE Trans. Acoust. Speech Signal Process. 24(4), 320–327 (1976).
31. O. Kara, Z. Zhang, T. Gardiner, and D. T. Reid, “Dual-comb mid-infrared spectroscopy with free-running oscillators and absolute optical calibration from a radio-frequency reference,” Opt. Express 25(14), 16072–16082 (2017).
32. L. S. Rothman, I. E. Gordon, Y. Babikov, A. Barbe, D. Chris Benner, P. F. Bernath, M. Birk, L. Bizzocchi, V. Boudon, L. R. Brown, A. Campargue, K. Chance, E. A. Cohen, L. H. Coudert, V. M. Devi, B. J. Drouin, A. Fayt, J.-M. Flaud, R. R. Gamache, J. J. Harrison, J.-M. Hartmann, C. Hill, J. T. Hodges, D. Jacquemart, A. Jolly, J. Lamouroux, R. J. Le Roy, G. Li, D. A. Long, O. M. Lyulin, C. J. Mackie, S. T. Massie, S. Mikhailenko, H. S. P. Müller, O. V. Naumenko, A. V. Nikitin, J. Orphal, V. Perevalov, A. Perrin, E. R. Polovtseva, C. Richard, M. A. H. Smith, E. Starikova, K. Sung, S. Tashkun, J. Tennyson, G. C. Toon, V. G. Tyuterev, and G. Wagner, “The HITRAN2012 molecular spectroscopic database,” J. Quant. Spectrosc. Radiat. Transf. 130, 4–50 (2013).
33. K. Balskus, S. Schilt, V. J. Wittwer, P. Brochard, T. Ploetzing, N. Jornod, R. A. McCracken, Z. Zhang, A. Bartels, D. T. Reid, and T. Südmeyer, “Frequency comb metrology with an optical parametric oscillator,” Opt. Express 24(8), 8370–8381 (2016).
34. D. Burghoff, Y. Yang, and Q. Hu, “Computational multiheterodyne spectroscopy,” Sci. Adv. 2(11), e1601227 (2016).
35. M. Cassinerio, A. Gambetta, N. Coluccelli, P. Laporta, and G. Galzerano, “ Absolute dual-comb spectroscopy at 1.55 μm by free-running Er:fiber lasers, ” Appl. Phys. Lett. 104(23), 231102 (2014).
36. T. Ideguchi, A. Poisson, G. Guelachvili, N. Picqué, and T. W. Hänsch, “Adaptive real-time dual-comb spectroscopy,” Nat. Commun. 5, 3375 (2014).
37. Z. Chen, M. Yan, T. W. Hänsch, and N. Picqué, A phase-stable dual-comb interferometer,” arXiv:1705.04214. 38. J. H. Sun, B. J. S. Gale, and D. T. Reid, “Composite frequency comb spanning 0.4-2.4 μm from a phase-
controlled femtosecond Ti:sapphire laser and synchronously pumped optical parametric oscillator,” Opt. Lett. 32(11), 1414–1416 (2007).
Vol. 25, No. 26 | 25 Dec 2017 | OPTICS EXPRESS 32714

39. C. R. Petersen, U. Møller, I. Kubat, B. Zhou, S. Dupont, J. Ramsay, T. Benson, S. Sujecki, N. Abdel-Moneim, Z. Tang, D. Furniss, A. Seddon, and O. Bang, “Mid-IR supercontinuum covering the molecular fingerprint region from 2 μm to 13 μm using ultra-high NA chalcogenide step-index fibre,” Nat. Photonics 8, 830–834 (2014).
40. I. Marziano, D. C. A. Sharp, P. J. Dunn, and P. A. Hailey, “On-Line Mid-IR Spectroscopy as a Real-Time Approach in Monitoring Hydrogenation Reactions,” Org. Process Res. Dev. 4(5), 357–361 (2000).
41. M. Brehm, A. Schliesser, and F. Keilmann, “Spectroscopic near-field microscopy using frequency combs in the mid-infrared,” Opt. Express 14(23), 11222–11233 (2006).
42. F. Huth, A. Govyadinov, S. Amarie, W. Nuansing, F. Keilmann, and R. Hillenbrand, “Nano-FTIR Absorption Spectroscopy of Molecular Fingerprints at 20 nm Spatial Resolution,” Nano Lett. 12(8), 3973–3978 (2012).
1. Introduction
For several decades, Fourier-transform spectroscopy (FTS) has been regarded as a gold-standard analytic technique, with laboratory spectrometers incorporating broadband thermal sources covering the infrared region, in which different molecules and even molecular isomers can be distinguished by their unique spectral absorption features. Dual-comb spectroscopy (DCS) [1, 2] is a laser-based analog to FTS, permitting rapid, high-resolution measurements in a system containing no moving parts. Implementations of DCS in the near-infrared have exploited the excellent spatial coherence of laser illumination to perform spectroscopy over kilometer paths, enabling the sensitive detection of trace gases and pollutants [3]. To date, most DCS systems have been reported in the near-infrared (near-IR) [4–6] because of the maturity of frequency-comb sources in this region [7–9]. The extension of DCS to the mid-IR has been achieved using difference-frequency generation (DFG) sources [10–13], quantum cascade lasers [14–16], micro-resonators [17], singly-resonant optical parametric oscillators (OPOs) [18–21] and doubly-resonant OPOs [22]. Dual-comb Raman techniques can access spectroscopy in the fingerprint band but have been limited in resolution to 4–6.7 cm−1 [23–25] more than an order of magnitude poorer than the resolution we present here by direct absorption infrared spectroscopy. DCS in the mid-IR fingerprint region has been limited to an early demonstration using a µW-level DFG source, which achieved 2-cm−1 resolutions from 9 to 12 µm [10], and with a quantum-cascade laser comb, whose wide mode spacing required a multi-hour sweep of the comb-line positions in order to resolve molecular line-shapes over a 15-cm−1 range near 1420 cm−1 [16]. Indeed, quantum-cascade lasers are currently the only means of achieving moderately broadband high-resolution spectroscopy above 6 µm, with the technique of multi-heterodyne spectroscopy showing potential for coverage of tens of cm−1 [26] but with actual reported absorption spectroscopy only spanning < 1 cm−1 near 1190 cm−1 at sub-cm−1 resolution [26,27] and 25-cm−1 coverage at 1.3-cm−1 sampling resolution [28]. Broadband multi-heterodyne spectroscopy also suffers from discontinuities in its spectral coverage, which arise from regions of the spectrum where the multi-heterodyne signal is weak, because FM modulation redistributes the power unevenly among the laser modes. Furthermore, properly resolving narrow line shapes requires scanning of the comb modes, which is time consuming and sacrifices the temporal resolution of the technique. These limitations can be circumvented by using new semiconductor nonlinear crystals to extend the wavelength coverage of near-IR femtosecond lasers to a region spanning from 6 to 12 µm [29]. This wavelength range is commonly known as the molecular 'fingerprint' region, where a wide range of organic compounds can be discriminated through the complex set of absorption features they exhibit due to molecular bending transitions. Here we introduce a dual-comb source for the spectral fingerprint region based on a pair of entirely free-running OPOs, each pumped by a 1-µm femtosecond laser and utilizing the new gain medium orientation-patterned gallium phosphide (OPGaP) to produce broadband idler pulses tunable from 6 to 8 µm.
Dual-comb spectroscopy using OPOs has been demonstrated in the 3- to 4-µm region using 1-µm-pumped MgO:PPLN singly-resonant OPOs [19–21], and up to 5.3 µm using 1.93-µm-pumped OPGaAs degenerate doubly-resonant OPOs [22]. Obtaining high quality spectroscopy has typically required fully-locked combs [11], which provide superior
Vol. 25, No. 26 | 25 Dec 2017 | OPTICS EXPRESS 32715

performance to free-running systems, in which the carrier frequency of the DCS interferogram shifts as the comb offsets fluctuate (for example [10]). The results we present here demonstrate that such fluctuations need not present a barrier to high-fidelity dual-comb spectroscopy with OPOs, so long as each interferogram is recorded on a timescale comparable with the characteristic decoherence time between the OPOs, i.e. the time in which their comb-mode frequencies change significantly. Our DCS system operates with free-running 102-MHz modelocked OPOs, whose difference in pulse repetition frequencies (ΔfREP) exceeds 1 kHz, implying that high resolution spectroscopy can be obtained from interferograms acquired in a few tens of microseconds.
2. OPGaP dual-comb spectrometer
Fig. 1. Dual-comb spectroscopy using OPGaP optical parametric oscillators. (a) Femtosecond pulses from two amplified Yb:fiber lasers of nearly identical repetition rates are used to synchronously pump two OPGaP OPOs. Idler pulses in the 6–8-µm range are output coupled from each OPO after reflection from a silver cavity mirror and transmission through a dielectric mirror on a ZnSe substrate. Idler pulses from each OPO are combined on a CaF2 beamsplitter before detection by high speed HgCdTe detectors, one of which is preceded by a 20-cm CH4 gas cell. (b) Example DCS data set, comprising >100 interferograms acquired at ~1.1 kHz over 100 ms. The apparent intensity fluctuations are due to the different carrier-envelope phases of each interferogram. (c) DCS spectrum obtained from a single interferogram (d).
The DCS system [Fig. 1(a)] comprises two entirely free-running OPGaP OPOs which follow a design similar to that reported in [29]. Each OPO is pumped by a femtosecond Yb:fiber laser whose pulse repetition frequency (nominally 102.0 MHz) can be adjusted using an intracavity piezoelectric actuator. Before entering the OPO, the pulses from each pump laser are amplified and then compressed to durations close to their bandwidth-limited values of 150 fs. The OPGaP OPOs are operated on grating periods of 24.5 µm to obtain signal (idler) wavelengths centered around 1.25 µm (6.5 µm) and 27 µm for signal (idler) wavelengths centered near 1.22 µm (7.5 µm). The instantaneous bandwidth of the idler pulses in each case is approximately 500 nm. The idler pulses are extracted from each OPO using a silver intracavity curved mirror situated immediately after each OPGaP crystal [Fig. 1(b)] and an idler-transmitting / signal-reflecting coating on a plane ZnSe intracavity mirror. This
Vol. 25, No. 26 | 25 Dec 2017 | OPTICS EXPRESS 32716

arrangement yields well collimated idler beams which are combined at a CaF2 beamsplitter whose coating is approximately 50% reflecting from 2 to 8 µm.
Spectroscopy is implemented in a homodyne configuration, in which mW-average-power pulses from both combs interact with the spectroscopic sample. Each interferogram is recorded, Fourier transformed and provided with a relative optical frequency calibration obtained from concurrent measurements of ΔfREP and fREP. Dual-comb interferograms [Fig. 1(b)] are measured from both channels of the beamsplitter using LN2-cooled HgCdTe detectors with a bandwidth of 50 MHz (Kolmar KMPV11-0.25-J1). Up to 120 interferograms (with this number limited by the buffer size of the acquisition unit) are recorded in a single acquisition, following which each interferogram is automatically centered [Fig. 1(d)] and Fourier-transformed to yield its radio-frequency spectrum [Fig. 1(c)]. Sample-gas spectroscopy, in this case methane, is conducted by inserting a 20-cm gas cell before one of the detectors, while background spectroscopy, in this case water vapor, is carried out with the other detector. Both interferograms are digitized at 200 MHz and acquired on two channels of a 14-bit-resolution USB oscilloscope. A third channel records a signal at 10ΔfREP, which is obtained by isolating the tenth harmonic of each pump laser's repetition frequency (RF) using a narrowband 1-GHz bandpass filter, then differencing the two repetition-frequency harmonics using a RF mixer followed by a low-pass filter. A zero-crossings algorithm extracts ΔfREP for each interferogram, after which the corresponding RF spectrum is scaled to the optical domain by multiplying its frequency sampling interval by a factor of fREP / ΔfREP . Finally, each spectrum obtained in this way is recorded as one row in a matrix, in preparation for subsequent spectral co-alignment and averaging with other spectra.
Fluctuations in fCEO for each of the two combs occur on millisecond timescales (the mutual decoherence times of the combs), resulting in small variations in the RF carrier frequency of each dual-comb interferogram. So long as each interferogram is recorded in a time much faster than this decoherence time then the spectral information remains intact but is simply shifted to an alternative center frequency. Spectral averaging can therefore be performed to improve the signal:noise ratio of the data, but before this can be done, each spectrum must be accurately co-aligned with every other spectrum. We implement this using a full-spectrum cross-correlation technique operating as follows. Consider N similar spectra, each of which is centered at a different position in the sampling grid. We calculate the relative shift, νΔ , between any pair of spectra, ( )iI ν and ( )jI ν (i, j ≤ N), by finding the location of
the maximum of their cross-correlation [30,31]:
( ){ }arg max
Δ * ( ) .i jI I
νν ν ν= − (1)
These shifts, including self-comparisons (i = j), are stored in an N × N matrix, illustrated for a representative 114-sample data set in Fig. 2(a). As an example, two typical spectra are shown in Fig. 2(b). The shift of each spectrum relative to the average position is computed by summing its mutual shifts and normalizing the result by N. We co-align all the spectra to the member of the set which has the lowest deviation from the average position and perform an average. The result of co-aligning just two such spectra is shown in Fig. 2(c), illustrating the precision available from this technique. Finally, the average spectrum is shifted so its center coincides with the exact average position for the entire data set. Processing the spectra in this way is computationally efficient and took a few seconds for the entire data set, although no attempt was made to optimize the process for speed. In all cases, a square apodization window is applied to each interferogram before calculating its spectrum. Using simple numerical simulations it can be shown that, while still an effective noise reduction strategy, spectral averaging does not achieve the same long-term √N reduction in rms noise as coherent averaging. This can be attributed to neglecting the phase of the interferogram spectrum, which leads to the accumulation of small errors.
Vol. 25, No. 26 | 25 Dec 2017 | OPTICS EXPRESS 32717

Fig. 2. Cross-correlation protocol for co-aligning multiple DCS spectra. (a) Each member of a data set of >100 spectra is cross-correlated with every other member to obtain a shift, expressed as a number of pixels and which can be visualized as an N × N matrix, where N is the original number of DCS spectra. These shifts can be used to automatically co-align the entire data set, with (b) and (c) illustrating, respectively, an example of two such spectra before and after co-alignment.
3. Spectroscopy of ambient water vapor
Operating on a grating period of 27 µm, the OPOs produce pulses with spectra spanning 1280–1370 cm−1 and which travel 2.5 m in air from the OPGaP crystals to the detector. Water vapor absorption is relatively weak in this region but can still be clearly seen in the spectrum shown in Fig. 3(a). Envelope removal and fitting to the HITRAN 2012 database [32] yields the transmission spectrum in Fig. 3(b). The regular modulations evident in the residuals of the trace (Fig. 3(c), blue) are étalon effects which can be directly traced to parasitic reflections in the OPGaP crystals, a Ge filter and the ZnSe idler output couplers in the OPO cavities.
The transmission spectrum was corrected by removing étalon effects, which are difficult to avoid over wide bandwidths in the long-wave infrared because of residual reflectivity on high-index coated components like the OPGaP crystal itself. Fourier-transforming the residual revealed four distinct and narrow étalon frequencies which were readily removed by a simple filtering operation. Doing so resulted in excellent agreement with HITRAN at 0.256-cm−1 resolution, with features and line-shapes becoming clearly resolved [Fig. 3(d)]. The remaining residual (Fig. 3(c), green) shows a standard deviation of 1.3%, implying a noise-equivalent absorption of 0.0041 Hz-1/2. The fit to HITRAN allows quantitative determination of the water vapor concentration, yielding a mole-fraction concentration of 0.54%, consistent with our lab conditions.
With a grating period of 24.5 µm the OPO produces shorter idler wavelengths spanning the 1490–1590-cm−1 region. Performing an identical analysis leads to the results in Fig. 3(e) which again show excellent agreement with the HITRAN simulation in this region [Fig. 3(f, h)]. The impact of étalons is much less severe in this band because of the better performance of the IR anti-reflection coatings on our optics at these wavelengths. The fitting resolution in this case is 0.298 cm−1 and the mole-fraction water-vapor concentration was determined as 0.77%. The difference in ambient water-vapor concentration compared to the earlier result is not unexpected, since the lab humidity varies with time and with local atmospheric conditions. After étalon-fringe removal the residual (Fig. 3(g), green) shows a standard deviation of 2.4%, giving a noise-equivalent absorption of 0.0076 Hz-1/2.
Vol. 25, No. 26 | 25 Dec 2017 | OPTICS EXPRESS 32718
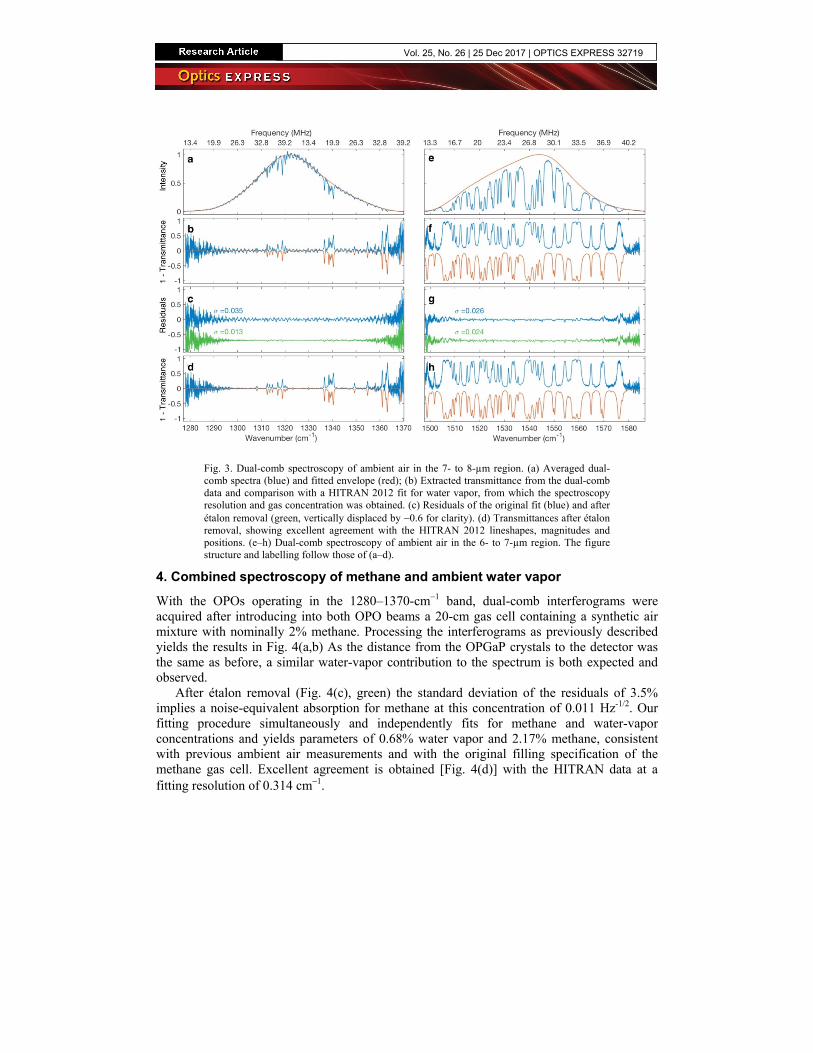
Fig. 3. Dual-comb spectroscopy of ambient air in the 7- to 8-µm region. (a) Averaged dual-comb spectra (blue) and fitted envelope (red); (b) Extracted transmittance from the dual-comb data and comparison with a HITRAN 2012 fit for water vapor, from which the spectroscopy resolution and gas concentration was obtained. (c) Residuals of the original fit (blue) and after étalon removal (green, vertically displaced by −0.6 for clarity). (d) Transmittances after étalon removal, showing excellent agreement with the HITRAN 2012 lineshapes, magnitudes and positions. (e–h) Dual-comb spectroscopy of ambient air in the 6- to 7-µm region. The figure structure and labelling follow those of (a–d).
4. Combined spectroscopy of methane and ambient water vapor
With the OPOs operating in the 1280–1370-cm−1 band, dual-comb interferograms were acquired after introducing into both OPO beams a 20-cm gas cell containing a synthetic air mixture with nominally 2% methane. Processing the interferograms as previously described yields the results in Fig. 4(a,b) As the distance from the OPGaP crystals to the detector was the same as before, a similar water-vapor contribution to the spectrum is both expected and observed.
After étalon removal (Fig. 4(c), green) the standard deviation of the residuals of 3.5% implies a noise-equivalent absorption for methane at this concentration of 0.011 Hz-1/2. Our fitting procedure simultaneously and independently fits for methane and water-vapor concentrations and yields parameters of 0.68% water vapor and 2.17% methane, consistent with previous ambient air measurements and with the original filling specification of the methane gas cell. Excellent agreement is obtained [Fig. 4(d)] with the HITRAN data at a fitting resolution of 0.314 cm−1.
Vol. 25, No. 26 | 25 Dec 2017 | OPTICS EXPRESS 32719

Fig. 4. Dual-comb spectroscopy of a 20-cm methane cell in ambient air in the 7- to 8-µm region. The figure structure and labelling follow those given in Fig. 3, with the exception that the fitting procedure treated the water vapor and methane gas concentrations as independent variables.
5. Discussion
The results reported here are the first examples of combined broadband and high-resolution spectroscopy in the spectral fingerprint region from 6 to 8 µm using dual optical parametric oscillators. They also represent among the highest quality dual-comb data obtained in the mid-IR using unreferenced free-running femtosecond lasers, demonstrated by the excellent agreement between the HITRAN 2012 database and the positions, relative magnitudes and shapes of the experimentally measured absorption lines. This performance has been achieved by employing a novel cross-correlation-based spectral averaging protocol, which we demonstrated for approximately 115 spectra but that in principle could be applied to a much larger data set without loss of fidelity. Unlike other line-by-line fitting approaches, the availability of a single broadband spectrum allows us to conduct a full-spectrum multi-parameter fit to the HITRAN database, which our results show is robust in the presence of noise and of étalon effects, allowing these to be eliminated by post-processing. The robustness of the fit in the presence of étalon effects was confirmed by re-running the fit after removing the étalon fringes, which led to no significant change in the best-fit parameters.
The interferogram time window used for data processing is 40 µs, implying a limiting resolution of 0.076 cm−1, a factor of 3–4 lower than the experimentally observed resolutions of 0.256–0.314 cm−1. We believe this difference is caused by decoherence between the combs that occurs on the timescale of the interferogram window. Support for this hypothesis can be found from fCEO stability measurements of locked OPO combs, showing that at frequencies from 1 kHz – 100 kHz which lie outside the bandwidth of the feedback loop, a residual phase error of ~150 mrad due to technical noise [33] could accumulate during the sub-ms acquisition time of a single interferogram. Acquiring interferograms in a shorter time by operating the system at a higher value of ΔfREP should partially mitigate this problem, although steps would need to be taken to limit the optical bandwidth in order to avoid
Vol. 25, No. 26 | 25 Dec 2017 | OPTICS EXPRESS 32720

aliasing. We note also that some post-processing schemes may be applicable to the data obtained here and could allow higher resolution spectra to be obtained. For example, the computational multi-heterodyne spectroscopy approach reported by Burghoff et al. [34] has demonstrated a route to obtaining comb-mode resolved spectra from noisy dual quantum-cascade-laser combs, however applying this technique to modelocked laser DCS data where the number of lines is several orders of magnitude greater would necessitate a significant extension of this approach. Adaptive sampling with single [35] or dual [36] cw lasers may also be possible, subject to the availability of lasers with suitably narrow linewidths in the long-wave infrared spectral region, or feed-forward methods [37] could be compatible with OPOs where the fCEO is detectable [38].
6. Conclusions
In summary, we have demonstrated fingerprint-region DCS across nearly 100 cm−1 and in 100 milliseconds acquisition time, which extends the state-of-the-art by representing the first example of simultaneously achieving high resolution and broadband DCS in the spectral fingerprint region using optical parametric oscillators. The use of OPGaP OPOs is important because it represents a scalable and intrinsically tunable approach, with the potential for a single OPO with suitably chosen quasi-phasematched gratings to reach as far as 13 µm and power levels of hundreds of milliwatts with readily available 1-µm pump lasers. This capability, together with the naturally high beam quality of such OPOs makes free-space implementations immediately practical and already offers performance which far surpasses in average power and spectral brightness the performance of kHz-rate super-continuum sources [39].
The implications of extending DCS into the spectral fingerprint band and in a manner not requiring stabilization of either fREP or fCEO are significant. In addition to the organic fingerprints, many pollutant gases also exhibit high absorption cross sections in this region (e.g. NH3, CH4, N2O), meaning that sensitive and quantitative free-space detection for the purposes of environmental monitoring is possible, without the need for complex phase-locked systems. The potential of DCS for multi-kHz data rates means that chemical reactions could be monitored directly in real time, and the specificity of the fingerprint region to molecular isomers could provide new insights into the dynamics of chemical bonding [40]. Similar advantages apply to nano-Fourier transform infrared spectroscopy (FTIR) [41,42], in which scanning near-field optical microscopy is implemented with mid-IR illumination of a metallic tip, enabling nanoscale chemical mapping of polymer blends, organic fibers, and biomedical tissue. Dual-comb illumination could dramatically increase the acquisition rate of nano-FTIR spectra, potentially even enabling a form of nanoscale hyperspectral imaging.
Funding
UK Engineering and Physical Sciences Research Council; UK National Physical Laboratory under an Industrial CASE award (Ref. 13220137).
Vol. 25, No. 26 | 25 Dec 2017 | OPTICS EXPRESS 32721