dual enrollment programs and courses for high school ...nces.ed.gov/pubs2013/2013002.pdfinstitute of...
TRANSCRIPT

Dual Enrollment Programs and Courses for High School Students at Postsecondary Institutions: 2010–11First Look
NCES 2013-002 U.S. DEPARTMENT OF EDUCATION

Dual Enrollment Programs and Courses for High School Students at Postsecondary Institutions: 2010–11 First Look
FEBRUARY 2013
Stephanie Marken Lucinda Gray Laurie Lewis Westat
John Ralph Program Director National Center for Education Statistics
NCES 2013–002 U.S. DEPARTMENT OF EDUCATION

U.S. Department of Education Arne Duncan Secretary
Institute of Education Sciences John Q. Easton Director
National Center for Education Statistics Jack Buckley Commissioner
Early Childhood, International, and Crosscutting Studies Division Chris Chapman Acting Associate Commissioner
The National Center for Education Statistics (NCES) is the primary federal entity for collecting, analyzing, and reporting data related to education in the United States and other nations. It fulfills a congressional mandate to collect, collate, analyze, and report full and complete statistics on the condition of education in the United States; conduct and publish reports and specialized analyses of the meaning and significance of such statistics; assist state and local education agencies in improving their statistical systems; and review and report on education activities in foreign countries.
NCES activities are designed to address high-priority education data needs; provide consistent, reliable, complete, and accurate indicators of education status and trends; and report timely, useful, and high-quality data to the U.S. Department of Education, the Congress, the states, other education policymakers, practitioners, data users, and the general public. Unless specifically noted, all information contained herein is in the public domain.
We strive to make our products available in a variety of formats and in language that is appropriate to a variety of audiences. You, as our customer, are the best judge of our success in communicating information effectively. If you have any comments or suggestions about this or any other NCES product or report, we would like to hear from you. Please direct your comments to
NCES, IES, U.S. Department of Education 1990 K Street NW Washington, DC 20006-5651
February 2013
The NCES Home Page address is http://nces.ed.gov. The NCES Publications and Products address is http://nces.ed.gov/pubsearch.
This publication is only available online. To download, view, and print the report as a PDF file, go to the NCES Publications and Products address shown above.
This report was prepared in part under Contract No. ED-04-CO-0059/0025 with Westat. Mention of trade names, commercial products, or organizations does not imply endorsement by the U.S. Government.
Suggested Citation
Marken, S., Gray, L., and Lewis, L. (2013). Dual Enrollment Programs and Courses for High School Students at Postsecondary Institutions: 2010–11 (NCES 2013-002). U.S. Department of Education. Washington, DC: National Center for Education Statistics. Retrieved [date] from http://nces.ed.gov/pubsearch.
Content Contact
John Ralph (202) 502-7441 [email protected]

iii
Acknowledgments
The authors would like to recognize the respondents from postsecondary institutions who provided data on dual enrollment programs and courses upon which the report is based and the sponsors from the Office of Elementary and Secondary Education, U.S. Department of Education.

iv
Contents
Page
Acknowledgments ................................................................................................................. iii
List of Tables ......................................................................................................................... v
Introduction............................................................................................................................. 1
Selected Findings .................................................................................................................... 3
Tables ..................................................................................................................................... 5
References .............................................................................................................................. 21
Appendix A: Standard Error Tables ..................................................................................... A-1
Appendix B: Technical Notes ............................................................................................... B-1
Appendix C: Questionnaire .................................................................................................. C-1

v
List of Tables
Table Page
1. Percentage of 2-year and 4-year degree-granting postsecondary institutions with high school students taking courses for college credit, and number of high school students taking courses for college credit, within and outside of dual enrollment programs, by institutional characteristics: Academic year 2010–11 ........................... 6
2. Percentage of 2-year and 4-year degree-granting postsecondary institutions with dual enrollment programs, by method or location of delivery and institutional characteristics: Academic year 2010–11 ...................................................................... 7
3. Percentage distribution of 2-year and 4-year degree-granting postsecondary institutions with dual enrollment programs with college-level courses taught on a high school campus, by the type of instructors and institutional characteristics: Academic year 2010–11 .............................................................................................. 8
4. Percentage distribution of 2-year and 4-year degree-granting postsecondary institutions with dual enrollment programs with college-level courses taught on a high school campus by high school instructors, by whether the minimum qualifications for the high school campus instructors were the same or different than those required for college instructors and institutional characteristics: Academic year 2010–11 .............................................................................................. 9
5. Percentage distribution of 2-year and 4-year degree-granting postsecondary institutions with dual enrollment programs reporting the typical number of courses per academic term taken in the programs, and the percentage distribution for the maximum number of courses per term allowed in the programs, by institutional characteristics: Academic year 2010–11 ...................................................................... 10
6. Percentage distribution of 2-year and 4-year degree-granting postsecondary institutions with dual enrollment programs reporting on the timing of college credit awarded to high school students in the programs, by institutional characteristics: Academic year 2010–11 .............................................................................................. 11
7. Percentage of 2-year and 4-year degree-granting postsecondary institutions with dual enrollment programs, by eligible grade levels for high school student participation and institutional characteristics: Academic year 2010–11 ...................... 12
8. Percentage of 2-year and 4-year degree-granting postsecondary institutions with dual enrollment programs, by academic eligibility requirements for participation and institutional characteristics: Academic year 2010–11 ........................................... 13

vi
Table Page
9. Percentage distribution of 2-year and 4-year degree-granting postsecondary institutions with dual enrollment programs indicating whether the programs’ academic eligibility requirements were the same as admissions standards for regular college students, and the percentage distribution indicating whether the course curriculum was specially designed for high school students, by institutional characteristics: Academic year 2010–11 ...................................................................... 14
10. Percentage distribution of 2-year and 4-year degree-granting postsecondary institutions with dual enrollment programs indicating whether the institution discounted the tuition rate for students in the program(s), and the percentage of institutions indicating which sources paid tuition for students in the program(s), by institutional characteristics: Academic year 2010–11 ............................................. 15
11. Percentage of 2-year and 4-year degree-granting postsecondary institutions with dual enrollment programs indicating whether most high school students (and their parents) generally paid out of pocket for tuition, fees, or books when taking college-level courses within the dual enrollment programs, by institutional characteristics: Academic year 2010–11 ...................................................................... 16
12. Percentage of 2-year and 4-year degree-granting postsecondary institutions with dual enrollment programs reporting the types of certificates or degrees awarded to any high school students in the dual enrollment programs, by institutional characteristics: Academic year 2010–11 ...................................................................... 17
13. Percentage of 2-year and 4-year degree-granting postsecondary institutions with a comprehensive dual enrollment program in which high school students took all or most of their courses, by institutional characteristics: Academic year 2010–11 ......... 18
14. Percentage of 2-year and 4-year degree-granting postsecondary institutions with a formal dual enrollment program geared specifically toward high school students at risk of educational failure, number of students enrolled in these programs, and the percentage distribution of institutions indicating the typical pattern of high school enrollments in at-risk programs, by institutional characteristics: Academic year 2010–11 ....................................................................................................................... 19
15. Percentage of 2-year and 4-year degree-granting postsecondary institutions with dual enrollment programs geared specifically toward high school students at risk of educational failure, by types of extra support services offered to these students and institutional characteristics: Academic year 2010–11 ................................................. 20

vii
Appendix A Tables Page
1a. Standard errors for the percentage of 2-year and 4-year degree-granting postsecondary institutions with high school students taking courses for college credit, and standard errors for the number of high school students taking courses for college credit, within and outside of dual enrollment programs, by institutional characteristics: Academic year 2010–11 ...................................................................... A-2
2a. Standard errors for the percentage of 2-year and 4-year degree-granting postsecondary institutions with dual enrollment programs, by method or location of delivery and institutional characteristics: Academic year 2010–11 ............................. A-3
3a. Standard errors for the percentage distribution of 2-year and 4-year degree-granting postsecondary institutions with dual enrollment programs with college-level courses taught on a high school campus, by the type of instructors and institutional characteristics: Academic year 2010–11 ...................................................................... A-4
4a. Standard errors for the percentage distribution of 2-year and 4-year degree-granting postsecondary institutions with dual enrollment programs with college-level courses taught on a high school campus by high school instructors, by whether the minimum qualifications for the high school campus instructors were the same or different than those required for college instructors and institutional characteristics: Academic year 2010–11 .............................................................................................. A-5
5a. Standard errors for the percentage distribution of 2-year and 4-year degree-granting postsecondary institutions with dual enrollment programs reporting the typical number of courses per academic term taken in the programs, and the percentage distribution for the maximum number of courses per term allowed in the programs, by institutional characteristics: Academic year 2010–11 ............................................. A-6
6a. Standard errors for the percentage distribution of 2-year and 4-year degree-granting postsecondary institutions with dual enrollment programs reporting on the timing of college credit awarded to high school students in the programs, by institutional characteristics: Academic year 2010–11 ...................................................................... A-7
7a. Standard errors for the percentage of 2-year and 4-year degree-granting postsecondary institutions with dual enrollment programs, by eligible grade levels for high school student participation and institutional characteristics: Academic year 2010–11 ................................................................................................................ A-8
8a. Standard errors for the percentage 2-year and 4-year degree-granting postsecondary institutions with dual enrollment programs, by academic eligibility requirements for participation and institutional characteristics: Academic year 2010–11 ................ A-9

viii
Appendix A Tables Page
9a. Standard errors for the percentage distribution of 2-year and 4-year degree-granting postsecondary institutions with dual enrollment programs indicating whether the programs’ academic eligibility requirements were the same as admissions standards for regular college students, and the percentage distribution indicating whether the course curriculum was specially designed for high school students, by institutional characteristics: Academic year 2010–11 ............................................. A-10
10a. Standard errors for the percentage distribution of 2-year and 4-year degree-granting postsecondary institutions with dual enrollment programs indicating whether the institution discounted the tuition rate for students in the program(s), and the percentage of institutions indicating which sources paid tuition for students in the program(s), by institutional characteristics: Academic year 2010–11 ......................... A-11
11a. Standard errors for the percentage of 2-year and 4-year degree-granting postsecondary institutions with dual enrollment programs indicating whether most high school students (and their parents) generally paid out of pocket for tuition, fees, or books when taking college-level courses within the dual enrollment programs, by institutional characteristics: Academic year 2010–11 ........................... A-12
12a. Standard errors for the percentage of 2-year and 4-year degree-granting postsecondary institutions with dual enrollment programs reporting the types of certificates or degrees awarded any to high school students in the dual enrollment programs, by institutional characteristics: Academic year 2010–11 ........................... A-13
13a. Standard errors for the percentage of 2-year and 4-year degree-granting postsecondary institutions with a comprehensive dual enrollment program in which high school students took all or most of their courses, by institutional characteristics: Academic year 2010–11 ...................................................................... A-14
14a. Standard errors for the percentage of 2-year and 4-year degree-granting postsecondary institutions with a formal dual enrollment program geared specifically toward high school students at risk of educational failure, standard errors for the number of students enrolled in these programs, and standard errors for the percentage distribution of institutions indicating the typical pattern of high school enrollments in at-risk programs, by institutional characteristics: Academic year 2010–11 ................................................................................................................ A-15
15a. Standard errors for the percentage of 2-year and 4-year degree-granting postsecondary institutions with dual enrollment programs geared specifically toward high school students at risk of educational failure, by types of extra support services offered to these students and institutional characteristics: Academic year 2010–11 ....................................................................................................................... A-16

ix
Appendix B Table Page
B-1. Number and percentage distribution of responding degree-granting postsecondary institutions in the study, and estimated number and percentage distribution in the nation, by institutional characteristics: Academic year 2010–11 .................................. B-3

1
Introduction
This report provides descriptive national data on the prevalence and characteristics of dual enrollment programs at postsecondary institutions in the United States. For this survey, dual enrollment refers to high school students earning college credits for courses taken through a postsecondary institution. The National Center for Education Statistics (NCES) previously collected data on dual enrollment and dual credit for the 2002–03 academic year from postsecondary institutions and high schools (Kleiner and Lewis 2005; Waits, Setzer, and Lewis 2005). To gather current data on dual enrollment and dual credit, NCES fielded an updated survey of postsecondary institutions on dual enrollment and a complementary survey of high schools on dual credit.1 The study presented in this report collected information for the 2010–11 academic year from postsecondary institutions on the enrollment of high school students in college-level courses within and outside of dual enrollment programs, and dual enrollment program characteristics.2 Respondents were provided the following definitions of these terms in the instructions section of the survey:
• Within a “dual enrollment program” is defined as within an organized system with special guidelines that allows high school students to take college-level courses. The guidelines might have to do with entrance or eligibility requirements, funding, limits on coursetaking, and so on. This includes early and middle college high schools as well as other types of dual enrollment programs.
• Outside a “dual enrollment program” is defined as high school students who simply enroll in credit courses through your institution, and are treated as regular college students.
The survey covered the following:
• Whether the institution reported that any high school students took courses for college credit during the 12-month 2010–11 academic year;
• Whether the institution reported that any high school students took courses for college credit outside of a dual enrollment program during the 12-month 2010–11 academic year, and if so, the total number of high school students who took courses outside of a dual enrollment program;
• Whether the institution reported that any high school students took courses for college credit within a dual enrollment program during the 12-month 2010–11 academic year, and if so, the total number of high school students who took courses within the dual enrollment program(s);
• Whether courses taught within the dual enrollment program(s) were taught on the college campus, high school campus, some other location, or through distance education;
• Whether courses within the dual enrollment programs taught on the high school campus were taught by college or high school instructors;
• High school instructors’ minimum qualifications for teaching courses within the dual enrollment program(s);
• The typical pattern of high school course enrollments per academic term within the dual enrollment program(s);
• The maximum number of courses per academic term a high school student was allowed to take as part of the dual enrollment program(s);
• When credit was awarded (immediately upon completion of courses, upon enrolling at the institution after high school graduation, or another time) for courses taken within the dual enrollment program(s);
• Which grade levels of high school students were eligible to take college-level courses within the dual enrollment program(s);
1 For results from the dual credit survey of high schools, see Dual Credit and Exam-Based Courses in U.S. Public High Schools: 2010–11 (NCES 2013-001), forthcoming. 2 The 12-month 2010–11 academic year was defined for respondents as including courses during summer 2010 or summer 2011, depending upon how records were kept at their institution.

2
• The types of academic eligibility requirements for high school students to participate in the dual enrollment program(s);
• Whether the academic eligibility requirements for high school students to participate in the dual enrollment program(s) were the same or different than the institution’s admission standards for regular college students;
• Whether the curriculum for the college-level courses taken by high school students within the dual enrollment program(s) was specially designed for high school students or the same as for regular college students;
• Whether the institution discounted the rate of tuition for high school students taking courses within the dual enrollment programs;
• Which sources paid tuition for courses taken within the dual enrollment program(s); • The types of expenses generally paid for out of pocket by students and their parents for courses taken
within the dual enrollment program(s); • Whether the institution awarded certificates, associate’s or bachelor’s degrees to high school students
within the dual enrollment program(s) during the 12-month 2010–11 academic year; • Whether the institution had a comprehensive dual enrollment program during the 12-month 2010–11
academic year in which high school students took all or most of their courses;3 • Whether the institution had a dual enrollment program geared specifically toward high school students at
risk of educational failure during the 12-month 2010–11 academic year, and if so, the number of high school students enrolled in the program;
• The typical pattern of enrollments per academic term within the dual enrollment program geared specifically toward high school students at risk of educational failure; and
• The extra support services offered to students in the dual enrollment program geared specifically toward at-risk high school students.
NCES, part of the Institute of Education Sciences, conducted this survey in fall 2011 using the Postsecondary Education Quick Information System (PEQIS). PEQIS is a survey system designed to collect small amounts of issue-oriented data from a nationally representative sample of institutions with minimal burden on respondents and within a relatively short period of time. Questionnaires were mailed to approximately 1,650 public and private Title IV eligible, degree-granting postsecondary institutions in the 50 states and the District of Columbia.4 The unweighted survey response rate was 93 percent and the weighted response rate using the initial base weights was 94 percent. The survey weights were adjusted for questionnaire nonresponse and the data were then weighted to yield national estimates that represent all 2-year and 4-year Title IV eligible degree-granting postsecondary institutions in the United States. Tables of standard error estimates are provided in appendix A. Detailed information about the survey methodology is provided in appendix B, and the questionnaire can be found in appendix C.
Because the purpose of this report is to introduce new NCES data from this survey through the presentation of tables containing descriptive information, only selected findings are presented. These findings have been chosen to demonstrate the range of information available from the PEQIS dual enrollment study rather than to discuss all of the data collected; they are not meant to emphasize any particular issue. The findings are based on self-reported data from postsecondary institutions.
3 The following explanation of comprehensive dual enrollment programs was included in the survey: Students are generally enrolled in these comprehensive programs for one or more years. Examples include early college and middle college high schools, as well as other dual enrollment programs in which high school students took all or most of their courses. 4 Institutions participating in Title IV federal student financial aid programs (such as Pell grants or Stafford loans) are accredited by an agency or organization recognized by the U.S. Department of Education, have a program of more than 300 clock hours or 8 credit hours, have been in business for at least 2 years, and have a signed Program Participation Agreement with the Office of Postsecondary Education (OPE), U.S. Department of Education. Degree-granting institutions are those that offer an associate’s, bachelor’s, master’s, doctor’s, or first-professional degree (Knapp et al. 2001).

3
Selected Findings
This section presents selected findings on dual enrollment programs and courses at 2-year and 4-year Title IV eligible degree-granting postsecondary institutions for the 12-month 2010–11 academic year.
• During the 12-month 2010–11 academic year, 53 percent of all institutions reported high school students took courses for college credit within or outside of dual enrollment programs (table 1).5 Forty-six percent of all institutions reported that high school students took courses for college credit within a dual enrollment program, and 28 percent of institutions reported that high school students took courses for college credit outside a dual enrollment program. Institutions reported that approximately 1,277,100 high school students took courses for college credit within a dual enrollment program and approximately 136,400 high school students took courses for college credit outside a dual enrollment program during the 12-month 2010–11 academic year. Enrollments reported are unduplicated counts of students.6
• Among institutions with a dual enrollment program, 83 percent reported courses within the program were taught at the college campus, 64 percent reported courses were taught at the high school campus, and 48 percent reported courses were taught through distance education (table 2).7
• Among institutions with dual enrollment programs that had at least some instruction offered on high school campuses, 45 percent reported courses taught by both high school and college instructors, 34 percent reported high school instructors only, and 21 percent reported college instructors only (table 3).
• Eighty-seven percent of institutions that reported high school instructors taught courses within the dual enrollment program(s) indicated that the instructors’ minimum qualifications were the same as those required for college instructors (table 4).
• Forty-four percent of institutions reported that the typical pattern of high school enrollments in the dual enrollment program was one course per academic term, 18 percent reported that they typical pattern of high school enrollments in the dual enrollment programs was two courses per academic term, and 3 percent reported that the typical pattern of high school enrollments in the dual enrollment program was three or more courses per academic term (table 5).
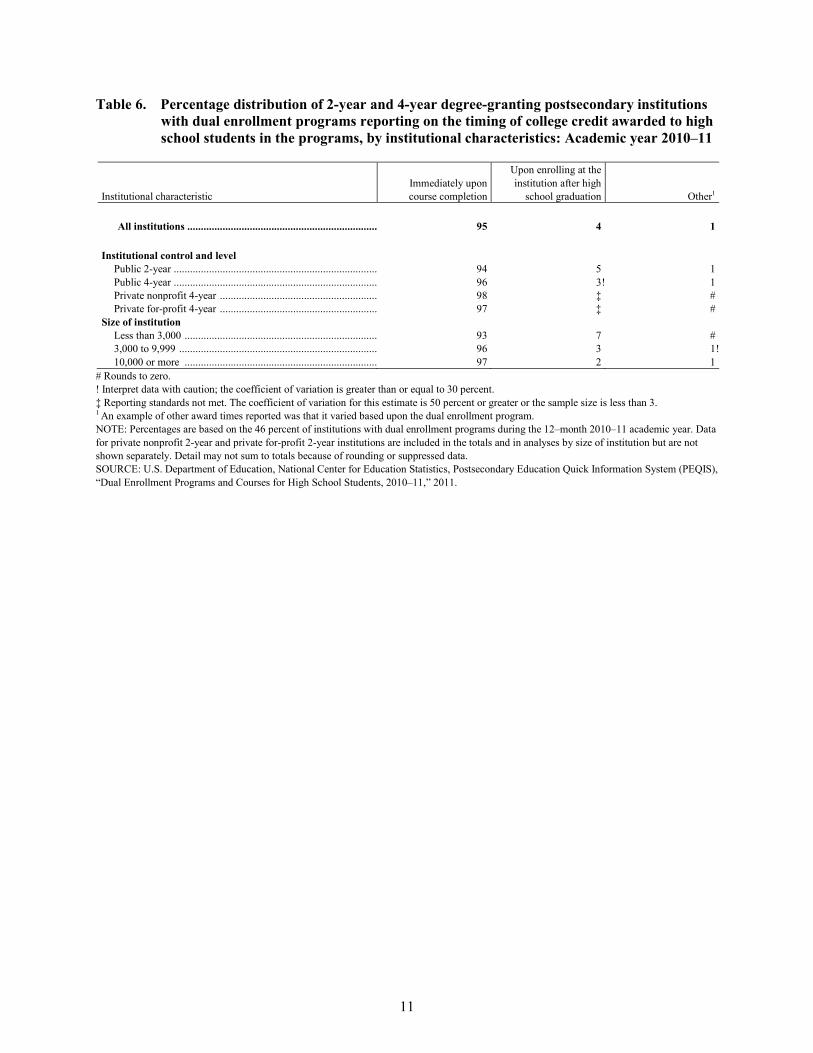
• Ninety-five percent of institutions with dual enrollment programs awarded college credit for courses immediately after course completion, while 4 percent awarded college credit for courses upon students’ enrollment at the institution after high school graduation (table 6).
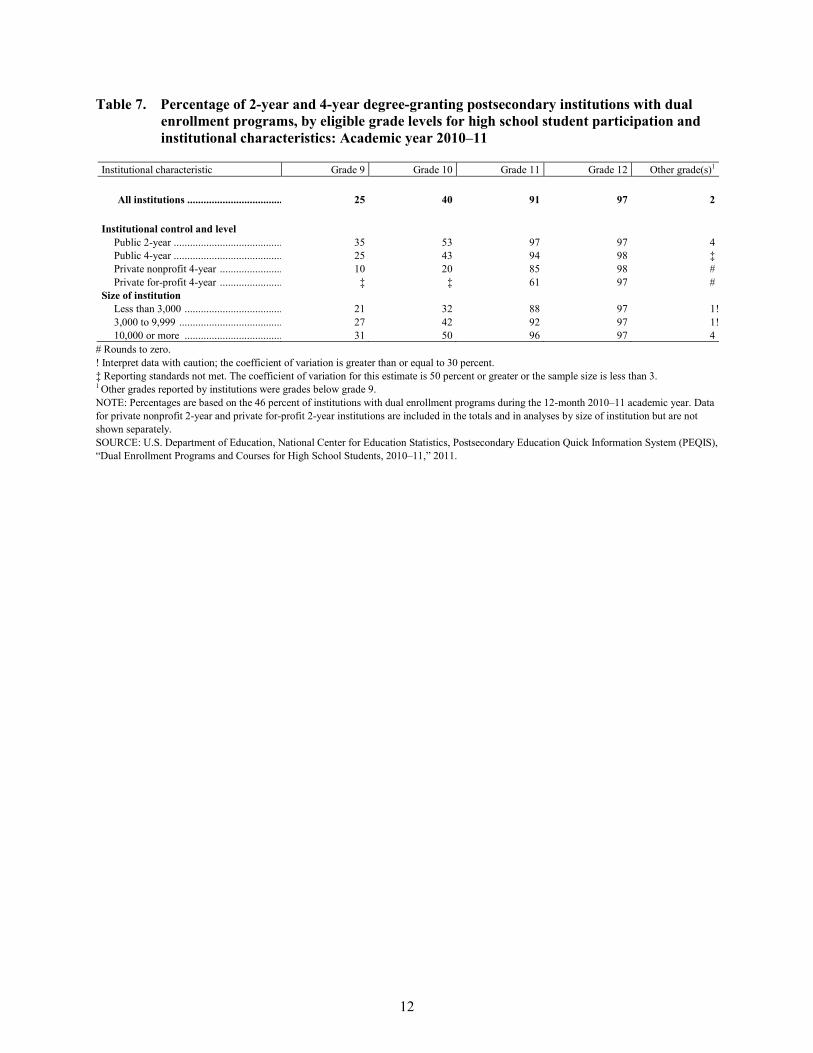
• Most institutions reported that high school students in grades 11 and 12 were eligible to take courses within the dual enrollment programs (91 and 97 percent, respectively) (table 7). Forty percent of institutions reported eligibility for high school students in grade 10, and 25 percent reported eligibility for high school students in grade 9.
• Sixty percent of institutions reported that a minimum high school grade point average (GPA) was required in order to participate in the dual enrollment program (table 8). Other academic eligibility requirements reported by institutions included passing a college placement test (45 percent), a minimum score on a standardized test (43 percent), or a letter of recommendation (41 percent).
5 Institutions could report about high school students taking courses within and outside of dual enrollment programs. 6 In the complementary dual credit survey of high schools, high schools were instructed to count a student for each relevant course in which he or she was enrolled. Therefore, course enrollments in the dual credit survey may include duplicated counts of students. For this reason, the data collected in the postsecondary dual enrollment and high school dual credit surveys are not comparable. 7 Institutions could report that they offered courses at multiple locations. Institutions were instructed to report a course under the distance education category if the course was taught primarily through distance education. Examples of distance education courses were provided to respondents as courses taught through audio, video, Internet, or other computer technologies.

4
• Forty-six percent of the institutions with a dual enrollment program reported that the academic eligibility requirements to participate in the dual enrollment program were the same as the admission standards for regular college students (table 9). Eighty-five percent of the institutions reported that the course curriculum within the dual enrollment programs was the same curriculum as for regular college students.
• Fifty-six percent of institutions reported discounting the tuition rate for high school students participating in all of the dual enrollment programs, and 14 percent reported discounting the tuition rate for high school students participating in some of the dual enrollment programs (table 10). The most commonly reported source paying tuition for courses taken within the dual enrollment programs was the postsecondary institution (77 percent), followed by parents and students (66 percent), high schools and public school districts (44 percent), the state (38 percent), and other sources (10 percent).8
• Forty-five percent of institutions with a dual enrollment program indicated that students (and their parents) generally paid out of pocket9 for tuition, 50 percent indicated that students generally paid for fees, and 60 percent indicated that students generally paid for books (table 11).
• Fifteen percent of institutions reported that certificates were awarded, and 17 percent reported that associates’ degrees were awarded during the 12-month 2010–11 academic year to high school students participating in the dual enrollment programs (table 12).
• Twelve percent of all institutions had a comprehensive dual enrollment program in which high school students took all or most of their courses during the 12-month 2010–11 academic year (table 13).10
• Four percent of all postsecondary institutions had a dual enrollment program geared specifically toward high school students at risk of educational failure during the 12-month 2010–11 academic year (table 14). Institutions reported enrolling approximately 22,100 students in these programs.
• Institutions with dual enrollment programs geared specifically toward high school students at risk of educational failure reported the following extra support services were offered to those students during the 12-month 2010–11 academic year: academic advising (74 percent), tutoring services (68 percent), study skills workshops (65 percent), college application and selection counseling (60 percent), financial aid counseling (49 percent), and other support services (41 percent) (table 15).11
8 Examples of other tuitions sources reported include private scholarships and grants. 9 The term “out of pocket” was not defined for respondents. 10 The following explanation of comprehensive dual enrollment programs was included in the survey: Students are generally enrolled in these comprehensive programs for one or more years. Examples include early college and middle college high schools, as well as other dual enrollment programs in which high school students took all or most of their courses. 11 Institutions were instructed to report about support services beyond those usually provided to students taking courses through the institution.

5
Tables

6 Table 1. Percentage of 2-year and 4-year degree-granting postsecondary institutions with high school students taking courses for college
credit, and number of high school students taking courses for college credit, within and outside of dual enrollment programs, by institutional characteristics: Academic year 2010–11
Institutional characteristic
Institutions with any high school students
taking courses for college credit
within or outside of dual enrollment
programs1
Institutions with any high school students taking courses for college credit
within a dual enrollment program
Institutions with any high school students taking courses for college credit
outside a dual enrollment program Number of high school students taking
courses for college credit
Percent based on all
institutions1
Percent based on institutions with any high school students
taking courses for college credit2
Percent based on all
institutions1
Percent based on institutions with any
high school students taking courses for
college credit2 Within a dual
enrollment program Outside a dual
enrollment program
All institutions ................... 53 46 87 28 53 1,227,100 136,400
Institutional control and level Public 2-year ....................... 98 96 99 58 60 873,600 106,400 Public 4-year ....................... 84 75 90 42 50 259,800 19,700 Private nonprofit 4-year ...... 49 35 72 22 45 88,500 9,500 Private for-profit 4-year ...... 10 6 59 5! 45 4,000 700!
Size of institution Less than 3,000 ................... 35 28 80 17 49 164,700 12,200 3,000 to 9,999 ..................... 85 80 94 46 54 508,700 53,400 10,000 or more ................... 91 80 88 51 56 553,700 70,800
! Interpret data with caution; the coefficient of variation is greater than or equal to 30 percent. 1 Percentages are based on all Title IV degree-granting institutions in the United States. 2 Percentages are based on the 53 percent of institutions that had any high school students taking courses for college credit during the 12-month 2010–11 academic year. NOTE: Enrollments provided by institutions were unduplicated (each student was counted only once even if he or she took more than one course). High school students may have been counted twice if they took courses both within and outside of the dual enrollment programs at the same institution. Data for private nonprofit 2-year and private for-profit 2-year institutions are included in the totals and in analyses by size of institution but are not shown separately. Detail may not sum to totals because of rounding or suppressed data. SOURCE: U.S. Department of Education, National Center for Education Statistics, Postsecondary Education Quick Information System (PEQIS), “Dual Enrollment Programs and Courses for High School Students, 2010–11,” 2011.

7
Table 2. Percentage of 2-year and 4-year degree-granting postsecondary institutions with dual enrollment programs, by method or location of delivery and institutional characteristics: Academic year 2010–11
Institutional characteristic
Dual enrollment courses Taught through
distance education Taught at the
college campus Taught at the high
school campus Taught at some
other location(s)1
All institutions ..................................... 48 83 64 9
Institutional control and level Public 2-year .......................................... 68 83 83 14 Public 4-year .......................................... 42 80 54 8 Private nonprofit 4-year ......................... 18 83 47 ‡ Private for-profit 4-year ......................... 69 91 15! #
Size of institution Less than 3,000 ...................................... 39 83 57 6 3,000 to 9,999 ........................................ 54 82 69 10 10,000 or more ...................................... 53 83 69 10
# Rounds to zero. ! Interpret data with caution; the coefficient of variation is greater than or equal to 30 percent. ‡ Reporting standards not met. The coefficient of variation for this estimate is 50 percent or greater or the sample size is less than 3. 1 Examples of other locations reported include satellite campuses and community centers. NOTE: Percentages are based on the 46 percent of institutions with dual enrollment programs during the 12-month 2010–11 academic year. Percentages do not sum to 100 because courses could have been offered by institutions at multiple locations. Data for private nonprofit 2-year and private for-profit 2-year institutions are included in the totals and in analyses by size of institution but are not shown separately. SOURCE: U.S. Department of Education, National Center for Education Statistics, Postsecondary Education Quick Information System (PEQIS), “Dual Enrollment Programs and Courses for High School Students, 2010–11,” 2011.

8
Table 3. Percentage distribution of 2-year and 4-year degree-granting postsecondary institutions with dual enrollment programs with college-level courses taught on a high school campus, by the type of instructors and institutional characteristics: Academic year 2010–11
Institutional characteristic
Dual enrollment courses taught on a high school campus by: College
instructors only High school
instructors only Both high school
and college instructors
All institutions ..................................... 21 34 45
Institutional control and level Public 2-year .......................................... 24 26 50 Public 4-year .......................................... 18 43 40 Private nonprofit 4-year ......................... 16 50 34 Private for-profit 4-year ......................... 79 # ‡
Size of institution Less than 3,000 ...................................... 21 40 38 3,000 to 9,999 ........................................ 19 30 51 10,000 or more ...................................... 26 32 42
# Rounds to zero. ‡ Reporting standards not met. The coefficient of variation for this estimate is 50 percent or greater or the sample size is less than 3. NOTE: Percentages are based on the institutions with at least some college-level courses within a dual enrollment program taught at a high school campus. Of the 46 percent of institutions with dual enrollment programs during the 12-month 2010–11 academic year, 64 percent taught at least some college-level courses at the high school campus. Data for private nonprofit 2-year and private for-profit 2-year institutions are included in the totals and in analyses by size of institution but are not shown separately. Detail may not sum to totals because of rounding or suppressed data. SOURCE: U.S. Department of Education, National Center for Education Statistics, Postsecondary Education Quick Information System (PEQIS), “Dual Enrollment Programs and Courses for High School Students, 2010–11,” 2011.

9
Table 4. Percentage distribution of 2-year and 4-year degree-granting postsecondary institutions with dual enrollment programs with college-level courses taught on a high school campus by high school instructors, by whether the minimum qualifications for the high school campus instructors were the same or different than those required for college instructors and institutional characteristics: Academic year 2010–11
Institutional characteristic
Minimum qualifications for high school instructors teaching dual enrollment courses Minimum
qualifications were the same as those
required for college instructors
Minimum qualifications were
different than those required for
college instructors
No set policy for minimum qualifications
Minimum qualifications varied1
All institutions ..................................... 87 5 2! 7
Institutional control and level Public 2-year .......................................... 89 3 2! 6 Public 4-year .......................................... 81 12 ‡ 7 Private nonprofit 4-year ......................... 86 ‡ ‡ 9! Private for-profit 4-year ......................... ‡ # # #
Size of institution Less than 3,000 ...................................... 88 3! 3! 5! 3,000 to 9,999 ........................................ 86 4 ‡ 9 10,000 or more ...................................... 85 9 ‡ 5
# Rounds to zero. ! Interpret data with caution; the coefficient of variation is greater than or equal to 30 percent. ‡ Reporting standards not met. The coefficient of variation for this estimate is 50 percent or greater or the sample size is less than 3. 1 “Minimum qualifications varied” could mean that the minimum qualifications varied within a single program or that the minimum qualifications varied across multiple programs within an institution. NOTE: Percentages are based on the institutions with at least some college-level courses within a dual enrollment program taught at a high school campus by high school instructors. Of the 46 percent of institutions with dual enrollment programs during the 12-month 2010–11 academic year, 64 percent reported at least some of the college-level courses were taught at a high school campus and 79 percent of those institutions reported high school instructors taught at least some of the courses. Data for private nonprofit 2-year and private for-profit 2-year institutions are included in the totals and in analyses by size of institution but are not shown separately. Detail may not sum to totals because of rounding or suppressed data. SOURCE: U.S. Department of Education, National Center for Education Statistics, Postsecondary Education Quick Information System (PEQIS), “Dual Enrollment Programs and Courses for High School Students, 2010–11,” 2011.

10 Table 5. Percentage distribution of 2-year and 4-year degree-granting postsecondary institutions with dual enrollment programs
reporting the typical number of courses per academic term taken in the programs, and the percentage distribution for the maximum number of courses per term allowed in the programs, by institutional characteristics: Academic year 2010–11
Institutional characteristic
Typical pattern of high school enrollments1 Maximum number of courses per academic term
One course per academic
term
Two courses per academic
term
Three or more courses per academic
term
Typical number
of courses per academic
term varied considerably2
One course per academic
term
Two courses per academic
term
Three or more courses per academic
term
No maximum number of
courses per academic
term
Maximum number of
courses per academic
term varied3
All institutions .......................................................... 44 18 3 33 12 25 21 25 18
Institutional control and level Public 2-year ............................................................... 28 25 2 44 4 16 25 32 23 Public 4-year ............................................................... 52 13 2 33 11 27 23 23 16 Private nonprofit 4-year .............................................. 68 10 3! 17 24 37 15 13 10 Private for-profit 4-year .............................................. 48! 46! ‡ ‡ ‡ ‡ ‡ ‡ 40!
Size of institution Less than 3,000 ........................................................... 46 20 3! 29 15 27 16 24 18 3,000 to 9,999 ............................................................. 42 16 3 38 11 22 24 27 16 10,000 or more ........................................................... 45 18 3 33 7 25 26 22 19
! Interpret data with caution; the coefficient of variation is greater than or equal to 30 percent. ‡ Reporting standards not met. The coefficient of variation for this estimate is 50 percent or greater or the sample size is less than 3. 1 Respondents were asked to report the typical pattern of high school enrollments in the dual enrollment programs. An additional response category of “some other pattern” was available to institutions but is not reported here because the estimates are too unstable to report. 2 The response option “Typical number of courses per academic term varied considerably” could mean that the number of courses varied considerably within a single program, or that the number of courses varied considerably across multiple programs within an institution. 3 “Maximum number of courses per academic term varied” could mean that the maximum number varied within a single program, or that the maximum number varied across multiple programs within an institution. NOTE: Percentages are based on the 46 percent of institutions with dual enrollment programs during the 12-month 2010–11 academic year. Data for private nonprofit 2-year and private for-profit 2-year institutions are included in the totals and in analyses by size of institution but are not shown separately. Detail may not sum to totals because of rounding or suppressed data. SOURCE: U.S. Department of Education, National Center for Education Statistics, Postsecondary Education Quick Information System (PEQIS), “Dual Enrollment Programs and Courses for High School Students, 2010–11,” 2011.
11
Table 6. Percentage distribution of 2-year and 4-year degree-granting postsecondary institutions with dual enrollment programs reporting on the timing of college credit awarded to high school students in the programs, by institutional characteristics: Academic year 2010–11
Institutional characteristic Immediately upon course completion
Upon enrolling at the institution after high
school graduation Other1
All institutions ...................................................................... 95 4 1
Institutional control and level Public 2-year ........................................................................... 94 5 1 Public 4-year ........................................................................... 96 3! 1 Private nonprofit 4-year .......................................................... 98 ‡ # Private for-profit 4-year .......................................................... 97 ‡ #
Size of institution Less than 3,000 ....................................................................... 93 7 # 3,000 to 9,999 ......................................................................... 96 3 1! 10,000 or more ....................................................................... 97 2 1
# Rounds to zero. ! Interpret data with caution; the coefficient of variation is greater than or equal to 30 percent. ‡ Reporting standards not met. The coefficient of variation for this estimate is 50 percent or greater or the sample size is less than 3. 1 An example of other award times reported was that it varied based upon the dual enrollment program. NOTE: Percentages are based on the 46 percent of institutions with dual enrollment programs during the 12–month 2010–11 academic year. Data for private nonprofit 2-year and private for-profit 2-year institutions are included in the totals and in analyses by size of institution but are not shown separately. Detail may not sum to totals because of rounding or suppressed data. SOURCE: U.S. Department of Education, National Center for Education Statistics, Postsecondary Education Quick Information System (PEQIS), “Dual Enrollment Programs and Courses for High School Students, 2010–11,” 2011.
12
Table 7. Percentage of 2-year and 4-year degree-granting postsecondary institutions with dual enrollment programs, by eligible grade levels for high school student participation and institutional characteristics: Academic year 2010–11
Institutional characteristic Grade 9 Grade 10 Grade 11 Grade 12 Other grade(s)1
All institutions ................................... 25 40 91 97 2
Institutional control and level Public 2-year ........................................ 35 53 97 97 4 Public 4-year ........................................ 25 43 94 98 ‡ Private nonprofit 4-year ....................... 10 20 85 98 # Private for-profit 4-year ....................... ‡ ‡ 61 97 #
Size of institution Less than 3,000 .................................... 21 32 88 97 1! 3,000 to 9,999 ...................................... 27 42 92 97 1! 10,000 or more .................................... 31 50 96 97 4
# Rounds to zero. ! Interpret data with caution; the coefficient of variation is greater than or equal to 30 percent. ‡ Reporting standards not met. The coefficient of variation for this estimate is 50 percent or greater or the sample size is less than 3. 1 Other grades reported by institutions were grades below grade 9. NOTE: Percentages are based on the 46 percent of institutions with dual enrollment programs during the 12-month 2010–11 academic year. Data for private nonprofit 2-year and private for-profit 2-year institutions are included in the totals and in analyses by size of institution but are not shown separately. SOURCE: U.S. Department of Education, National Center for Education Statistics, Postsecondary Education Quick Information System (PEQIS), “Dual Enrollment Programs and Courses for High School Students, 2010–11,” 2011.

13 Table 8. Percentage of 2-year and 4-year degree-granting postsecondary institutions with dual enrollment programs, by academic
eligibility requirements for participation and institutional characteristics: Academic year 2010–11
Institutional characteristic
Minimum high school GPA
Minimum score on a standardized test
such as SAT or ACT
Minimum high school class rank
Passing a college placement test given
by institution Letter of
recommendation Some other
requirement(s)1
Yes No Yes No Yes No Yes No Yes No Yes No
All institutions .................................... 60 33 43 50 10 80 45 50 41 54 32 58
Institutional control and level Public 2-year ......................................... 45 50 49 48 5 90 71 28 37 60 28 63 Public 4-year ......................................... 75 19 57 37 19 74 33 63 41 54 31 62 Private nonprofit 4-year ........................ 70 18 20 65 12 70 9 81 47 44 39 45 Private for-profit 4-year ........................ 85 15! 40! 60 # 60 84 16! ‡ 74 46! 48!
Size of institution Less than 3,000 ..................................... 66 27 35 58 10 80 37 58 45 51 27 62 3,000 to 9,999 ....................................... 54 38 48 44 11 79 54 42 38 56 32 58 10,000 or more ..................................... 60 34 46 48 10 81 45 50 39 56 39 51
# Rounds to zero. ! Interpret data with caution; the coefficient of variation is greater than or equal to 30 percent. ‡ Reporting standards not met. The coefficient of variation for this estimate is 50 percent or greater or the sample size is less than 3. 1 Examples of other eligibility requirements reported include parental approval, grade level requirements and course prerequisites. NOTE: Response options in the questionnaire were “yes,” “no,” and “don’t know.” The “don’t know” responses are not shown in the table but can be inferred by subtracting the sum of the “yes” and “no” responses from 100 percent. Percentages are based on the 46 percent of institutions with dual enrollment programs during the 12-month 2010–11 academic year. Data for private nonprofit 2-year and private for-profit 2-year institutions are included in the totals and in analyses by size of institution but are not shown separately. SOURCE: U.S. Department of Education, National Center for Education Statistics, Postsecondary Education Quick Information System (PEQIS), “Dual Enrollment Programs and Courses for High School Students, 2010–11,” 2011.

14 Table 9. Percentage distribution of 2-year and 4-year degree-granting postsecondary institutions with dual enrollment programs
indicating whether the programs’ academic eligibility requirements were the same as admissions standards for regular college students, and the percentage distribution indicating whether the course curriculum was specially designed for high school students, by institutional characteristics: Academic year 2010–11
Institutional characteristic
Academic eligibility requirements were: Course curriculum was: The same as the
institution’s admission standards for
regular college students
Different than the institution’s admission
standards for regular college students
Specially designed for high school students
The same as for regular college
students It varied1
All institutions ............................................................................... 46 54 4 85 10
Institutional control and level Public 2-year ................................................................................... 61 39 2 88 10 Public 4-year ................................................................................... 39 61 4 86 10 Private nonprofit 4-year .................................................................. 30 70 9 82 10 Private for-profit 4-year .................................................................. ‡ 69 ‡ 50! 46!
Size of institution Less than 3,000 ............................................................................... 42 58 5! 86 9 3,000 to 9,999 ................................................................................. 49 51 4 83 13 10,000 or more ............................................................................... 49 51 4 88 8
! Interpret data with caution; the coefficient of variation is greater than or equal to 30 percent. ‡ Reporting standards not met. The coefficient of variation for this estimate is 50 percent or greater or the sample size is less than 3. 1 “It varied” could mean that the curriculum varied within a single program, or that the curriculum varied across multiple programs within an institution. The term “it varied” was not defined for respondents. NOTE: Percentages are based on the 46 percent of institutions with dual enrollment programs during the 12-month 2010–11 academic year. Data for private nonprofit 2-year and private for-profit 2-year institutions are included in the totals and in analyses by size of institution but are not shown separately. Detail may not sum to totals because of rounding or suppressed data. SOURCE: U.S. Department of Education, National Center for Education Statistics, Postsecondary Education Quick Information System (PEQIS), “Dual Enrollment Programs and Courses for High School Students, 2010–11,” 2011.

15 Table 10. Percentage distribution of 2-year and 4-year degree-granting postsecondary institutions with dual enrollment programs
indicating whether the institution discounted the tuition rate for students in the program(s), and the percentage of institutions indicating which sources paid tuition for students in the program(s), by institutional characteristics: Academic year 2010–11
Institutional characteristic
Institution discounted tuition rate1 Sources paying tuition2
Yes for all programs
Yes for some
programs No Postsecondary
institution3 The state
High schools/ public school
districts Parents/ students
Some other source(s)4
All institutions .................................................................... 56 14 29 77 38 44 66 10
Institutional control and level Public 2-year ......................................................................... 46 17 37 72 46 53 61 15 Public 4-year ......................................................................... 46 18 35 71 43 49 73 8 Private nonprofit 4-year ........................................................ 82 8 10 92 24 27 72 7 Private for-profit 4-year ........................................................ 97 # ‡ 97 ‡ ‡ ‡ #
Size of institution Less than 3,000 ..................................................................... 62 12 26 80 36 41 68 9 3,000 to 9,999 ....................................................................... 52 17 30 76 39 48 66 12 10,000 or more ..................................................................... 55 13 32 74 40 44 61 12
# Rounds to zero. ‡ Reporting standards not met. The coefficient of variation for this estimate is 50 percent or greater or the sample size is less than 3. 1 For discounted tuition rate, institutions could only select one response category. Detail may not sum to totals because of rounding or suppressed data. 2 For sources paying tuition, percentages do not sum to 100 because tuition could be paid by multiple sources. 3 “Postsecondary institution” includes discounted tuition rates, the institution’s contributions, and/or tuition waivers. 4 Examples of other tuition sources reported include private scholarships and grants. NOTE: Percentages are based on the 46 percent of institutions with dual enrollment programs during the 12-month 2010–11 academic year. Data for private nonprofit 2-year and private for-profit 2-year institutions are included in the totals and in analyses by size of institution but are not shown separately. SOURCE: U.S. Department of Education, National Center for Education Statistics, Postsecondary Education Quick Information System (PEQIS), “Dual Enrollment Programs and Courses for High School Students, 2010–11,” 2011.

16
Table 11. Percentage of 2-year and 4-year degree-granting postsecondary institutions with dual enrollment programs indicating whether most high school students (and their parents) generally paid out of pocket for tuition, fees, or books when taking college-level courses within the dual enrollment programs, by institutional characteristics: Academic year 2010–11
Institutional characteristic Tuition (full or partial) Fees Books
All institutions ...................................................................... 45 50 60
Institutional control and level Public 2-year ........................................................................... 38 46 55 Public 4-year ........................................................................... 50 50 59 Private nonprofit 4-year .......................................................... 60 58 70 Private for-profit 4-year .......................................................... ‡ 88 88
Size of institution Less than 3,000 ....................................................................... 46 48 62 3,000 to 9,999 ......................................................................... 46 51 59 10,000 or more ....................................................................... 43 52 61
‡ Reporting standards not met. The coefficient of variation for this estimate is 50 percent or greater or the sample size is less than 3. NOTE: Percentages are based on the 46 percent of institutions with dual enrollment programs during the 12-month 2010–11 academic year. Data for private nonprofit 2-year and private for-profit 2-year institutions are included in the totals and in analyses by size of institution but are not shown separately. Percentages do not sum to 100 because respondents reported about each type of expense separately. The term “out of pocket” was not defined for respondents. SOURCE: U.S. Department of Education, National Center for Education Statistics, Postsecondary Education Quick Information System (PEQIS), “Dual Enrollment Programs and Courses for High School Students, 2010–11,” 2011.

17
Table 12. Percentage of 2-year and 4-year degree-granting postsecondary institutions with dual enrollment programs reporting the types of certificates or degrees awarded to any high school students in the dual enrollment programs, by institutional characteristics: Academic year 2010–11
Institutional characteristic Certificate1 Associate’s degree Bachelor’s degree
All institutions ...................................................................... 15 17 #
Institutional control and level Public 2-year ........................................................................... 31 29 ‡ Public 4-year ........................................................................... 4 9 1! Private nonprofit 4-year .......................................................... ‡ 3! # Private for-profit 4-year .......................................................... # # #
Size of institution Less than 3,000 ....................................................................... 10 10 # 3,000 to 9,999 ......................................................................... 20 22 1! 10,000 or more ....................................................................... 15 19 ‡
# Rounds to zero. ! Interpret data with caution; the coefficient of variation is greater than or equal to 30 percent. ‡ Reporting standards not met. The coefficient of variation for this estimate is 50 percent or greater or the sample size is less than 3. 1 Certificate refers to a postsecondary certificate or diploma that normally requires 1 to 2 years of study to complete, such as pharmacy technician or automotive technology. NOTE: Percentages are based on the 46 percent of institutions with dual enrollment programs during the 12–month 2010–11 academic year. Data for private nonprofit 2-year and private for-profit 2-year institutions are included in the totals and in analyses by size of institution but are not shown separately. SOURCE: U.S. Department of Education, National Center for Education Statistics, Postsecondary Education Quick Information System (PEQIS), “Dual Enrollment Programs and Courses for High School Students, 2010–11,” 2011.

18
Table 13. Percentage of 2-year and 4-year degree-granting postsecondary institutions with a comprehensive dual enrollment program in which high school students took all or most of their courses, by institutional characteristics: Academic year 2010–11
Institutional characteristic Percent based
on all institutions1 Percent based on institutions
with dual enrollment programs2
All institutions ...................................................................... 12 25
Institutional control and level Public 2-year ........................................................................... 35 36 Public 4-year ........................................................................... 19 25 Private nonprofit 4-year .......................................................... 2 5 Private for-profit 4-year .......................................................... 2! 40!
Size of institution Less than 3,000 ....................................................................... 6 21 3,000 to 9,999 ......................................................................... 21 27 10,000 or more ....................................................................... 24 30
! Interpret data with caution; the coefficient of variation is greater than or equal to 30 percent. 1 Percentages are based on all Title IV degree-granting institutions in the United States. 2 Percentages are based on the 46 percent of institutions with dual enrollment programs during the 12-month 2010–11 academic year. NOTE: The following explanation of comprehensive dual enrollment programs was included in the survey: “Students are generally enrolled in these comprehensive programs for one or more years. Examples include early college and middle college high schools, as well as other dual enrollment programs in which high school students took all or most of their courses.” Data for private nonprofit 2-year and private for-profit 2-year institutions are included in the totals and in analyses by size of institution but are not shown separately. SOURCE: U.S. Department of Education, National Center for Education Statistics, Postsecondary Education Quick Information System (PEQIS), “Dual Enrollment Programs and Courses for High School Students, 2010–11,” 2011.

19 Table 14. Percentage of 2-year and 4-year degree-granting postsecondary institutions with a formal dual enrollment program geared
specifically toward high school students at risk of educational failure, number of students enrolled in these programs, and the percentage distribution of institutions indicating the typical pattern of high school enrollments in at-risk programs, by institutional characteristics: Academic year 2010–11
Institutional characteristic
Percent of institutions with dual enrollment programs geared
specifically toward at-risk students
Number of students
Typical pattern of enrollments in dual enrollment programs geared toward at-risk high school students3
Percent based on all institutions1
Percent based on institutions
with dual enrollment programs2
One course per academic term
Two courses per academic term
Three or more courses per
academic term
Typical number of courses per
academic term varied
considerably4
All institutions ..................................................... 4 9 22,100 30 17 17 36
Institutional control and level Public 2-year .......................................................... 14 15 17,400 26 15 18 41 Public 4-year .......................................................... 4 6 3,100 27 23! ‡ 37! Private nonprofit 4-year ......................................... 2! 5! ‡ 54 ‡ ‡ ‡ Private for-profit 4-year ......................................... # # # # # # #
Size of institution Less than 3,000 ...................................................... 2 6 2,900! 33! 24! ‡ 26! 3,000 to 9,999 ........................................................ 9 11 10,100 27 12! 20 42 10,000 or more ...................................................... 10 12 9,100 31 18 14 37
# Rounds to zero. ! Interpret data with caution; the coefficient of variation is greater than or equal to 30 percent. ‡ Reporting standards not met. The coefficient of variation for this estimate is 50 percent or greater or the sample size is less than 3. 1 Percentages are based on all Title IV degree-granting institutions in the United States. 2 Percentages are based on the 46 percent of institutions with dual enrollment programs during the 12-month 2010–11 academic year. 3 Percentages are based on the 4 percent of institutions with dual enrollment programs geared specifically toward high school students at risk of educational failure during the 12-month 2010–11 academic year. Institutions could only select one response category. 4 “Typical number of courses per academic term varied considerably” could mean that the pattern varied within a single program or that the pattern varied across multiple programs within an institution. NOTE: Data for private nonprofit 2-year and private for-profit 2-year institutions are included in the totals and in analyses by size of institution but are not shown separately. Detail may not sum to totals because of rounding or suppressed data. SOURCE: U.S. Department of Education, National Center for Education Statistics, Postsecondary Education Quick Information System (PEQIS), “Dual Enrollment Programs and Courses for High School Students, 2010–11,” 2011.

20
Table 15. Percentage of 2-year and 4-year degree-granting postsecondary institutions with dual enrollment programs geared specifically toward high school students at risk of educational failure, by types of extra support services offered to these students and institutional characteristics: Academic year 2010–11
Institutional characteristic Tutoring Academic
advising Study skills workshops
College application/
selection counseling
Financial aid counseling
Some other support
service(s)1
All institutions .......................... 68 74 65 60 49 41
Institutional control and level Public 2-year ............................... 65 72 65 60 47 40 Public 4-year ............................... 83 87 76 64 66 34 Private nonprofit 4-year .............. 68 75 51 51 42! 54 Private for-profit 4-year .............. # # # # # #
Size of institution Less than 3,000 ........................... 51 60 44 51 44 41 3,000 to 9,999 ............................. 69 78 68 56 44 35 10,000 or more ........................... 81 80 79 73 63 51
# Rounds to zero. ! Interpret data with caution; the coefficient of variation is greater than or equal to 30 percent. 1 Examples of other support services reported include career counseling and mentoring programs. NOTE: Percentages are based on the 4 percent of institutions with dual enrollment programs geared specifically toward high school students at risk of educational failure during the 12-month 2010–11 academic year. Extra support services reported are services beyond those usually provided to students taking courses through the institution. Data for private nonprofit 2-year and private for-profit 2-year institutions are included in the totals and in analyses by size of institution but are not shown separately. SOURCE: U.S. Department of Education, National Center for Education Statistics, Postsecondary Education Quick Information System (PEQIS), “Dual Enrollment Programs and Courses for High School Students, 2010–11,” 2011.

21
References
Brick, J.M., Morganstein, D.R., and Wolters, C.L. (1987). Additional Uses for Keyfitz Selection. Proceedings of the Section on Survey Research Methods, American Statistical Association, 789-791.
Kalton, G. (1983). Compensating for Missing Survey Data. Survey Research Center, Institute for Social Research: University of Michigan, 65-104.
Kish, L. (1965). Survey Sampling. New York: J. Wiley & Sons.
Kleiner, B., and Lewis, L. (2005). Dual Enrollment of High School Students at Postsecondary Institutions: 2002–03 (NCES 2005-008). U.S. Department of Education. Washington, DC: National Center for Education Statistics.
Knapp, L.G., Kelly, J.E., Whitmore, R.W., Wu, S., Gallego, L.M., and Grau, E. (2001). Postsecondary Institutions in the United States: Fall 2000 and Degrees and Other Awards Conferred: 1999–2000 (NCES 2002-156). National Center for Education Statistics, U.S. Department of Education. Washington, DC.
Levy, P., and Lemeshow, S. (1991). Sampling of Populations. New York: J. Wiley & Sons. Rust, K. (1986). Efficient Replicated Variance Estimation. Proceedings of the Section on Survey
Research Methods, American Statistical Association, 81-87.
Waits, T., Setzer, J.C., and Lewis, L. (2005). Dual Credit and Exam-Based Courses in U.S. Public High Schools: 2002-03 (NCES 2005-009). U.S. Department of Education. Washington, DC: National Center for Education Statistics.
Wolter, K. (1985). Introduction to Variance Estimation, New York: Springer-Verlag, 183.

A-1
Appendix A
Standard Error Tables

A-2
Table 1a. Standard errors for the percentage of 2-year and 4-year degree-granting postsecondary institutions with high school students taking courses for college credit, and standard errors for the number of high school students taking courses for college credit, within and outside of dual enrollment programs, by institutional characteristics: Academic year 2010–11
Institutional characteristic
Institutions with any high school students
taking courses for college credit
within or outside of dual enrollment
programs
Institutions with any high school students taking courses for college credit
within a dual enrollment program
Institutions with any high school students taking courses for college credit outside a
dual enrollment program Number of high school students taking
courses for college credit
Percent based on all
institutions
Percent based on institutions with any high school students
taking courses for college credit
Percent based on all
institutions
Percent based on institutions with any
high school students taking courses for
college credit Within a dual
enrollment program Outside a dual
enrollment program
All institutions ................... 0.8 0.8 1.1 0.8 1.5 30,270 6,000
Institutional control and level Public 2-year ....................... 1.0 1.0 0.2 1.9 1.9 27,420 5,790 Public 4-year ....................... 2.1 2.1 1.0 2.0 2.2 8,150 1,100 Private nonprofit 4-year ...... 1.9 1.5 2.6 2.1 3.4 10,210 1,540 Private for-profit 4-year ...... 2.2 1.7 11.4 1.4 11.4 680 290
Size of institution Less than 3,000 ................... 1.1 1.2 2.4 1.2 3.1 12,420 2,240 3,000 to 9,999 ..................... 1.1 1.3 0.9 1.7 2.1 22,070 4,860 10,000 or more ................... 0.3 0.4 0.3 0.5 0.5 15,100 2,540
SOURCE: U.S. Department of Education, National Center for Education Statistics, Postsecondary Education Quick Information System (PEQIS), “Dual Enrollment Programs and Courses for High School Students, 2010–11,” 2011.

A-3
Table 2a. Standard errors for the percentage of 2-year and 4-year degree-granting postsecondary institutions with dual enrollment programs, by method or location of delivery and institutional characteristics: Academic year 2010–11
Institutional characteristic
Dual enrollment courses Taught through
distance education Taught at the
college campus Taught at the high
school campus Taught at some
other location(s)
All institutions ..................................... 1.3 1.1 1.4 0.8
Institutional control and level Public 2-year .......................................... 1.6 1.6 1.6 1.5 Public 4-year .......................................... 2.0 2.0 1.9 1.2 Private nonprofit 4-year ......................... 2.9 2.9 3.5 † Private for-profit 4-year ......................... 17.1 3.0 5.8 †
Size of institution Less than 3,000 ...................................... 2.8 2.2 3.2 1.5 3,000 to 9,999 ........................................ 1.6 1.6 1.9 1.3 10,000 or more ...................................... 0.6 0.4 0.5 0.4
† Not applicable. SOURCE: U.S. Department of Education, National Center for Education Statistics, Postsecondary Education Quick Information System (PEQIS), “Dual Enrollment Programs and Courses for High School Students, 2010–11,” 2011.

A-4
Table 3a. Standard errors for the percentage distribution of 2-year and 4-year degree-granting postsecondary institutions with dual enrollment programs with college-level courses taught on a high school campus, by the type of instructors and institutional characteristics: Academic year 2010–11
Institutional characteristic
Dual enrollment courses taught on a high school campus by: College
instructors only High school
instructors only Both high school
and college instructors
All institutions ..................................... 1.4 1.6 1.8
Institutional control and level Public 2-year .......................................... 1.9 1.7 1.9 Public 4-year .......................................... 1.8 3.1 3.0 Private nonprofit 4-year ......................... 3.6 4.2 4.7 Private for-profit 4-year ......................... 8.3 † †
Size of institution Less than 3,000 ...................................... 3.3 3.8 4.2 3,000 to 9,999 ........................................ 1.9 2.2 2.3 10,000 or more ...................................... 0.7 0.6 0.8
† Not applicable. SOURCE: U.S. Department of Education, National Center for Education Statistics, Postsecondary Education Quick Information System (PEQIS), “Dual Enrollment Programs and Courses for High School Students, 2010–11,” 2011.

A-5
Table 4a. Standard errors for the percentage distribution of 2-year and 4-year degree-granting postsecondary institutions with dual enrollment programs with college-level courses taught on a high school campus by high school instructors, by whether the minimum qualifications for the high school campus instructors were the same or different than those required for college instructors and institutional characteristics: Academic year 2010–11
Institutional characteristic
Minimum qualifications for high school instructors teaching dual enrollment courses Minimum
qualifications were the same as those
required for college instructors
Minimum qualifications were
different than those required for
college instructors
No set policy for minimum qualifications
Minimum qualifications varied1
All institutions ..................................... 1.0 0.7 0.6 0.8
Institutional control and level Public 2-year .......................................... 1.2 0.9 0.7 1.1 Public 4-year .......................................... 2.0 1.9 † 1.0 Private nonprofit 4-year ......................... 3.1 † † 2.8 Private for-profit 4-year ......................... † † † †
Size of institution Less than 3,000 ...................................... 2.8 1.6 1.6 1.9 3,000 to 9,999 ........................................ 1.5 1.0 † 1.4 10,000 or more ...................................... 0.5 0.2 † 0.3
† Not applicable. SOURCE: U.S. Department of Education, National Center for Education Statistics, Postsecondary Education Quick Information System (PEQIS), “Dual Enrollment Programs and Courses for High School Students, 2010–11,” 2011.

A-6
Table 5a. Standard errors for the percentage distribution of 2-year and 4-year degree-granting postsecondary institutions with dual enrollment programs reporting the typical number of courses per academic term taken in the programs, and the percentage distribution for the maximum number of courses per term allowed in the programs, by institutional characteristics: Academic year 2010–11
Institutional characteristic
Typical pattern of high school enrollments Maximum number of courses per academic term
One course per academic
term
Two courses per academic
term
Three or more courses per academic
term
Typical number
of courses per academic
term varied considerably
One course per academic
term
Two courses per academic
term
Three or more courses per academic
term
No maximum number of
courses per academic
term
Maximum number of
courses per academic
term varied
All institutions .......................................................... 1.6 1.0 0.6 1.2 1.1 1.3 1.2 1.3 1.1
Institutional control and level Public 2-year ............................................................... 1.5 1.7 0.5 1.5 0.9 1.3 1.9 2.1 1.6 Public 4-year ............................................................... 2.3 1.2 0.5 2.3 1.2 2.0 1.9 1.8 2.0 Private nonprofit 4-year .............................................. 4.8 2.2 1.1 2.9 3.3 3.2 2.4 2.0 2.1 Private for-profit 4-year .............................................. 17.1 17.4 † † † † † † 14.4
Size of institution Less than 3,000 ........................................................... 4.0 2.5 1.6 2.9 2.6 2.9 2.6 2.7 2.5 3,000 to 9,999 ............................................................. 1.4 1.2 0.6 1.5 1.2 1.4 1.7 1.8 1.5 10,000 or more ........................................................... 0.5 0.5 0.2 0.5 0.3 0.4 0.4 0.5 0.5
† Not applicable. SOURCE: U.S. Department of Education, National Center for Education Statistics, Postsecondary Education Quick Information System (PEQIS), “Dual Enrollment Programs and Courses for High School Students, 2010–11,” 2011.

A-7
Table 6a. Standard errors for the percentage distribution of 2-year and 4-year degree-granting postsecondary institutions with dual enrollment programs reporting on the timing of college credit awarded to high school students in the programs, by institutional characteristics: Academic year 2010–11
Institutional characteristic Immediately upon course completion
Upon enrolling at the institution after high
school graduation Other
All institutions ...................................................................... 0.8 0.8 0.1
Institutional control and level Public 2-year ........................................................................... 1.3 1.2 0.2 Public 4-year ........................................................................... 1.0 1.0 0.3 Private nonprofit 4-year .......................................................... 1.0 † † Private for-profit 4-year .......................................................... 1.0 † †
Size of institution Less than 3,000 ....................................................................... 1.8 1.8 † 3,000 to 9,999 ......................................................................... 0.7 0.7 0.3 10,000 or more ....................................................................... 0.2 0.1 0.1
† Not applicable. SOURCE: U.S. Department of Education, National Center for Education Statistics, Postsecondary Education Quick Information System (PEQIS), “Dual Enrollment Programs and Courses for High School Students, 2010–11,” 2011.

A-8
Table 7a. Standard errors for the percentage of 2-year and 4-year degree-granting postsecondary institutions with dual enrollment programs, by eligible grade levels for high school student participation and institutional characteristics: Academic year 2010–11
Institutional characteristic Grade 9 Grade 10 Grade 11 Grade 12 Other grade(s)
All institutions ................................... 1.3 1.6 1.2 0.7 0.3
Institutional control and level Public 2-year ........................................ 2.2 2.5 0.8 0.8 0.6 Public 4-year ........................................ 2.0 2.1 1.2 0.4 † Private nonprofit 4-year ....................... 1.8 2.7 2.0 0.8 † Private for-profit 4-year ....................... † † 18.3 1.0 †
Size of institution Less than 3,000 .................................... 2.9 3.4 3.1 1.7 0.6 3,000 to 9,999 ...................................... 1.6 2.0 0.8 0.6 0.4 10,000 or more .................................... 0.6 0.7 0.2 0.2 0.3
† Not applicable. SOURCE: U.S. Department of Education, National Center for Education Statistics, Postsecondary Education Quick Information System (PEQIS), “Dual Enrollment Programs and Courses for High School Students, 2010–11,” 2011.

A-9
Table 8a. Standard errors for the percentage of 2-year and 4-year degree-granting postsecondary institutions with dual enrollment programs, by academic eligibility requirements for participation and institutional characteristics: Academic year 2010–11
Institutional characteristic
Minimum high school GPA
Minimum score on a standardized test
such as SAT or ACT
Minimum high school class rank
Passing a college placement test given
by institution Letter of
recommendation Some other
requirement(s) Yes No Yes No Yes No Yes No Yes No Yes No
All institutions .................................... 1.1 1.1 1.2 1.5 0.9 1.2 1.2 1.3 1.4 1.5 1.5 1.4
Institutional control and level Public 2-year ......................................... 1.7 1.6 1.9 1.9 0.7 1.0 1.8 1.8 1.7 1.7 2.0 2.0 Public 4-year ......................................... 1.8 1.7 2.5 2.5 2.2 2.3 2.2 2.2 2.2 2.4 1.5 1.7 Private nonprofit 4-year ........................ 2.6 2.5 2.4 3.3 2.2 2.8 1.7 2.4 3.5 3.9 3.9 3.1 Private for-profit 4-year ........................ 5.8 5.8 14.4 14.4 † 14.4 5.0 5.0 † 17.3 15.4 16.4
Size of institution Less than 3,000 ..................................... 2.4 2.3 2.5 3.0 2.0 2.7 2.7 2.9 3.5 3.6 3.5 3.1 3,000 to 9,999 ....................................... 1.9 1.8 1.7 1.9 1.3 1.5 1.5 1.5 1.6 1.7 1.6 1.8 10,000 or more ..................................... 0.7 0.6 0.7 0.8 0.3 0.4 0.6 0.6 0.6 0.6 0.7 0.7
† Not applicable. SOURCE: U.S. Department of Education, National Center for Education Statistics, Postsecondary Education Quick Information System (PEQIS), “Dual Enrollment Programs and Courses for High School Students, 2010–11,” 2011.

A-10
Table 9a. Standard errors for the percentage distribution of 2-year and 4-year degree-granting postsecondary institutions with dual enrollment programs indicating whether the programs’ academic eligibility requirements were the same as admissions standards for regular college students, and the percentage distribution indicating whether the course curriculum was specially designed for high school students, by institutional characteristics: Academic year 2010–11
Institutional characteristic
Academic eligibility requirements were: Course curriculum was: The same as the
institution’s admission standards for
regular college students
Different than the institution’s admission
standards for regular college students
Specially designed for high school students
The same as for regular college
students It varied
All institutions ............................................................................... 1.5 1.5 0.8 1.2 0.9
Institutional control and level Public 2-year ................................................................................... 1.9 1.9 0.5 1.2 1.1 Public 4-year ................................................................................... 2.5 2.5 0.9 1.6 1.4 Private nonprofit 4-year .................................................................. 3.0 3.0 2.4 3.5 2.1 Private for-profit 4-year .................................................................. † 17.1 † 16.0 15.4
Size of institution Less than 3,000 ............................................................................... 3.3 3.3 1.8 2.7 1.9 3,000 to 9,999 ................................................................................. 1.7 1.7 0.7 1.2 1.1 10,000 or more ............................................................................... 0.6 0.6 0.2 0.4 0.3
† Not applicable. SOURCE: U.S. Department of Education, National Center for Education Statistics, Postsecondary Education Quick Information System (PEQIS), “Dual Enrollment Programs and Courses for High School Students, 2010–11,” 2011.

A-11
Table 10a. Standard errors for the percentage distribution of 2-year and 4-year degree-granting postsecondary institutions with dual enrollment programs indicating whether the institution discounted the tuition rate for students in the program(s), and the percentage of institutions indicating which sources paid tuition for students in the program(s), by institutional characteristics: Academic year 2010–11
Institutional characteristic
Discount of tuition rate Source of tuition
Yes for all programs
Yes for some
programs No Postsecondary
institution The state
High schools/ public school
districts Parents/ students
Some other source(s)
All institutions .................................................................... 1.3 0.9 1.2 1.0 1.3 1.3 1.4 0.8
Institutional control and level Public 2-year ......................................................................... 2.2 1.2 1.9 1.5 1.8 1.7 1.9 1.4 Public 4-year ......................................................................... 2.4 2.3 2.3 1.9 2.5 2.6 1.8 1.3 Private nonprofit 4-year ........................................................ 2.2 1.7 2.0 1.9 3.0 3.3 3.0 1.6 Private for-profit 4-year ........................................................ 1.0 † † 1.0 † † † †
Size of institution Less than 3,000 ..................................................................... 2.8 1.9 2.6 2.3 3.1 3.2 3.3 1.7 3,000 to 9,999 ....................................................................... 1.8 1.3 1.8 1.6 1.8 1.4 1.6 1.2 10,000 or more ..................................................................... 0.7 0.6 0.8 0.7 0.5 0.6 0.6 0.5
† Not applicable. SOURCE: U.S. Department of Education, National Center for Education Statistics, Postsecondary Education Quick Information System (PEQIS), “Dual Enrollment Programs and Courses for High School Students, 2010–11,” 2011.

A-12
Table 11a. Standard errors for the percentage of 2-year and 4-year degree-granting postsecondary institutions with dual enrollment programs indicating whether most high school students (and their parents) generally paid out of pocket for tuition, fees, or books when taking college-level courses within the dual enrollment programs, by institutional characteristics: Academic year 2010–11
Institutional characteristic Tuition (full or partial) Fees Books
All institutions ...................................................................... 1.6 1.6 1.2
Institutional control and level Public 2-year ........................................................................... 2.2 2.1 1.8 Public 4-year ........................................................................... 2.6 2.5 2.0 Private nonprofit 4-year .......................................................... 3.4 3.2 2.9 Private for-profit 4-year .......................................................... † 5.1 5.1
Size of institution Less than 3,000 ....................................................................... 3.8 3.6 2.7 3,000 to 9,999 ......................................................................... 1.8 2.2 1.9 10,000 or more ....................................................................... 0.6 0.6 0.6
† Not applicable. SOURCE: U.S. Department of Education, National Center for Education Statistics, Postsecondary Education Quick Information System (PEQIS), “Dual Enrollment Programs and Courses for High School Students, 2010–11,” 2011.

A-13
Table 12a. Standard errors for the percentage of 2-year and 4-year degree-granting postsecondary institutions with dual enrollment programs reporting the types of certificates or degrees awarded to any high school students in the dual enrollment programs, by institutional characteristics: Academic year 2010–11
Institutional characteristic Certificate Associate’s degree Bachelor’s degree
All institutions ...................................................................... 0.9 0.9 †
Institutional control and level Public 2-year ........................................................................... 1.9 1.7 † Public 4-year ........................................................................... 0.6 0.8 0.3 Private nonprofit 4-year .......................................................... † 1.2 † Private for-profit 4-year .......................................................... † † †
Size of institution Less than 3,000 ....................................................................... 1.8 2.0 † 3,000 to 9,999 ......................................................................... 1.6 1.4 0.3 10,000 or more ....................................................................... 0.5 0.6 †
† Not applicable. SOURCE: U.S. Department of Education, National Center for Education Statistics, Postsecondary Education Quick Information System (PEQIS), “Dual Enrollment Programs and Courses for High School Students, 2010–11,” 2011.

A-14
Table 13a. Standard errors for the percentage of 2-year and 4-year degree-granting postsecondary institutions with a comprehensive dual enrollment program in which high school students took all or most of their courses, by institutional characteristics: Academic year 2010–11
Institutional characteristic Percent based
on all institutions Percent based on institutions
with dual enrollment programs
All institutions ...................................................................... 0.6 1.2
Institutional control and level Public 2-year ........................................................................... 2.1 2.1 Public 4-year ........................................................................... 1.6 2.0 Private nonprofit 4-year .......................................................... 0.5 1.4 Private for-profit 4-year .......................................................... 0.8 14.4
Size of institution Less than 3,000 ....................................................................... 0.8 2.6 3,000 to 9,999 ......................................................................... 1.5 1.9 10,000 or more ....................................................................... 0.6 0.8
SOURCE: U.S. Department of Education, National Center for Education Statistics, Postsecondary Education Quick Information System (PEQIS), “Dual Enrollment Programs and Courses for High School Students, 2010–11,” 2011.

A-15
Table14a. Standard errors for the percentage of 2-year and 4-year degree-granting postsecondary institutions with a formal dual enrollment program geared specifically toward high school students at risk of educational failure, standard errors for the number of students enrolled in these programs, and standard errors for the percentage distribution of institutions indicating the typical pattern of high school enrollments in at-risk programs, by institutional characteristics: Academic year 2010–11
Institutional characteristic
Percent of institutions with dual enrollment programs geared
specifically toward at-risk students
Number of students
Typical pattern of enrollments in dual enrollment programs geared toward at-risk high school students
Percent based on all institutions
Percent based on institutions
with dual enrollment
programs One course per academic term
Two courses per academic term
Three or more courses per
academic term
Typical number of courses per
academic term varied
considerably
All institutions ..................................................... 0.4 0.8 1,910 4.0 3.1 3.3 4.7
Institutional control and level Public 2-year .......................................................... 1.1 1.1 1,570 4.7 3.6 3.4 5.0 Public 4-year .......................................................... 0.9 1.1 610 7.5 7.2 † 13.0 Private nonprofit 4-year ......................................... 0.6 1.7 † 13.6 † † † Private for-profit 4-year ......................................... † † † † † † †
Size of institution Less than 3,000 ...................................................... 0.4 1.5 1,050 11.5 10.5 † 12.7 3,000 to 9,999 ........................................................ 1.0 1.3 1,460 5.1 3.8 4.9 6.8 10,000 or more ...................................................... 0.5 0.6 610 2.1 1.3 1.9 2.1
† Not applicable. SOURCE: U.S. Department of Education, National Center for Education Statistics, Postsecondary Education Quick Information System (PEQIS), “Dual Enrollment Programs and Courses for High School Students, 2010–11,” 2011.

A-16
Table 15a. Standard errors for the percentage of 2-year and 4-year degree-granting postsecondary institutions with dual enrollment programs geared specifically toward high school students at risk of educational failure, by types of extra support services offered to these students and institutional characteristics: Academic year 2010–11
Institutional characteristic Tutoring Academic
advising Study skills workshops
College application/
selection counseling
Financial aid counseling
Some other support
service(s)
All institutions ........................... 4.0 3.6 4.1 3.8 3.5 4.0
Institutional control and level Public 2-year ................................ 5.1 4.7 5.1 4.7 4.2 4.8 Public 4-year ................................ 5.4 5.0 7.3 9.6 8.9 8.6 Private nonprofit 4-year ............... 14.7 13.2 13.5 13.5 13.6 13.9 Private for-profit 4-year ............... † † † † † †
Size of institution Less than 3,000 ............................ 12.0 11.3 11.9 12.0 11.9 12.0 3,000 to 9,999 .............................. 5.7 4.6 5.3 5.6 5.0 5.9 10,000 or more ............................ 1.8 1.7 2.5 1.7 2.1 1.3
† Not applicable. SOURCE: U.S. Department of Education, National Center for Education Statistics, Postsecondary Education Quick Information System (PEQIS), “Dual Enrollment Programs and Courses for High School Students, 2010–11,” 2011.

B-1
Appendix B
Technical Notes

B-2
Technical Notes
Postsecondary Education Quick Information System
The Postsecondary Education Quick Information System (PEQIS) was established in 1991 by the National Center for Education Statistics (NCES), U.S. Department of Education. PEQIS is designed to conduct brief surveys of postsecondary institutions or state higher education agencies on postsecondary education topics of national importance. Surveys are generally limited to three pages of questions, with a response burden of 30 to 45 minutes per respondent. Most PEQIS institutional surveys use a previously recruited, nationally representative panel of institutions. The PEQIS panel was originally selected and recruited in 1991–92. In 1996, 2002, 2006, and 2011, the PEQIS panel was reselected to reflect changes in the postsecondary education universe that had occurred since the original panel was selected. A modified Keyfitz approach was used to maximize overlap between the panels for each reselection. This approach resulted in about 80 percent of the institutions overlapping for each reselection of the panel (Brick, Morganstein, and Wolters 1987).
The 2011 PEQIS survey on dual enrollment programs and courses for high school students used the sampling frame for the 2011 PEQIS panel, which was constructed from the 2009–10 Integrated Postsecondary Education Data System (IPEDS) Institutional Characteristics file. Institutions eligible for the 2011 PEQIS frame included 2-year and 4-year (including graduate-level) institutions that are both Title IV eligible and degree-granting, and are located in the 50 states and the District of Columbia: a total of 4,485 institutions. The 2011 PEQIS sampling frame was stratified by instructional level (4-year, 2-year), control (public, private nonprofit, private for-profit), highest level of offering (doctor’s/first-professional, master’s, bachelor’s, less than bachelor’s), and total enrollment to create 43 primary strata. Within each of the strata, institutions were sorted by region (Northeast, Southeast, Central, West) and by whether the institution had a relatively high combined enrollment of Black, Hispanic, Asian/Pacific Islander, or American Indian/Alaska Native students. The sample of approximately 1,650 institutions was allocated to the strata in proportion to the aggregate square root of total enrollment. Institutions within a primary stratum were sampled with equal probabilities of selection.
Data are weighted to produce national estimates, and the sample size permits limited breakouts by analysis variables. However, as the number of categories within any single analysis variable increases, the sample size within categories decreases, which results in larger sampling errors for the breakouts by analysis variables.
Sample Selection and Response Rates
The sample for the survey on dual enrollment programs and courses for high school students consisted of the approximately 1,650 institutions in the PEQIS panel in the fall of 2011. Questionnaires (see appendix C) were mailed to the PEQIS institutions in September 2011. Institutions were told that the survey was designed to be completed by the person(s) most knowledgeable about dual enrollment at the institution. Respondents had the option of completing the survey online. Telephone follow-up of nonrespondents was initiated in October 2011; data collection and clarification were completed in February 2012. During data collection, approximately 10 institutions were determined to be permanently ineligible for the PEQIS panel because they had recently closed, had reorganized, or were no longer degree-granting institutions. For the eligible institutions, an unweighted response rate of 93 percent was obtained for this survey (about 1,520 responding institutions divided by the approximately 1,640 eligible institutions in the sample for this survey). The corresponding weighted response rate using the initial base weights was 94 percent. Of the institutions that completed the survey, 77 percent completed it online, 16 percent completed it on paper (sent by mail, fax, or e-mail), and 8 percent completed it by telephone. The final weighted count of responding institutions in the survey after nonresponse adjustment represents the estimated universe of eligible postsecondary institutions in the 50 states and the District of Columbia—approximately 4,410 institutions (table B-1).

B-3
Table B-1. Number and percentage distribution of responding degree-granting postsecondary institutions in the study, and estimated number and percentage distribution in the nation, by institutional characteristics: Academic year 2010–11
Institutional characteristic
Responding institutions (unweighted)
National estimate (weighted)¹
Number Percent Number Percent
All institutions ............................................................................. 1,520 100 4,410 100
Institutional control and level Public 2-year ................................................................................... 490 32 980 22 Private nonprofit 2-year .................................................................. 10 1 90 2 Private for-profit 2-year .................................................................. 80 5 620 14 Public 4-year ................................................................................... 410 27 670 15 Private nonprofit 4-year .................................................................. 400 27 1,500 34 Private for-profit 4-year .................................................................. 120 8 560 13 Size of institution Less than 3,000 ............................................................................... 510 33 2,830 64 3,000 to 9,999 ................................................................................. 480 32 1,000 23 10,000 or more ................................................................................ 530 35 580 13
¹ Weighted count of responding institutions using the final nonresponse-adjusted weights. The weighted count is an estimate of the number of eligible institutions in the study universe (see text for definition of the types of institutions included in the study). NOTE: Detail may not sum to totals because of rounding. SOURCE: U.S. Department of Education, National Center for Education Statistics, Postsecondary Education Quick Information System (PEQIS), “Dual Enrollment Programs and Courses for High School Students, 2010–11,” 2011.
Imputation for Item Nonresponse
Although item nonresponse was very low, missing data were imputed for the 11 items with a response rate less than 100 percent. The missing items included both numerical data such as number of students in dual enrollment programs, as well as categorical data, such as the academic eligibility requirements for high school students to participate in dual enrollment programs. The missing categorical data were imputed using a “hot-deck” approach to obtain a “donor” institution from which the imputed values were derived. Under the hot-deck approach, a donor institution that matched selected characteristics of the institution with missing data (the recipient institution) was identified (Kalton 1983). The matching characteristics included institution type, control, highest level of offering, and enrollment size. In addition, relevant questionnaire items were used to form appropriate imputation groupings. Once a donor was found, it was used to derive the imputed values for the institution with missing data. For categorical items, the imputed value was simply the corresponding value from the donor institution. For the numerical items, the imputed value was calculated by taking the donor’s response for that item and dividing that number by the total number of students enrolled in the donor institution. This ratio was then multiplied by the total number of students enrolled in the recipient institution to provide an imputed value.
Data Reliability
Although the survey on dual enrollment programs and courses for high school students was designed to account for sampling error and to minimize nonsampling error, estimates produced from the data collected are subject to both types of error. Sampling error occurs because the data are collected from a sample rather than a census of the population, and nonsampling errors are errors made during the collection and processing of the data.

B-4
Sampling Errors
The responses were weighted to produce national estimates (table B-1). The weights were designed to reflect the variable probabilities of selection of the sampled institutions and were adjusted for differential unit (questionnaire) nonresponse. The nonresponse weighting adjustments were made within classes defined by variables used in sampling and expected to be correlated with response propensity: instructional level, control, highest level of offering, and total enrollment. Within the final weighting classes, the base weights (i.e., the reciprocal of institutions’ probabilities of selection) of the responding institutions were inflated by the inverse of the weighted response rate for the class. The findings in this report are estimates based on the sample selected and, consequently, are subject to sampling variability. Jackknife replication was used to estimate the sampling variability of the estimates and to test for statistically significant differences between estimates.
Because the data from the PEQIS survey on dual enrollment programs and courses were collected using a complex sampling design, the variances of the estimates from this survey (e.g., estimates of proportions) are typically different from what would be expected from data collected with a simple random sample. Not taking the complex sample design into account can lead to an under- or overestimation of the standard errors associated with such estimates (Kish 1965). To generate accurate standard errors for the estimates in this report, standard errors were computed using a technique known as jackknife replication (Levy and Lemeshow 1991). A form of jackknife replication referred to as the JKN method was used to construct the replicates. Under the JKN method, the replicates were formed within groups of institutions (called “variance strata) within which institutions were sampled at approximately the same rate. By creating the jackknife replicates within the variance strata, finite population correction factors (FPCs) can be introduced in the variance estimator to account for the fact that institutions in some variance strata were sampled at relatively high rates (Rust 1986, Wolter 1985). The mean square error of the replicate estimates around the full sample estimate provides an estimate of the variance of the statistic. A total of 100 jackknife replicates was created for variance estimation. A computer program (WesVar) was used to calculate the estimates of standard errors.12
The standard error is a measure of the variability of an estimate due to sampling. It indicates the variability of a sample estimate that would be obtained from all possible samples of a given design and size. Standard errors are used as a measure of the precision expected from a particular sample. If all possible samples were surveyed under similar conditions, intervals of 1.96 standard errors below to 1.96 standard errors above a particular statistic would include the true population parameter being estimated in about 95 percent of the samples. This is a 95 percent confidence interval. For example the estimated percentage of degree-granting postsecondary institutions with a dual enrollment program is 46 percent and the standard error is 0.8 percent (tables 1 and 1a). The 95 percent confidence interval for the statistic extends from [46 – (0.8 x 1.96)] to [46 + (0.8 x 1.96)], or from 44.4 to 47.6 percent. The 1.96 is the critical value for a two-sided statistical test at the p < .05 significance level (where .05 indicates the 5 percent of all possible samples that would be outside the range of the confidence interval).
Comparisons can be been tested for statistical significance at the p < .05 level using Student’s t-statistic to ensure that the differences are larger than those that might be expected due to sampling variation. Student’s t values are computed to test the difference between estimates with the following formula:
22
21
21
sese
EEt+
−=
where E1 and E2 are the estimates to be compared and se1 and se2 are their corresponding standard errors.
12 The WesVar program and documentation is available for download at http://www.westat.com/Westat/expertise/information_systems/WesVar/index.cfm.

B-5
Nonsampling Errors
Nonsampling error is the term used to describe variations in the estimates that may be caused by population coverage limitations and data collection, processing, and reporting procedures. The sources of nonsampling errors are typically problems like unit and item nonresponse, differences in respondents’ interpretations of the meaning of questions, response differences related to the particular time the survey was conducted, and mistakes made during data preparation. It is difficult to identify and estimate either the amount of nonsampling error or the bias caused by this error. To minimize the potential for nonsampling error, this study used a variety of procedures, including a pretest of the questionnaire with individuals at postsecondary institutions deemed by their institutions to be the most knowledgeable about dual enrollment programs at their institutions. The pretest provided the opportunity to check for consistency of interpretation of questions and definitions and to eliminate ambiguous items. The questionnaire and instructions were also extensively reviewed by NCES and the data requester at the Office of Elementary and Secondary Education. In addition, extensive editing of the questionnaire responses was conducted to check the data for accuracy and consistency. Cases with missing or inconsistent items were recontacted by telephone to resolve problems. Data entered for all surveys received by mail, fax, or telephone were verified to ensure accuracy.
Definitions of Analysis Variables
• Institutional control and level: public 2-year, private nonprofit 2-year, private for-profit 2-year, public 4-year, private nonprofit 4-year, private for-profit 4-year. This analysis variable was created from a combination of level (2-year, 4-year) and control (public, private nonprofit, private for-profit). Two-year institutions are defined as institutions at which the program is at least 2 but less than 4 years (below the baccalaureate degree); 4-year institutions are those at which the program is 4 or more years (baccalaureate or higher degree).13 Data for private nonprofit 2-year and private for-profit 2-year institutions are included in the totals and in analyses by size of institution but are not shown separately in the tables.
• Institution size: less than 3,000 students (small); 3,000 to 9,999 students (medium); and 10,000 or more students (large). The institution size categories reflect the enrollment categories used to determine an approximately optimum allocation of the sample and provide roughly equal numbers of sample institutions for each of the three broad size categories for robust statistical reporting.
Contact Information
For more information about the survey, contact John Ralph, Early Childhood, International, and Crosscutting Studies Division, National Center for Education Statistics, Institute of Education Sciences, U.S. Department of Education, 1990 K Street, NW, Washington, DC 20006; e-mail: [email protected]; telephone (202) 502-7441.
13 Definitions for level are from the data file documentation for the Integrated Postsecondary Education Data System (IPEDS) Institutional Characteristics file, U.S. Department of Education, National Center for Education Statistics.

C-1
Appendix C
Questionnaire

C-2
Infor
mation
Cop
y - D
o Not
Comple
te
U.S. DEPARTMENT OF EDUCATION NATIONAL CENTER FOR EDUCATION STATISTICS
WASHINGTON, D.C. 20006-5651
DUAL ENROLLMENT PROGRAMS AND COURSES FOR HIGH SCHOOL STUDENTS, 2010–11
POSTSECONDARY EDUCATION QUICK INFORMATION SYSTEM
FORM APPROVED O.M.B. No.: 1850–0733 EXPIRATION DATE: 06/2012
This survey is authorized by law (Education Sciences Reform Act of 2002, 20 U.S.C. 9543). While participation in this survey is voluntary, your cooperation is critical to make the results of this survey comprehensive, accurate, and timely. Your answers may be used only for statistical purposes and may not be disclosed, or used, in identifiable form for any other purpose unless otherwise compelled by law (Education Sciences Reform Act of 2002, 20 U.S.C. 9573).
This survey should be completed by the person(s) most knowledgeable about dual enrollment at your institution.
IF ABOVE INSTITUTION INFORMATION IS INCORRECT, PLEASE UPDATE DIRECTLY ON LABEL.
Name of person completing this form: ____________________________ Telephone: ___________________________
Title/position: _______________________________________________ E-mail: _______________________________
Best days and times to reach you (in case of questions): ____________________________________________________
THANK YOU. PLEASE KEEP A COPY OF THIS SURVEY FOR YOUR RECORDS.
PLEASE RETURN COMPLETED FORM TO:
Mail: Stephanie Marken (8599.09.12.02) Westat 1600 Research Boulevard Rockville, Maryland 20850-3129 Fax: 800-254-0984
IF YOU HAVE ANY QUESTIONS, CONTACT:
Stephanie Marken at Westat 800-937-8281, Ext. 4447 or 301-294-4447 E-mail: [email protected]
According to the Paperwork Reduction Act of 1995, no persons are required to respond to a collection of information unless it displays a valid OMB control number. The valid OMB control number for this information is 1850–0733. The time required to complete this information collection is estimated to average 30 minutes per response, including the time to review instructions, search existing data resources, gather the data needed, and complete and review the information collected. If you have any comments concerning the accuracy of the time estimate(s) or suggestions for improving this form, please write to: U.S. Department of Education, Washington, D.C. 20202–4537. If you have comments or concerns regarding the status of your individual submission of this form, write directly to: National Center for Education Statistics, 1990 K Street, N.W., Washington, D.C. 20006.
PEQIS Form No. 18, 09/2011

C-3
Infor
mation
Cop
y - D
o Not
Comple
te
Instructions and Definitions Page
For the purposes of this survey, dual enrollment refers to high school students earning college credits for courses taken through a postsecondary institution. Different institutions have different names for dual enrollment, such as “dual credit,” “concurrent enrollment,” or “joint enrollment.” Please use the instructions provided here when completing the survey, regardless of how your institution refers to high school students taking college-level courses. Please note that:
• Most questions on the survey ask about courses taken within a “dual enrollment program,” but a few questions ask about college courses taken by high school students outside of any such program.
– Within a “dual enrollment program” is defined here as within an organized system with special guidelines that allows high school students to take college-level courses. The guidelines might have to do with entrance or eligibility requirements, funding, limits on coursetaking, and so on. This includes early and middle college high schools as well as other types of dual enrollment programs.
– Outside a “dual enrollment program” is defined here as high school students who simply enroll in credit courses through your institution, and are treated as regular college students.
• Credit for courses may be earned at both the high school and college level simultaneously or only at the college level. Credit may be earned immediately or upon enrollment at your institution after high school graduation.
• Courses may be taught on a college campus, on a high school campus, at some other location, or through distance education.
The time frame for this survey is the 12-month 2010–11 academic year. This includes courses during summer 2010 or summer 2011, depending upon how records are kept at your institution. Do not include information about summer bridge programs for students who had already graduated from high school.

C-4
Infor
mation
Cop
y - D
o Not
Comple
te
Before you answer the questions, please read the instructions and definitions. 1. During the 12-month 2010–11 academic year, did any high school students take courses for college credit through
your institution? (This includes both students who took courses within a dual enrollment program and those who took courses on their own, outside of any program—see definition on the instructions and definitions page.)
Yes ..... 1 (Continue with question 2.) No ...... 2 (Stop. Complete respondent section on front and return survey.)
College-Level Courses Taken by High School Students Outside Your Institution’s Dual Enrollment Program(s)
2. During the 12-month 2010–11 academic year, did any high school students take courses for college credit through your institution outside of any dual enrollment program? (See definition.)
Yes ..... 1 (Continue with question 3.) No ...... 2 (Skip to question 4.)
3. During the 12-month 2010–11 academic year, how many high school students took courses for college credit through your institution outside of any dual enrollment program? (Please provide unduplicated head count; i.e., do not count students more than once if they took more than one course.)
Number of students
College-Level Courses Taken by High School Students Within Your Institution’s Dual Enrollment Program(s)
4. During the 12-month 2010–11 academic year, did any high school students take courses for college credit through your institution within a dual enrollment program? (See definition.)
Yes .... 1 (Continue with question 5.) No ..... 2 (Stop. Complete respondent section on front and return survey.)
Please consider only courses within a dual enrollment program when answering the remaining survey questions (see definitions and instructions page).
5. During the 12-month 2010–11 academic year, how many high school students took courses for college credit through your institution within the dual enrollment program(s)? (Please provide unduplicated head counts; i.e., do not count students more than once if they took more than one course.)
Number of students
6. Were any of the courses taken by high school students in the dual enrollment program(s) taught at or through the following? (Indicate yes or no for each item.)
Yes No a. Taught through distance education where the student and teacher are separated by
location (Courses can be taught through audio, video, Internet or other computer technologies. Only include courses taught primarily through distance education.) ........... 1 2
b. Taught at your college campus (excluding distance education courses) ........................... 1 2 c. Taught at the high school campus (excluding distance education courses) ....................... 1 2 d. Some other location(s) (specify) 1 2
If you answered yes to question 6c (“taught at the high school campus”), then continue with question 7. If not, skip to question 9.
7. Who were the instructors of the college-level courses in the dual enrollment program(s) that were taught on a high school campus? (Each instructor should be in only one category. Circle only one.)
College instructors only (instructors primarily employed by your institution) ............... 1 (Skip to question 9.) High school instructors only (instructors primarily employed by a school district) ...... 2 (Continue with question 8.) Both high school and college instructors ..................................................................... 3 (Continue with question 8.)
8. How did the minimum qualifications for high school instructors who taught college-level courses as part of the dual enrollment program(s) compare to those required for college instructors at your institution? (Circle only one.)
The same as those required for college instructors ........................................................... 1 Different than those required for college instructors .......................................................... 2 There was no set policy with respect to minimum qualifications ........................................ 3 It varied ............................................................................................................................... 4

C-5
Infor
mation
Cop
y - D
o Not
Comple
te
9. Which of the following most closely resembles the typical pattern of high school enrollments in the dual enrollment program(s)? (A course is equivalent to three or four credits. An academic term could be a semester, quarter, or trimester. Circle only one.)
High school students took one college course per academic term .................................... 1 High school students took two college courses per academic term .................................. 2 High school students took three or more college courses per academic term .................. 3 The number of college courses high school students took varied considerably ................ 4 Some other pattern (specify) 5
10. What was the maximum number of courses per academic term a high school student was allowed to take as part of the dual enrollment program(s)? (A course is equivalent to three or four credits. An academic term could be a semester, quarter, or trimester. Circle only one.)
One course per academic term .......................................................................................... 1 Two courses per academic term ........................................................................................ 2 Three or more courses per academic term ........................................................................ 3 No maximum number per academic term .......................................................................... 4 It varied .............................................................................................................................. 5
11. When were high school students generally awarded college credit for courses taken through the dual enrollment program(s)? (Circle only one.)
Immediately upon completion of courses ........................................................................... 1 Upon enrolling at your institution after high school graduation .......................................... 2 Other (specify) 3
12. Which grade levels of high school students were eligible to take college-level courses as part of the dual enrollment program(s)? (If you had more than one program, include grade levels across all programs. Circle all that apply.)
9th 10th 11th 12th Some other grade(s) (specify) _____________________
13. What were the academic eligibility requirements for high school students to participate in your institution's dual enrollment program(s)? (Indicate yes, no, or don’t know for each item. Indicate yes if an item is required for at least one course in the dual enrollment program.)
Yes No
Don’t know
a. Minimum high school grade point average ......................................................................... 1 2 3 b. Minimum score on a standardized test, such as the SAT or ACT ...................................... 1 2 3 c. Minimum high school class rank ......................................................................................... 1 2 3 d. Passing a college placement test given by your institution ................................................. 1 2 3 e. Letter of recommendation ................................................................................................... 1 2 3 f. Some other requirement(s) (specify) 1 2 3
14. Were the academic requirements for high school students to be eligible to participate in your institution's dual enrollment program(s) the same or different than your institution's admissions standards for regular college students? (Do not consider the requirement of a high school diploma when comparing academic eligibility requirements for high school students to regular college students. Circle only one.)
The same ................ 1 Different ................. 2
15. Was the curriculum (i.e., syllabus, books, exams, course length) for the college-level courses taken by high school students as part of the dual enrollment program(s) specially designed for high school students, or was it the same as for regular college students? (Circle only one.)
Specially designed for high school students ...................................................................... 1 The same as for regular college students .......................................................................... 2 It varied ............................................................................................................................... 3
16. Did your institution discount the tuition rate for high school students taking courses within the dual enrollment program(s)? (Circle only one.)
Yes for all programs ………. 1 Yes for some programs ………. 2 No ……….. 3

C-6
Infor
mation
Cop
y - D
o Not
Comple
te
17. Which sources paid tuition for the college-level courses taken by high school students within the dual enrollment program(s)? (Indicate yes or no for each item. If your institution discounted tuition rates, indicate yes for item a.)
Yes No a. Your institution (including discounted tuition rates, your institution’s contributions,
and/or tuition waivers) ...................................................................................................... 1 2 b. The state ............................................................................................................................. 1 2 c. High schools/public school districts .................................................................................... 1 2 d. Parents/students ................................................................................................................. 1 2 e. Some other source(s) (specify) 1 2
18. Did most high school students (and their parents) generally pay out of pocket for the following expenses when taking college-level courses within the dual enrollment program(s)? (Indicate yes or no for each item.)
Yes No a. Tuition (full or partial) .......................................................................................................... 1 2 b. Fees .................................................................................................................................... 1 2 c. Books .................................................................................................................................. 1 2
19. During the 12-month 2010–11 academic year, did your institution award the following to any high school students in your dual enrollment program(s)? (Indicate yes or no for each item.)
Yes No a. Certificate (a postsecondary certificate or diploma that normally requires 1–2 years of
study to complete, such as pharmacy technician or automotive technology) .................... 1 2 b. Associate’s degree ............................................................................................................. 1 2 c. Bachelor’s degree ............................................................................................................... 1 2
20. During the 12-month 2010–11 academic year, did your institution have a comprehensive dual enrollment program in which high school students took all or most of their courses? (Students are generally enrolled in these comprehensive programs for one or more years. Examples include early college and middle college high schools, as well as other dual enrollment programs in which high school students took all or most of their courses.)
Yes ....................... 1 No ....................... 2
21. During the 12-month 2010–11 academic year, did your institution have a formal dual enrollment program geared specifically toward high school students who were at risk of educational failure? (These programs may have been included in dual enrollment programs already covered above.)
Yes …. 1 (Continue with question 22.) No ..... 2 (Stop. Complete respondent section on front and return survey.)
22. During the 12-month 2010–11 academic year, how many students were enrolled in the dual enrollment program geared toward high school students at risk of educational failure? Number of students
23. Which of the following most closely resembles the typical pattern of enrollments in the dual enrollment program geared toward high school students at risk of educational failure? (An academic term could be a semester, quarter, or trimester. Circle only one.)
High school students took one college course per academic term .................................... 1 High school students took two college courses per academic term .................................. 2 High school students took three or more college courses per academic term .................. 3 The number of college courses high school students took varied considerably ................ 4
24. What extra support services (if any) were specifically offered to the students in the dual enrollment program geared toward at-risk high school students? (Only include support services beyond those usually provided to students taking courses through your institution. Indicate yes or no for each item.)
Yes No a. Tutoring .............................................................................................................................. 1 2 b. Academic advising .............................................................................................................. 1 2 c. Study skills workshops ....................................................................................................... 1 2 d. College application/selection counseling ........................................................................... 1 2 e. Financial aid counseling ..................................................................................................... 1 2 f. Some other support service(s) (specify) 1 2