dublin airport economic impact study - daa · pdf filedublin airport economic impact study i...
TRANSCRIPT

Dublin AirportEconomic Impact Study
PREPARED FOR daa
PREPARED BY InterVISTAS Consulting Ltd.
April 2015


z
Dublin Airport Economic Impact Study
PREPARED FOR
daa
PREPARED BY
InterVISTAS Consulting Ltd.
April 2015
FINAL REPORT

Dublin Airport Economic Impact Study i
Executive Summary
It is clear that airports and economic activity are closely associated and in the context of a European single market and an increasingly global market, air transport is essential to economic progress. As a small, open economy, Ireland is crucially dependent on its air links to facilitate its economy. daa commissioned a study to quantify the contribution of Dublin Airport to the growth of the regional and national economy. The key findings are presented below.
Dublin Airport is a vital element of national infrastructure, a pivotal contributor to ongoing activity, and a key facilitator of economic development. Its economic importance is reflected in the estimated 97,400 jobs supported or facilitated by the airport and the €6.9 billion contributed to Gross Domestic Product.
“… the strategic importance of Dublin Airport extends far beyond its geographic catchment area and its future is critically bound up with the Irish economy e.g. inward investment, tourism, trade etc. This strategic importance is also reflected in the nature and extent of the competition that Dublin Airport faces.”
Department of Transport, Tourism and Sport, May 2014
DIRECT INDIRECT INDUCED CATALYTIC
Jobs: 15,700 Jobs: 9,600 Jobs: 12,000 GDP: €1.3 Bn GDP: €0.7 Bn GDP: €0.8 Bn
TOTAL Jobs: 97,400 GDP: €6.9 Bn
At airport and airport Supplying and Employees spending Air service facilitating: related businesses supporting businesses in the economy tourism, trade, investment, productivity Jobs: 60,100
GDP: €4.2 Bn
Executive Summary
Dublin Airport Economic Impact Study
i

Dublin Airport Economic Impact Study ii
Direct, indirect and induced impacts: day-to-day activity at Dublin Airport directly provides employment for 15,700 people. Together with the businesses that supply the goods and services to airport activity (indirect impacts) and spending of employees in the wider economy (induced impacts), a total of 37,300 jobs are supported by Dublin Airport.
The economic impact of airport activity is provided in Figure ES-1. Economic impact can be measured in a number of ways:
Employment – the number of people employed by businesses involved in activities linked to Dublin Airport.
Income/Wages – the wages and salaries earned by the people employed in activities linked to Dublin Airport.
Gross Value Added (GVA) – GVA is broadly equivalent to Gross Domestic Product (GDP), whereby the value-added of each industry sums to the total GDP of an economy.1
Direct employment supported by ongoing operations at Dublin Airport (e.g., daa, airlines, air traffic control, ground handlers, airport security, immigration, customs, airport retail, etc.) amount to 15,700 jobs. Adjusting for part-time and seasonal employment, this amounts to 14,000 Full-Time Equivalent jobs (FTEs). The total income/wages of these employees is €639 million, which equates to an average of €45,600 per FTE, 16% higher than the national full-time earnings in 2013. The total direct GVA generated by Dublin Airport is estimated to be nearly €1.3 billion, equivalent to 0.7% of national GDP in 2013.
Adding in multiplier impacts (indirect and induced), the total employment supported by activities at Dublin Airport is estimated to be 37,300 jobs (or 33,100 FTEs), earning a total of €1.4 billion. To put that in context, this number of jobs is roughly equivalent to employing the entire town of Swords.2 Total GVA is estimated to be €2.8 billion, 1.6% of national GDP.
Figure ES-1: Total Economic Impact of Dublin Airport
Impact Type Direct Impact
Indirect Impact
Induced Impact
Total Impact
Number of Jobs 15,700 9,600 12,000 37,300
Full-Time Equivalents (FTEs) 14,000 8,500 10,600 33,100
Income/Wages (€ Million) 639 373 397 1,409
GVA (€ Million) 1,256 717 781 2,753
Numbers may not add up due to rounding.
1 Gross Value Added (GVA) is the value of the operating surpluses of business linked to Dublin Airport, plus the income/wages of employees and consumption of fixed capital. GDP is the sum of the GVA of all industries plus taxes less subsidies on production. 2 Source: CSO Ireland: Census 2011 Results. Population of the town of Swords: 36,924.
Dublin Airport Economic Impact Study i
Executive Summary
It is clear that airports and economic activity are closely associated and in the context of a European single market and an increasingly global market, air transport is essential to economic progress. As a small, open economy, Ireland is crucially dependent on its air links to facilitate its economy. daa commissioned a study to quantify the contribution of Dublin Airport to the growth of the regional and national economy. The key findings are presented below.
Dublin Airport is a vital element of national infrastructure, a pivotal contributor to ongoing activity, and a key facilitator of economic development. Its economic importance is reflected in the estimated 97,400 jobs supported or facilitated by the airport and the €6.9 billion contributed to Gross Domestic Product.
“… the strategic importance of Dublin Airport extends far beyond its geographic catchment area and its future is critically bound up with the Irish economy e.g. inward investment, tourism, trade etc. This strategic importance is also reflected in the nature and extent of the competition that Dublin Airport faces.”
Department of Transport, Tourism and Sport, May 2014
DIRECT INDIRECT INDUCED CATALYTIC
Jobs: 15,700 Jobs: 9,600 Jobs: 12,000 GDP: €1.3 Bn GDP: €0.7 Bn GDP: €0.8 Bn
TOTAL Jobs: 97,400 GDP: €6.9 Bn
At airport and airport Supplying and Employees spending Air service facilitating: related businesses supporting businesses in the economy tourism, trade, investment, productivity Jobs: 60,100
GDP: €4.2 Bn
Executive Summary
Dublin Airport Economic Impact Study
ii

Dublin Airport Economic Impact Study iii
Analysis in this study found that Dublin Airport is one of the best connected airports in Europe and is the primary contributor to Ireland having one of the highest connectivity levels on the continent relative to the size of its economy.
Air connectivity is essential in the international marketplace and it is fundamentally about access to markets and destinations. This is particularly the case for Ireland as a small open economy positioned on the western tip of Europe. Air access is critical for Ireland’s economic development. Dublin Airport’s pre-eminent position in the Irish aviation sector delivers the critical mass required to attract the necessary services to key short and long-haul destinations for both business and leisure markets. Direct connections are essential for both expanding Irish export trade and growing Foreign Direct Investment (FDI) in Ireland.
Few European airports can match Dublin Airport’s connections to Ireland’s established markets of Britain and the United States. For example, in 2014 Dublin Airport served more routes and operated more frequencies to Britain than either Frankfurt or Paris Charles de Gaulle and almost as many as Amsterdam. During Summer 2014, Dublin Airport had more weekly frequencies to North America than either Munich or Zurich. In addition, Dublin Airport is developing its European links and expanding into the Middle East, Africa and beyond.
The connectivity of Dublin against its peer airports was analysed using the IATA connectivity index, which measures the quality of the air transport network from the point of view of the country’s economy. This revealed that Dublin Airport ranks 14th in Europe just behind Berlin and Dusseldorf and ahead of Stockholm, Brussels and Gatwick. Dublin ranks ahead of Gatwick, despite the latter handling considerably more passenger traffic (35.4 million vs 20.2 million at Dublin), due to Dublin’s more extensive network, especially in long-haul.
Dublin Airport’s contribution to connectivity is even more pronounced when compared against the size of its economy. Figure ES-2 shows national connectivity divided by the country’s GDP (Ireland’s connectivity index includes the combined connectivity scores of all Ireland’s airports, however, Dublin accounted for 81% of the connectivity score). As can be seen, Ireland has one of the highest GDP-adjusted connectivity scores in Europe, 50% higher than that of the UK and almost twice that of Germany. Dublin Airport alone contributes higher connectivity per Euro of GDP than either the UK or Germany. Similarly, Ireland’s connectivity on a per capita basis is above most other European nations.
This analysis demonstrates that Dublin Airport is a major hub for the country and a critical contributor to Ireland’s connectivity with the rest of the world. However, while Dublin Airport enables high levels of connectivity for Dublin and Ireland, a number of key competitor cities rank above it in terms of air connectivity (including Barcelona, Copenhagen, Berlin – see section 3.4) Given Ireland’s location in the continent, and lack of alternative transport modes, it is more important than ever that Dublin Airport continues to enhance its connectivity, particularly long-haul connectivity to emerging, high growth economies. Achieving higher connectivity will require the efforts of all airport stakeholders and will be dependent on supportive and expansive aviation policy, regulation and planning regimes. Dublin Airport must also be enabled to expand its facilities to meet demand. The dividend will be even greater economic growth and development for Dublin and Ireland, as increased air connectivity facilitates increased trade, tourism, investment and economic growth.
Dublin Airport Economic Impact Study
iii

Dublin Airport Economic Impact Study iii
Analysis in this study found that Dublin Airport is one of the best connected airports in Europe and is the primary contributor to Ireland having one of the highest connectivity levels on the continent relative to the size of its economy.
Air connectivity is essential in the international marketplace and it is fundamentally about access to markets and destinations. This is particularly the case for Ireland as a small open economy positioned on the western tip of Europe. Air access is critical for Ireland’s economic development. Dublin Airport’s pre-eminent position in the Irish aviation sector delivers the critical mass required to attract the necessary services to key short and long-haul destinations for both business and leisure markets. Direct connections are essential for both expanding Irish export trade and growing Foreign Direct Investment (FDI) in Ireland.
Few European airports can match Dublin Airport’s connections to Ireland’s established markets of Britain and the United States. For example, in 2014 Dublin Airport served more routes and operated more frequencies to Britain than either Frankfurt or Paris Charles de Gaulle and almost as many as Amsterdam. During Summer 2014, Dublin Airport had more weekly frequencies to North America than either Munich or Zurich. In addition, Dublin Airport is developing its European links and expanding into the Middle East, Africa and beyond.
The connectivity of Dublin against its peer airports was analysed using the IATA connectivity index, which measures the quality of the air transport network from the point of view of the country’s economy. This revealed that Dublin Airport ranks 14th in Europe just behind Berlin and Dusseldorf and ahead of Stockholm, Brussels and Gatwick. Dublin ranks ahead of Gatwick, despite the latter handling considerably more passenger traffic (35.4 million vs 20.2 million at Dublin), due to Dublin’s more extensive network, especially in long-haul.
Dublin Airport’s contribution to connectivity is even more pronounced when compared against the size of its economy. Figure ES-2 shows national connectivity divided by the country’s GDP (Ireland’s connectivity index includes the combined connectivity scores of all Ireland’s airports, however, Dublin accounted for 81% of the connectivity score). As can be seen, Ireland has one of the highest GDP-adjusted connectivity scores in Europe, 50% higher than that of the UK and almost twice that of Germany. Dublin Airport alone contributes higher connectivity per Euro of GDP than either the UK or Germany. Similarly, Ireland’s connectivity on a per capita basis is above most other European nations.
This analysis demonstrates that Dublin Airport is a major hub for the country and a critical contributor to Ireland’s connectivity with the rest of the world. However, while Dublin Airport enables high levels of connectivity for Dublin and Ireland, a number of key competitor cities rank above it in terms of air connectivity (including Barcelona, Copenhagen, Berlin – see section 3.4) Given Ireland’s location in the continent, and lack of alternative transport modes, it is more important than ever that Dublin Airport continues to enhance its connectivity, particularly long-haul connectivity to emerging, high growth economies. Achieving higher connectivity will require the efforts of all airport stakeholders and will be dependent on supportive and expansive aviation policy, regulation and planning regimes. Dublin Airport must also be enabled to expand its facilities to meet demand. The dividend will be even greater economic growth and development for Dublin and Ireland, as increased air connectivity facilitates increased trade, tourism, investment and economic growth.
Dublin Airport Economic Impact Study iv
Figure ES-2: Connectivity Relative to Gross Domestic Product (2013) – Top 25 Countries
Source: Based on Diio Schedule Data, Passenger Traffic Data and World Bank Data for 2013.
0.00 0.25 0.50 0.75 1.00
Poland
Belgium
France
Luxembourg
Germany
Italy
Netherlands
Sweden
Austria
United Kingdom
Romania
Czech Republic
Finland
Macedonia
Estonia
Greece
Denmark
Ukraine
Norway
Spain
Switzerland
Ireland
Croatia
Portugal
Bulgaria
Serbia
Cyprus
Connectivity per Billion Euros of GDP
Dublin's Contribution: 81%
Dublin Airport Economic Impact Study
iv

Dublin Airport Economic Impact Study v
The connectivity provided at Dublin Airport plays a critical role in the economic development of Ireland, and has contributed to increased tourism, trade, investment and productivity for the nation, and needs to be enhanced to ensure future economic growth.
Using data from the past 10-15 years, analysis in this report demonstrates a clear linkage between Dublin Airport’s connectivity and tourism, trade, FDI and GDP growth.
The relationship between the connectivity of Dublin Airport and Ireland’s export trade is illustrated in Figure ES-3. It shows the value of merchandise exports (i.e., goods) from Ireland to countries with frequent air service from Dublin (at least five times per week on a year-round basis) and to those countries with limited or no frequencies from Dublin. The value of exports with the well connected countries is five to six times that of trade with poorly connected countries. Furthermore, between 2002 and 2012, the value of exports to well-connected countries increased by 14%, but declined by 11% to poorly connected countries.
While air connectivity alone cannot create trade, it is a necessary requirement for trade development. Poor air connectivity to a country will hinder the ability to develop business contracts, service clients and to compete with businesses in better connected countries.
Figure ES-3: Ireland’s Exports and Direct Services from Dublin Airport, 2000-2012
Source: Diio Schedule Data, Central Statistics Office Ireland and U.N. Comtrade Database.
0
10
20
30
40
50
60
70
80
90
2000 2001 2002 2003 2004 2005 2006 2007 2008 2009 2010 2011 2012
Irish
Exp
orts
(€B
illio
ns)
Well Connected Countries
Poorly Connected Countries
Dublin Airport Economic Impact Study
v

Dublin Airport Economic Impact Study v
The connectivity provided at Dublin Airport plays a critical role in the economic development of Ireland, and has contributed to increased tourism, trade, investment and productivity for the nation, and needs to be enhanced to ensure future economic growth.
Using data from the past 10-15 years, analysis in this report demonstrates a clear linkage between Dublin Airport’s connectivity and tourism, trade, FDI and GDP growth.
The relationship between the connectivity of Dublin Airport and Ireland’s export trade is illustrated in Figure ES-3. It shows the value of merchandise exports (i.e., goods) from Ireland to countries with frequent air service from Dublin (at least five times per week on a year-round basis) and to those countries with limited or no frequencies from Dublin. The value of exports with the well connected countries is five to six times that of trade with poorly connected countries. Furthermore, between 2002 and 2012, the value of exports to well-connected countries increased by 14%, but declined by 11% to poorly connected countries.
While air connectivity alone cannot create trade, it is a necessary requirement for trade development. Poor air connectivity to a country will hinder the ability to develop business contracts, service clients and to compete with businesses in better connected countries.
Figure ES-3: Ireland’s Exports and Direct Services from Dublin Airport, 2000-2012
Source: Diio Schedule Data, Central Statistics Office Ireland and U.N. Comtrade Database.
0
10
20
30
40
50
60
70
80
90
2000 2001 2002 2003 2004 2005 2006 2007 2008 2009 2010 2011 2012
Irish
Exp
orts
(€B
illio
ns)
Well Connected Countries
Poorly Connected Countries
Dublin Airport Economic Impact Study vi
Catalytic impacts: the connectivity provided by Dublin Airport helps attract tourists, facilitates trade and investment, and contributes to the growth of the regional and national economy. These catalytic impacts total 60,100 jobs and €4.2 billion in GVA.
The economy of Ireland is a diversified knowledge-based economy, focusing on services and high-tech industries and dependent on trade, industry and investment. Adjusted for cost of living (purchasing power parity), the IMF ranks Ireland fifth in Europe in terms of per capita GDP, behind Luxembourg, Norway, Netherlands and Switzerland, but ahead of Germany, Sweden, the UK and France.3
A large number of factors have contributed to Ireland’s economic success – business regulations, government policy, taxation, the education and skillset of the local population, geographic location, etc. Nevertheless, the quality and range of air services available at Dublin Airport is a contributing factor. Ireland’s position as a trading and business hub would not be possible without the high degree of air connectivity provided by Dublin Airport. The air service at Dublin Airport transports high-value exports around the world and enables employees of Irish and multinational businesses to travel to clients, regional offices and global headquarters. Many of the businesses with regional headquarters in Ireland would not be located there without the mobility that Dublin Airport provides.
Analysis was undertaken to estimate the catalytic impacts of Dublin Airport. The results of this analysis are provided in Figure ES-4. It is estimated that the catalytic impacts of Dublin Airport amount to 60,100 jobs (53,100 FTEs) and €4.2 billion in GVA (equivalent to the 2.4% of national GDP).
Figure ES-4: Catalytic Impacts Facilitated by Dublin Airport
Impact Type Total Impact
Number of Jobs 60,100
Full-Time Equivalents (FTEs) 53,100
Income/Wages (€ Million) 2,109
Value-Added (€ Million) (% of national GDP)
4,155 (2.4%)
3 World Economic Outlook Database, IMF, 2013.
“The proximity of Dublin Airport to the city and the efficiency of the site is essential to our EMEA [Europe, Middle East & Africa] Headquarters given the number of staff members who travel into EMEA and other markets from Dublin. It is also critical for staff flying in from other offices to have a well-functioning, well-serviced airport at their disposal.”
Google, December 2014
Dublin Airport Economic Impact Study
vi

Dublin Airport Economic Impact Study vii
Total Impacts: combining the direct, indirect, induced and catalytic impacts, Dublin Airport generates or facilitates 97,400 jobs and contributes €6.9 billion to GDP.
The total economic impact of Dublin Airport is summarised in Figure ES-5. Including the activity directly related to the airport, the multiplier impacts that flow from it, and the other sectors of the economy facilitated by the airport, Dublin Airport contributes to the employment of 97,400 people in Ireland, equivalent to 86,200 full-time jobs, earning a total of €3.5 billion. Furthermore, a total of €6.9 billion is contributed to GDP, an amount equal to 4.0% of the national economy. To put these numbers into context, the total jobs figure (97,400) is more than the population of Limerick and about half the population of Cork.4
While these figures are substantial, it is worth considering how Ireland’s economy might look if the country did not have a hub airport of the size of Dublin Airport offering the scope of air services currently provided. At the most extreme, Ireland could have no commercial airports, instead relying on sea access to airports in the UK, or Dublin could have a small regional airport acting as a spoke for other hubs in the UK and the rest of Europe, so that passengers would have to travel via these hubs to get to many parts of the world. In such scenarios, it is easy to imagine that tourism to Ireland would be much lower, that Dublin would not be able to attract as many carriers to operate services (or to have aircraft maintained and repaired in Ireland), that the overall volume of trade would be substantially lower, and that some companies would chose not to locate or expand in Ireland. The net effect of this would be a smaller, slower-growing economy.
It should be noted that these figures are not attempting to credit Dublin Airport with creating nearly 4% of the economy. The Irish economy is far more complex than that. It clearly takes a wide range of players acting together to generate economic growth – government, business, infrastructure providers, residents, etc. For example, if no one had decided to build hotels in Ireland, tourism would also be substantially lower. What the figures do show is that without Dublin Airport, and particularly without the extensive connectivity at the airport, the Irish economy would not be as large, affluent or diverse as it is today.
Figure ES-5: Total Economic Impact Generated and Facilitated by Dublin Airport
Impact Type Jobs FTEs Income (€ Million)
GVA (€ Million)
GVA as % of National
GDP
Direct 15,700 14,000 639 1,256 0.7%
Indirect 9,600 8,500 373 717 0.4%
Induced 12,000 10,600 397 781 0.4%
Catalytic 60,100 53,100 2,109 4,155 2.4%
Total 97,400 86,200 3,518 6,909 4.0%
Numbers may not add up due to rounding.
4 Source: CSO Ireland: Census 2011 Results. Based on the population of the city and surrounding suburbs.
Dublin Airport Economic Impact Study
vii

Dublin Airport Economic Impact Study vii
Total Impacts: combining the direct, indirect, induced and catalytic impacts, Dublin Airport generates or facilitates 97,400 jobs and contributes €6.9 billion to GDP.
The total economic impact of Dublin Airport is summarised in Figure ES-5. Including the activity directly related to the airport, the multiplier impacts that flow from it, and the other sectors of the economy facilitated by the airport, Dublin Airport contributes to the employment of 97,400 people in Ireland, equivalent to 86,200 full-time jobs, earning a total of €3.5 billion. Furthermore, a total of €6.9 billion is contributed to GDP, an amount equal to 4.0% of the national economy. To put these numbers into context, the total jobs figure (97,400) is more than the population of Limerick and about half the population of Cork.4
While these figures are substantial, it is worth considering how Ireland’s economy might look if the country did not have a hub airport of the size of Dublin Airport offering the scope of air services currently provided. At the most extreme, Ireland could have no commercial airports, instead relying on sea access to airports in the UK, or Dublin could have a small regional airport acting as a spoke for other hubs in the UK and the rest of Europe, so that passengers would have to travel via these hubs to get to many parts of the world. In such scenarios, it is easy to imagine that tourism to Ireland would be much lower, that Dublin would not be able to attract as many carriers to operate services (or to have aircraft maintained and repaired in Ireland), that the overall volume of trade would be substantially lower, and that some companies would chose not to locate or expand in Ireland. The net effect of this would be a smaller, slower-growing economy.
It should be noted that these figures are not attempting to credit Dublin Airport with creating nearly 4% of the economy. The Irish economy is far more complex than that. It clearly takes a wide range of players acting together to generate economic growth – government, business, infrastructure providers, residents, etc. For example, if no one had decided to build hotels in Ireland, tourism would also be substantially lower. What the figures do show is that without Dublin Airport, and particularly without the extensive connectivity at the airport, the Irish economy would not be as large, affluent or diverse as it is today.
Figure ES-5: Total Economic Impact Generated and Facilitated by Dublin Airport
Impact Type Jobs FTEs Income (€ Million)
GVA (€ Million)
GVA as % of National
GDP
Direct 15,700 14,000 639 1,256 0.7%
Indirect 9,600 8,500 373 717 0.4%
Induced 12,000 10,600 397 781 0.4%
Catalytic 60,100 53,100 2,109 4,155 2.4%
Total 97,400 86,200 3,518 6,909 4.0%
Numbers may not add up due to rounding.
4 Source: CSO Ireland: Census 2011 Results. Based on the population of the city and surrounding suburbs.
Dublin Airport Economic Impact Study viii
Based on the unconstrained air traffic forecasts for the airport, and including the Dublin Airport Central campus, the total economic impact of Dublin Airport could reach an estimated 194,000 jobs and €14.4 billion in GVA by 2043, roughly double the current economic impact.
As air services at Dublin Airport grow, the economic contribution of the airport is expected to grow as well. As more aircraft take-off and land, additional staff will be needed to crew, clean and maintain the aircraft, to service passengers and transport their luggage, and to process, load and unload air cargo (i.e., the direct impacts). Air carriers and other businesses at the airport will order additional goods and services from their suppliers (indirect impacts), and the increased employment will stimulate spending in the general economy (induced impacts). In addition, the new routes and greater frequencies at Dublin Airport will help facilitate increased tourism, trade, investment and attract business to Ireland (catalytic impacts).
Analysis was undertaken to estimate the future economic impact of Dublin Airport, based on air traffic forecasts produced by daa. To do this, it was assumed that the economic impact (employment, income, GVA) associated with the airport will increase as traffic at the airport increases while allowing for significant productivity gains and economies of scale at the airport.
The economic impact estimate also includes the impact of the Dublin Airport Central development, a proposed commercial campus on airport land potentially comprising offices, retail, hotels and other facilities (documented in Section 8.2).
The estimated economic impact of Dublin Airport in 2043 is presented in Figure ES-6. Assuming airport capacity can fully accommodate demand, and including the Dublin Airport Central campus, the total economic impact of Dublin Airport is estimated to reach 194,000 jobs and €14.4 billion in GVA by 2043. This is roughly double the current economic impact of the airport.
Figure ES-6: Forecast Economic Impact of Dublin Airport, 2043 (Based on Unconstrained CENTRELINE Forecast)
Impact Type Jobs FTEs Income (€ Million)
GVA (€ Million)
Direct 40,800 38,000 1,638 3,431
Indirect 23,400 21,600 911 1,870
Induced 24,900 22,600 856 1,805
Catalytic 104,900 92,700 3,680 7,252
Total 194,000 174,900 7,086 14,359
All financial figures are in 2013 prices. Numbers may not add up due to rounding.
Dublin Airport Economic Impact Study
viii

Dublin Airport Economic Impact Study ix
A second runway at Dublin Airport is essential to enhancing the connectivity of Ireland, particularly to fast growing economies in Asia, Africa and South America. This will facilitate economic growth in the economy worth 31,200 jobs and €2.2 billion in GVA by 2043.
The forecast economic impact in Figure ES-6 assumes that there are no capacity constraints on Dublin Airport, i.e., that the airport has the necessary capacity to handle greater volumes of traffic and the capability to provide long-haul connectivity
In practice, achieving this will require the development of a second runway at Dublin Airport of sufficient length to fully enable long-haul air service. The runway will enable connections for both business exports and international tourists and enhance the potential to develop Dublin Airport as a strong secondary European hub.
Analysis was undertaken to estimate the economic impact that could be achieved with the timely development of a second runway at Dublin Airport, based on air traffic forecasts provided by daa. Figure ES-7 shows the potential economic impact that could be unlocked by 2043 if a second runway is built: the Irish economy could generate an additional 31,200 jobs and €2.2 billion in GDP by 2043, an amount equivalent to a third of the current economic impact of the airport. The majority of this economic contribution is expected to occur outside of the aviation sector – 60% of the total impact is catalytic impacts (tourism, trade, investment, etc.) and another 23% are indirect and induced impacts (supplier and spending in the wider economy).
Figure ES-7: Estimated Economic Impact of the Second Runway by 2043
Impact Type Jobs FTEs Income (€ Million)
GVA (€ Million)
Direct 5,200 4,700 212 390
Indirect 3,200 2,900 124 227
Induced 4,000 3,600 132 248
Catalytic 18,800 16,600 660 1,300
Total 31,200 27,800 1,128 2,166
All financial figures are in 2013 prices. Numbers may not add up due to rounding.
Dublin Airport Economic Impact Study
ix

Dublin Airport Economic Impact Study ix
A second runway at Dublin Airport is essential to enhancing the connectivity of Ireland, particularly to fast growing economies in Asia, Africa and South America. This will facilitate economic growth in the economy worth 31,200 jobs and €2.2 billion in GVA by 2043.
The forecast economic impact in Figure ES-6 assumes that there are no capacity constraints on Dublin Airport, i.e., that the airport has the necessary capacity to handle greater volumes of traffic and the capability to provide long-haul connectivity
In practice, achieving this will require the development of a second runway at Dublin Airport of sufficient length to fully enable long-haul air service. The runway will enable connections for both business exports and international tourists and enhance the potential to develop Dublin Airport as a strong secondary European hub.
Analysis was undertaken to estimate the economic impact that could be achieved with the timely development of a second runway at Dublin Airport, based on air traffic forecasts provided by daa. Figure ES-7 shows the potential economic impact that could be unlocked by 2043 if a second runway is built: the Irish economy could generate an additional 31,200 jobs and €2.2 billion in GDP by 2043, an amount equivalent to a third of the current economic impact of the airport. The majority of this economic contribution is expected to occur outside of the aviation sector – 60% of the total impact is catalytic impacts (tourism, trade, investment, etc.) and another 23% are indirect and induced impacts (supplier and spending in the wider economy).
Figure ES-7: Estimated Economic Impact of the Second Runway by 2043
Impact Type Jobs FTEs Income (€ Million)
GVA (€ Million)
Direct 5,200 4,700 212 390
Indirect 3,200 2,900 124 227
Induced 4,000 3,600 132 248
Catalytic 18,800 16,600 660 1,300
Total 31,200 27,800 1,128 2,166
All financial figures are in 2013 prices. Numbers may not add up due to rounding.
Dublin Airport Economic Impact Study x
Glossary of Terms and Abbreviations Catalytic Impacts Catalytic Impacts, also known as Wider Economic Benefits, captures
the way in which specific economic activities facilitates further economic or business impacts in other sectors of the economy.
Air transport creates catalytic impacts primarily through increased connectivity and improves national economic performance through the following mechanisms: tourism, trade in goods and services, investment, and increased productivity.
CSO Central Statistics Office, Ireland.
daa State owned corporation responsible for the operation and management of Dublin and Cork airports.
Direct impacts Direct Impacts arise immediately from the conduct of those entities performing the activity in question. For an airport, the “direct impacts” would include the activities of airlines, the airport itself, forwarders, ground handling agents, and other firms whose principal business involves commercial aviation.
E/D Passengers Enplaned/deplaned passengers. A measure of passenger volume that counts each passenger who enplanes or deplanes an aircraft.
Economic Impact Economic impact is a measure of the employment, spending and economic activity associated with a business, a sector of the economy, a specific project (such as the construction of a new facility), or a change in government policy or regulation.
FDI Foreign Direct Investment. Investment from one country into another (normally by companies rather than governments) that involves establishing operations or acquiring tangible assets, including stakes in other businesses.
FTE A full-time equivalent (FTE) year of employment is equivalent to the number of hours that an individual would work on a full-time basis for one year (also known as a person year). FTEs are useful because part-time and seasonal workers do not account for one full-time job.
GDP Gross Domestic Product, a measure of the total output of an economy.
GVA Gross Value Added (GVA) – the value of the operating surpluses of business linked to Dublin Airport, plus the income/wages of employees and consumption of fixed capital. GVA is broadly equivalent to Gross Domestic Product (GDP), whereby the value-added of each industry sums to the total GDP of an economy.
Dublin Airport Economic Impact Study
x

Dublin Airport Economic Impact Study xi
I-O Model Input-Output (I-O) model. A representation of the flows of economic activity within a region or country. An I-O model captures what each business or sector must purchase from every other sector in order to produce a dollar's worth of goods or services.
Indirect impacts Indirect Impacts involve the supply chain of the businesses or entities conducting the primary activity (i.e., those included in the direct impact). The airlines at an airport purchase fuel which has been refined at a plant and transported to the airport by pipe or truck. Catering companies at the airport buy food from wholesalers. The items purchased can be used for many purposes besides commercial aviation, and would usually occur off site. The materials support the primary aviation activity, although they could be used for many purposes.
Induced impacts Induced impacts capture the economic activity generated by the employees of firms directly or indirectly connected to the airport spending their income in the national economy. For example, an airline employee might spend his/her income on groceries, restaurants, child care, dental services, home renovations and other items which, in turn, generate employment in a wide range of sectors of the general economy.
Low Cost Carrier (LCC)
Also known as low fares, no-frills or budget carriers. These are airlines that generally have lower fares and fewer amenities than network or legacy carriers. Although there is considerable variation in the business models, low cost carriers typically operate a single aircraft type (to reduce training and maintenance costs), do not offer first or business class travel, do not provide in-flight services such as meals and entertainment (or offer them at additional charge), and focus on point-to-point travel offering limited connecting options. Examples in Europe include EasyJet, Ryanair, Wizz Air, Norwegian Air Shuttle and Vueling.
Multiplier Impacts Economic multipliers are used to infer indirect and induced effects from a particular sector of the economy. These are typically derived from an Input-Output model. See Chapter 2 and Appendix E for detailed information on how multiplier impacts were derived in this study.
Wider Economic Benefits
See Catalytic Impacts.
Dublin Airport Economic Impact Study
xi

Dublin Airport Economic Impact Study xi
I-O Model Input-Output (I-O) model. A representation of the flows of economic activity within a region or country. An I-O model captures what each business or sector must purchase from every other sector in order to produce a dollar's worth of goods or services.
Indirect impacts Indirect Impacts involve the supply chain of the businesses or entities conducting the primary activity (i.e., those included in the direct impact). The airlines at an airport purchase fuel which has been refined at a plant and transported to the airport by pipe or truck. Catering companies at the airport buy food from wholesalers. The items purchased can be used for many purposes besides commercial aviation, and would usually occur off site. The materials support the primary aviation activity, although they could be used for many purposes.
Induced impacts Induced impacts capture the economic activity generated by the employees of firms directly or indirectly connected to the airport spending their income in the national economy. For example, an airline employee might spend his/her income on groceries, restaurants, child care, dental services, home renovations and other items which, in turn, generate employment in a wide range of sectors of the general economy.
Low Cost Carrier (LCC)
Also known as low fares, no-frills or budget carriers. These are airlines that generally have lower fares and fewer amenities than network or legacy carriers. Although there is considerable variation in the business models, low cost carriers typically operate a single aircraft type (to reduce training and maintenance costs), do not offer first or business class travel, do not provide in-flight services such as meals and entertainment (or offer them at additional charge), and focus on point-to-point travel offering limited connecting options. Examples in Europe include EasyJet, Ryanair, Wizz Air, Norwegian Air Shuttle and Vueling.
Multiplier Impacts Economic multipliers are used to infer indirect and induced effects from a particular sector of the economy. These are typically derived from an Input-Output model. See Chapter 2 and Appendix E for detailed information on how multiplier impacts were derived in this study.
Wider Economic Benefits
See Catalytic Impacts.
Dublin Airport Economic Impact Study xii
Contents
1 Introduction ............................................................................................................ 1
1.1 What is Economic Impact? ................................................................................ 2 1.2 Categories of Economic Impact ......................................................................... 2
2 Methodology for the Economic Impact Study ...................................................... 6
2.1 Surveying Direct Impacts ................................................................................... 6 2.2 Inferring Employment ........................................................................................ 7 2.3 Full-Time Equivalent Jobs ................................................................................. 7 2.4 Economic Multipliers ......................................................................................... 7 2.5 Study Time Frame ............................................................................................. 9
3 Overview of Dublin Airport .................................................................................. 10
3.1 Air Passenger Movements .............................................................................. 10 3.2 Air Cargo and Aircraft Movements ................................................................... 12 3.3 Overview of Dublin Airport’s Air Services ........................................................ 14 3.4 Measuring Airport Connectivity ........................................................................ 18
4 Direct Employment Impacts of Airport Activity ................................................. 25
4.1 Overall Direct Employment .............................................................................. 25 4.2 Direct Employment by Business Type ............................................................. 27 4.3 Direct Employment by Occupation................................................................... 29 4.4 Direct Employment by Location ....................................................................... 30
5 Indirect and Induced Impacts of Airport Activity ............................................... 31
5.1 Overall Multiplier Impacts of Dublin Airport ...................................................... 31 5.2 Multiplier Impacts by Region............................................................................ 33
6 Facilitating the Wider Economy – The Catalytic Impact of Dublin Airport ....... 35
6.1 Overview of Catalytic Impacts ......................................................................... 36 6.2 Linkage Between Dublin Airport’s Connectivity and the Economy ................... 41 6.3 Estimating the Catalytic Impact of Dublin Airport ............................................. 48 6.4 Breakdowns of the Catalytic Impacts by Region .............................................. 51
7 Summary: Total Economic Impact of Dublin Airport ......................................... 52
8 The Future Economic Impact of Dublin Airport ................................................. 55
8.1 Forecast Traffic Development at Dublin Airport ............................................... 56 8.2 Estimating the Economic Impact of Dublin Airport
Under the Unconstrained Forecasts ................................................................ 58 8.3 The Traffic and Connectivity Benefits of Building a Second Runway ............... 64 8.4 The Economic Impact of a Second Runway .................................................... 68
Dublin Airport Economic Impact Study
xii

Dublin Airport Economic Impact Study xiii
Appendix A: Employment Survey Sample ................................................................ 70
Appendix B: Sample Survey Form ............................................................................. 71
Appendix C: Calculating Inferred Employment ........................................................ 79
Appendix D: Calculation of Full-Time Equivalent Jobs ............................................ 80
Appendix E: Further Information on the Input-Output Tables and the Economic Multipliers .................................................................................... 81
Dublin Airport Economic Impact Study
xiii

Dublin Airport Economic Impact Study xiii
Appendix A: Employment Survey Sample ................................................................ 70
Appendix B: Sample Survey Form ............................................................................. 71
Appendix C: Calculating Inferred Employment ........................................................ 79
Appendix D: Calculation of Full-Time Equivalent Jobs ............................................ 80
Appendix E: Further Information on the Input-Output Tables and the Economic Multipliers .................................................................................... 81
Dublin Airport Economic Impact Study 1
1 Introduction daa commissioned InterVISTAS Consulting Ltd. to conduct an economic impact study of Dublin Airport.5 This report documents the methodology and findings of the study, and is structured as follows:
Chapter 2 outlines the methodology used to estimate the economic impact of Dublin Airport.
Chapter 3 presents an overview of the traffic activity at Dublin Airport and the global connectivity it provides for Ireland.
Chapter 4 provides the economic impact directly generated by the activities at Dublin Airport.
Chapter 5 provides estimate of the down-stream multiplier impacts (indirect and induced impacts) generated by the activities at Dublin Airport.
Chapter 6 discusses the catalytic impacts facilitated by air service at Dublin Airport and provides an estimate of the economic contribution to Ireland.
Chapter 7 totalises the economic impact of Dublin Airport, including direct, indirect, induced and catalytic impacts.
Chapter 8 contains forecasts of the future economic impact of the airport, based on traffic forecasts up to 2034, and the estimated economic impact that could be forgone if airport capacity is not allowed to fully accommodate demand.
Additional details are provided in the appendices. Key Points text boxes are provided are the start of Chapters 3 to 8 that summarise the key points in each chapter.
As part of the study process, meetings were held with a number of stakeholders:
Irish Business and Employers’ Confederation (IBEC) Tourism Ireland Dublin Chamber of Commerce Fingal County Council Irish Tourism Industry Confederation Irish Exporters Association Enterprise Ireland / IDA Ireland
In addition, other businesses and organisations were contacted regarding their use and requirements of Dublin Airport. The insights of these various organisations regarding the impact and importance of Dublin Airport are provided throughout this report.
5 daa is a state owned corporation responsible for the operation and management of Dublin and Cork airports.
Dublin Airport Economic Impact Study
1

Dublin Airport Economic Impact Study 2
1.1 What is Economic Impact? Economic impact is a measure of the employment, spending and economic activity associated with a business, a sector of the economy, a specific project (such as the construction of a new facility), or a change in government policy or regulation. In this case, economic impact refers to the economic contribution associated with the ongoing activities at Dublin Airport. Economic impact can be measured in a number of ways:
Employment – the number of people employed by businesses involved in activities linked to Dublin Airport.
Income/Wages – the wages and salaries earned by the people employed in activities linked to Dublin Airport.
Gross Value Added (GVA) – the income/wages of employees above plus the operating surpluses of business linked to Dublin Airport and the consumption of fixed capital. GVA is broadly equivalent to Gross Domestic Product (GDP), whereby the value-added of each industry sums to the total GDP of an economy.6
It should be borne in mind that these measures attempt to assess the gross level of activity or expenditure associated with Dublin Airport. As such, they are not “net” measures that weigh benefits against costs, but nevertheless these measures can be useful in demonstrating the economic contribution of the airport.
1.2 Categories of Economic Impact There are four distinct types or categories of economic impact associated with airports, as described below.
1.2.1 Direct Economic Impact This is the employment, income and GDP associated with the operation and management of activities at Dublin Airport including firms on-site at the airport and airport-related businesses located elsewhere near the airport. This includes activities by the airport operator, the airlines, air traffic control, fixed base operators (General Aviation), ground handlers, airport security, immigration and customs, aircraft maintenance, etc.
While a straight-forward definition of the direct airport economic impact would be the activities and businesses located at the airport, this would not reflect the full extent of the airport’s economic base. Other businesses closely connected to airport activities are not based at the airport (or only partially based at the airport), such as aircraft maintenance, logistics operators, aircraft parts suppliers, etc. These businesses would not exist, or would be much smaller, without the activities at the airport. Therefore, off-airport businesses closely linked to airport activities were also included as part of the direct economic impact.
6 GDP is the sum of the GVA of all industries plus taxes less subsidies on production.
Dublin Airport Economic Impact Study
2

Dublin Airport Economic Impact Study 2
1.1 What is Economic Impact? Economic impact is a measure of the employment, spending and economic activity associated with a business, a sector of the economy, a specific project (such as the construction of a new facility), or a change in government policy or regulation. In this case, economic impact refers to the economic contribution associated with the ongoing activities at Dublin Airport. Economic impact can be measured in a number of ways:
Employment – the number of people employed by businesses involved in activities linked to Dublin Airport.
Income/Wages – the wages and salaries earned by the people employed in activities linked to Dublin Airport.
Gross Value Added (GVA) – the income/wages of employees above plus the operating surpluses of business linked to Dublin Airport and the consumption of fixed capital. GVA is broadly equivalent to Gross Domestic Product (GDP), whereby the value-added of each industry sums to the total GDP of an economy.6
It should be borne in mind that these measures attempt to assess the gross level of activity or expenditure associated with Dublin Airport. As such, they are not “net” measures that weigh benefits against costs, but nevertheless these measures can be useful in demonstrating the economic contribution of the airport.
1.2 Categories of Economic Impact There are four distinct types or categories of economic impact associated with airports, as described below.
1.2.1 Direct Economic Impact This is the employment, income and GDP associated with the operation and management of activities at Dublin Airport including firms on-site at the airport and airport-related businesses located elsewhere near the airport. This includes activities by the airport operator, the airlines, air traffic control, fixed base operators (General Aviation), ground handlers, airport security, immigration and customs, aircraft maintenance, etc.
While a straight-forward definition of the direct airport economic impact would be the activities and businesses located at the airport, this would not reflect the full extent of the airport’s economic base. Other businesses closely connected to airport activities are not based at the airport (or only partially based at the airport), such as aircraft maintenance, logistics operators, aircraft parts suppliers, etc. These businesses would not exist, or would be much smaller, without the activities at the airport. Therefore, off-airport businesses closely linked to airport activities were also included as part of the direct economic impact.
6 GDP is the sum of the GVA of all industries plus taxes less subsidies on production.
Dublin Airport Economic Impact Study 3
1.2.2 Indirect Economic Impact The employment, income and GDP generated by down-stream industries that supply and support the activities at Dublin Airport. For example, these include: wholesalers providing food for inflight catering, oil refining activities for jet fuel, companies providing accounting and legal services to airlines, travel agents booking flights, etc.
1.2.3 Induced Economic Impact This captures the economic activity generated by the employees of firms directly or indirectly connected to the airport spending their income in the national economy. For example, an airline employee might spend his/her income on groceries, restaurants, child care, dental services, home renovations and other items which, in turn, generate employment in a wide range of sectors of the general economy.
1.2.4 Catalytic Economic Impacts
7
While the economic impact described above can be seen as down-stream impacts resulting from activities at Dublin, catalytic impacts (also known as Wider Economic Benefits) capture the way in which the airport facilitates the business of other sectors of the economy. As such, air transportation facilitates employment and economic development in the national economy through a number of mechanisms:
Tourism. Air service facilitates the arrival of larger numbers of tourists to a region or country. This includes business as well as leisure tourists. The spending of these tourists can support a wide range of tourism-related businesses: hotels, restaurants, theatres, car rentals, etc. Of course, air service also facilitates outbound tourism, which can be viewed as reducing the amount of money spent in an economy. However, even outbound tourism involves spending in the home economy, on travel agents, taxis, etc. In any case, it is not necessarily the case that money spent by tourists flying abroad would be spent on tourism at home if there were no air service.
Trade in Goods and Services. Although air cargo accounts for 1% of the volume of Ireland’s export shipments, it accounts for over 33% of exports by value, meaning that air cargo is high value, often times perishable or time-sensitive.8 Both the trade of goods and the trade of services are facilitated by passenger air services. Face-to-face
7 http://www.aviationreg.ie/_fileupload/2014ddresponses/2014-07-31%20IBEC.pdf. 8 Source: Irish Exporters Association: http://www.atag.org/.
“The efficient movement of people and goods will be central to Ireland's economic recovery and the timely delivery of enhanced airport infrastructure has a major contribution to make in this regard. As an island nation that does not benefit from a land connection to continental Europe, Ireland relies heavily on the aviation sector and Dublin Airport in particular.”
Irish Business and Employers’ Confederation (IBEC), July 2014 7
Dublin Airport Economic Impact Study
3
Dublin Airport Economic Impact Study 4
meetings play a crucial role in making sales and delivering services and support. The ability be at a client’s side rapidly and cost-effectively is important to many industries. Much of the time, these functions cannot be replaced by teleconferencing or other forms of communication. Air transport connects businesses to a wide range of global markets, providing a significantly larger customer base for their products than would be accessible otherwise. It is particularly important for high-tech and knowledge-based sectors, and suppliers of time-sensitive goods.
Investment. Air connectivity is important in attracting international business headquarters and foreign investment into a country. A key factor many companies take into account when making decisions about the location of offices, manufacturing plants or warehouses is proximity of an international airport. Therefore, airports are essential assets for regions wishing to expand industrial activity. Their proximity encourages industrial development. Industries choose to locate close to airports in order to gain easy access to air transport and the associated infrastructure
Productivity. Air transportation offers access to new markets, which in turn enable businesses to achieve greater economies of scale; inward investment can enhance the productivity of the labour force (e.g., state-of-the-art manufacturing facilities); air access also enables companies to attract and retain high quality employees. All of these factors contribute to enhanced productivity, which in turn increases the national income.
In effect, the catalytic impact of aviation is to increase the productive potential of the economy (in economist terms, moving the production–possibility frontier). Improvements in aviation connectivity enable economies to attract more tourists, conduct more trade and draw more foreign investment. The overall effect of all these mechanisms is an increase in employment and GDP. Without effective air transportation links, it is much harder for economies to attract tourists, to conduct trade and attract investment from other countries. As a result, the country’s economy and employment potential would suffer.
It should be noted that catalytic impacts are not a simple matter of the airport generating employment and economic activity in the same way that direct, indirect and induced impacts arise. National economies are far more complex than that. It clearly takes a wide range of players acting together to generate economic growth – government, business, infrastructure providers, residents, etc. For example, providing air connectivity alone does not guarantee large volumes of tourists. There also needs to be hotels, restaurants, retail, entertainment, etc. to make a destination an attractive tourism destination. Nevertheless, without convenient air services, a destination will find it more difficult to attract tourists.
What the catalytic impacts capture is that without efficient airports and the air services they support, the economy would not be as large or affluent. Thus, catalytic impacts are about the economic value and employment that airports facilitate rather than generate. The
Dublin Airport Economic Impact Study
4

Dublin Airport Economic Impact Study 4
meetings play a crucial role in making sales and delivering services and support. The ability be at a client’s side rapidly and cost-effectively is important to many industries. Much of the time, these functions cannot be replaced by teleconferencing or other forms of communication. Air transport connects businesses to a wide range of global markets, providing a significantly larger customer base for their products than would be accessible otherwise. It is particularly important for high-tech and knowledge-based sectors, and suppliers of time-sensitive goods.
Investment. Air connectivity is important in attracting international business headquarters and foreign investment into a country. A key factor many companies take into account when making decisions about the location of offices, manufacturing plants or warehouses is proximity of an international airport. Therefore, airports are essential assets for regions wishing to expand industrial activity. Their proximity encourages industrial development. Industries choose to locate close to airports in order to gain easy access to air transport and the associated infrastructure
Productivity. Air transportation offers access to new markets, which in turn enable businesses to achieve greater economies of scale; inward investment can enhance the productivity of the labour force (e.g., state-of-the-art manufacturing facilities); air access also enables companies to attract and retain high quality employees. All of these factors contribute to enhanced productivity, which in turn increases the national income.
In effect, the catalytic impact of aviation is to increase the productive potential of the economy (in economist terms, moving the production–possibility frontier). Improvements in aviation connectivity enable economies to attract more tourists, conduct more trade and draw more foreign investment. The overall effect of all these mechanisms is an increase in employment and GDP. Without effective air transportation links, it is much harder for economies to attract tourists, to conduct trade and attract investment from other countries. As a result, the country’s economy and employment potential would suffer.
It should be noted that catalytic impacts are not a simple matter of the airport generating employment and economic activity in the same way that direct, indirect and induced impacts arise. National economies are far more complex than that. It clearly takes a wide range of players acting together to generate economic growth – government, business, infrastructure providers, residents, etc. For example, providing air connectivity alone does not guarantee large volumes of tourists. There also needs to be hotels, restaurants, retail, entertainment, etc. to make a destination an attractive tourism destination. Nevertheless, without convenient air services, a destination will find it more difficult to attract tourists.
What the catalytic impacts capture is that without efficient airports and the air services they support, the economy would not be as large or affluent. Thus, catalytic impacts are about the economic value and employment that airports facilitate rather than generate. The
Dublin Airport Economic Impact Study 5
connectivity enabled by airports is not sufficient on its own to fully support economic activity, but it a necessary element of economic growth and development. 9
In discussing catalytic impacts, the issue of causality often arises. For example, while air service can facilitate trade, it is also true that increased trade leads to increased demand for air services. This study recognises that there is a two-way relationship between air connectivity and economic growth. Economic growth stimulates demand for air services while at the same time, these air services open up new opportunities for tourism, trade, business development, etc. This in turn can stimulate further demand for air services, and so on, in a “virtuous cycle”. The analysis in this study uses parameters that control for this two-way relationship.
Catalytic impacts are discussed in greater detail in Chapter 6. These four categories of impacts are summarised in Figure 1-1.
Figure 1-1: Categories of Economic Impact Generated or Facilitated by Dublin Airport
9 In many parts of the world, airports are also the contributors of some of the other necessary elements for catalytic growth. Various airports have developed their own economic and urban hubs, which can comprise of hotels, offices, entertainment, and other commercial developments, which benefit from the adjacent air connectivity provided by the airport.
DIRECT INDIRECT INDUCED CATALYTIC At airport and airport Supplying and Employees Air service related businesses supporting spending facilitating: businesses economy - tourism - trade - investment - productivity growth
Dublin Airport Economic Impact Study
5

Dublin Airport Economic Impact Study 6
2 Methodology for the Economic Impact Study
This chapter describes the methodology and sources that were used to measure the economic impact of Dublin Airport. Results of this are provided in Chapter 4.
2.1 Surveying Direct Impacts The primary tool for estimating the economic impact of Dublin Airport was an employment survey. This was augmented by data from government and airport sources. Employment attributable to airport operations was measured by surveying businesses located at Dublin Airport, plus offsite businesses economically linked to the airport, along with ground transportation firms. A total of 157 firms were contacted for the survey. These businesses included passenger and cargo airlines, courier/integrators, ground handlers, government agencies, aircraft maintenance firms, air cargo, warehousing and logistics, car rental firms, hotels, airport retailers. While information on individual respondents is not provided in this report, in order to preserve the confidentiality of the respondents, further detail on the type and location of businesses surveyed is provided in Appendix A.
The survey questionnaire collected information on:
Type of business Employment at the firm, broken down into full-time, part-time and temporary Annual payroll or average salary per employee Breakdown of employment by type of job Proportion of the firm’s business related to the airport (as some businesses may also
conduct business not related to the airport)10 Proportion of business related to air cargo (where relevant) Expenditures on goods and services and the geographic location of that expenditure
The surveyed firms were asked to provide information for calendar year 2013 wherever possible. An example of the survey questionnaire is provided in Appendix B.
The questionnaires were initially sent out by email. Telephone follow-up was conducted to increase the response rate. Particular effort was made to ensure that survey responses were obtained from known large employers such as airlines, ground handling and aircraft maintenance. There was a strong response to the survey, with two thirds (66%) of the firms contacted providing information, these firms representing an estimated 86% of total employment represented in the survey.
10 Off-site employment reported by the businesses was scaled down by the percentage reported in the survey, to ensure that only airport-related employment was represented.
Dublin Airport Economic Impact Study
6

Dublin Airport Economic Impact Study 6
2 Methodology for the Economic Impact Study
This chapter describes the methodology and sources that were used to measure the economic impact of Dublin Airport. Results of this are provided in Chapter 4.
2.1 Surveying Direct Impacts The primary tool for estimating the economic impact of Dublin Airport was an employment survey. This was augmented by data from government and airport sources. Employment attributable to airport operations was measured by surveying businesses located at Dublin Airport, plus offsite businesses economically linked to the airport, along with ground transportation firms. A total of 157 firms were contacted for the survey. These businesses included passenger and cargo airlines, courier/integrators, ground handlers, government agencies, aircraft maintenance firms, air cargo, warehousing and logistics, car rental firms, hotels, airport retailers. While information on individual respondents is not provided in this report, in order to preserve the confidentiality of the respondents, further detail on the type and location of businesses surveyed is provided in Appendix A.
The survey questionnaire collected information on:
Type of business Employment at the firm, broken down into full-time, part-time and temporary Annual payroll or average salary per employee Breakdown of employment by type of job Proportion of the firm’s business related to the airport (as some businesses may also
conduct business not related to the airport)10 Proportion of business related to air cargo (where relevant) Expenditures on goods and services and the geographic location of that expenditure
The surveyed firms were asked to provide information for calendar year 2013 wherever possible. An example of the survey questionnaire is provided in Appendix B.
The questionnaires were initially sent out by email. Telephone follow-up was conducted to increase the response rate. Particular effort was made to ensure that survey responses were obtained from known large employers such as airlines, ground handling and aircraft maintenance. There was a strong response to the survey, with two thirds (66%) of the firms contacted providing information, these firms representing an estimated 86% of total employment represented in the survey.
10 Off-site employment reported by the businesses was scaled down by the percentage reported in the survey, to ensure that only airport-related employment was represented.
Dublin Airport Economic Impact Study 7
2.2 Inferring Employment Employment was “inferred” for firms that did not respond to the survey by using other information sources, such as annual reports, or using information on similar firms that did respond to the survey. For example, if 15 retailers were sent surveys but only 10 returned them, and other information on these firms was not available, an average employment figure was derived from the responding firms. The employment number was the mean total employment of the responding firms excluding the highest and lowest employers (to avoid the mean being skewed by outliers). Further details are provided in Appendix C.
There may be firms which were not surveyed simply because it was not known that they existed. We do not include an estimate of employment for such unidentified firms because there is no basis for an assessment. In any event, we expect most of these to be very small in terms of missed employment.
2.3 Full-Time Equivalent Jobs Often employment is measured by counting the number of jobs. However, when part-time and/or temporary workers are used, this can be a misleading measure resulting in an overstatement of economic impact. For example, one firm with 100 part-time employees may have a smaller overall economic impact than another firm with 100 full-time employees.
Therefore, the employment estimate was converted to full-time equivalents (FTEs), where the employment is weighted according to the number of hour typically worked. For example, 100 part-time employees working 20 hours a week would equate to approximately 50 FTEs. Further details can be found in Appendix D.
Whenever possible, employment impacts are provided both in terms of the number of jobs and the number of FTEs.
2.4 Economic Multipliers While the direct employment and income/salary impacts of Dublin Airport were based on survey information, such an approach is not practical for estimating indirect and induced economic impacts. While it might be possible to conduct a survey of businesses impacted indirectly, the survey would need to cover thousands of companies. For induced employment, the entire economy would need to be scrutinised. In addition to the time and financial resources needed to conduct such surveys, the quality of responses may not be robust.
As an alternative to such surveys, indirect and induced effects were estimated using economic multipliers, as is common practice for economic impact studies. In addition, the direct value-added (GVA) impacts were also estimated using economic multipliers.
These multipliers were based on the Input-Output model of the Irish economy maintained by the Central Statistics Office (CSO) Ireland. An Input-Output (I-O) model is a representation of the flows of economic activity within a region or country. The model captures what each business or sector must purchase from every other sector in order to produce a Euro’s worth of goods or services. Using such a model, flows of economic activity associated with any
Dublin Airport Economic Impact Study
7
Dublin Airport Economic Impact Study 8
change in spending may be traced either forwards (spending generating income which induces further spending) or backwards (visitor purchases of meals leads restaurants to purchase additional inputs - groceries, utilities, etc.). By tracing these linkages between sectors, I-O models can estimate indirect and induced impacts. These indirect and induced impacts are represented by economic multipliers, normally expressed as a ratio of total impacts (i.e., direct plus indirect plus induced) to direct impacts. Using the I-O model, multipliers can be produced for employment, remuneration, valued-added and economic output, normally expressed in terms of a unit of direct impact (e.g., per dollar of direct economic output).
The size of these economic multipliers is a function of a number of factors:
The nature of the industry or economic sector under consideration. Multipliers vary across different industries within the economy based on the mix of labour and other inputs, and the propensity of each industry to buy goods and services from within the economy. Some industries require large amounts of goods and services from other sectors of the economy and therefore have large multiplier impacts. Other sectors are more labour intensive and require fewer inputs from other sectors of the economy, resulting in smaller multiplier impacts.11
The amount of imports needed as an input to production. Industries or economic sectors that require large amount of imports have lower multiplier impacts as this part of the spending goes outside of the national economy (in essence, this part of the multiplier impact is occurring in another country).
Propensity to consume domestic goods. The spending patterns of consumers in the national economy will affect the induced impacts. The greater the propensity to consume domestically produced goods and services, the greater is the multiplier effect. Similarly, higher spending on imports or higher savings rates will dampen the induced multiplier.12
Government taxation and spending has a complex influence on the size of the multiplier impacts. Higher taxation rates can dampen multiplier impacts, although this can be offset by how the government chooses to spend these tax revenues.
The multipliers used in this study were based on the 2010 Input-Output tables (the I-O model output) produced by the Central Statistics Office Ireland.13 These were the most current I-O tables available at the time of the study. The economic multipliers developed from the I-O tables have been updated to reflect 2013 price levels, but no structural changes have been assumed. Structural changes might include changes in the input purchases of certain industries (e.g., consuming more or less goods and services from other industries for each unit of output, or purchasing more or less imports), changes in tax rates, and changes in the
11 In such a case, the indirect impacts may be smaller than the induced impacts, as induced impacts are based on the spending of labour income. 12 In the case of savings, this is a function of the time period examined. The multiplier impacts capture the economic impact occurring in a particular year. Savings represent deferred spending that will occur at some time in the future. However, there is not reliable technique for estimating these longer term multiplier impacts. 13 The 2010 I-O tables can be found here: http://www.cso.ie/en/releasesandpublications/ep/p-sauio/supplyanduseandinput-outputtablesforireland2010/#.VFdqprkfyM8.
Dublin Airport Economic Impact Study
8

Dublin Airport Economic Impact Study 8
change in spending may be traced either forwards (spending generating income which induces further spending) or backwards (visitor purchases of meals leads restaurants to purchase additional inputs - groceries, utilities, etc.). By tracing these linkages between sectors, I-O models can estimate indirect and induced impacts. These indirect and induced impacts are represented by economic multipliers, normally expressed as a ratio of total impacts (i.e., direct plus indirect plus induced) to direct impacts. Using the I-O model, multipliers can be produced for employment, remuneration, valued-added and economic output, normally expressed in terms of a unit of direct impact (e.g., per dollar of direct economic output).
The size of these economic multipliers is a function of a number of factors:
The nature of the industry or economic sector under consideration. Multipliers vary across different industries within the economy based on the mix of labour and other inputs, and the propensity of each industry to buy goods and services from within the economy. Some industries require large amounts of goods and services from other sectors of the economy and therefore have large multiplier impacts. Other sectors are more labour intensive and require fewer inputs from other sectors of the economy, resulting in smaller multiplier impacts.11
The amount of imports needed as an input to production. Industries or economic sectors that require large amount of imports have lower multiplier impacts as this part of the spending goes outside of the national economy (in essence, this part of the multiplier impact is occurring in another country).
Propensity to consume domestic goods. The spending patterns of consumers in the national economy will affect the induced impacts. The greater the propensity to consume domestically produced goods and services, the greater is the multiplier effect. Similarly, higher spending on imports or higher savings rates will dampen the induced multiplier.12
Government taxation and spending has a complex influence on the size of the multiplier impacts. Higher taxation rates can dampen multiplier impacts, although this can be offset by how the government chooses to spend these tax revenues.
The multipliers used in this study were based on the 2010 Input-Output tables (the I-O model output) produced by the Central Statistics Office Ireland.13 These were the most current I-O tables available at the time of the study. The economic multipliers developed from the I-O tables have been updated to reflect 2013 price levels, but no structural changes have been assumed. Structural changes might include changes in the input purchases of certain industries (e.g., consuming more or less goods and services from other industries for each unit of output, or purchasing more or less imports), changes in tax rates, and changes in the
11 In such a case, the indirect impacts may be smaller than the induced impacts, as induced impacts are based on the spending of labour income. 12 In the case of savings, this is a function of the time period examined. The multiplier impacts capture the economic impact occurring in a particular year. Savings represent deferred spending that will occur at some time in the future. However, there is not reliable technique for estimating these longer term multiplier impacts. 13 The 2010 I-O tables can be found here: http://www.cso.ie/en/releasesandpublications/ep/p-sauio/supplyanduseandinput-outputtablesforireland2010/#.VFdqprkfyM8.
Dublin Airport Economic Impact Study 9
consumption patterns. Such structural changes could result in smaller or larger multiplier impacts depending on the nature of the change. However, there was not data available to suggest what structure changes may have occurred or to conduct the necessary updating.
As with any model of a complex economy, I-O models have their limitations. For example, I-O models assume constant returns to scale (i.e., no economies or diseconomies of scale) and a fixed input structure with no substitution of inputs (e.g., one fuel type cannot be substituted for another). Furthermore, due to the large amount of data collection and analysis required, the I-O data can be released several years after the period on which they are based, so may not precisely represent current conditions. Nevertheless, I-O models are the most widely accepted and well-established means for estimating multiplier impacts and are based on data unparalleled in its detail and breadth.
Further details on the I-O tables, including the derivation of the multipliers, are provided in Appendix E.
2.5 Study Time Frame The employment survey was conducted between October and November 2014 and the results reflect employment and financial information for calendar year 2013.
Dublin Airport Economic Impact Study
9

Dublin Airport Economic Impact Study 10
3 Overview of Dublin Airport Key Points Passenger traffic at Dublin Airport reached 21.7 million in 2014. Dublin Airport is the 14th best connected airport in Europe. It is particularly strong in
connections to the United States and Britain. Dublin Airport has direct service to 38 countries on four continents, including 26 out of
28 EU countries. Home base for two major carriers: Ryanair and Aer Lingus. The airport is a primary contributor to Ireland having one of the highest connectivity
levels on the continent relative to the size of its economy. This connectivity is critical to the economic development of Ireland, including trade,
tourism, FDI and business location decisions.
Dublin Airport, operated by daa, is the largest airport in the Republic of Ireland (and the largest on the island of Ireland). Located approximately 6 miles north of the centre of Dublin in the county of Fingal, the airport is the home base for Aer Lingus, Stobart Air (who operates regional services for Aer Lingus out of Dublin) and Ryanair.
3.1 Air Passenger Movements Passenger traffic at the airport has seen periods of growth and contraction over the past eleven years, as shown in Figure 3-1. Between 2000 and 2008, passenger movements at Dublin Airport increased from 13.7 million to 23.5 million, an average growth rate of 6.9% per annum. In 2009 and 2010, the airport experienced significant declines in air travel due to the global economic downturn, which impacted the Irish economy severely (the Irish economy was in recession for all of 2008 and 2009, contracting by over 10% in that period).14
However, passenger traffic at Dublin Airport has grown by 17.8% between 2010 and 2014, with the largest growth being seen in Transatlantic and Other International traffic.
14 Source: Central Statistics Office Ireland.
Dublin Airport Economic Impact Study
10

Dublin Airport Economic Impact Study 10
3 Overview of Dublin Airport Key Points Passenger traffic at Dublin Airport reached 21.7 million in 2014. Dublin Airport is the 14th best connected airport in Europe. It is particularly strong in
connections to the United States and Britain. Dublin Airport has direct service to 38 countries on four continents, including 26 out of
28 EU countries. Home base for two major carriers: Ryanair and Aer Lingus. The airport is a primary contributor to Ireland having one of the highest connectivity
levels on the continent relative to the size of its economy. This connectivity is critical to the economic development of Ireland, including trade,
tourism, FDI and business location decisions.
Dublin Airport, operated by daa, is the largest airport in the Republic of Ireland (and the largest on the island of Ireland). Located approximately 6 miles north of the centre of Dublin in the county of Fingal, the airport is the home base for Aer Lingus, Stobart Air (who operates regional services for Aer Lingus out of Dublin) and Ryanair.
3.1 Air Passenger Movements Passenger traffic at the airport has seen periods of growth and contraction over the past eleven years, as shown in Figure 3-1. Between 2000 and 2008, passenger movements at Dublin Airport increased from 13.7 million to 23.5 million, an average growth rate of 6.9% per annum. In 2009 and 2010, the airport experienced significant declines in air travel due to the global economic downturn, which impacted the Irish economy severely (the Irish economy was in recession for all of 2008 and 2009, contracting by over 10% in that period).14
However, passenger traffic at Dublin Airport has grown by 17.8% between 2010 and 2014, with the largest growth being seen in Transatlantic and Other International traffic.
14 Source: Central Statistics Office Ireland.
Dublin Airport Economic Impact Study 11
Figure 3-1: Passenger Movements at Dublin International Airport, 2000-2014
Source: daa.
Of the 21.7 million passenger movements in 2014, 21.0 million (96.5%) were origin/destination passengers (i.e., those starting or ending their air journey in Dublin), and 749,281 (3.5%) were transfer or transit passengers.15
Figure 3-2 shows 2014 passenger movements broken down by world region. Continental Europe accounted for 51.1% of passenger movements, followed by the UK at 35.9%, Transatlantic (North America) at 9.8%, other international destinations at 3.0% and domestic passenger traffic at 0.3%. Domestic traffic at Dublin Airport has declined from 917,379 in 2007 to 70,795 in 2014. This decline is due in part to the vastly improved road infrastructure between Dublin and other population centres.
15 Source: daa.
13.714.2
15.015.8
17.1
18.3
21.1
23.2 23.4
20.5
18.4 18.7 19.1
20.2
21.7
0
5
10
15
20
25
2000
2001
2002
2003
2004
2005
2006
2007
2008
2009
2010
2011
2012
2013
2014
Pass
enge
r Tra
ffic
(Mill
ions
)
Other International
Transatlantic
Continental Europe
UK
Domestic
Dublin Airport Economic Impact Study
11

Dublin Airport Economic Impact Study 12
Figure 3-2: Passenger Movements by Region at Dublin Airport, 2014
Source: daa.
3.2 Air Cargo and Aircraft Movements Air cargo volumes have increased substantially at Dublin Airport from 2001 to 2014, reaching a record high of 127,471 tonnes in 2014, as depicted in Figure 3-3. Cargo volumes declined in 2009 due to the global economic recession, and again slightly in 2011. However, since 2011 air cargo volumes have grown by 26%, reflecting a return to growth in exports and an increase in capacity on long-haul routes, particularly the Middle East.
Transatlantic2,121,880
9.8%
Other International643,036
3.0%Domestic
70,7950.3%
UK7,789,009
35.9%
Continental Europe11,082,682
51.1%
Dublin Airport Economic Impact Study
12

Dublin Airport Economic Impact Study 12
Figure 3-2: Passenger Movements by Region at Dublin Airport, 2014
Source: daa.
3.2 Air Cargo and Aircraft Movements Air cargo volumes have increased substantially at Dublin Airport from 2001 to 2014, reaching a record high of 127,471 tonnes in 2014, as depicted in Figure 3-3. Cargo volumes declined in 2009 due to the global economic recession, and again slightly in 2011. However, since 2011 air cargo volumes have grown by 26%, reflecting a return to growth in exports and an increase in capacity on long-haul routes, particularly the Middle East.
Transatlantic2,121,880
9.8%
Other International643,036
3.0%Domestic
70,7950.3%
UK7,789,009
35.9%
Continental Europe11,082,682
51.1%
Dublin Airport Economic Impact Study 13
Figure 3-3: Air Cargo at Dublin Airport, 2001-2014
Source: daa.
Total aircraft movements (landings and take-offs) at Dublin Airport are shown in Figure 3-4. Aircraft movements reached a historic high in 2007 of nearly 212,000 annual movements. The impact of the global financial crisis on passenger numbers, as well as changes in aircraft types serving Dublin Airport, produced an overall reduction in the number of movements post-2008. Since 2010, total movements have grown by 12.4%.
113.2
97.5
115.3118.3 117.6 116.7
110.4104.9
97.4
105.4101.2
111.1 113.6
127.5
0
20
40
60
80
100
120
140
2001
2002
2003
2004
2005
2006
2007
2008
2009
2010
2011
2012
2013
2014
Air
Car
go (T
hous
and
Tonn
es)
Dublin Airport Economic Impact Study
13

Dublin Airport Economic Impact Study 14
Figure 3-4: Total Aircraft Movements at Dublin Airport, 2000-2014
Source: daa.
3.3 Overview of Dublin Airport’s Air Services As Ireland’s largest airport, Dublin Airport serves as the nation’s primary regional and international gateway. Figures 3-5 and 3-6 show the scheduled passenger routes served from Dublin Airport in 2014. A total of 174 non-stop scheduled routes were operated from Dublin Airport by 34 air carriers.16 Of these routes, 27% were served by more than one carrier and 83% were operated on at least a daily basis year round.17 A total of 61 non-stop destinations from Dublin Airport operated at least daily service, and 9 destinations were operated with five or more daily flights.18 On average, there were 222 scheduled commercial aircraft departures each day from Dublin Airport in 2014.
16 Source: Diio schedule data for 2014. 17 Ibid. 18 Destinations with five-times daily service or greater: London Heathrow, London Gatwick, Manchester, Paris Charles de Gaulle, Birmingham, London Stansted, Edinburgh, London City and Bristol.
180.2185.7 181.9 177.8 182.2 186.8
196.6
211.8 211.9
176.8
160.3 162.0 163.7170.4
180.3
0
50
100
150
200
25020
00
2001
2002
2003
2004
2005
2006
2007
2008
2009
2010
2011
2012
2013
2014
Tota
l Airc
raft
Mov
emen
ts (T
hous
ands
)
Dublin Airport Economic Impact Study
14

Dublin Airport Economic Impact Study 14
Figure 3-4: Total Aircraft Movements at Dublin Airport, 2000-2014
Source: daa.
3.3 Overview of Dublin Airport’s Air Services As Ireland’s largest airport, Dublin Airport serves as the nation’s primary regional and international gateway. Figures 3-5 and 3-6 show the scheduled passenger routes served from Dublin Airport in 2014. A total of 174 non-stop scheduled routes were operated from Dublin Airport by 34 air carriers.16 Of these routes, 27% were served by more than one carrier and 83% were operated on at least a daily basis year round.17 A total of 61 non-stop destinations from Dublin Airport operated at least daily service, and 9 destinations were operated with five or more daily flights.18 On average, there were 222 scheduled commercial aircraft departures each day from Dublin Airport in 2014.
16 Source: Diio schedule data for 2014. 17 Ibid. 18 Destinations with five-times daily service or greater: London Heathrow, London Gatwick, Manchester, Paris Charles de Gaulle, Birmingham, London Stansted, Edinburgh, London City and Bristol.
180.2185.7 181.9 177.8 182.2 186.8
196.6
211.8 211.9
176.8
160.3 162.0 163.7170.4
180.3
0
50
100
150
200
250
2000
2001
2002
2003
2004
2005
2006
2007
2008
2009
2010
2011
2012
2013
2014
Tota
l Airc
raft
Mov
emen
ts (T
hous
ands
)
Dublin Airport Economic Impact Study 15
Figure 3-5: Dublin Airport’s European Route Network (2014)
Source: Diio Schedule Data for 2014.
Figure 3-6: Dublin Airport’s Global Route Network (2014)
Source: Diio Schedule Data for 2014.
Dublin Airport Economic Impact Study
15

Dublin Airport Economic Impact Study 16
As summarised in Figure 3-7, passenger air services at Dublin Airport connect Dublin to 38 countries across four continents. In total, these countries represent 18% of the world’s population and 55% of global GDP.19 Dublin is directly connected by non-stop service to 154 destinations in Europe and to all but two of the 28 European Union member states.20 In addition to the routes listed below, a number of new routes are scheduled to start in 2015 including Addis Ababa (Ethiopia), Reykjavik (Iceland) and Los Angeles (United States).
Figure 3-7: Countries Directly Connected to Dublin by Air Service from Dublin Airport (2014)
Europe [31 countries]
Austria (3) Luxembourg (1)
Belgium (2) Malta (1)
Bulgaria (1) Moldova (1)
Croatia (3) Netherlands (2)
Czech Republic (1) Norway (2)
Denmark (1) Poland (12)
Estonia (1) Portugal (3)
Finland (2) Romania (3)
France (20) Russia (1)
Germany (12) Slovakia (1)
Greece (6) Spain (19)
Hungary (1) Sweden (1)
Ireland (2) Switzerland (3)
Italy (17) Turkey (2)
Latvia (1) United Kingdom (26)
Lithuania (3)
Africa [3 Countries] Americas [2 Countries]
Egypt (1) Canada (3)
Morocco (2) United States (10)
Tunisia (1) Middle East [2 Countries]
Israel (1)
United Arab Emirates (2)
Source: Diio Schedule Data for 2014. Figures in parenthesis indicate the number of routes operated to that country.
19 Source: World Bank Data Catalog: http://data.worldbank.org/data-catalog. 20 Non-stop service is available to all EU28 countries except for Cyprus and Slovenia.
Dublin Airport Economic Impact Study
16

Dublin Airport Economic Impact Study 16
As summarised in Figure 3-7, passenger air services at Dublin Airport connect Dublin to 38 countries across four continents. In total, these countries represent 18% of the world’s population and 55% of global GDP.19 Dublin is directly connected by non-stop service to 154 destinations in Europe and to all but two of the 28 European Union member states.20 In addition to the routes listed below, a number of new routes are scheduled to start in 2015 including Addis Ababa (Ethiopia), Reykjavik (Iceland) and Los Angeles (United States).
Figure 3-7: Countries Directly Connected to Dublin by Air Service from Dublin Airport (2014)
Europe [31 countries]
Austria (3) Luxembourg (1)
Belgium (2) Malta (1)
Bulgaria (1) Moldova (1)
Croatia (3) Netherlands (2)
Czech Republic (1) Norway (2)
Denmark (1) Poland (12)
Estonia (1) Portugal (3)
Finland (2) Romania (3)
France (20) Russia (1)
Germany (12) Slovakia (1)
Greece (6) Spain (19)
Hungary (1) Sweden (1)
Ireland (2) Switzerland (3)
Italy (17) Turkey (2)
Latvia (1) United Kingdom (26)
Lithuania (3)
Africa [3 Countries] Americas [2 Countries]
Egypt (1) Canada (3)
Morocco (2) United States (10)
Tunisia (1) Middle East [2 Countries]
Israel (1)
United Arab Emirates (2)
Source: Diio Schedule Data for 2014. Figures in parenthesis indicate the number of routes operated to that country.
19 Source: World Bank Data Catalog: http://data.worldbank.org/data-catalog. 20 Non-stop service is available to all EU28 countries except for Cyprus and Slovenia.
Dublin Airport Economic Impact Study 17
Figure 3-8 shows the total scheduled seat capacity operated by the top 15 carriers at Dublin Airport in 2014. Dublin Airport is home to two major carriers: Aer Lingus and Ryanair. The presence of two such carriers allows the airport to develop dense network of services to a wide range of destinations, particularly where passenger flows can be pooled to support developing air services.
Aer Lingus offered 5.8 million seats in 2014 (including regional capacity operated by Stobart Air) and Ryanair offered 5.3 million seats. Combined, the two home carriers accounted for over 80% of seat capacity at Dublin Airport. British Airways, Lufthansa, Etihad, Air France and Emirates are the five largest overseas airlines at Dublin Airport, by share of seat capacity, accounting for 8.8% of capacity. In total, 34 air carriers provided scheduled service at Dublin Airport in 2014.
Figure 3-8: Outbound Seat Capacity by Carrier at Dublin Airport, 2014
Carrier Outbound Seat
Capacity (Thousands)
% Share of Total Seat Capacity
1. Aer Lingus 5,754 41.8%
2. Ryanair 5,315 38.6%
3. British Airways 391 2.8%
4. Lufthansa 233 1.7%
5. Etihad Airways 199 1.4%
6. Air France 198 1.4%
7. Emirates 194 1.4%
8. FlyBE 176 1.3%
9. Scandinavian Airlines 167 1.2%
10. CityJet 153 1.1%
11. Delta Air Lines 125 0.9%
12. United Airlines 122 0.9%
13. US Airways 107 0.8%
14. Turkish Airlines 91 0.7%
15. American Airlines 84 0.6%
20. Iberia 47 0.3%
Other Airlines 408 3.0%
Total 13,764 100.0%
Source: Diio Schedule Data for 2014. Figures based on marketing rather than operating carrier. Notes: Numbers may not add up due to rounding.
Dublin Airport Economic Impact Study
17
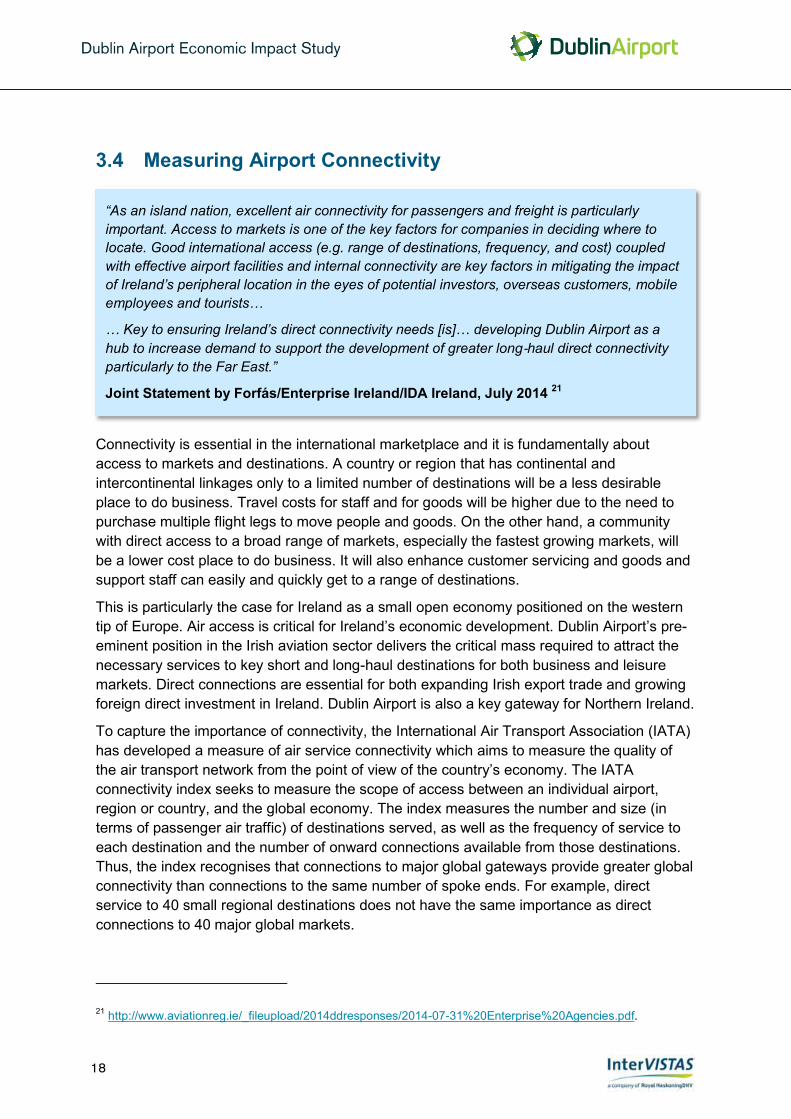
Dublin Airport Economic Impact Study 18
3.4 Measuring Airport Connectivity
21
Connectivity is essential in the international marketplace and it is fundamentally about access to markets and destinations. A country or region that has continental and intercontinental linkages only to a limited number of destinations will be a less desirable place to do business. Travel costs for staff and for goods will be higher due to the need to purchase multiple flight legs to move people and goods. On the other hand, a community with direct access to a broad range of markets, especially the fastest growing markets, will be a lower cost place to do business. It will also enhance customer servicing and goods and support staff can easily and quickly get to a range of destinations.
This is particularly the case for Ireland as a small open economy positioned on the western tip of Europe. Air access is critical for Ireland’s economic development. Dublin Airport’s pre-eminent position in the Irish aviation sector delivers the critical mass required to attract the necessary services to key short and long-haul destinations for both business and leisure markets. Direct connections are essential for both expanding Irish export trade and growing foreign direct investment in Ireland. Dublin Airport is also a key gateway for Northern Ireland.
To capture the importance of connectivity, the International Air Transport Association (IATA) has developed a measure of air service connectivity which aims to measure the quality of the air transport network from the point of view of the country’s economy. The IATA connectivity index seeks to measure the scope of access between an individual airport, region or country, and the global economy. The index measures the number and size (in terms of passenger air traffic) of destinations served, as well as the frequency of service to each destination and the number of onward connections available from those destinations. Thus, the index recognises that connections to major global gateways provide greater global connectivity than connections to the same number of spoke ends. For example, direct service to 40 small regional destinations does not have the same importance as direct connections to 40 major global markets.
21 http://www.aviationreg.ie/_fileupload/2014ddresponses/2014-07-31%20Enterprise%20Agencies.pdf.
“As an island nation, excellent air connectivity for passengers and freight is particularly important. Access to markets is one of the key factors for companies in deciding where to locate. Good international access (e.g. range of destinations, frequency, and cost) coupled with effective airport facilities and internal connectivity are key factors in mitigating the impact of Ireland’s peripheral location in the eyes of potential investors, overseas customers, mobile employees and tourists…
… Key to ensuring Ireland’s direct connectivity needs [is]… developing Dublin Airport as a hub to increase demand to support the development of greater long‐haul direct connectivity particularly to the Far East.”
Joint Statement by Forfás/Enterprise Ireland/IDA Ireland, July 2014 21
Dublin Airport Economic Impact Study
18
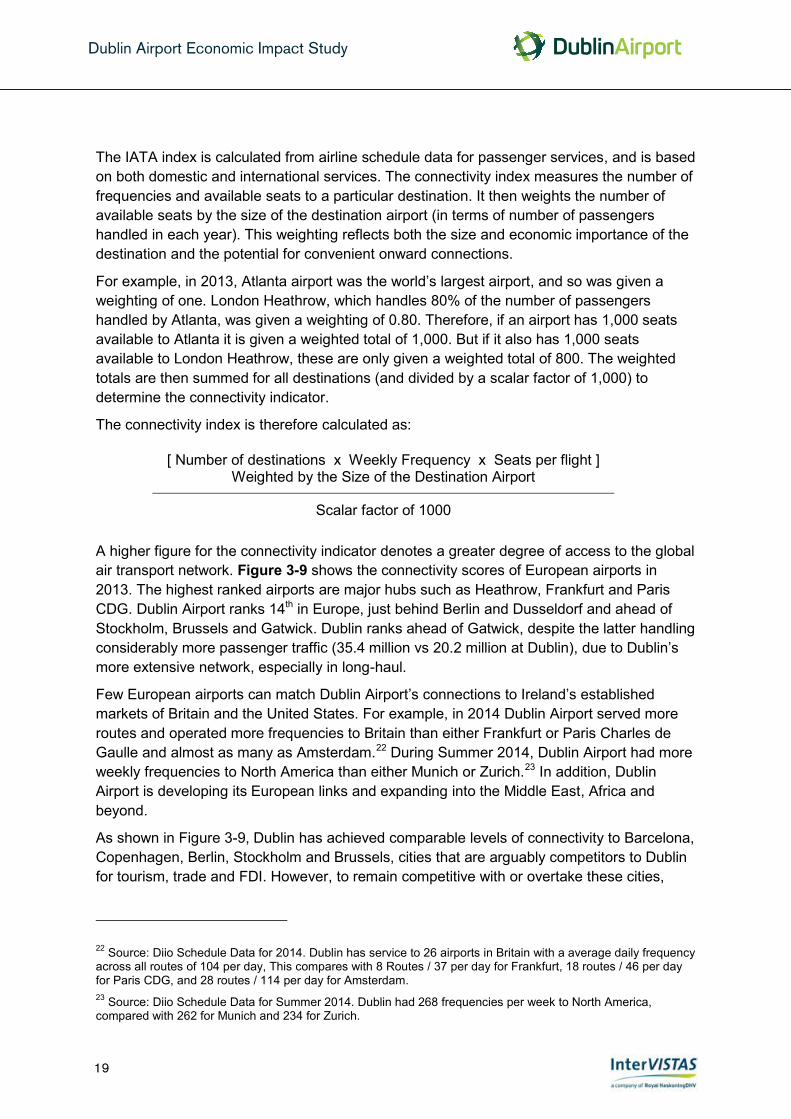
Dublin Airport Economic Impact Study 18
3.4 Measuring Airport Connectivity
21
Connectivity is essential in the international marketplace and it is fundamentally about access to markets and destinations. A country or region that has continental and intercontinental linkages only to a limited number of destinations will be a less desirable place to do business. Travel costs for staff and for goods will be higher due to the need to purchase multiple flight legs to move people and goods. On the other hand, a community with direct access to a broad range of markets, especially the fastest growing markets, will be a lower cost place to do business. It will also enhance customer servicing and goods and support staff can easily and quickly get to a range of destinations.
This is particularly the case for Ireland as a small open economy positioned on the western tip of Europe. Air access is critical for Ireland’s economic development. Dublin Airport’s pre-eminent position in the Irish aviation sector delivers the critical mass required to attract the necessary services to key short and long-haul destinations for both business and leisure markets. Direct connections are essential for both expanding Irish export trade and growing foreign direct investment in Ireland. Dublin Airport is also a key gateway for Northern Ireland.
To capture the importance of connectivity, the International Air Transport Association (IATA) has developed a measure of air service connectivity which aims to measure the quality of the air transport network from the point of view of the country’s economy. The IATA connectivity index seeks to measure the scope of access between an individual airport, region or country, and the global economy. The index measures the number and size (in terms of passenger air traffic) of destinations served, as well as the frequency of service to each destination and the number of onward connections available from those destinations. Thus, the index recognises that connections to major global gateways provide greater global connectivity than connections to the same number of spoke ends. For example, direct service to 40 small regional destinations does not have the same importance as direct connections to 40 major global markets.
21 http://www.aviationreg.ie/_fileupload/2014ddresponses/2014-07-31%20Enterprise%20Agencies.pdf.
“As an island nation, excellent air connectivity for passengers and freight is particularly important. Access to markets is one of the key factors for companies in deciding where to locate. Good international access (e.g. range of destinations, frequency, and cost) coupled with effective airport facilities and internal connectivity are key factors in mitigating the impact of Ireland’s peripheral location in the eyes of potential investors, overseas customers, mobile employees and tourists…
… Key to ensuring Ireland’s direct connectivity needs [is]… developing Dublin Airport as a hub to increase demand to support the development of greater long‐haul direct connectivity particularly to the Far East.”
Joint Statement by Forfás/Enterprise Ireland/IDA Ireland, July 2014 21
Dublin Airport Economic Impact Study 19
The IATA index is calculated from airline schedule data for passenger services, and is based on both domestic and international services. The connectivity index measures the number of frequencies and available seats to a particular destination. It then weights the number of available seats by the size of the destination airport (in terms of number of passengers handled in each year). This weighting reflects both the size and economic importance of the destination and the potential for convenient onward connections.
For example, in 2013, Atlanta airport was the world’s largest airport, and so was given a weighting of one. London Heathrow, which handles 80% of the number of passengers handled by Atlanta, was given a weighting of 0.80. Therefore, if an airport has 1,000 seats available to Atlanta it is given a weighted total of 1,000. But if it also has 1,000 seats available to London Heathrow, these are only given a weighted total of 800. The weighted totals are then summed for all destinations (and divided by a scalar factor of 1,000) to determine the connectivity indicator.
The connectivity index is therefore calculated as:
[ Number of destinations x Weekly Frequency x Seats per flight ] Weighted by the Size of the Destination Airport
Scalar factor of 1000
A higher figure for the connectivity indicator denotes a greater degree of access to the global air transport network. Figure 3-9 shows the connectivity scores of European airports in 2013. The highest ranked airports are major hubs such as Heathrow, Frankfurt and Paris CDG. Dublin Airport ranks 14th in Europe, just behind Berlin and Dusseldorf and ahead of Stockholm, Brussels and Gatwick. Dublin ranks ahead of Gatwick, despite the latter handling considerably more passenger traffic (35.4 million vs 20.2 million at Dublin), due to Dublin’s more extensive network, especially in long-haul.
Few European airports can match Dublin Airport’s connections to Ireland’s established markets of Britain and the United States. For example, in 2014 Dublin Airport served more routes and operated more frequencies to Britain than either Frankfurt or Paris Charles de Gaulle and almost as many as Amsterdam.22 During Summer 2014, Dublin Airport had more weekly frequencies to North America than either Munich or Zurich.23 In addition, Dublin Airport is developing its European links and expanding into the Middle East, Africa and beyond.
As shown in Figure 3-9, Dublin has achieved comparable levels of connectivity to Barcelona, Copenhagen, Berlin, Stockholm and Brussels, cities that are arguably competitors to Dublin for tourism, trade and FDI. However, to remain competitive with or overtake these cities,
22 Source: Diio Schedule Data for 2014. Dublin has service to 26 airports in Britain with a average daily frequency across all routes of 104 per day, This compares with 8 Routes / 37 per day for Frankfurt, 18 routes / 46 per day for Paris CDG, and 28 routes / 114 per day for Amsterdam. 23 Source: Diio Schedule Data for Summer 2014. Dublin had 268 frequencies per week to North America, compared with 262 for Munich and 234 for Zurich.
Dublin Airport Economic Impact Study
19
Dublin Airport Economic Impact Study 20
Dublin Airport will need to continue to enhance its connectivity. Achieving higher connectivity will require the efforts of all airport stakeholders and will be dependent on supportive and expansive aviation policy, regulation and planning regimes. Dublin Airport must also be enabled to expand its facilities to meet demand. The pay-off will be even greater economic growth and development for Dublin and Ireland, as increased air connectivity facilitates increased trade, tourism, investment and economic growth (as documented in Chapter 6).
“Dublin Airport is strategically important to businesses like PayPal and to our local and national economy. The Airport is the international gateway to Ireland. It makes a first and lasting impression on our visitors; whether they are tourists, business people or investors. Many of our PayPal teammates use the airport regularly – the ease with which they can access and travel through Dublin Airport helps them stay connected with friends and family overseas. Investment in Dublin Airport opened Ireland up to global opportunities and positioned us to win FDI and attract talent to our shores. Continued investment in Dublin Airport will continue to deliver rewards for existing and potential businesses, for our economy and for our country.”
PayPal, January 2015
Dublin Airport Economic Impact Study
20

Dublin Airport Economic Impact Study 20
Dublin Airport will need to continue to enhance its connectivity. Achieving higher connectivity will require the efforts of all airport stakeholders and will be dependent on supportive and expansive aviation policy, regulation and planning regimes. Dublin Airport must also be enabled to expand its facilities to meet demand. The pay-off will be even greater economic growth and development for Dublin and Ireland, as increased air connectivity facilitates increased trade, tourism, investment and economic growth (as documented in Chapter 6).
“Dublin Airport is strategically important to businesses like PayPal and to our local and national economy. The Airport is the international gateway to Ireland. It makes a first and lasting impression on our visitors; whether they are tourists, business people or investors. Many of our PayPal teammates use the airport regularly – the ease with which they can access and travel through Dublin Airport helps them stay connected with friends and family overseas. Investment in Dublin Airport opened Ireland up to global opportunities and positioned us to win FDI and attract talent to our shores. Continued investment in Dublin Airport will continue to deliver rewards for existing and potential businesses, for our economy and for our country.”
PayPal, January 2015
Dublin Airport Economic Impact Study 21
Figure 3-9: Top 25 European Airports Based on the IATA Connectivity Index (2013)
Source: Based on Diio Schedule Data and Passenger Traffic Data for 2013.
0 50 100 150 200 250 300 350
Nice
Helsinki
Lisbon
Oslo
Hamburg
Geneva
Manchester
London Gatwick
Milan Malpensa
Brussels
Stockholm Arlanda
Dublin
Duesseldorf
Berlin Tegel
Vienna
Copenhagen
Barcelona
Zurich
Rome Fiumicino
Madrid Barajas
Munich International
Amsterdam
Paris Charles de Gaulle
Frankfurt International
London Heathrow
Connectivity Index
Dublin Airport Economic Impact Study
21

Dublin Airport Economic Impact Study 22
The airports with the highest connectivity tend to be those serving relatively large economies with large populations, such as the UK, Germany and France. Dublin Airport’s contribution to connectivity is even more pronounced when compared against the size of its economy or its population. Figure 3-10 shows national connectivity (the aggregate of the connectivity scores of all major airports in the country) divided by the country’s GDP, while Figure 3-11 shows national connectivity divided by population. Ireland’s connectivity index includes the combined connectivity scores of Dublin, Cork, Shannon, Knock, Kerry and other airports. However, Dublin accounted for 81% of the nation’s total connectivity score in 2013.
As can be seen, Ireland has one of the highest GDP-adjusted connectivity scores in Europe, 50% higher than that of the UK and almost twice that of Germany. Dublin Airport alone contributes higher connectivity per Euro of GDP than either the UK or Germany.
Similarly, Ireland’s connectivity per million of population is above most other European nations. With the exception of Switzerland, the most highly connected countries on a per capita basis are islands or somewhat inaccessible (Norway), reflecting the importance of air connectivity for these sort of countries.
This analysis demonstrates that Dublin Airport is a major hub for the country and a critical contributor to Ireland’s connectivity with the rest of the world. As Chapter 6 discusses, this connectivity has important implications for the wider economy of Ireland.
Dublin Airport Economic Impact Study
22

Dublin Airport Economic Impact Study 22
The airports with the highest connectivity tend to be those serving relatively large economies with large populations, such as the UK, Germany and France. Dublin Airport’s contribution to connectivity is even more pronounced when compared against the size of its economy or its population. Figure 3-10 shows national connectivity (the aggregate of the connectivity scores of all major airports in the country) divided by the country’s GDP, while Figure 3-11 shows national connectivity divided by population. Ireland’s connectivity index includes the combined connectivity scores of Dublin, Cork, Shannon, Knock, Kerry and other airports. However, Dublin accounted for 81% of the nation’s total connectivity score in 2013.
As can be seen, Ireland has one of the highest GDP-adjusted connectivity scores in Europe, 50% higher than that of the UK and almost twice that of Germany. Dublin Airport alone contributes higher connectivity per Euro of GDP than either the UK or Germany.
Similarly, Ireland’s connectivity per million of population is above most other European nations. With the exception of Switzerland, the most highly connected countries on a per capita basis are islands or somewhat inaccessible (Norway), reflecting the importance of air connectivity for these sort of countries.
This analysis demonstrates that Dublin Airport is a major hub for the country and a critical contributor to Ireland’s connectivity with the rest of the world. As Chapter 6 discusses, this connectivity has important implications for the wider economy of Ireland.
Dublin Airport Economic Impact Study 23
Figure 3-10: Connectivity Relative to Gross Domestic Product (2013) – Top 25 Countries
Source: Based on Diio Schedule Data, Passenger Traffic Data and World Bank Data for 2013.
0.00 0.25 0.50 0.75 1.00
Poland
Belgium
France
Luxembourg
Germany
Italy
Netherlands
Sweden
Austria
United Kingdom
Romania
Czech Republic
Finland
Macedonia
Estonia
Greece
Denmark
Ukraine
Norway
Spain
Switzerland
Ireland
Croatia
Portugal
Bulgaria
Serbia
Cyprus
Connectivity per Billion Euros of GDP
Dublin's Contribution: 81%
Dublin Airport Economic Impact Study
23

Dublin Airport Economic Impact Study 24
Figure 3-11: Connectivity Relative to Population (2013) – Top 25 Countries
Source: Based on Diio Schedule Data, Passenger Traffic Data and World Bank Data for 2013.
0 10 20 30 40 50
Estonia
Czech Republic
Turkey
Croatia
Belgium
Greece
Italy
France
Latvia
Portugal
Germany
Netherlands
Spain
United Kingdom
Austria
Sweden
Finland
Luxembourg
Denmark
Ireland
Cyprus
Switzerland
Norway
Malta
Iceland
Connectivity per Million Population
Dublin's Contribution: 81%
Dublin Airport Economic Impact Study
24

Dublin Airport Economic Impact Study 24
Figure 3-11: Connectivity Relative to Population (2013) – Top 25 Countries
Source: Based on Diio Schedule Data, Passenger Traffic Data and World Bank Data for 2013.
0 10 20 30 40 50
Estonia
Czech Republic
Turkey
Croatia
Belgium
Greece
Italy
France
Latvia
Portugal
Germany
Netherlands
Spain
United Kingdom
Austria
Sweden
Finland
Luxembourg
Denmark
Ireland
Cyprus
Switzerland
Norway
Malta
Iceland
Connectivity per Million Population
Dublin's Contribution: 81%
Dublin Airport Economic Impact Study 25
4 Direct Employment Impacts of Airport Activity
Key Points Direct employment at Dublin Airport amounts to 15,700 jobs (14,000 FTEs). The average full-time wage/income is €45,600, 16% higher than the national average. Airport activity supports a range of occupations and skill levels. Over a quarter (27%) of
the employment is in managerial or skilled employment While 83% of the employment is onsite at the airport, 2,680 jobs are created in the rest
of the country, including Fingal, Dublin and the rest of Ireland.
This chapter documents the economic impact of ongoing operations at Dublin Airport in 2013 in terms of its direct employment and income/wages. Breakdowns of the employment and economic impact by industry, occupation and region are also provided.
4.1 Overall Direct Employment 24
24 http://www.aviationreg.ie/_fileupload/2014ddresponses/2014-07-31%20Fingal%20Dublin%20Chamber.pdf.
“Dublin Airport is and has been for many years a major provider of a wide range of high quality jobs for large numbers of people in Fingal and the Dublin City Region which is why the Chamber believes that the future growth of Dublin Airport is important for the continued economic development of Fingal, the Greater Dublin Region and the country as a whole.” 24
“Dublin Airport is recognised as a key component in attracting Foreign Direct Investment companies to Ireland with its modern facilities and ease of access to the rest of the country. The opening of Terminal 2 provides an excellent example of investment in quality infrastructure supporting further growth in air travel. Long-haul airlines require facilities of this standard and will respond by growing their business through the airport. The routes to the Middle East are a prime example of this.”
Fingal Dublin Chamber, 2014
Dublin Airport Economic Impact Study
25

Dublin Airport Economic Impact Study 26
The direct employment impacts of Dublin Airport are provided in Figure 4-1. Direct employment related to ongoing operations at Dublin Airport amounts to 15,700 jobs. After adjusting for part-time and seasonal employment, these jobs equate to 14,000 full-time equivalents (FTEs).
These employees received a total of estimated €639 million in income/wages in 2013, providing an average of €45,600 per FTE. This is 16% higher than the national full-time earnings in 2013.25
Figure 4-1: Direct Employment Impacts Generated by Dublin Airport
Direct Employment Impacts
Number of Jobs 15,700
Full-Time Equivalent Jobs (FTEs) 14,000
Income/Wages €639 Million
Average Income per FTE €45,600
As shown in Figure 4-2, the survey results show that the vast majority (77%) of direct jobs generated by Dublin Airport are permanent full-time positions, while 14% are permanent part-time positions and 9% are seasonal positions (e.g., additional employment at busy times of the year).
Figure 4-2: Full-Time, Part-Time and Seasonal Jobs Generated by Dublin Airport
Direct Jobs Percentage
Permanent Full-Time Jobs 12,100 77%
Permanent Part-Time Jobs 2,200 14%
Seasonal Jobs 1,400 9%
Total Jobs 15,700 100%
Numbers may not add up due to rounding.
25 Based on data from Central Statistics Office Ireland, average earnings were €21.70 per hour in 2013. Multiplied by average hours per annum (see Appendix C), the average full-time wage is €39,300.
Dublin Airport Economic Impact Study
26

Dublin Airport Economic Impact Study 26
The direct employment impacts of Dublin Airport are provided in Figure 4-1. Direct employment related to ongoing operations at Dublin Airport amounts to 15,700 jobs. After adjusting for part-time and seasonal employment, these jobs equate to 14,000 full-time equivalents (FTEs).
These employees received a total of estimated €639 million in income/wages in 2013, providing an average of €45,600 per FTE. This is 16% higher than the national full-time earnings in 2013.25
Figure 4-1: Direct Employment Impacts Generated by Dublin Airport
Direct Employment Impacts
Number of Jobs 15,700
Full-Time Equivalent Jobs (FTEs) 14,000
Income/Wages €639 Million
Average Income per FTE €45,600
As shown in Figure 4-2, the survey results show that the vast majority (77%) of direct jobs generated by Dublin Airport are permanent full-time positions, while 14% are permanent part-time positions and 9% are seasonal positions (e.g., additional employment at busy times of the year).
Figure 4-2: Full-Time, Part-Time and Seasonal Jobs Generated by Dublin Airport
Direct Jobs Percentage
Permanent Full-Time Jobs 12,100 77%
Permanent Part-Time Jobs 2,200 14%
Seasonal Jobs 1,400 9%
Total Jobs 15,700 100%
Numbers may not add up due to rounding.
25 Based on data from Central Statistics Office Ireland, average earnings were €21.70 per hour in 2013. Multiplied by average hours per annum (see Appendix C), the average full-time wage is €39,300.
Dublin Airport Economic Impact Study 27
4.2 Direct Employment by Business Type A breakdown of the direct employment (in terms of jobs) at Dublin Airport is provided in Figure 4-3:
Airlines account for 5,290 jobs (4,720 FTEs) in 2013, 34% of the direct jobs generated by Dublin Airport. This category includes scheduled and charter air carriers.
daa, the operator of Dublin Airport is the second largest employer group at the airport, accounting for 2,350 jobs (2,090 FTEs) at the airport in 2013, 15% of total direct employment. This is the employment associated with the operation and management of Dublin Airport and daa head office.26 It does not include daa employment associated with the operation of Cork Airport.
Ground Handling and Other Support includes ground-handling (loading and unloading of baggage, aircraft cleaning and turnaround, etc.), aircraft fuelling, private security services, cleaning services and other support services. This category of business employs 2,080 jobs (1,840 FTEs), 13% of the total.
Ground Transport includes taxis, buses, car rental and car parking. This category accounts for 1,900 jobs (1,730 FTEs), 12% of all direct employment.
Retail and Food & Beverage services in the Dublin Airport buildings account for 1,600 jobs (1,320 FTEs), 10% of the total.
Maintenance, Repair and Overhaul accounts for 730 jobs (670 FTEs), 5% of total direct employment. These organisations manage the mechanical requirement of the aviation industry, such as aircraft maintenance and repair and parts supply and manufacturing.
Government Agencies include the Irish Aviation Authority (including air traffic control), customs and immigration and U.S. preclearance. These agencies account for 720 jobs (5% of employment).
Logistics, Warehousing and FBOs (Fixed Base Operation or General Aviation) account for 710 jobs (630 FTEs), 5% of total employment.
Hotels, providing accommodation for airline crews and transiting passengers, account for 320 jobs (280 FTEs), less than 2% of employment.27
26 The figure includes daa employees involved in car parking and retail. 27 Surveyed hotels were asked to estimate the proportion of their business that related to accommodating airline crews and transit passengers. Only that proportion of the employment has been included in the estimates.
Dublin Airport Economic Impact Study
27

Dublin Airport Economic Impact Study 28
Figure 4-3: Direct Employment (Jobs) by Business Type
The direct benefit to business related to airport activity is illustrated in the box below, which discusses the traffic volumes that bus and coach operator Bus Éireann has achieved on inter-regional routes serving Dublin Airport.
“Dublin Airport has been very important for our inter-regional services development, particularly in the last 4-5 years. Since 2010, passenger numbers on our services to/from Dublin Airport have grown by an average of 13% per annum. These trips are entirely based (origin/destination) outside Dublin City and County and as far away as Donegal, using Dublin Airport as a transport hub.”
Bus Éireann, December 2014
Dublin Airport Economic Impact Study
28

Dublin Airport Economic Impact Study 28
Figure 4-3: Direct Employment (Jobs) by Business Type
The direct benefit to business related to airport activity is illustrated in the box below, which discusses the traffic volumes that bus and coach operator Bus Éireann has achieved on inter-regional routes serving Dublin Airport.
“Dublin Airport has been very important for our inter-regional services development, particularly in the last 4-5 years. Since 2010, passenger numbers on our services to/from Dublin Airport have grown by an average of 13% per annum. These trips are entirely based (origin/destination) outside Dublin City and County and as far away as Donegal, using Dublin Airport as a transport hub.”
Bus Éireann, December 2014
Dublin Airport Economic Impact Study 29
4.3 Direct Employment by Occupation Dublin Airport is a source of a wide variety of job categories and positions. Figure 4-4 shows the distribution of direct jobs by job category in 2013. As can be seen, the largest occupation type is customer services / cashiers, accounting for 20% of direct employment. This category includes airline customer services, retail and food & beverage cashiers, car rental agents and other sales staff. Nearly a quarter (24%) of the employment is in managerial or skilled employment (professional/mangers, pilots, air traffic control and craftsmen/mechanics).
Figure 4-4: Direct Employment by Occupation (Jobs)
Direct Jobs Percentage
Cashiers / Customer Services 3,080 20%
Food Preparation / Cleaning / Manual 2,700 17%
Professional / Managers 2,180 14%
Flight Crew 1,750 11%
Drivers 1,190 8%
Security / Government 1,050 7%
Aircraft Loading / Unloading / Ramp 910 6%
Pilots 630 4%
Craftsmen / Mechanics 570 4%
Air Traffic Controllers 300 2%
Other 1,340 9%
Total Jobs 15,700 100%
Numbers may not add up due to rounding.
Dublin Airport Economic Impact Study
29

Dublin Airport Economic Impact Study 30
4.4 Direct Employment by Location The location of the employment by region is provided in Figure 4-5. The location is based on the location of business where the employment takes place (rather than the residence of the employee). As can be seen, 83% of the direct employment is at the airport, with a further 6% in the surrounding Fingal region. Approximately 8% of employment is in the Rest of Dublin, the largest element of which is taxi employment (allocated on the basis of the location of the taxi firm), as well as company headquarters.
Figure 4-5: Direct Employment by Location (Jobs)
Direct Jobs Percentage
At Airport (On-Site) 13,020 83%
Rest of Fingal 930 6%
Fingal Sub-Total 13,950 89%
Rest of Dublin 1,220 8%
Rest of Leinster 100 <1%
Rest of Ireland 430 3%
Total Jobs 15,700 100%
Numbers may not add up due to rounding.
Dublin Airport Economic Impact Study
30

Dublin Airport Economic Impact Study 30
4.4 Direct Employment by Location The location of the employment by region is provided in Figure 4-5. The location is based on the location of business where the employment takes place (rather than the residence of the employee). As can be seen, 83% of the direct employment is at the airport, with a further 6% in the surrounding Fingal region. Approximately 8% of employment is in the Rest of Dublin, the largest element of which is taxi employment (allocated on the basis of the location of the taxi firm), as well as company headquarters.
Figure 4-5: Direct Employment by Location (Jobs)
Direct Jobs Percentage
At Airport (On-Site) 13,020 83%
Rest of Fingal 930 6%
Fingal Sub-Total 13,950 89%
Rest of Dublin 1,220 8%
Rest of Leinster 100 <1%
Rest of Ireland 430 3%
Total Jobs 15,700 100%
Numbers may not add up due to rounding.
Dublin Airport Economic Impact Study 31
5 Indirect and Induced Impacts of Airport Activity
Key Points Including multiplier impacts, the employment generated totals 37,300 jobs (33,100
FTEs), earning €1.4 billion in income/wages. The total GVA generated is nearly €2.8 billion, approximately 1.6% of the GDP of Ireland
in 2013. 52% of the total employment occurs in Fingal, due to the presence of the airport in that
county. A further 23% occurs in the rest of Dublin and 25% occurs in the rest of the country.
As noted previously, the economic impact of Dublin Airport does not end with the direct impacts. Other sectors of the economy benefit from the activities at Dublin Airport. As described in Section 1.2, this includes indirect impacts in businesses that supply the goods and services to the direct activities linked to the airport, and induced impacts resulting from direct and indirect employees spending their wages in the general economy. The indirect and induced impacts were estimated using economic multipliers derived from government data, detailed in Chapter 2 and the appendices. The direct GVA was also estimated using these economic multipliers.
5.1 Overall Multiplier Impacts of Dublin Airport The direct and multiplier economic impact of Dublin Airport is summarised in Figure 5-1. Using economic multipliers, it was estimated that in addition to the 15,700 direct jobs, the airport generates 9,600 indirect jobs (8,500 FTEs) and 12,000 induced jobs (10,600 FTEs) in 2013. In total, the employment generated is 37,300 jobs (33,100 FTEs), earning a total of €1.4 billion in income/wages. To put that in context, this number of jobs is roughly equivalent to employing the entire town of Swords.28
The total GVA generated is €2.8 billion, approximately 1.6% of the GDP of Ireland in 2013.29
28 Source: CSO Ireland: Census 2011 Results. Population of the town of Swords: 36,924. 29 Based CSO data, the GDP of Ireland was €174.8 billion in 2013.
Dublin Airport Economic Impact Study
31

Dublin Airport Economic Impact Study 32
Figure 5-1: Direct and Multiplier Impacts of Dublin Airport
Impact Type Jobs FTEs Income (€ Million)
GVA (€ Million)
Direct 15,700 14,000 639 1,256
Indirect 9,600 8,500 373 717
Induced 12,000 10,600 397 781
Total 37,300 33,100 1,409 2,753
Numbers may not add up due to rounding.
The ratio of indirect+induced jobs to direct jobs is 1.38, indicating that there are 1.38 indirect and induced jobs generated for each direct job.30 Similarly, the ratio for GVA is 1.19 – for each €1 of direct GVA, there is €1.19 of indirect and induced GVA. 31 While, as noted in Section 2.5, these multiplier ratios can vary depending on the nature of the industry and the structure of the economy, the ratios in this study are in line with results for other airports elsewhere in the world. For example, a 2014 study of Heathrow airport found an indirect+induced jobs to direct jobs ratio of 1.29.32 A study for Munich airport produced a ratio of 1.64,33 and for Brussels Airport the ratio was estimated to be 1.90.34
The total GVA estimate of €2.8 billion includes the nearly €1.4 billion in income/wages, as GVA is made up of income/wages, operating surpluses (profits) and consumption of fixed capital. Approximately 52% of the GVA impact is income/wages. The remaining 48% of GVA comprises the operating surplus of the relevant firms and their consumption of capital. The aviation industry is fairly capital intensive (e.g., aircraft, specialised equipment, airport infrastructure, etc.) and therefore capital consumption contributes considerably to the GVA figure.
30 (37,300 / 15,700) – 1 = 1.38. 31 (2,753 / 1,256) – 1 = 1.19. 32 http://your.heathrow.com/wp-content/uploads/2014/05/TBF-Volume-2-72dpi-jm.pdf. 33 http://www.munich-airport.de/en/company/dialog/oekonom/effekte1/index.jsp. 34 http://www.brusselsairport.be/en/mediaroom/news/37532/.
Dublin Airport Economic Impact Study
32

Dublin Airport Economic Impact Study 32
Figure 5-1: Direct and Multiplier Impacts of Dublin Airport
Impact Type Jobs FTEs Income (€ Million)
GVA (€ Million)
Direct 15,700 14,000 639 1,256
Indirect 9,600 8,500 373 717
Induced 12,000 10,600 397 781
Total 37,300 33,100 1,409 2,753
Numbers may not add up due to rounding.
The ratio of indirect+induced jobs to direct jobs is 1.38, indicating that there are 1.38 indirect and induced jobs generated for each direct job.30 Similarly, the ratio for GVA is 1.19 – for each €1 of direct GVA, there is €1.19 of indirect and induced GVA. 31 While, as noted in Section 2.5, these multiplier ratios can vary depending on the nature of the industry and the structure of the economy, the ratios in this study are in line with results for other airports elsewhere in the world. For example, a 2014 study of Heathrow airport found an indirect+induced jobs to direct jobs ratio of 1.29.32 A study for Munich airport produced a ratio of 1.64,33 and for Brussels Airport the ratio was estimated to be 1.90.34
The total GVA estimate of €2.8 billion includes the nearly €1.4 billion in income/wages, as GVA is made up of income/wages, operating surpluses (profits) and consumption of fixed capital. Approximately 52% of the GVA impact is income/wages. The remaining 48% of GVA comprises the operating surplus of the relevant firms and their consumption of capital. The aviation industry is fairly capital intensive (e.g., aircraft, specialised equipment, airport infrastructure, etc.) and therefore capital consumption contributes considerably to the GVA figure.
30 (37,300 / 15,700) – 1 = 1.38. 31 (2,753 / 1,256) – 1 = 1.19. 32 http://your.heathrow.com/wp-content/uploads/2014/05/TBF-Volume-2-72dpi-jm.pdf. 33 http://www.munich-airport.de/en/company/dialog/oekonom/effekte1/index.jsp. 34 http://www.brusselsairport.be/en/mediaroom/news/37532/.
Dublin Airport Economic Impact Study 33
35
5.2 Multiplier Impacts by Region The estimated direct and multiplier impacts by region are provided in Figure 5-2. The location of the multiplier impacts were estimated using responses to survey questions regarding the location of the business spending on goods and services, and CSO Ireland data on the national distribution of employment and GVA.
Including multiplier impacts, 52% of the employment (19,550 jobs) occurs in Fingal, due to the presence of the airport in that county. A further 23% (8,720) occurs in the rest of Dublin and 25% (9,030 jobs) occurs in the rest of the country (i.e., Rest of Leinster and Rest of Ireland).
35 http://www.aviationreg.ie/_fileupload/2014ddresponses/2014-07-31%20Dublin%20Chamber.pdf.
“Dublin Airport handles 80% of Irish air traffic and is the most critical access for air transport in the country. Dublin Airport is essential to the continued development of the economic, business and tourism life both for Dublin and the country as a whole.
If Dublin, and the Greater Dublin Area, is to realise its potential as the engine of national growth, it is important that it has an airport with the necessary infrastructure that supports the long run requirements of businesses, tourists and international workers.”
Dublin Chamber of Commerce, July 2014 35
Dublin Airport Economic Impact Study
33

Dublin Airport Economic Impact Study 34
Figure 5-2: Direct and Multiplier Impacts of Dublin Airport by Region
Region Direct Indirect Induced Total
Employment (Jobs)
Dublin Airport/Fingal 13,950 3,100 2,500 19,550
Rest of Dublin 1,220 3,700 3,800 8,720
Rest of Leinster 100 1,600 2,600 4,300
Rest of Ireland 430 1,200 3,100 4,730
Total 15,700 9,600 12,000 37,300
GVA (€ Million)
Dublin Airport/Fingal 1,116 232 165 1,513
Rest of Dublin 98 278 248 623
Rest of Leinster 8 116 166 290
Rest of Ireland 34 91 202 327
Total 1,256 717 781 2,753
Numbers may not add up due to rounding.
Dublin Airport Economic Impact Study
34

Dublin Airport Economic Impact Study 34
Figure 5-2: Direct and Multiplier Impacts of Dublin Airport by Region
Region Direct Indirect Induced Total
Employment (Jobs)
Dublin Airport/Fingal 13,950 3,100 2,500 19,550
Rest of Dublin 1,220 3,700 3,800 8,720
Rest of Leinster 100 1,600 2,600 4,300
Rest of Ireland 430 1,200 3,100 4,730
Total 15,700 9,600 12,000 37,300
GVA (€ Million)
Dublin Airport/Fingal 1,116 232 165 1,513
Rest of Dublin 98 278 248 623
Rest of Leinster 8 116 166 290
Rest of Ireland 34 91 202 327
Total 1,256 717 781 2,753
Numbers may not add up due to rounding.
Dublin Airport Economic Impact Study 35
6 Facilitating the Wider Economy – The Catalytic Impact of Dublin Airport
Key Points There is extensive evidence of the linkage between air connectivity and trade, tourism,
FDI, business location decisions, productivity growth and economic growth (known as catalytic impacts).
Analysis of national and regional data shows evidence of the underlying relationship between Dublin Airport’s connectivity and economic development.
The catalytic impacts of Dublin Airport are estimated at 60,100 jobs and €4.2 billion in GVA, equivalent to the 2.4% of national GDP.
Chapter 3 describes the connectivity that Dublin Airport provides for the Irish economy. This high level of connectivity has established Dublin Airport as an important hub for air traffic and the air transport industry generally, which has contributed the direct, indirect and induced economic impacts documented in Chapters 4 and 5. However, it is not just the air transport sector, its suppliers and employees that benefit from air services at Dublin Airport. The air services at Dublin Airport facilitate many other sectors of the economy, including tourism and trade, and contribute to Ireland’s attractiveness as a place to do business and to invest. Industries and activities that would otherwise not exist in the country can be attracted by improved air transport connectivity.
As introduced in Chapter 2, the role of air transport in facilitating other parts of the economy is referred to as catalytic impacts. These impacts are not generally reflected in Input-Output models of the economy of the sort used to estimate indirect and induced impacts. Input-Output models reflect the purchasing decisions of businesses within the economy, whereas catalytic impacts capture a different relationship between businesses. For example, hotels, restaurants and entertainment places in Ireland do not purchase services from airlines to any great extent, but they do benefit from the large number of tourists arriving in Ireland by air that spend money in their businesses.36 Similarly, a multinational company’s decision to locate an office or facility in Ireland partially on the basis of air connectivity is not reflected in the Input-Output models.
Section 6.1 below discusses in more detail the nature of these catalytic impacts and growing evidence of its impact and magnitude. This is followed in Sections 6.2 and 6.3 by estimates of the catalytic impacts facilitated by Dublin Airport.
36 These businesses may purchase air services to support their business activities (e.g., visits to headquarters) but not for the larger number of tourists that benefit their business.
Dublin Airport Economic Impact Study
35

Dublin Airport Economic Impact Study 36
6.1 Overview of Catalytic Impacts As discussed in Chapter 1, catalytic impacts capture the way in which aviation facilitates the business of other sectors of the economy. This comprises:
Tourism – air service facilitates the arrival of larger numbers of tourists to a country. This includes business as well as leisure tourists. The spending of these tourists can support a wide range of tourism-related businesses: hotels, restaurants, entertainment and recreation, car rentals, and others.
Trade – air transport provides connections to export markets for both goods and services.
Investment – a key factor many companies take into account when making decisions about the location of offices, manufacturing plants or warehouses is the proximity of an international airport.
Productivity – air transportation offers access to new markets which in turn enables businesses to achieve greater economies of scale. Air access also enables companies to attract and retain high quality employees.
A number of studies have demonstrated that air transportation plays an important role in trade, investment and business location decisions, while additional studies have uncovered empirical evidence demonstrating a strong linkage between air service and employment and economic growth. Provided below is a summary of this research examining the catalytic impact of aviation, taken from academic and industry research.
Dublin Airport Economic Impact Study
36

Dublin Airport Economic Impact Study 36
6.1 Overview of Catalytic Impacts As discussed in Chapter 1, catalytic impacts capture the way in which aviation facilitates the business of other sectors of the economy. This comprises:
Tourism – air service facilitates the arrival of larger numbers of tourists to a country. This includes business as well as leisure tourists. The spending of these tourists can support a wide range of tourism-related businesses: hotels, restaurants, entertainment and recreation, car rentals, and others.
Trade – air transport provides connections to export markets for both goods and services.
Investment – a key factor many companies take into account when making decisions about the location of offices, manufacturing plants or warehouses is the proximity of an international airport.
Productivity – air transportation offers access to new markets which in turn enables businesses to achieve greater economies of scale. Air access also enables companies to attract and retain high quality employees.
A number of studies have demonstrated that air transportation plays an important role in trade, investment and business location decisions, while additional studies have uncovered empirical evidence demonstrating a strong linkage between air service and employment and economic growth. Provided below is a summary of this research examining the catalytic impact of aviation, taken from academic and industry research.
Dublin Airport Economic Impact Study 37
6.1.1 Trade A number of research papers have produced evidence that aviation positively contributes to the trade of both goods and services
Paper Methodology Key Findings
Cech (2004)37 Used a cross-section statistical comparison method to investigate how air cargo services affect the economies of 125 U.S. counties.
Higher levels of air cargo services contribute to increased earnings and increased employment.
EUROCONTROL (2005)38
The study estimated the net contribution of air transportation to trade (i.e., export minus imports).
Net contribution of air transportation to trade was €55.7 billion in 2003 across the 25 current EU members.
UK Institute of Directors (2008)39
Surveyed 500 UK businesses about their use and the importance of air transportation.
The use of air travel strongly linked to business trade and sales. Almost three quarters of businesses using passenger air services said that their business would be adversely affected if the amount of air travel they could undertake was significantly curtailed.
Poole (2010)40 Econometric analysis of U.S. trade and travel data from 1993 to 2013.
A 10% increase in business travel to the U.S. by non-residents led to a 1.2% increase in the volume of exports from the U.S. and 0.3% increase in export margins. The effect was strongest for travel from non-English speaking countries, suggesting that business travel help overcome language barriers in trade relationships.
PWC (2013)41 Examined the relationship between the UK’s international air seat capacity and international trade, controlling for other factors affecting trade.
A 10% increase in seat capacity increased goods exports by 3.3% and goods imports by 1.7%.
37 Cech P. (2004), “The Catalytic Effect of the Accessibility to Air Cargo Services”, TIACA Graduate Research Paper Competition. 38 Cooper, A. and Smith, P. (2005), “The Economic Catalytic Effects of Air Transport in Europe,” Commissioned by EUROCONTROL. EUROCONTROL is a civil and military organisation established in 1963 to facilitate a safe, seamless pan-European Air Traffic Management (ATM) system. 39 UK Institute of Directors (2008), “High Fliers: Business Leaders’ View on Air Travel”, http://www.iod.com/MainWebSite/Resources/Document/policy_paper_high_fliers.pdf 40 Poole, J. (2010), “Business Travel as an Input to International Trade”, http://www.scu.edu/business/economics/upload/Poole.pdf 41 PWC (2013), “Econometric Analysis to Develop Evidence on the Links Between Aviation and the Economy”, Report for the UK Airports Commission, December 2013.
Dublin Airport Economic Impact Study
37

Dublin Airport Economic Impact Study 38
6.1.2 Investment and Business Location The impact of aviation on investment and business location decisions has been the subject of a number of papers. These papers have found evidence of air connectivity contributing to increased investment and beneficial location decision for the surrounding regions or the country.
Paper Methodology Key Findings
Hansen and Gerstein (1991)42
Used data from 1982 to 1987, the analysis related the amount of Japanese investment in each US state to measures of level of air service operated between Japan and that state (and other background factors).
The amount of Japanese investment in each US state was causally linked to the air service between Japan and that state.
EUROCONTROL (2005)43
Analysed the relationship between air transportation and business investment in the EU.
A 10% increase in air transportation usage increases business investment by 1.6% in the long run (the impact takes approximately five years to fully manifest).
IATA (2005)44 IATA surveyed 625 businesses in five countries (China, Chile, United States, Czech Republic and France).
25% of surveyed businesses in five countries indicated that 25% of their sales were dependent on good air transport links; 30% of Chinese firms reported that they had changed investment decisions because of constraints on air services.
Bel and Fageda (2008)45
Statistically analysed the relationship between international air service and the location of large firm’s headquarters across major European urban areas.
A 10% increase in supply of intercontinental air service was associated with a 4% increase in the number of large firm headquarters located in the corresponding urban area.
42 Hansen, M. and R. Gerstein "Capital in Flight: Japanese Investment and Japanese Air Service in the United States During the 1980s," Logistics and Transportation Review, 1991, Vol. 27, No. 3, pp. 257-276. 43 Cooper, A. and Smith, P. (2005), “The Economic Catalytic Effects of Air Transport in Europe,” Commissioned by EUROCONTROL. EUROCONTROL is a civil and military organisation established in 1963 to facilitate a safe, seamless pan-European Air Traffic Management (ATM) system. 44 Airline Network Benefits, IATA Economic Briefing No. 3, 2006. 45 Bel, G. and Fageda, X. (2008), “Getting There Fast: Globalization, Intercontinental Flights and Location of Headquarters”, Journal of Economic Geography, Vol. 8, No. 4.
Dublin Airport Economic Impact Study
38
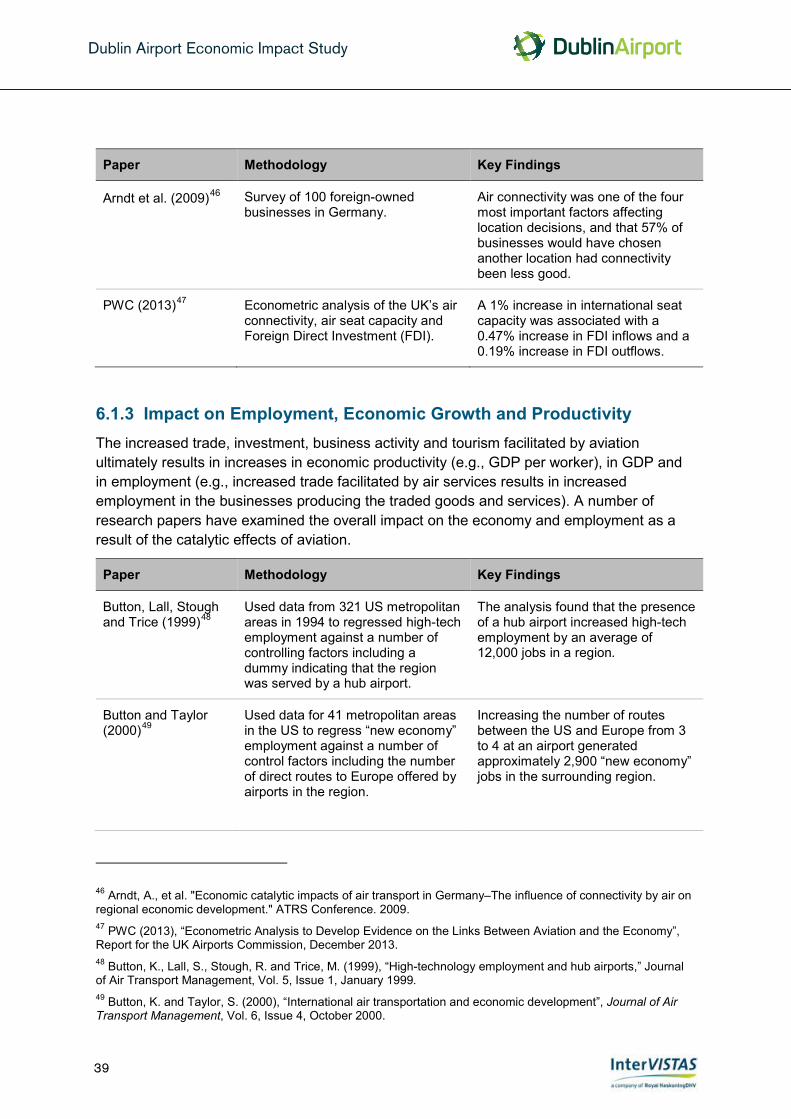
Dublin Airport Economic Impact Study 38
6.1.2 Investment and Business Location The impact of aviation on investment and business location decisions has been the subject of a number of papers. These papers have found evidence of air connectivity contributing to increased investment and beneficial location decision for the surrounding regions or the country.
Paper Methodology Key Findings
Hansen and Gerstein (1991)42
Used data from 1982 to 1987, the analysis related the amount of Japanese investment in each US state to measures of level of air service operated between Japan and that state (and other background factors).
The amount of Japanese investment in each US state was causally linked to the air service between Japan and that state.
EUROCONTROL (2005)43
Analysed the relationship between air transportation and business investment in the EU.
A 10% increase in air transportation usage increases business investment by 1.6% in the long run (the impact takes approximately five years to fully manifest).
IATA (2005)44 IATA surveyed 625 businesses in five countries (China, Chile, United States, Czech Republic and France).
25% of surveyed businesses in five countries indicated that 25% of their sales were dependent on good air transport links; 30% of Chinese firms reported that they had changed investment decisions because of constraints on air services.
Bel and Fageda (2008)45
Statistically analysed the relationship between international air service and the location of large firm’s headquarters across major European urban areas.
A 10% increase in supply of intercontinental air service was associated with a 4% increase in the number of large firm headquarters located in the corresponding urban area.
42 Hansen, M. and R. Gerstein "Capital in Flight: Japanese Investment and Japanese Air Service in the United States During the 1980s," Logistics and Transportation Review, 1991, Vol. 27, No. 3, pp. 257-276. 43 Cooper, A. and Smith, P. (2005), “The Economic Catalytic Effects of Air Transport in Europe,” Commissioned by EUROCONTROL. EUROCONTROL is a civil and military organisation established in 1963 to facilitate a safe, seamless pan-European Air Traffic Management (ATM) system. 44 Airline Network Benefits, IATA Economic Briefing No. 3, 2006. 45 Bel, G. and Fageda, X. (2008), “Getting There Fast: Globalization, Intercontinental Flights and Location of Headquarters”, Journal of Economic Geography, Vol. 8, No. 4.
Dublin Airport Economic Impact Study 39
Paper Methodology Key Findings
Arndt et al. (2009)46 Survey of 100 foreign-owned businesses in Germany.
Air connectivity was one of the four most important factors affecting location decisions, and that 57% of businesses would have chosen another location had connectivity been less good.
PWC (2013)47 Econometric analysis of the UK’s air connectivity, air seat capacity and Foreign Direct Investment (FDI).
A 1% increase in international seat capacity was associated with a 0.47% increase in FDI inflows and a 0.19% increase in FDI outflows.
6.1.3 Impact on Employment, Economic Growth and Productivity The increased trade, investment, business activity and tourism facilitated by aviation ultimately results in increases in economic productivity (e.g., GDP per worker), in GDP and in employment (e.g., increased trade facilitated by air services results in increased employment in the businesses producing the traded goods and services). A number of research papers have examined the overall impact on the economy and employment as a result of the catalytic effects of aviation.
Paper Methodology Key Findings
Button, Lall, Stough and Trice (1999)48
Used data from 321 US metropolitan areas in 1994 to regressed high-tech employment against a number of controlling factors including a dummy indicating that the region was served by a hub airport.
The analysis found that the presence of a hub airport increased high-tech employment by an average of 12,000 jobs in a region.
Button and Taylor (2000)49
Used data for 41 metropolitan areas in the US to regress “new economy” employment against a number of control factors including the number of direct routes to Europe offered by airports in the region.
Increasing the number of routes between the US and Europe from 3 to 4 at an airport generated approximately 2,900 “new economy” jobs in the surrounding region.
46 Arndt, A., et al. "Economic catalytic impacts of air transport in Germany–The influence of connectivity by air on regional economic development." ATRS Conference. 2009. 47 PWC (2013), “Econometric Analysis to Develop Evidence on the Links Between Aviation and the Economy”, Report for the UK Airports Commission, December 2013. 48 Button, K., Lall, S., Stough, R. and Trice, M. (1999), “High-technology employment and hub airports,” Journal of Air Transport Management, Vol. 5, Issue 1, January 1999. 49 Button, K. and Taylor, S. (2000), “International air transportation and economic development”, Journal of Air Transport Management, Vol. 6, Issue 4, October 2000.
Dublin Airport Economic Impact Study
39

Dublin Airport Economic Impact Study 40
Paper Methodology Key Findings
Brueckner (2002)50 Regressed employment in 94 metropolitan areas in the USagainst a number of factors including measures of air service.
A 10 percent increase in passenger enplanements in a metropolitan area leads to an approximately 1 percent increase in employment in service-related industries.
Ishutkina and Hansman (2009)51
Aggregate and individual country-level data were analysed in terms of the relationship between air transportation passengers and GDP. A data analysis of 139 countries over a time period of 30 years (1975 to 2005).
Found statistical evidence of a (two-way) feedback relationship between air transport and economic activity.
PWC (2013)52 Estimated an Error Correction Model of UK GDP and air seat capacity between 1991 and 2010.
A 10% change in the growth rate of seat capacity leads to approximately a 1% change in the growth rate of GDP. The analysis also found evidence of a two-way relationship between the variables – GDP growth causes seat capacity and seat growth causes GDP growth.
ACI Europe/ InterVISTAS
Analysed the relationship between national air connectivity and GDP per capita using data for 40 European countries between 2000 and 2012.
This recently completed analysis found that a 10% increase in connectivity was associated with an increase in GDP per capita of 0.6%. Additional analysis found evidence that this relationship was two-way. That is, as an economy grows, it supports a larger air transport sector, but it appears to also be the case that growth in air transport supports economic growth.
50 Brueckner, J. (2002), “Airline Traffic and Urban Economic Development”. 51 Ishutkina M.A. and Hasnman R.J. (2009), “Analysis of the interaction between air transportation and economic activity: a worldwide perspective”, PhD thesis, Department of Aeronautics and Astronautics, Massachusetts Institute of Technology. 52 PWC (2013), “Econometric Analysis to Develop Evidence on the Links Between Aviation and the Economy”, Report for the UK Airports Commission, December 2013.
Dublin Airport Economic Impact Study
40

Dublin Airport Economic Impact Study 40
Paper Methodology Key Findings
Brueckner (2002)50 Regressed employment in 94 metropolitan areas in the USagainst a number of factors including measures of air service.
A 10 percent increase in passenger enplanements in a metropolitan area leads to an approximately 1 percent increase in employment in service-related industries.
Ishutkina and Hansman (2009)51
Aggregate and individual country-level data were analysed in terms of the relationship between air transportation passengers and GDP. A data analysis of 139 countries over a time period of 30 years (1975 to 2005).
Found statistical evidence of a (two-way) feedback relationship between air transport and economic activity.
PWC (2013)52 Estimated an Error Correction Model of UK GDP and air seat capacity between 1991 and 2010.
A 10% change in the growth rate of seat capacity leads to approximately a 1% change in the growth rate of GDP. The analysis also found evidence of a two-way relationship between the variables – GDP growth causes seat capacity and seat growth causes GDP growth.
ACI Europe/ InterVISTAS
Analysed the relationship between national air connectivity and GDP per capita using data for 40 European countries between 2000 and 2012.
This recently completed analysis found that a 10% increase in connectivity was associated with an increase in GDP per capita of 0.6%. Additional analysis found evidence that this relationship was two-way. That is, as an economy grows, it supports a larger air transport sector, but it appears to also be the case that growth in air transport supports economic growth.
50 Brueckner, J. (2002), “Airline Traffic and Urban Economic Development”. 51 Ishutkina M.A. and Hasnman R.J. (2009), “Analysis of the interaction between air transportation and economic activity: a worldwide perspective”, PhD thesis, Department of Aeronautics and Astronautics, Massachusetts Institute of Technology. 52 PWC (2013), “Econometric Analysis to Develop Evidence on the Links Between Aviation and the Economy”, Report for the UK Airports Commission, December 2013.
Dublin Airport Economic Impact Study 41
6.1.4 Conclusions A body of research has developed over the last 15 years or so which has examined and quantified the contribution of air transport to trade, investment and economic growth. Through the use of different empirical methods and data sets, this research has consistently found a significant and positive relationship between aviation and economic growth. Furthermore, much of the research has established that air transport growth has been the cause of economic growth, rather than simply economic growth leading to increased air transport levels.
6.2 Linkage Between Dublin Airport’s Connectivity and the Economy
To explore Dublin Airport’s contribution to the national and regional economy, analysis was conducted of the relationship between connectivity at the airport and key economic indicators over time. Connectivity at Dublin Airport was measured using the IATA connectivity index described in Section 3.4, and the economic indicators were:
Inbound tourism to the Republic of Ireland; The total value of exports from Ireland; Inward Foreign Direct Investment (FDI); The GDP of the Republic of Ireland; The regional GVA of Dublin and the Mid-East region.
The scatter plots below show the relationship between connectivity at Dublin Airport and each of these economic indicators for a period of 10-15 years (depending on data availability). In each case, the plots demonstrate a positive correlation between connectivity and the economic indicator. In some cases, there is considerable scatter of observations which is not surprising, given that there a large number of other factors that affect the economic indicators. However, even given these sources of variation, there appears to be a clear pattern visible with these simple plots.
“With nearly 70% of all visitors to the Republic of Ireland arriving through Dublin Airport it is vital that we continue to invest in enhancing the airport to deliver the best possible arrival experience in line with our reputation for a great welcome. Tourism Ireland is very committed to delivering ten million visitors to Ireland by 2025, in line with the National Tourism Policy for Ireland, and the increased air connectivity needed to deliver this stretching goal will require an early commitment to the substantial expansion of the services available at Dublin Airport in particular.”
Tourism Ireland, November 2014
Dublin Airport Economic Impact Study
41
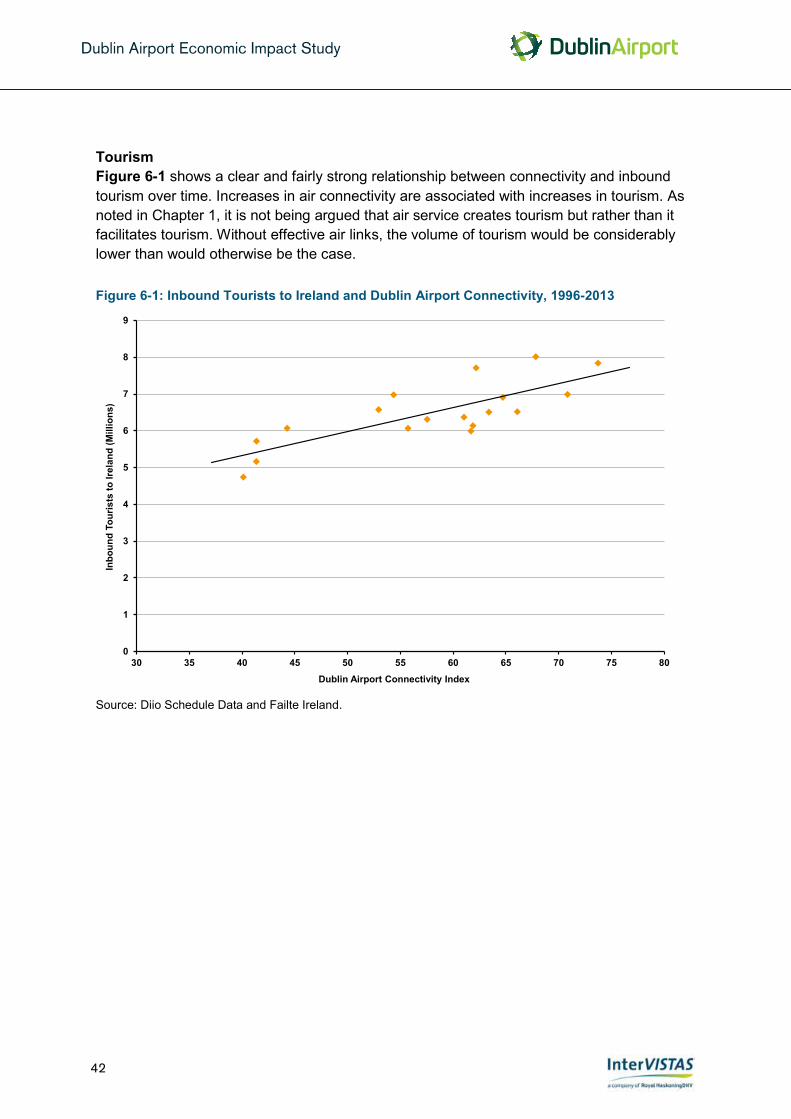
Dublin Airport Economic Impact Study 42
Tourism Figure 6-1 shows a clear and fairly strong relationship between connectivity and inbound tourism over time. Increases in air connectivity are associated with increases in tourism. As noted in Chapter 1, it is not being argued that air service creates tourism but rather than it facilitates tourism. Without effective air links, the volume of tourism would be considerably lower than would otherwise be the case.
Figure 6-1: Inbound Tourists to Ireland and Dublin Airport Connectivity, 1996-2013
Source: Diio Schedule Data and Failte Ireland.
0
1
2
3
4
5
6
7
8
9
30 35 40 45 50 55 60 65 70 75 80
Inbo
und
Tour
ists
to Ir
elan
d (M
illio
ns)
Dublin Airport Connectivity Index
Dublin Airport Economic Impact Study
42

Dublin Airport Economic Impact Study 42
Tourism Figure 6-1 shows a clear and fairly strong relationship between connectivity and inbound tourism over time. Increases in air connectivity are associated with increases in tourism. As noted in Chapter 1, it is not being argued that air service creates tourism but rather than it facilitates tourism. Without effective air links, the volume of tourism would be considerably lower than would otherwise be the case.
Figure 6-1: Inbound Tourists to Ireland and Dublin Airport Connectivity, 1996-2013
Source: Diio Schedule Data and Failte Ireland.
0
1
2
3
4
5
6
7
8
9
30 35 40 45 50 55 60 65 70 75 80
Inbo
und
Tour
ists
to Ir
elan
d (M
illio
ns)
Dublin Airport Connectivity Index
Dublin Airport Economic Impact Study 43
Exports Similar to the previous chart, Figure 6-2 shows a clear and fairly strong relationship between connectivity and the value of Irish exports, indicating that increases in air connectivity are associated with increases in Ireland’s total exports.
Figure 6-2: Irish Exports and Dublin Airport Connectivity, 1998-2013
Source: Diio Schedule Data and Central Statistics Office Ireland.
The relationship between connectivity of Dublin Airport and Ireland’s export trade is further illustrated in Figure 6-3. It shows the value of merchandise exports (i.e., goods) from Ireland to countries with frequent air service from Dublin (at least five times per week on a year-round basis), and to those countries with limited or no frequencies from Dublin. The value of exports with the well connected countries is five to six times that of trade with poorly connected countries. Furthermore, between 2002 and 2012, the value of exports to well-connected countries increased by 14%, but declined by 11% to poorly connected countries.
0
20
40
60
80
100
120
30 35 40 45 50 55 60 65 70 75 80
Irish
Exp
orts
(€B
illio
ns)
Dublin Airport Connectivity Index
Dublin Airport Economic Impact Study
43

Dublin Airport Economic Impact Study 44
Figure 6-3: Ireland’s Exports and Direct Services from Dublin Airport, 2000-2012
Source: Diio Schedule Data, Central Statistics Office Ireland and U.N. Comtrade Database.
Passenger services play a vital role in the development of trade through the bellyhold capacity provided on such services.
In 2013, cargo tonnage at Dublin Airport reached a record level of 127,471 tonnes, an increase of 26,300 tonnes since 2011. daa calculate that over half this increase (16,000 tonnes) has been driven by rapid growth in cargo to Abu Dhabi and Dubai. This market has tripled in size since 2011, facilitated by significant expansion from Emirates and Etihad. A further 3,600 tonnes have been driven by growth on transatlantic routes, helped by the new service to San Francisco. Altogether, almost 75% of the growth in cargo throughput has come via growth in the long-haul market.
There is a two-way relationship between air cargo and trade development. Just as cargo potential plays a key part in the business case for new long-haul routes, new long-haul links open up new markets for Irish exports, a mutually beneficial relationship.
0
10
20
30
40
50
60
70
80
90
2000 2001 2002 2003 2004 2005 2006 2007 2008 2009 2010 2011 2012
Irish
Exp
orts
(€B
illio
ns)
Well Connected Countries
Poorly Connected Countries
Dublin Airport Economic Impact Study
44

Dublin Airport Economic Impact Study 44
Figure 6-3: Ireland’s Exports and Direct Services from Dublin Airport, 2000-2012
Source: Diio Schedule Data, Central Statistics Office Ireland and U.N. Comtrade Database.
Passenger services play a vital role in the development of trade through the bellyhold capacity provided on such services.
In 2013, cargo tonnage at Dublin Airport reached a record level of 127,471 tonnes, an increase of 26,300 tonnes since 2011. daa calculate that over half this increase (16,000 tonnes) has been driven by rapid growth in cargo to Abu Dhabi and Dubai. This market has tripled in size since 2011, facilitated by significant expansion from Emirates and Etihad. A further 3,600 tonnes have been driven by growth on transatlantic routes, helped by the new service to San Francisco. Altogether, almost 75% of the growth in cargo throughput has come via growth in the long-haul market.
There is a two-way relationship between air cargo and trade development. Just as cargo potential plays a key part in the business case for new long-haul routes, new long-haul links open up new markets for Irish exports, a mutually beneficial relationship.
0
10
20
30
40
50
60
70
80
90
2000 2001 2002 2003 2004 2005 2006 2007 2008 2009 2010 2011 2012
Irish
Exp
orts
(€B
illio
ns)
Well Connected Countries
Poorly Connected Countries
Dublin Airport Economic Impact Study 45
Foreign Direct Investment (FDI) A positive relationship is illustrated in Figure 6-4. There is considerably greater scatter to this relationship than the other economic indicators. FDI is a combination of building new facilities, mergers and acquisitions, reinvestment of earnings and intra-company loans. Therefore, it is affected by a great number of factors, (e.g., it can be affected by the performance of the stock market),53 and can reflect business decisions made over a number of years. Nevertheless, the overall relationship between connectivity and FDI is evident.
Figure 6-4: Foreign Direct Investment to Ireland and Dublin Airport Connectivity, 2001-2012
Source: Diio Schedule Data and Failte Ireland.
53 Although FDI does not include so-called passive investment in shares traded in stock exchanges, the performance of the stock market can affect the amounts paid in mergers and acquisitions.
0
5
10
15
20
25
30
35
30 35 40 45 50 55 60 65 70 75 80
Fore
ign
Dire
ct In
vest
men
t (€
Bill
ions
)
Dublin Airport Connectivity Index
Dublin Airport Economic Impact Study
45

Dublin Airport Economic Impact Study 46
Economic Growth Figures 6-5 and 6-6 show the relationship between connectivity and national and regional economic activity. In both cases, there is a clear positive correlation.
Figure 6-5: National GDP and Dublin Airport Connectivity, 1997-2013
Source: Diio Schedule Data and Central Statistics Office Ireland.
0
20
40
60
80
100
120
140
160
180
200
30 35 40 45 50 55 60 65 70 75 80
Irish
GD
P (€
Bill
ions
)
Dublin Airport Connectivity Index
Dublin Airport Economic Impact Study
46

Dublin Airport Economic Impact Study 46
Economic Growth Figures 6-5 and 6-6 show the relationship between connectivity and national and regional economic activity. In both cases, there is a clear positive correlation.
Figure 6-5: National GDP and Dublin Airport Connectivity, 1997-2013
Source: Diio Schedule Data and Central Statistics Office Ireland.
0
20
40
60
80
100
120
140
160
180
200
30 35 40 45 50 55 60 65 70 75 80
Irish
GD
P (€
Bill
ions
)
Dublin Airport Connectivity Index
Dublin Airport Economic Impact Study 47
Figure 6-6: Regional GVA (Dublin and Mid-East) and Dublin Airport Connectivity, 2000-2011
Source: Diio Schedule Data and Central Statistics Office Ireland.
Summary The plots presented above are indicative of the underlying relationship between Dublin Airport’s connectivity and economic development. More detailed analysis would be required to control for other factors affecting the economic indicators (e.g., government policy, general economic environment, etc.) and to establish the nature of the causal relationship between connectivity and the economic indicators. For example, air connectivity alone cannot create trade – a new air service to a country will not guarantee a surge in trade with that country. That said, it is also the case that poor air connectivity to a country will hinder the ability to develop business contracts, service clients and to compete with businesses in better connected countries.
As the data in these charts is not sufficiently large to conduct a more detailed analysis which controls for other factors, use has been made of the results from a larger European study in order to estimate the catalytic impact of Dublin Airport. This is described in Section 6.3.
0
10
20
30
40
50
60
70
80
90
50 55 60 65 70 75
Reg
iona
l GVA
, Dub
lin &
Mid
-Eas
t (€
Bill
ions
)
Dublin Airport Connectivity Index
Dublin Airport Economic Impact Study
47

Dublin Airport Economic Impact Study 48
6.3 Estimating the Catalytic Impact of Dublin Airport
The economy of Ireland is a diversified knowledge-based economy, focusing on services and high-tech industries and dependent on trade, industry and investment. Adjusted for cost of living (purchasing power parity), the IMF ranks Ireland fifth in Europe in terms of per capita GDP, behind Luxembourg, Norway, Netherlands and Switzerland, but ahead of Germany, Sweden, the UK and France.54 This is despite the severe economic downturn Ireland suffered starting in 2008. There are now signs that the Irish economy has turned a corner, and is set to return to strong growth.55
A large number of factors have contributed to Ireland’s economic success – business regulations, government policy, taxation, the education and skillset of the local population, geographic location, etc. Nevertheless, the quality and range of air services available at Dublin Airport is a contributing factor. Ireland’s position as a trading and business hub would not be possible without the high degree of air connectivity provided by Dublin Airport. Section 6.1 documented research showing the importance of air service to business location decisions and how air service facilitates other sectors of the economy. The air service at Dublin Airport transports high-value exports around the world and enables employees of Irish and multinational businesses to travel to clients, regional offices and global headquarters. Many of the businesses with regional headquarters in Ireland would not be located there without the mobility that Dublin Airport provides.
Quantifying the catalytic impacts that Dublin Airport provides to the Irish economy is difficult. To do so in detail would require a massive survey covering the majority of businesses based in Ireland. Even with such a survey, some aspects of the catalytic impact would be difficult to ascertain. While measuring the tourism and trade transported by air would be fairly easy, it is far more difficult to determine and value Dublin Airport’s role in affecting business location decisions, investment and expansion decisions, facilitating corporate mobility, and attracting international talent.
An alternative approach is to use generalised parameters drawn from statistical analysis of historical data. This analysis seeks to determine the contribution of air transport to economic growth by examining the relationship between these factors over time or compared between
54 World Economic Outlook Database, IMF, 2013. 55 “Ireland set to become fastest-growing EU economy”, Irish Times, 4 November 2014.
“While just 1% of Irish export volume is by air, this represents about 33% of our export value. The development of new routes and services at Dublin Airport is vital for exporters to improve connectivity to new and emerging markets. In order to serve these new markets and support export growth, it is also time to investigate runway extension and improved facilities for large aircraft to access these markets.”
Irish Exporters Association, January 2015
Dublin Airport Economic Impact Study
48

Dublin Airport Economic Impact Study 48
6.3 Estimating the Catalytic Impact of Dublin Airport
The economy of Ireland is a diversified knowledge-based economy, focusing on services and high-tech industries and dependent on trade, industry and investment. Adjusted for cost of living (purchasing power parity), the IMF ranks Ireland fifth in Europe in terms of per capita GDP, behind Luxembourg, Norway, Netherlands and Switzerland, but ahead of Germany, Sweden, the UK and France.54 This is despite the severe economic downturn Ireland suffered starting in 2008. There are now signs that the Irish economy has turned a corner, and is set to return to strong growth.55
A large number of factors have contributed to Ireland’s economic success – business regulations, government policy, taxation, the education and skillset of the local population, geographic location, etc. Nevertheless, the quality and range of air services available at Dublin Airport is a contributing factor. Ireland’s position as a trading and business hub would not be possible without the high degree of air connectivity provided by Dublin Airport. Section 6.1 documented research showing the importance of air service to business location decisions and how air service facilitates other sectors of the economy. The air service at Dublin Airport transports high-value exports around the world and enables employees of Irish and multinational businesses to travel to clients, regional offices and global headquarters. Many of the businesses with regional headquarters in Ireland would not be located there without the mobility that Dublin Airport provides.
Quantifying the catalytic impacts that Dublin Airport provides to the Irish economy is difficult. To do so in detail would require a massive survey covering the majority of businesses based in Ireland. Even with such a survey, some aspects of the catalytic impact would be difficult to ascertain. While measuring the tourism and trade transported by air would be fairly easy, it is far more difficult to determine and value Dublin Airport’s role in affecting business location decisions, investment and expansion decisions, facilitating corporate mobility, and attracting international talent.
An alternative approach is to use generalised parameters drawn from statistical analysis of historical data. This analysis seeks to determine the contribution of air transport to economic growth by examining the relationship between these factors over time or compared between
54 World Economic Outlook Database, IMF, 2013. 55 “Ireland set to become fastest-growing EU economy”, Irish Times, 4 November 2014.
“While just 1% of Irish export volume is by air, this represents about 33% of our export value. The development of new routes and services at Dublin Airport is vital for exporters to improve connectivity to new and emerging markets. In order to serve these new markets and support export growth, it is also time to investigate runway extension and improved facilities for large aircraft to access these markets.”
Irish Exporters Association, January 2015
Dublin Airport Economic Impact Study 49
different countries (or both). The analysis attempts to control for other factors that also contribute to economic growth (education spending, government policies, investment, research and development spending, etc.), in order to isolate the impact of air transport. The catalytic impact of Dublin Airport was estimated in this way, using findings from recent research.
The connectivity parameter was taken from a recent study undertaken by InterVISTAS on behalf of ACI Europe.56 This study was previously referenced in Section 6.1.3. It was selected because it has been recently completed using the most current data and was based on data from 40 European countries including Ireland.
The parameter from that study found that a 10% increase in air connectivity increased GDP per capita by 0.5%. The measure of connectivity used for this parameter is the IATA index presented in Section 3.4. While the outcome from the parameter is expressed in terms of GDP per capita, it captures the aggregate net effect of a range of catalytic impacts, including tourism, trade, investment, business location, etc., which manifest themselves as greater per capita GDP.
To estimate the catalytic impact of Dublin Airport, the analysis was based on the growth in air connectivity Dublin Airport over the last 20 years – 1993 to 2013. The year 1993 was selected as it ties in with the completion of the European Union’s de-regulation of aviation (the “third package” came into place in 1993, which fully opened up the EU market for all EU airlines) and the start of the Low Cost Carrier phenomenon. Using the results from the ACI Europe study, the analysis estimated the GDP per capita that has been facilitated by the growth in connectivity at Dublin Airport since 1993. In other words, it is that the amount of GDP that would have been foregone if air connectivity at Dublin Airport had been unchanged since 1993. Arguably, this is a conservative approach to estimating the catalytic impacts, as it does not consider connectivity changes prior to 1993.
Between 1993 and 2013, Ireland’s connectivity index (divided by GDP) increased by 66%, of which Dublin Airport was responsible for 85%. Applying the catalytic parameter, this suggests that the contribution to per capita GDP growth was 85% x 0.05 x 66% = 2.8%.57 In other words, without the connectivity provided at Dublin Airport since 1993, the GDP per capita of Ireland would be 2.8% lower (due to less trade and tourism, less investment, fewer companies based in Ireland, etc.).
56 InterVISTAS Consulting Inc., “The Economic Impact of European Airports: A Critical Catalyst to Growth”, ACI Europe, January 2015. 57 In Section 3.4, it is stated that Dublin Airport accounted for 81% of Ireland’s connectivity score in 2013. However, in terms of the growth of connectivity between 1993 and 2013, Dublin Airport contributed 85% of this growth.
Dublin Airport Economic Impact Study
49

Dublin Airport Economic Impact Study 50
This percentage was applied to the GDP per capita of Ireland in 1993 (inflated to 2013 prices) and multiplied by the estimated 2013 population of Ireland to estimate the overall GDP impact:
€35,600 x 2.8% x 4.59 million = €4.16 billion
The GDP attributable to the catalytic impacts of Dublin Airport is the result of incremental economic activity supported and stimulated by air connectivity – increased tourism visits and spending, greater trade, new investment, etc. This activity supports additional jobs in the economy, which were estimated by dividing the GDP estimate by the average GDP per worker in Ireland. Similarly, the income impacts were based on the average wage figures.
These employment and economic estimates are presented in Figure 6-6. It is estimated that a total of 60,100 jobs are associated with the catalytic impacts of Dublin Airport, earning €2.1 billion in income and wages. The catalytic impacts of Dublin Airport facilitated €4.2 billion in GDP, which is equivalent to approximately 2.4% of the total GDP of Ireland in 2013.58
Figure 6-7: The Catalytic Impacts of Dublin Airport
Impact Type Total Impact
Number of Jobs 60,100
Full-Time Equivalents (FTEs) 53,100
Income/Wages (€ Million) 2,109
Value-Added (€ Million) (% of national GDP)
4,155 (2.4%)
58 Based CSO data, the GDP of Ireland was €174.8 billion in 2013.
Dublin Airport Economic Impact Study
50

Dublin Airport Economic Impact Study 50
This percentage was applied to the GDP per capita of Ireland in 1993 (inflated to 2013 prices) and multiplied by the estimated 2013 population of Ireland to estimate the overall GDP impact:
€35,600 x 2.8% x 4.59 million = €4.16 billion
The GDP attributable to the catalytic impacts of Dublin Airport is the result of incremental economic activity supported and stimulated by air connectivity – increased tourism visits and spending, greater trade, new investment, etc. This activity supports additional jobs in the economy, which were estimated by dividing the GDP estimate by the average GDP per worker in Ireland. Similarly, the income impacts were based on the average wage figures.
These employment and economic estimates are presented in Figure 6-6. It is estimated that a total of 60,100 jobs are associated with the catalytic impacts of Dublin Airport, earning €2.1 billion in income and wages. The catalytic impacts of Dublin Airport facilitated €4.2 billion in GDP, which is equivalent to approximately 2.4% of the total GDP of Ireland in 2013.58
Figure 6-7: The Catalytic Impacts of Dublin Airport
Impact Type Total Impact
Number of Jobs 60,100
Full-Time Equivalents (FTEs) 53,100
Income/Wages (€ Million) 2,109
Value-Added (€ Million) (% of national GDP)
4,155 (2.4%)
58 Based CSO data, the GDP of Ireland was €174.8 billion in 2013.
Dublin Airport Economic Impact Study 51
6.4 Breakdowns of the Catalytic Impacts by Region The estimated regional breakdown of the catalytic impacts is provided in Figure 6-8. The breakdowns are based on the distribution of employment and GDP across Ireland available from CSO Ireland. In terms of employment, about 31% of employment impact occurs in Dublin (including Fingal), 28% in the rest of Leinster and 41% in the rest of Ireland.59
Figure 6-8: The Catalytic Impacts of Dublin Airport by Region
Region Jobs FTEs Income (€ Million)
GVA (€ Million)
Fingal 5,600 4,900 239 471
Rest of Dublin 13,300 11,700 553 1,090
Rest of Leinster 16,600 14,700 533 1,050
Rest of Ireland 24,600 21,800 784 1,544
Total 60,100 53,100 2,109 4,155
59 The figures do not include Northern Ireland. It is likely that Dublin Airport has a catalytic impact on Northern Ireland, given the fairly substantial number of passengers from Northern Ireland using the airport. However, it was not possible to model those impacts.
Dublin Airport Economic Impact Study
51

Dublin Airport Economic Impact Study 52
7 Summary: Total Economic Impact of Dublin Airport
Key Points Including the activity directly related to the airport, the multiplier impacts that flow from it,
and the other sectors of the economy facilitated by the airport, Dublin Airport contributes to the employment of 97,400 people in Ireland.
To put these numbers into context, this employment is more than the population of Limerick and about half the population of Cork.
The people in these jobs receive almost €3.5 billion in income/wages. The total GVA generated is nearly €6.8 billion, approximately 4.0% of the GDP of Ireland
in 2013. 48% of the employment impact occurs within Dublin (including Fingal), a further 21%
occurs within the rest of Leinster and 31% occurs across the rest of Ireland.
The total economic impact both generated and facilitated by Dublin Airport is shown in Figures 7-1 and 7-2. Including the activity directly related to the airport, the multiplier impacts that flow from it, and the other sectors of the economy facilitated by the airport, Dublin Airport contributes to the employment of 97,400 people in Ireland, equivalent to 86,200 full-time jobs, earning a total of €3.5 billion. To put these numbers into context, the total jobs (97,400) is more than the population of Limerick about half the population of Cork.60 A total of €6.9 billion is contributed to GDP, equal to 4.0% of national GDP.
Figure 7-1: Total Economic Impact Generated and Facilitated by Dublin Airport (Direct+Indirect+Induced+Catalytic)
Impact Type Jobs FTEs Income (€ Million)
GVA (€ Million)
GVA as % of National
GDP
Direct 15,700 14,000 639 1,256 0.7%
Indirect 9,600 8,500 373 717 0.4%
Induced 12,000 10,600 397 781 0.4%
Catalytic 60,100 53,100 2,109 4,155 2.4%
Total 97,400 86,200 3,518 6,909 4.0%
Numbers may not add up due to rounding.
60 Source: CSO Ireland: Census 2011 Results. Based on the population of the city and surrounding suburbs. Population of Limerick: 91,454; population of Cork: 198,582.
Dublin Airport Economic Impact Study
52

Dublin Airport Economic Impact Study 52
7 Summary: Total Economic Impact of Dublin Airport
Key Points Including the activity directly related to the airport, the multiplier impacts that flow from it,
and the other sectors of the economy facilitated by the airport, Dublin Airport contributes to the employment of 97,400 people in Ireland.
To put these numbers into context, this employment is more than the population of Limerick and about half the population of Cork.
The people in these jobs receive almost €3.5 billion in income/wages. The total GVA generated is nearly €6.8 billion, approximately 4.0% of the GDP of Ireland
in 2013. 48% of the employment impact occurs within Dublin (including Fingal), a further 21%
occurs within the rest of Leinster and 31% occurs across the rest of Ireland.
The total economic impact both generated and facilitated by Dublin Airport is shown in Figures 7-1 and 7-2. Including the activity directly related to the airport, the multiplier impacts that flow from it, and the other sectors of the economy facilitated by the airport, Dublin Airport contributes to the employment of 97,400 people in Ireland, equivalent to 86,200 full-time jobs, earning a total of €3.5 billion. To put these numbers into context, the total jobs (97,400) is more than the population of Limerick about half the population of Cork.60 A total of €6.9 billion is contributed to GDP, equal to 4.0% of national GDP.
Figure 7-1: Total Economic Impact Generated and Facilitated by Dublin Airport (Direct+Indirect+Induced+Catalytic)
Impact Type Jobs FTEs Income (€ Million)
GVA (€ Million)
GVA as % of National
GDP
Direct 15,700 14,000 639 1,256 0.7%
Indirect 9,600 8,500 373 717 0.4%
Induced 12,000 10,600 397 781 0.4%
Catalytic 60,100 53,100 2,109 4,155 2.4%
Total 97,400 86,200 3,518 6,909 4.0%
Numbers may not add up due to rounding.
60 Source: CSO Ireland: Census 2011 Results. Based on the population of the city and surrounding suburbs. Population of Limerick: 91,454; population of Cork: 198,582.
Dublin Airport Economic Impact Study 53
While these figures are substantial, it is worth considering how Ireland’s economy might look if the country did not have a hub airport of the size of Dublin Airport offering the scope of air services currently provided. At the most extreme, Ireland could have no commercial airports, instead relying on sea access to airports in the UK, or Dublin could have smaller regional airports acting as spokes for other hubs in the UK and the rest of Europe, so that passengers would have to travel via these hubs to get to many parts of the world. In these such scenarios, it is easy to imagine that tourism to Ireland would be much lower, that Dublin would not be able to attract as many carriers to operate services (or to have aircraft maintained and repaired in Ireland), that the overall volume of trade would be substantially lower, and that some companies would chose not to locate or expand in Ireland. The net effect of this would be a smaller, slower-growing economy.
Figure 7-2: Total Employment and GVA Impact Generated by Category
Catalytic 60,100
Induced 12,000
Indirect 9,600
Direct 15,700
Dublin
Empl
oym
ent (
Jobs
)
97,400
Catalytic 4,155
Induced 781
Indirect 717
Direct 1,256
Dublin
GVA
(€M
illio
n)6,909
Dublin Airport Economic Impact Study
53

Dublin Airport Economic Impact Study 54
The total economic impact broken down by region is provided in Figure 7-3. About 48% of the employment impact (47,170 jobs) occurs within Dublin (including Fingal). A further 21% (20,900 jobs) occurs within the rest of Leinster and 31% (29,330 jobs) occurs across the rest of Ireland.
Figure 7-3: Total Economic Impact Generated and Facilitated by Dublin Airport by Region (Direct+Indirect+Induced+Catalytic)
Region Jobs FTEs Income (€ Million)
GVA (€ Million)
% of GVA
Fingal 25,150 22,400 1,011 1,984 18.9%
Rest of Dublin 22,020 19,300 873 1,713 3.3%
Rest of Leinster 20,900 18,500 682 1,341 3.1%
Rest of Ireland 29,330 26,000 951 1,871 3.4%
Total 97,400 86,200 3,518 6,909 4.0%
Numbers may not add up due to rounding. % of GVA: Gross Value Added generated in the region as a percentage of estimated total GVA in that region.
Dublin Airport Economic Impact Study
54

Dublin Airport Economic Impact Study 54
The total economic impact broken down by region is provided in Figure 7-3. About 48% of the employment impact (47,170 jobs) occurs within Dublin (including Fingal). A further 21% (20,900 jobs) occurs within the rest of Leinster and 31% (29,330 jobs) occurs across the rest of Ireland.
Figure 7-3: Total Economic Impact Generated and Facilitated by Dublin Airport by Region (Direct+Indirect+Induced+Catalytic)
Region Jobs FTEs Income (€ Million)
GVA (€ Million)
% of GVA
Fingal 25,150 22,400 1,011 1,984 18.9%
Rest of Dublin 22,020 19,300 873 1,713 3.3%
Rest of Leinster 20,900 18,500 682 1,341 3.1%
Rest of Ireland 29,330 26,000 951 1,871 3.4%
Total 97,400 86,200 3,518 6,909 4.0%
Numbers may not add up due to rounding. % of GVA: Gross Value Added generated in the region as a percentage of estimated total GVA in that region.
Dublin Airport Economic Impact Study 55
8 The Future Economic Impact of Dublin Airport
Key Points Based on the unconstrained Centreline traffic forecasts,61 and including the Dublin
Airport Central campus, the total economic impact of Dublin Airport could reach an estimated 194,000 jobs and €14.4 billion in GVA by 2043, roughly double the current economic impact.
A second runway at Dublin Airport is essential to enhancing the connectivity of Ireland, particularly to fast growing economies in Asia, Africa and South America.
A second runway will facilitate economic growth in the economy worth 31,200 jobs and contribute to €2.2 billion to national GDP by 2043.
In 2014, Dublin Airport handled 21.7 million passenger movements, an 18% increase on traffic levels during the depth of the global recession. Traffic volumes at Dublin Airport are expected to continue growing, as the Irish economy returns to growth, strong economic growth in emerging economies opens up new markets, and new high technology aircraft (e.g., the Boeing 787 and Airbus A350) makes more routes economically viable.
As air services at Dublin Airport grow, the economic contribution of the airport is expected to grow as well. As more aircraft take-off and land, additional staff will be needed to crew, clean and maintain the aircraft, to service passengers and transport their luggage, and to process, load and unload air cargo (i.e., the direct impacts). Air carriers and other businesses at the airport will order additional goods and services from their suppliers (indirect impacts), and the increased employment will stimulate spending in the general economy (induced impacts). In addition, the new routes and greater frequencies at Dublin Airport will help facilitate increased tourism, trade, investment and attract business to Ireland (catalytic impacts).
InterVISTAS estimated the following:
The future economic impact of Dublin Airport up to 2043, primarily based on traffic forecasts produced by daa. The economic impact estimate also includes the impact of the Dublin Airport Central development, a proposed commercial campus on airport land potentially comprising offices, retail, hotels and other facilities (described in Section 8.2).
The economic impact that will potentially be delivered by the timely building of a second runway at Dublin Airport, allowing it to fully accommodate traffic demand.
61 Forecast DAPF14-02 (produced November 2014).
Dublin Airport Economic Impact Study
55

Dublin Airport Economic Impact Study 56
8.1 Forecast Traffic Development at Dublin Airport
The future economic impact estimates are based on air traffic forecasts produced by daa.62 These forecasts are derived from a sophisticated econometric forecast model. All the major air traffic routes are represented separately in the model, with the remaining routes divided into various groups (i.e. Domestic, UK, North Europe, Southern Europe, Transatlantic, Other Long-Haul and Charter). Projections are then made for each route/route group with the results added together at the end of the process to get total passenger and movement forecasts.
The daa traffic forecast model assumes that passenger traffic growth can be expressed as a function of economic growth, and that it is the economic growth of the passenger’s country of residence which is relevant. daa uses the historic relationship between GDP and traffic growth to derive future passenger growth rates from the available GDP forecasts.
daa’s forecasting methodology has been extensively reviewed by independent third parties – while the latest of such reviews was conducted in 2005, the methodology has not materially changed since then. In 2005, Mott MacDonald undertook a review of daa’s forecasting methodology for the Commission for Aviation Regulation. The review concluded that the forecast methodology represents the application of “best practice” and that “the process adopted and the depth of thinking behind the development of the forecasts is impressive”.
The forecasts of passenger traffic at Dublin Airport are provided in Figure 8-1. These show the underlying demand for air travel, unconstrained by any possible capacity constraints at the airport. The Centreline forecast is the most likely long term traffic trend, based on anticipated economic and air carrier growth over the next 30 years. In this forecast, passenger traffic is projected to grow from 20.2 million in 2013 to 29 million in 2023, 35 million in 2033 and 41 million in 2043. This is an average growth rate of 2.4% per annum
62 Forecast DAPF14-02 (produced November 2014).
“Beyond the objective of seeking aggregate growth rates, airports are incentivised to seek out high-value traffic, which opens up new destinations and increased connectivity to a region or country. In particular, new long-haul services are particularly valued by airport authorities and the society they serve as they open up new tourism and trade opportunities while increasing aeronautical revenues and airport retail opportunities.”
“The increasing importance of high-growth and high potential markets, such as Brazil, Russia, India and China, Middle East and Far East has been recognised by the Government and articulated in: A strategy and action plan for Irish Trade, Tourism and Investment to 2015. A critical part of realising the opportunities that exist in these markets lies in ensuring good air connectivity to these markets, through both established and newly emerging air links.”
Quotes from “A National Aviation Policy for Ireland – Draft”, May 2014 Department of Transport, Tourism and Sport,
Dublin Airport Economic Impact Study
56

Dublin Airport Economic Impact Study 56
8.1 Forecast Traffic Development at Dublin Airport
The future economic impact estimates are based on air traffic forecasts produced by daa.62 These forecasts are derived from a sophisticated econometric forecast model. All the major air traffic routes are represented separately in the model, with the remaining routes divided into various groups (i.e. Domestic, UK, North Europe, Southern Europe, Transatlantic, Other Long-Haul and Charter). Projections are then made for each route/route group with the results added together at the end of the process to get total passenger and movement forecasts.
The daa traffic forecast model assumes that passenger traffic growth can be expressed as a function of economic growth, and that it is the economic growth of the passenger’s country of residence which is relevant. daa uses the historic relationship between GDP and traffic growth to derive future passenger growth rates from the available GDP forecasts.
daa’s forecasting methodology has been extensively reviewed by independent third parties – while the latest of such reviews was conducted in 2005, the methodology has not materially changed since then. In 2005, Mott MacDonald undertook a review of daa’s forecasting methodology for the Commission for Aviation Regulation. The review concluded that the forecast methodology represents the application of “best practice” and that “the process adopted and the depth of thinking behind the development of the forecasts is impressive”.
The forecasts of passenger traffic at Dublin Airport are provided in Figure 8-1. These show the underlying demand for air travel, unconstrained by any possible capacity constraints at the airport. The Centreline forecast is the most likely long term traffic trend, based on anticipated economic and air carrier growth over the next 30 years. In this forecast, passenger traffic is projected to grow from 20.2 million in 2013 to 29 million in 2023, 35 million in 2033 and 41 million in 2043. This is an average growth rate of 2.4% per annum
62 Forecast DAPF14-02 (produced November 2014).
“Beyond the objective of seeking aggregate growth rates, airports are incentivised to seek out high-value traffic, which opens up new destinations and increased connectivity to a region or country. In particular, new long-haul services are particularly valued by airport authorities and the society they serve as they open up new tourism and trade opportunities while increasing aeronautical revenues and airport retail opportunities.”
“The increasing importance of high-growth and high potential markets, such as Brazil, Russia, India and China, Middle East and Far East has been recognised by the Government and articulated in: A strategy and action plan for Irish Trade, Tourism and Investment to 2015. A critical part of realising the opportunities that exist in these markets lies in ensuring good air connectivity to these markets, through both established and newly emerging air links.”
Quotes from “A National Aviation Policy for Ireland – Draft”, May 2014 Department of Transport, Tourism and Sport,
Dublin Airport Economic Impact Study 57
between 2013 and 2043. Lower growth is forecast for the short-haul market (averaging 2.2% per annum) than for the long-haul market (4.0% per annum), reflecting its greater market maturity and lower economic growth potential.63
In addition to the Centreline forecast, Low and High forecasts have been generated assuming different levels of economic growth and air service development. In the Low forecast, passenger traffic is projected to reach 33 million by 2043, 20% lower than the Centreline forecast. In the High forecast, passenger traffic is forecast to reach 50 million, 20% above the Centreline forecast.
Figure 8-1: Unconstrained Forecasts of Passenger Traffic at Dublin Airport, 2013-2043
Source: daa, forecast DAPF14-02 (produced November 2014).
63 Short haul includes domestic, UK, rest of Europe and North Africa. Long-haul includes the Americas, Middle East, Asia and the rest of Africa.
32
41
50
20.2
29
35
41
26
30
33
5
10
15
20
25
30
35
40
45
50
2013
2014
2015
2016
2017
2018
2019
2020
2021
2022
2023
2024
2025
2026
2027
2028
2029
2030
2031
2032
2033
2034
2035
2036
2037
2038
2039
2040
2041
2042
2043
Ann
ual A
ir P
asse
nger
s (M
illio
ns)
High
Centre Line
Low
Dublin Airport Economic Impact Study
57
Dublin Airport Economic Impact Study 58
8.2 Estimating the Economic Impact of Dublin Airport Under the Unconstrained Forecasts
8.2.1 The Impact of Traffic Growth The future economic impact derived from traffic growth at Dublin Airport was estimated based on the unconstrained forecasts documented in the previous section. To do this, it was assumed that the economic impact (employment, income, GVA) associated with the airport will increase as traffic at the airport increases. However, our experience has been that the aviation sector achieves significant productivity gains and economies of scale, handling increasing numbers of passengers per employee as traffic increases. Therefore, the increases would not be linear, i.e., a 1% increase in traffic would lead to a less than 1% in the economic impact.
To estimate the future economic impact, the following assumptions were made:
To account for future gains in productivity, the direct employment impacts were estimated assuming an economic impact elasticity of 0.67, i.e., each 1% increase in traffic results in a 0.67% increase in airport activity.
The multiplier impacts (indirect and induced) were estimated from the direct impacts, using the 2013 multipliers, described in Appendix E.
The estimates of catalytic impacts were based on forecasts of future connectivity derived from the air traffic forecasts. The forecasts of short-haul and long-haul passengers were applied to the short-haul and long-haul elements of the connectivity index for Dublin Airport. Calculating the short-haul and long-haul elements separately, allows the analysis to fully capture the higher connectivity growth and catalytic potential expected in long-haul markets (relative to short-haul markets).
The connectivity parameter described in Chapter 6 was then applied to projected increase in connectivity to estimate the catalytic impacts. To be conservative, it was assumed that the catalytic impacts would grow at a slower rate than connectivity, such that the connectivity contribution is scaled down by 25% (e.g., a 10% connectivity increase is scaled down to a 7.5% connectivity increase).64
8.2.2 Dublin Airport Central As noted previously, the future economic impact of Dublin Airport also includes the Dublin Airport Central campus.
daa has an extensive land bank of approximately 2,500 acres/1,000 hectares. This land bank provides significant opportunity for the development of both aviation and non-aviation business. daa hopes to use some of this land bank to launch and develop a new cluster of commercial development at Dublin Airport. A master plan was recently completed for the development, which will be delivered over the next 20 years and includes hotels, ancillary
64 Both short haul and long-haul connectivity were scaled by 25%.
Dublin Airport Economic Impact Study
58

Dublin Airport Economic Impact Study 58
8.2 Estimating the Economic Impact of Dublin Airport Under the Unconstrained Forecasts
8.2.1 The Impact of Traffic Growth The future economic impact derived from traffic growth at Dublin Airport was estimated based on the unconstrained forecasts documented in the previous section. To do this, it was assumed that the economic impact (employment, income, GVA) associated with the airport will increase as traffic at the airport increases. However, our experience has been that the aviation sector achieves significant productivity gains and economies of scale, handling increasing numbers of passengers per employee as traffic increases. Therefore, the increases would not be linear, i.e., a 1% increase in traffic would lead to a less than 1% in the economic impact.
To estimate the future economic impact, the following assumptions were made:
To account for future gains in productivity, the direct employment impacts were estimated assuming an economic impact elasticity of 0.67, i.e., each 1% increase in traffic results in a 0.67% increase in airport activity.
The multiplier impacts (indirect and induced) were estimated from the direct impacts, using the 2013 multipliers, described in Appendix E.
The estimates of catalytic impacts were based on forecasts of future connectivity derived from the air traffic forecasts. The forecasts of short-haul and long-haul passengers were applied to the short-haul and long-haul elements of the connectivity index for Dublin Airport. Calculating the short-haul and long-haul elements separately, allows the analysis to fully capture the higher connectivity growth and catalytic potential expected in long-haul markets (relative to short-haul markets).
The connectivity parameter described in Chapter 6 was then applied to projected increase in connectivity to estimate the catalytic impacts. To be conservative, it was assumed that the catalytic impacts would grow at a slower rate than connectivity, such that the connectivity contribution is scaled down by 25% (e.g., a 10% connectivity increase is scaled down to a 7.5% connectivity increase).64
8.2.2 Dublin Airport Central As noted previously, the future economic impact of Dublin Airport also includes the Dublin Airport Central campus.
daa has an extensive land bank of approximately 2,500 acres/1,000 hectares. This land bank provides significant opportunity for the development of both aviation and non-aviation business. daa hopes to use some of this land bank to launch and develop a new cluster of commercial development at Dublin Airport. A master plan was recently completed for the development, which will be delivered over the next 20 years and includes hotels, ancillary
64 Both short haul and long-haul connectivity were scaled by 25%.
Dublin Airport Economic Impact Study 59
retail, offices and car parking. This development is largely additive to the projections of the future economic impact of the airport.
daa commissioned a separate study to estimate the economic impact likely to be generated by the development phase of the project (from capital expenditure) and the day-to-day operation of the campus (from operational expenditure). 65
The study estimated that, including multiplier impacts, the campus could create approximately 13,200 FTE jobs and contribute over €1.8 billion to the Irish economy during the construction phase. The campus is anticipated to be developed in phases, with the first phase of the campus operational by 2023, and additional phases becoming operational beyond that date. The first phase could generate an estimated 20,190 FTE jobs and contribute over €4.8 billion to national output annually. When fully developed, it is estimated that Dublin Airport Central could create as much as 38,934 FTE jobs and contribute over €9.2 billion in national output each year.
The estimates of the economic impact of operation of Dublin Airport Central from the separate study were added to economic impact derived from traffic growth at the airport (the economic impact associated with construction has not been included).66 The economic impact of the campus added to the future economic impact of Dublin Airport reflects the project phasing, so that the incremental economic impact is smaller in earlier years.67 Furthermore, to be conservative, the economic impact of the campus was scaled down by 30% to allow for the possibility that the campus may capture some of the employment already included in the future catalytic impact of Dublin Airport. As a result, 14,133 jobs associated with Dublin Airport Central were added to the total employment impacts in 2023 (70% x 20,190 = 14,133), and 27,253 jobs (70% x 38,934) were added to the total employment impacts in 2033 and 2043.
8.2.3 Results The resulting forecasts of the economic impact of Dublin Airport, assuming no capacity constraints at the airport and including the Dublin Airport Central campus, are provided in Figures 8-2 to 8-5. Figure 8-2 summarises the employment impacts, while the tables provide separate results for the Centreline, High and Low forecasts.68
65 PWC, “Project Skyline, Dublin Airport – Economic Impact Analysis”, September 2014. 66 Specifically, the direct, indirect and induced impacts of the day-to-day operation of the campus were added to the direct, indirect and induced impacts of the airport. 67 The PWC report provides national output figures. This is the not the same as the GVA figures used in this report. Roughly speaking, national output = GVA plus intermediate consumption. Additional analysis was carried out to calculate the GVA impacts based on ratios in the input-output tables that were used to estimate the multiplier (indirect and induced) impacts. In addition, the PWC report also did not provide income/wages information. This again was calculated based on ratios in the input-output tables. 68 The economic impact of the Dublin Airport Central campus is the same in each forecast.
Dublin Airport Economic Impact Study
59

Dublin Airport Economic Impact Study 60
Under the Centreline forecast, assuming airport capacity can fully accommodate demand and including the Dublin Airport Central campus, the total economic impact of Dublin Airport is estimated to reach 194,000 jobs and €14.4 billion in GVA by 2043. This is roughly double the current economic impact of the airport.
Unsurprisingly, the future economic impact of Dublin Airport is projected to be lower under Low air traffic forecast, reaching 173,200 jobs and €13.4 billion in GVA by 2043, 11% below the economic impact under the Centreline forecast. Conversely, the High forecast results in 213,500 jobs and €16.3 Billion in GVA by 2043, 10% higher than under the Centreline forecast.
Figure 8-2: Forecast Economic Impact (Employment) of Dublin Airport
133,100
160,100
173,200
151,500
189,400
213,500
97,400
142,800
175,400
194,000
0
50,000
100,000
150,000
200,000
250,000
2013 2023 2033 2043
Tota
l Em
ploy
men
t
High
Centreline
Low
Dublin Airport Economic Impact Study
60

Dublin Airport Economic Impact Study 60
Under the Centreline forecast, assuming airport capacity can fully accommodate demand and including the Dublin Airport Central campus, the total economic impact of Dublin Airport is estimated to reach 194,000 jobs and €14.4 billion in GVA by 2043. This is roughly double the current economic impact of the airport.
Unsurprisingly, the future economic impact of Dublin Airport is projected to be lower under Low air traffic forecast, reaching 173,200 jobs and €13.4 billion in GVA by 2043, 11% below the economic impact under the Centreline forecast. Conversely, the High forecast results in 213,500 jobs and €16.3 Billion in GVA by 2043, 10% higher than under the Centreline forecast.
Figure 8-2: Forecast Economic Impact (Employment) of Dublin Airport
133,100
160,100
173,200
151,500
189,400
213,500
97,400
142,800
175,400
194,000
0
50,000
100,000
150,000
200,000
250,000
2013 2023 2033 2043
Tota
l Em
ploy
men
t
High
Centreline
Low
Dublin Airport Economic Impact Study 61
Figure 8-3: Forecast Economic Impact of Dublin Airport (Unconstrained CENTRELINE Forecast)
Impact Type Jobs FTEs Income (€ Million)
GVA (€ Million)
Current 2013 Impact
Direct 15,700 14,000 639 1,256
Indirect 9,600 8,500 373 717
Induced 12,000 10,600 397 781
Catalytic 60,100 53,100 2,109 4,155
Total 97,400 86,200 3,518 6,909
2023 Impact
Direct 27,700 25,500 1,116 2,300
Indirect 16,000 14,600 625 1,261
Induced 17,900 16,100 608 1,258
Catalytic 81,200 71,700 2,849 5,614
Total 142,800 127,900 5,199 10,433
2033 Impact
Direct 37,800 35,300 1,516 3,192
Indirect 21,600 20,000 841 1,735
Induced 22,600 20,500 780 1,655
Catalytic 93,400 82,500 3,277 6,457
Total 175,400 158,300 6,414 13,040
2043 Impact
Direct 40,800 38,000 1,638 3,431
Indirect 23,400 21,600 911 1,870
Induced 24,900 22,600 856 1,805
Catalytic 104,900 92,700 3,680 7,252
Total 194,000 174,900 7,086 14,359
All financial figures are in 2013 prices. Numbers may not add up due to rounding.
Dublin Airport Economic Impact Study
61

Dublin Airport Economic Impact Study 62
Figure 8-4: Forecast Economic Impact of Dublin Airport (Unconstrained LOW Forecast)
Impact Type Jobs FTEs Income (€ Million)
GVA (€ Million)
Current 2013 Impact
Direct 15,700 14,000 639 1,256
Indirect 9,600 8,500 373 717
Induced 12,000 10,600 397 781
Catalytic 60,100 53,100 2,109 4,155
Total 97,400 86,200 3,518 6,909
2023 Impact
Direct 26,200 24,200 1,055 2,180
Indirect 15,100 13,800 590 1,194
Induced 16,700 15,100 569 1,180
Catalytic 75,100 66,400 2,635 5,192
Total 133,100 119,500 4,849 9,746
2033 Impact
Direct 35,300 33,100 1,032 2,150
Indirect 20,000 18,600 486 934
Induced 20,700 18,900 1,591 3,566
Catalytic 84,100 74,300 2,951 5,814
Total 160,100 144,900 6,059 12,464
2043 Impact
Direct 37,300 34,900 1,113 2,310
Indirect 21,300 19,700 537 1,031
Induced 22,200 20,200 1,640 3,664
Catalytic 92,400 81,600 3,242 6,388
Total 173,200 156,400 6,532 13,393
All financial figures are in 2013 prices. Numbers may not add up due to rounding.
Dublin Airport Economic Impact Study
62

Dublin Airport Economic Impact Study 62
Figure 8-4: Forecast Economic Impact of Dublin Airport (Unconstrained LOW Forecast)
Impact Type Jobs FTEs Income (€ Million)
GVA (€ Million)
Current 2013 Impact
Direct 15,700 14,000 639 1,256
Indirect 9,600 8,500 373 717
Induced 12,000 10,600 397 781
Catalytic 60,100 53,100 2,109 4,155
Total 97,400 86,200 3,518 6,909
2023 Impact
Direct 26,200 24,200 1,055 2,180
Indirect 15,100 13,800 590 1,194
Induced 16,700 15,100 569 1,180
Catalytic 75,100 66,400 2,635 5,192
Total 133,100 119,500 4,849 9,746
2033 Impact
Direct 35,300 33,100 1,032 2,150
Indirect 20,000 18,600 486 934
Induced 20,700 18,900 1,591 3,566
Catalytic 84,100 74,300 2,951 5,814
Total 160,100 144,900 6,059 12,464
2043 Impact
Direct 37,300 34,900 1,113 2,310
Indirect 21,300 19,700 537 1,031
Induced 22,200 20,200 1,640 3,664
Catalytic 92,400 81,600 3,242 6,388
Total 173,200 156,400 6,532 13,393
All financial figures are in 2013 prices. Numbers may not add up due to rounding.
Dublin Airport Economic Impact Study 63
Figure 8-5: Forecast Economic Impact of Dublin Airport (Unconstrained HIGH Forecast)
Impact Type Jobs FTEs Income (€ Million)
GVA (€ Million)
Current 2013 Impact
Direct 15,700 14,000 639 1,256
Indirect 9,600 8,500 373 717
Induced 12,000 10,600 397 781
Catalytic 60,100 53,100 2,109 4,155
Total 97,400 86,200 3,518 6,909
2023 Impact
Direct 29,100 26,800 1,173 2,412
Indirect 16,900 15,400 660 1,328
Induced 19,000 17,100 645 1,330
Catalytic 86,500 76,400 3,035 5,980
Total 151,500 135,700 5,513 11,050
2033 Impact
Direct 40,200 37,400 1,231 2,542
Indirect 23,000 21,200 603 1,158
Induced 24,400 22,100 1,713 3,807
Catalytic 101,800 89,900 3,572 7,038
Total 189,400 170,600 7,118 14,545
2043 Impact
Direct 44,200 41,000 1,394 2,862
Indirect 25,500 23,400 700 1,344
Induced 27,500 24,900 1,816 4,008
Catalytic 116,300 102,800 4,080 8,041
Total 213,500 192,100 7,990 16,256
All financial figures are in 2013 prices. Numbers may not add up due to rounding.
Dublin Airport Economic Impact Study
63
Dublin Airport Economic Impact Study 64
8.3 The Traffic and Connectivity Benefits of Building a Second Runway
69
The previous forecasts assume that there are no capacity constraints on Dublin Airport. In practice, that would mean that a second runway would need to be built at the airport to fully accommodate underlying demand. Currently, the airport is close to runway capacity at peak hour times. As traffic grows at Dublin Airport, the pressure on peak capacity is likely to increase, which will impact the ability of airlines to serve both short-haul and long-haul demand, and the ability to effectively serve transfer traffic which could be critical to support long-haul services. Without a second runway, traffic will be lost as airlines have to compromise on the services offered and transfer traffic shifts to unconstrained airports.
The strategic value of a parallel runway will not only be the additional capacity, but also the ability to open up new markets for trade and commerce, and to provide full resilience for the existing main runway. In order to facilitate such new routes and markets, it will be critical to provide a runway which delivers full flexibility for airlines, without weight restriction.
Figure 8-6 shows the top 20 cities ranked in order of their expected contribution to global GDP in 2025. In line with the Draft National Aviation Policy, it is the intention to link Dublin Airport with such key locations in a manner that they may be reached without penalty to the airline operating a range of aircraft. This will enable connections for both business exports and international tourists and enhance the potential to develop Dublin Airport as a strong secondary European hub.
69 http://www.irishexporters.ie/wp-content/uploads/2014/05/Air_freight__New_policy___IEA_Submission.pdf.
“Global trade growth has shifted extensively to Asia and Africa, where 80% of trade growth is forecast to come from according to the WTO. Hence, Irish exporters reliance on efficient effective airfreight routes and providers, is increasing daily. In addition, the continuation of trade growth with the US, particularly in the high value added life sciences sector where Ireland / US, is extensively reliant on airfreight services.”
Irish Exporters Association, April 2013 69
Dublin Airport Economic Impact Study
64

Dublin Airport Economic Impact Study 64
8.3 The Traffic and Connectivity Benefits of Building a Second Runway
69
The previous forecasts assume that there are no capacity constraints on Dublin Airport. In practice, that would mean that a second runway would need to be built at the airport to fully accommodate underlying demand. Currently, the airport is close to runway capacity at peak hour times. As traffic grows at Dublin Airport, the pressure on peak capacity is likely to increase, which will impact the ability of airlines to serve both short-haul and long-haul demand, and the ability to effectively serve transfer traffic which could be critical to support long-haul services. Without a second runway, traffic will be lost as airlines have to compromise on the services offered and transfer traffic shifts to unconstrained airports.
The strategic value of a parallel runway will not only be the additional capacity, but also the ability to open up new markets for trade and commerce, and to provide full resilience for the existing main runway. In order to facilitate such new routes and markets, it will be critical to provide a runway which delivers full flexibility for airlines, without weight restriction.
Figure 8-6 shows the top 20 cities ranked in order of their expected contribution to global GDP in 2025. In line with the Draft National Aviation Policy, it is the intention to link Dublin Airport with such key locations in a manner that they may be reached without penalty to the airline operating a range of aircraft. This will enable connections for both business exports and international tourists and enhance the potential to develop Dublin Airport as a strong secondary European hub.
69 http://www.irishexporters.ie/wp-content/uploads/2014/05/Air_freight__New_policy___IEA_Submission.pdf.
“Global trade growth has shifted extensively to Asia and Africa, where 80% of trade growth is forecast to come from according to the WTO. Hence, Irish exporters reliance on efficient effective airfreight routes and providers, is increasing daily. In addition, the continuation of trade growth with the US, particularly in the high value added life sciences sector where Ireland / US, is extensively reliant on airfreight services.”
Irish Exporters Association, April 2013 69
Dublin Airport Economic Impact Study 65
Figure 8-6: Top 20 Cities Based on Projected contribution to Global GDP in 2025
Rank City Current Direct Service from Dublin
1 New York 2 Tokyo 3 Shanghai 4 London 5 Beijing 6 Los Angeles (Starting 2015) 7 Paris 8 Chicago 9 Rhein-Ruhr (Dusseldorf)
10 Shenzhen 11 Tianjin 12 Dallas 13 Washington DC 14 Houston 15 Sao Paulo 16 Moscow 17 Chongqing 18 Randstad (Amsterdam) 19 Guangzhou 20 Mexico City
9/20 Currently Connected
Source: daa.
Dublin Airport Economic Impact Study
65

Dublin Airport Economic Impact Study 66
A second runway at Dublin Airport has the potential to provide connectivity to a range of crucial long-haul destinations, particularly in fast growing economies in Asia, Africa and South America.
Figure 8-7 summarises analysis by daa illustrating the type of routes that could develop at Dublin Airport with an additional runway of sufficient length to fully enable long-haul air service, based on expected demand growth. The longer length of the second runway allows more economical longer haul aircraft to operate at Dublin Airport than would otherwise be the case. Current and anticipated models of long-haul aircraft will require a longer runway to reach this range of destinations without onerous penalties on the amount of passengers and cargo that can be uplifted from Dublin.
Figure 8-7: Illustrative Routes Possible at Dublin Airport with a Second Runway
Region Medium to Long Term Opportunities
North America Vancouver Phoenix Honolulu
China Beijing Shanghai
Guangzhou
Africa Cape Town
South East Asia Tokyo Hong Kong Singapore Denpasar Bangkok
South America Sao Paulo
Dublin Airport Economic Impact Study
66

Dublin Airport Economic Impact Study 66
A second runway at Dublin Airport has the potential to provide connectivity to a range of crucial long-haul destinations, particularly in fast growing economies in Asia, Africa and South America.
Figure 8-7 summarises analysis by daa illustrating the type of routes that could develop at Dublin Airport with an additional runway of sufficient length to fully enable long-haul air service, based on expected demand growth. The longer length of the second runway allows more economical longer haul aircraft to operate at Dublin Airport than would otherwise be the case. Current and anticipated models of long-haul aircraft will require a longer runway to reach this range of destinations without onerous penalties on the amount of passengers and cargo that can be uplifted from Dublin.
Figure 8-7: Illustrative Routes Possible at Dublin Airport with a Second Runway
Region Medium to Long Term Opportunities
North America Vancouver Phoenix Honolulu
China Beijing Shanghai
Guangzhou
Africa Cape Town
South East Asia Tokyo Hong Kong Singapore Denpasar Bangkok
South America Sao Paulo
Dublin Airport Economic Impact Study 67
The potential traffic gain associated with second runway is shown in Figure 8-8, which shows the unconstrained Centreline forecast and a constrained forecast assuming that Dublin Airport is limited to its existing single runway. The capacity constraint begins to hit as early as 2017 due to capacity constraints at peak times, and results in an ever increasing volume of traffic being unserved.
In about 20 years’ time (2033), it is projected that the second runway will allow an additional 6.4 million passengers to be accommodated (compared with a single runway airport), about 18% of unconstrained demand in that year. By 2043, it is forecast that the second runway will allow Dublin Airport to accommodate over 10 million annual passengers, about 25% of total unconstrained demand.
Figure 8-8: Forecast Passenger Traffic at Dublin Airport with a Second Runway, 2013-2043
Source: daa, forecast DAPF14-02 (produced November 2014).
While the increase in passenger traffic associated with a second runway is substantial, the impact on connectivity is likely to be even greater. Applying the passenger traffic forecasts to the IATA connectivity index (described in Chapter 3), suggests that a second runway will result in a 22% gain in connectivity by 2034 (as measured by the index) and a gain of 31% by 2034,relative to the unconstrained Centreline forecast. This is larger than the gain in passenger traffic (18% and 25% respectively) due to the increase in connectivity to large long-haul destinations in Asia, the Americas and Africa.
20.2
29
35
41
27
2931
5
10
15
20
25
30
35
40
45
2013
2014
2015
2016
2017
2018
2019
2020
2021
2022
2023
2024
2025
2026
2027
2028
2029
2030
2031
2032
2033
2034
2035
2036
2037
2038
2039
2040
2041
2042
2043
Annu
al A
ir Pa
ssen
gers
(Mill
ions
)
Second Runway - Unconstrained Centre Line
Single Runway - Constrained Forecast
Traffic accomodated by a second runway
Dublin Airport Economic Impact Study
67

Dublin Airport Economic Impact Study 68
8.4 The Economic Impact of a Second Runway The future economic impact of a second runway at Dublin Airport was estimated using the same methodology described in Section 8.2, applied to the two-runway (unconstrained Centre Line) and single runway (constrained) forecasts.70 The economic impact under the single runway forecasts was then subtracted from the economic impact of the unconstrained economic impact to estimate the incremental economic impact of a second runway. These results are provided in Figures 8-9 and 8-10.
The analysis suggests that with the second runway at Dublin Airport, the Irish economy could gain an additional 31,200 jobs and €2.2 billion in GDP by 2043, relative to a single runway airport. This amount is roughly a third of the current economic impact of the airport. The majority of this economic contribution is expected to occur outside of the aviation sector – 60% of the total impact is catalytic impacts (tourism, trade, investment, etc.) and another 23% are indirect and induced impacts (supplier and spending in the wider economy).
Figure 8-9: Estimated Employment Impact Provided by a Second Runway
70 As this analysis focusses solely on the incremental economic impact associated with a second runway, it does not include the estimated economic impact generated by the proposed Dublin Airport Central campus.
7,000
19,100
31,200
0
5,000
10,000
15,000
20,000
25,000
30,000
35,000
2023 2033 2043
Incr
emen
tal T
otal
Job
s
Dublin Airport Economic Impact Study
68

Dublin Airport Economic Impact Study 68
8.4 The Economic Impact of a Second Runway The future economic impact of a second runway at Dublin Airport was estimated using the same methodology described in Section 8.2, applied to the two-runway (unconstrained Centre Line) and single runway (constrained) forecasts.70 The economic impact under the single runway forecasts was then subtracted from the economic impact of the unconstrained economic impact to estimate the incremental economic impact of a second runway. These results are provided in Figures 8-9 and 8-10.
The analysis suggests that with the second runway at Dublin Airport, the Irish economy could gain an additional 31,200 jobs and €2.2 billion in GDP by 2043, relative to a single runway airport. This amount is roughly a third of the current economic impact of the airport. The majority of this economic contribution is expected to occur outside of the aviation sector – 60% of the total impact is catalytic impacts (tourism, trade, investment, etc.) and another 23% are indirect and induced impacts (supplier and spending in the wider economy).
Figure 8-9: Estimated Employment Impact Provided by a Second Runway
70 As this analysis focusses solely on the incremental economic impact associated with a second runway, it does not include the estimated economic impact generated by the proposed Dublin Airport Central campus.
7,000
19,100
31,200
0
5,000
10,000
15,000
20,000
25,000
30,000
35,000
2023 2033 2043
Incr
emen
tal T
otal
Job
s
Dublin Airport Economic Impact Study 69
Figure 8-10: Estimated Economic Impact Provided by a Second Runway
Impact Type Jobs FTEs Income (€ Million)
GVA (€ Million)
2023 Impact
Direct 1,200 1,000 49 96
Indirect 700 600 27 52
Induced 900 800 30 59
Catalytic 4,200 3,700 147 290
Total 7,000 6,100 253 497
2033 Impact
Direct 3,200 2,800 130 256
Indirect 2,000 1,800 78 149
Induced 2,500 2,200 83 163
Catalytic 11,400 10,100 400 788
Total 19,100 16,900 691 1,356
2043 Impact
Direct 5,200 4,700 212 416
Indirect 3,200 2,900 124 239
Induced 4,000 3,600 132 260
Catalytic 18,800 16,600 660 1,300
Total 31,200 27,800 1,128 2,215
All financial figures are in 2013 prices. Numbers may not add up due to rounding.
Dublin Airport Economic Impact Study
69

Dublin Airport Economic Impact Study 70
Appendix A: Employment Survey Sample A total of 157 businesses were surveyed about their employment and other aspects of the businesses, of which 104 provided information, a response rate of 66%. The categories of businesses surveyed were:
Airlines All of the airlines operating at the airport, based on contact information provided by daa, were sent a survey form. This included both passenger and cargo airlines and both home and foreign carriers.
Airport Tenants All tenants on airport property were sent a survey form, using contact information provided by daa. This included government agencies, security providers, retail and food and beverage outlets, car rental firms, ground handlers, aircraft maintenance and repair, and others.
Offsite Businesses Using directory and internet searches, businesses in and around Dublin were identified in the aviation and aerospace industries with possible linkages to Dublin Airport. The businesses included integrators/couriers not based at the airport, aircraft maintenance and repair, aircraft parts suppliers and manufacturers. To ensure only employment directly linked to the airport was captured, the businesses were asked to state what percentage of their business directly related to the airport. The total employment of the business was then scaled by this percentage.
Hotels A number of other hotels located near to the airport, or known to be used by airlines, were also surveyed. These hotels were asked about the proportion of their business that was related to accommodating transiting passengers or airline crews. Only this proportion of the employment was counted as part of the direct economic impact of the airport to avoid double-counting with catalytic (tourism) impacts.
Ground Transportation Bus and coach companies that partially or wholly serve airport passengers. To ensure only employment directly linked to the airport was captured, the businesses were asked to state what percentage of their business directly related to the airport traffic. The total employment of the business was then scaled by this percentage.
Dublin Airport Economic Impact Study
70

Dublin Airport Economic Impact Study 70
Appendix A: Employment Survey Sample A total of 157 businesses were surveyed about their employment and other aspects of the businesses, of which 104 provided information, a response rate of 66%. The categories of businesses surveyed were:
Airlines All of the airlines operating at the airport, based on contact information provided by daa, were sent a survey form. This included both passenger and cargo airlines and both home and foreign carriers.
Airport Tenants All tenants on airport property were sent a survey form, using contact information provided by daa. This included government agencies, security providers, retail and food and beverage outlets, car rental firms, ground handlers, aircraft maintenance and repair, and others.
Offsite Businesses Using directory and internet searches, businesses in and around Dublin were identified in the aviation and aerospace industries with possible linkages to Dublin Airport. The businesses included integrators/couriers not based at the airport, aircraft maintenance and repair, aircraft parts suppliers and manufacturers. To ensure only employment directly linked to the airport was captured, the businesses were asked to state what percentage of their business directly related to the airport. The total employment of the business was then scaled by this percentage.
Hotels A number of other hotels located near to the airport, or known to be used by airlines, were also surveyed. These hotels were asked about the proportion of their business that was related to accommodating transiting passengers or airline crews. Only this proportion of the employment was counted as part of the direct economic impact of the airport to avoid double-counting with catalytic (tourism) impacts.
Ground Transportation Bus and coach companies that partially or wholly serve airport passengers. To ensure only employment directly linked to the airport was captured, the businesses were asked to state what percentage of their business directly related to the airport traffic. The total employment of the business was then scaled by this percentage.
Dublin Airport Economic Impact Study 71
Appendix B: Sample Survey Form
Dublin Airport Economic Impact Study
71

Dublin Airport Economic Impact Study 72
Dublin Airport Economic Impact Study
72

Dublin Airport Economic Impact Study 72
Dublin Airport Economic Impact Study 73
Dublin Airport Economic Impact Study
73

Dublin Airport Economic Impact Study 74
Dublin Airport Economic Impact Study
74

Dublin Airport Economic Impact Study 74
Dublin Airport Economic Impact Study 75
Dublin Airport Economic Impact Study
75
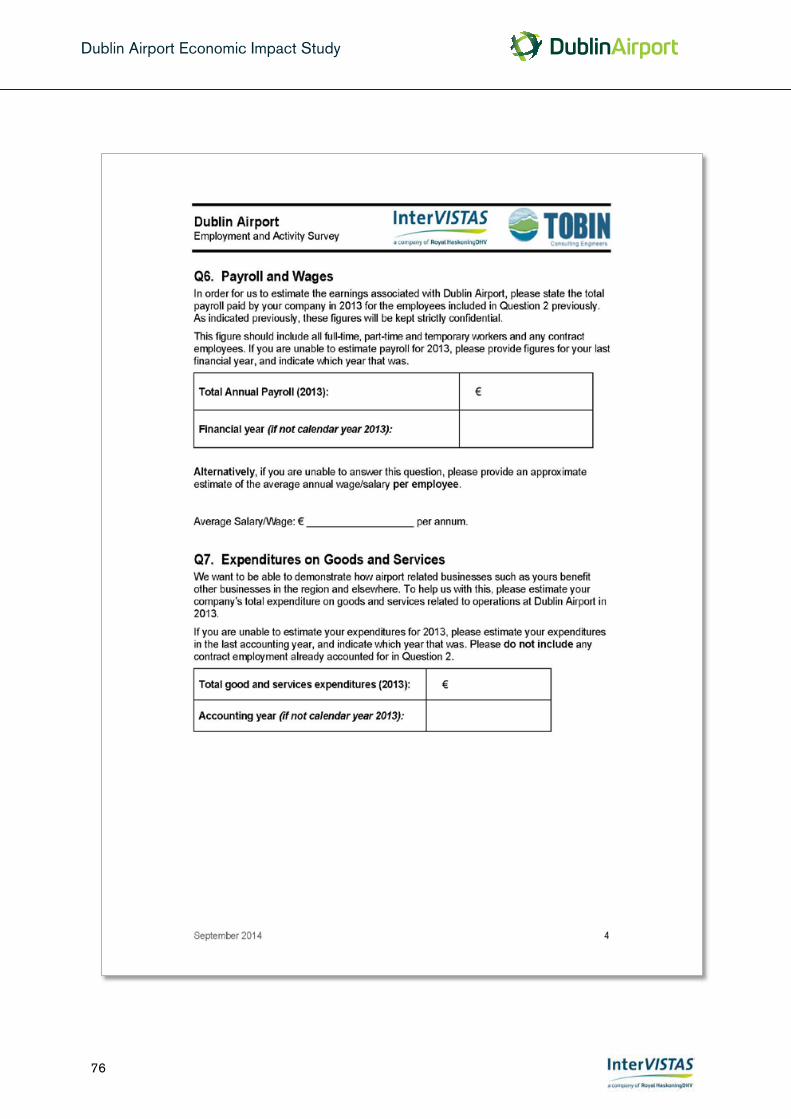
Dublin Airport Economic Impact Study 76
Dublin Airport Economic Impact Study
76

Dublin Airport Economic Impact Study 76
Dublin Airport Economic Impact Study 77
Dublin Airport Economic Impact Study
77

Dublin Airport Economic Impact Study 78
Dublin Airport Economic Impact Study
78

Dublin Airport Economic Impact Study 78
Dublin Airport Economic Impact Study 79
Appendix C: Calculating Inferred Employment InterVISTAS’ approach was to utilise information from responding firms for each type of business, along with publicly available information on individual non-responding firms, to make inferences. This approach is generally deemed to be the best approach, and indeed is often used for developing the national income and products account (i.e. partial survey with inference for non-surveyed or non-responding firms based on responses of surveys received).
The employment data in this report was constructed from a combination of two sources:
1. Employment reported by employers on surveys.
2. Employment inferred for employers who did not provide a survey response. Inferred employment was based on employment information from firms in each business type that did respond to the survey. The mean employment of respondents in each business type was calculated, excluding outliers. For example, especially large firms were excluded from the analysis, and any firms with employment more than two standard deviations from the raw mean. This "adjusted mean" employment for each business type was then applied to the non-respondent firms.
For example: if 15 retail businesses were sent surveys but only 10 returned them, and other information on the non-responding firms was not available, an average employment figure was derived from the responding firms, excluding outliers, and applied to the non-responding firms.
Dublin Airport Economic Impact Study
79

Dublin Airport Economic Impact Study 80
Appendix D: Calculation of Full-Time Equivalent Jobs The average number of employment hours comprising a Full-Time Equivalent (FTE) job is as follows:
Number of Days per Year 365
Minus
Weekends (52 x 2) 104
Number of Public/Bank Holidays 9
Average Number of Vacation Entitlements71 20
Average Sick Days Taken72 5.5
Total Working Days: 225
Average Number of Hours Worked Per Day: 8
Multiply by number of working days (8 x 225)
1,812 Hours
A Full-Time Equivalent job is equivalent of 1,812 hours of labour per annum.
71 Source: http://www.citizensinformation.ie/en/employment/employment_rights_and_conditions/leave_and_holidays/. 72 Source: http://www.ibec.ie/IBEC/Press/PressPublicationsdoclib3.nsf/vPages/Newsroom~new-ibec-survey-shows-absenteeism-fell-during-crisis-20-11-2014?OpenDocument?OpenDocument#.VHNgarkfyM8.
Dublin Airport Economic Impact Study
80
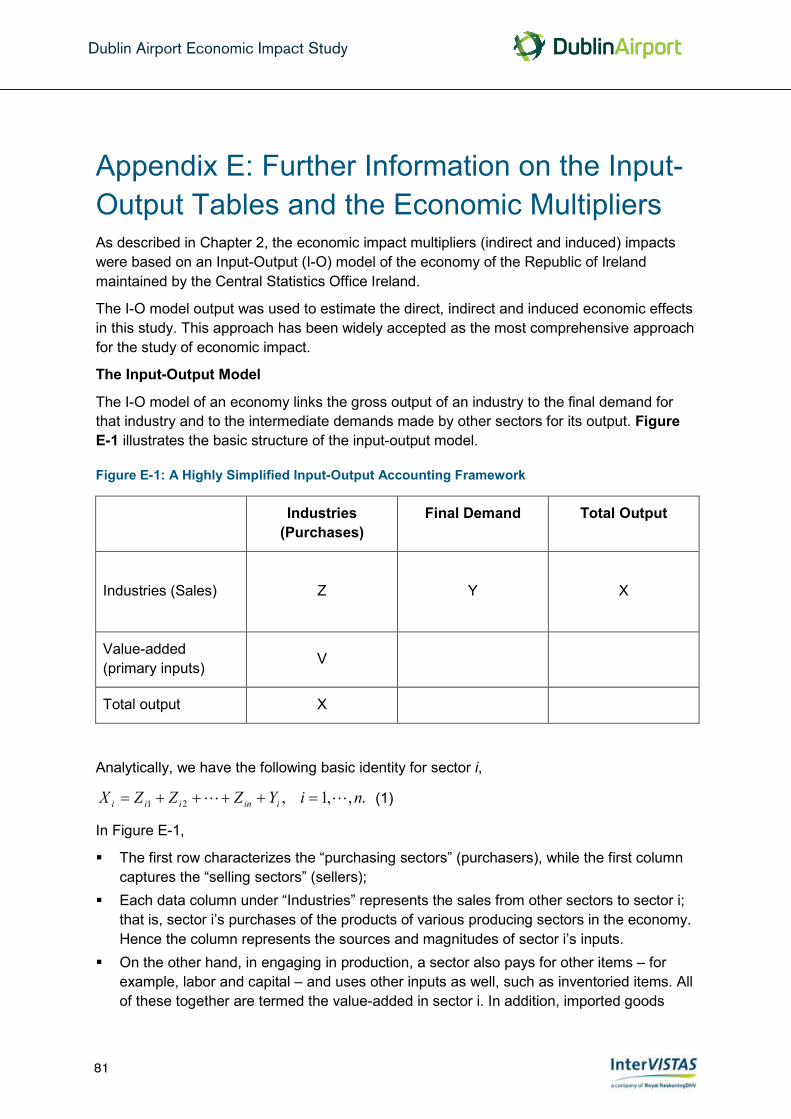
Dublin Airport Economic Impact Study 80
Appendix D: Calculation of Full-Time Equivalent Jobs The average number of employment hours comprising a Full-Time Equivalent (FTE) job is as follows:
Number of Days per Year 365
Minus
Weekends (52 x 2) 104
Number of Public/Bank Holidays 9
Average Number of Vacation Entitlements71 20
Average Sick Days Taken72 5.5
Total Working Days: 225
Average Number of Hours Worked Per Day: 8
Multiply by number of working days (8 x 225)
1,812 Hours
A Full-Time Equivalent job is equivalent of 1,812 hours of labour per annum.
71 Source: http://www.citizensinformation.ie/en/employment/employment_rights_and_conditions/leave_and_holidays/. 72 Source: http://www.ibec.ie/IBEC/Press/PressPublicationsdoclib3.nsf/vPages/Newsroom~new-ibec-survey-shows-absenteeism-fell-during-crisis-20-11-2014?OpenDocument?OpenDocument#.VHNgarkfyM8.
Dublin Airport Economic Impact Study 81
Appendix E: Further Information on the Input-Output Tables and the Economic Multipliers As described in Chapter 2, the economic impact multipliers (indirect and induced) impacts were based on an Input-Output (I-O) model of the economy of the Republic of Ireland maintained by the Central Statistics Office Ireland.
The I-O model output was used to estimate the direct, indirect and induced economic effects in this study. This approach has been widely accepted as the most comprehensive approach for the study of economic impact.
The Input-Output Model
The I-O model of an economy links the gross output of an industry to the final demand for that industry and to the intermediate demands made by other sectors for its output. Figure E-1 illustrates the basic structure of the input-output model.
Figure E-1: A Highly Simplified Input-Output Accounting Framework
Industries (Purchases)
Final Demand Total Output
Industries (Sales) Z Y X
Value-added (primary inputs) V
Total output X
Analytically, we have the following basic identity for sector i,
.,,1,21 ni YZZZX iiniii =++++= (1)
In Figure E-1,
The first row characterizes the “purchasing sectors” (purchasers), while the first column captures the “selling sectors” (sellers);
Each data column under “Industries” represents the sales from other sectors to sector i; that is, sector i’s purchases of the products of various producing sectors in the economy. Hence the column represents the sources and magnitudes of sector i’s inputs.
On the other hand, in engaging in production, a sector also pays for other items – for example, labor and capital – and uses other inputs as well, such as inventoried items. All of these together are termed the value-added in sector i. In addition, imported goods
Dublin Airport Economic Impact Study
81

Dublin Airport Economic Impact Study 82
may be purchased as inputs by sector i All of these inputs (value added and imports) are lumped together as purchases from what is called the payments sector (Vi in Figure D-1).
In the case of Ireland, the net final demand (Y) is the sum of the following items:
Final consumption of households; Government consumption expenditure; Gross capital formation; Change in inventory; and Exports.
For Ireland, the total value-added (V) is the sum of the following items:
Imports of goods and services; Operating surplus; Compensation of employees; Consumption of fixed capital; Product and other indirect taxes less subsidies.
In other words, referring back to Figure D-1, each row for sector i=1 to n records the sales of that sector’s output to other industrial sectors in the economy plus sales to private consumers, government, capital formation, inventory and overseas purchasers. Each column for sector i=1 to n records the purchases of production inputs for that sector in order to produce its total output. This includes purchases from other sectors of the economy, purchases of imports, payment for labour, payment of government taxes, and generation of profits.
Input-Output Coefficients
Input-output table becomes an economic tool when Leontief introduced an assumption of fixed-coefficient linear production functions related to input used by a sector along each column to its output flow, i.e., for one unit of every industry’s output, a fixed amount of input of each kind is required.73 That is, we define the following coefficients:
.j
ijij X
Za =
This ratio is termed a technical coefficient, commonly known as input-output coefficient or direct input coefficient. With this specification of production technology, the model basically assumes that the industry shows constant returns to scale, which is a reasonable approximation in short-run, but nevertheless is also a limitation of the model.
Once the notion of a set of fixed input-output coefficients is accepted, the system of equations (1) can be represented as follows:
73 See Leontief, Wassily W. Input-Output Economics. 2nd ed., New York: Oxford University Press, 1986.
Dublin Airport Economic Impact Study
82

Dublin Airport Economic Impact Study 82
may be purchased as inputs by sector i All of these inputs (value added and imports) are lumped together as purchases from what is called the payments sector (Vi in Figure D-1).
In the case of Ireland, the net final demand (Y) is the sum of the following items:
Final consumption of households; Government consumption expenditure; Gross capital formation; Change in inventory; and Exports.
For Ireland, the total value-added (V) is the sum of the following items:
Imports of goods and services; Operating surplus; Compensation of employees; Consumption of fixed capital; Product and other indirect taxes less subsidies.
In other words, referring back to Figure D-1, each row for sector i=1 to n records the sales of that sector’s output to other industrial sectors in the economy plus sales to private consumers, government, capital formation, inventory and overseas purchasers. Each column for sector i=1 to n records the purchases of production inputs for that sector in order to produce its total output. This includes purchases from other sectors of the economy, purchases of imports, payment for labour, payment of government taxes, and generation of profits.
Input-Output Coefficients
Input-output table becomes an economic tool when Leontief introduced an assumption of fixed-coefficient linear production functions related to input used by a sector along each column to its output flow, i.e., for one unit of every industry’s output, a fixed amount of input of each kind is required.73 That is, we define the following coefficients:
.j
ijij X
Za =
This ratio is termed a technical coefficient, commonly known as input-output coefficient or direct input coefficient. With this specification of production technology, the model basically assumes that the industry shows constant returns to scale, which is a reasonable approximation in short-run, but nevertheless is also a limitation of the model.
Once the notion of a set of fixed input-output coefficients is accepted, the system of equations (1) can be represented as follows:
73 See Leontief, Wassily W. Input-Output Economics. 2nd ed., New York: Oxford University Press, 1986.
Dublin Airport Economic Impact Study 83
.,,1,2211 ni YXaXaXaX ininiii =++++= (2)
This leads to the matrix representation:
X = A X + Y (3)
Hence, with the net final demand vector Y, we can solve for the output vector, via matrix inverse as follows:
X = (I – A)-1 Y (4)
where I stands for the identity matrix. And the matrix (I – A)-1 is the Leontief inverse coefficients. These measure the total amount of output in each sector that is required to be produced in order to satisfy the direct and indirect demands produced by one unit increase in the final demand for a given sector (i.e., the direct + indirect multiplier). The economic interpretation of the Leontief inverse coefficients is consistent with the derivation of the Keynesian multipliers (e.g., expenditure multiplier) that are commonly used in macroeconomics. In other words, it can be interpreted as a result of successive rounds of iterations. An important implication of this connection with the Keynesian multiplier is that the inverse coefficients capture both direct and indirect effects of the final demand from all sectors identified in the I-O table. In practice the multipliers from I-O tables are usually expressed in values so that coefficients measure the requirements in dollars on sector i when sector j increases its final demand by one dollar.
Indirect and Induced Impacts - Open System and Closed System
The economic impact multipliers are expressed as ratios that measure the impact on the total economy as a result of an initial autonomous change in any of the final demand components. The action of the multiplier can be illustrated by the sequence of events that follow after the initial autonomous change. Different kinds of multiplier can be generated depending on the purpose of analysis. The common multipliers used are output, valued-added, employment, and income multipliers. For comparative purposes, multipliers use usually expressed with respect to a unit of autonomous change in final demand.
Open Model: Direct and Indirect Impacts
Each of the multipliers listed above can be generated from two different models: open and closed. The intrinsic difference between them is the treatment of household income and personal consumption expenditure. In the open model, all final demand components are assumed to be exogenous. Hence the open model captures the production-induced effects resulting from a change in final demand. The multipliers generated using the open model are also known as simple multipliers or Leontief multipliers. This kind of model is described as open because at each round of the multiplier process, there is leakage from the system. The leakage consists of payments for imports and primary inputs and the recipients are assumed to make no use of their receipts. Even if a small part of the receipts were spent on goods and services, there would be further multiplier repercussions. In our analysis, Leontief multipliers capture the direct and indirect effects of an autonomous change in final demand.
Dublin Airport Economic Impact Study
83

Dublin Airport Economic Impact Study 84
Closed Model: Direct, Indirect and Induced Impacts
Conversely, in the closed model, the household sector is treated as endogenous to the system. The household sector receiving income from the work done in the production process would spend some of this income on local products. This increase in consumption would in turn increase the level of output of the products. In other words, the closed model accounts for both the production-induced effects as well as the consumption-induced effects. The multipliers generated using the closed model are commonly known as the total multipliers or Leontief-Keynes multipliers. In our analysis, Leontief-Keynes multipliers will capture the direct, the indirect AND the induced effects.
The total multiplier from the closed model is by definition larger than the simple multiplier from open model. The difference between the two multipliers is the induced impact.
Dublin Airport Economic Impact Study
84

Dublin Airport Economic Impact Study 84
Closed Model: Direct, Indirect and Induced Impacts
Conversely, in the closed model, the household sector is treated as endogenous to the system. The household sector receiving income from the work done in the production process would spend some of this income on local products. This increase in consumption would in turn increase the level of output of the products. In other words, the closed model accounts for both the production-induced effects as well as the consumption-induced effects. The multipliers generated using the closed model are commonly known as the total multipliers or Leontief-Keynes multipliers. In our analysis, Leontief-Keynes multipliers will capture the direct, the indirect AND the induced effects.
The total multiplier from the closed model is by definition larger than the simple multiplier from open model. The difference between the two multipliers is the induced impact.
