duct leakage and retrofit duct sealing in minnesota...
TRANSCRIPT

COMM-031912- 54682| December 1, 2016
Duct Leakage and Retrofit Duct Sealing
in Minnesota Commercial and
Institutional Buildings
Conservation Applied Research & Development (CARD)
FINAL REPORT
Prepared for: Minnesota Department of Commerce
Division of Energy Resources
Prepared by: Center for Energy and Environment
Prepared by:
Josh Quinnell ([email protected] 612-244-2437) Ben Schoenbauer ([email protected] 612-244-2413) Dave Bohac ([email protected] 612-335-5866) Martha Hewett
Center for Energy and Environment 212 3rd Avenue North, Suite 560 Minneapolis, MN 55401 612-335-5858 CEE Website (https://www.mncee.org)
© 2016 Center for Energy and Environment. All rights reserved.
Contract Number: 54682
Prepared for Minnesota Department of Commerce, Division of Energy Resources
Mike Rothman, Commissioner, Department of Commerce
Bill Grant, Deputy Commissioner, Department of Commerce, Division of Energy Resources
Mary Sue Lobenstein, Project Manager 612-539-1872 [email protected]
ACKNOWLEDGEMENTS
This project was supported in part by a grant from the Minnesota Department of Commerce, Division of Energy Resources, through the Conservation Applied Research and Development (CARD) program, which is funded by Minnesota ratepayers. We would like to acknowledge Center for Energy and Environment staff including Tim Ellingson and Andrew Lutz for their help with survey instruments and fieldwork, respectively. We would also like to acknowledge assistance by The Energy Conservatory staff Kris Koenig and Gary Nelson for their help with duct pressurization measurements, powered flow hood measurements, duct system testing apparatus, laboratory space, and general assistance throughout the project.
DISCLAIMER
This report does not necessarily represent the view(s), opinion(s), or position(s) of the Minnesota Department of Commerce (Commerce), its employees or the State of Minnesota (State). When applicable, the State will evaluate the results of this research for inclusion in Conservation Improvement Program (CIP) portfolios and communicate its recommendations in separate document(s).
Commerce, the State, its employees, contractors, subcontractors, project participants, the organizations listed herein, or any person on behalf of any of the organizations mentioned herein make no warranty, express or implied, with respect to the use of any information, apparatus, method, or process disclosed in this document. Furthermore, the aforementioned parties assume no liability for the information in this report with respect to the use of, or damages resulting from the use of, any information, apparatus, method, or process disclosed in this document; nor does any party represent that the use of this information will not infringe upon privately owned rights.

i
Table of Contents
Definitions ............................................................................................................................................... viii
Executive Summary ................................................................................................................................... 1
Introduction/Background .................................................................................................................... 1
How it Works ..................................................................................................................................... 1
Commercial Duct Sealing Requirements ........................................................................................ 2
Methodology ........................................................................................................................................... 3
Study Objectives ................................................................................................................................. 3
Aeroseal Sealing Process ................................................................................................................... 3
Results ...................................................................................................................................................... 3
Duct Leakage ...................................................................................................................................... 3
Duct Sealing ........................................................................................................................................ 4
Energy and Cost Savings from Duct Sealing ................................................................................. 4
Simple Screening Criteria ................................................................................................................. 5
Pilot Results ........................................................................................................................................ 6
Recommendations for CIP .................................................................................................................... 6
Measures in Existing Programs ....................................................................................................... 7
Outreach .............................................................................................................................................. 7
New Construction .............................................................................................................................. 7
Future Work ............................................................................................................................................ 7
Introduction ................................................................................................................................................ 8
Background ............................................................................................................................................... 10
HVAC Duct Construction ................................................................................................................... 10
Duct Leakage in HVAC Systems ....................................................................................................... 12
Duct Leakage Standards ..................................................................................................................... 14
Retrofit Duct Leakage Sealing ............................................................................................................ 15
Methodology ............................................................................................................................................. 17
Characterizing Commercial and Institutional Duct Leakage ........................................................ 17
Design Engineer Web Survey ......................................................................................................... 17
Interviews and Field Observations................................................................................................ 18
Measuring Duct Leakage .................................................................................................................... 18
Energy and Cost Savings of Duct Sealing ........................................................................................ 19
Results ........................................................................................................................................................ 23
ii
Commercial and Institutional Duct Characterization ..................................................................... 23
Air Distribution System Design Characteristics .......................................................................... 23
Duct Leakage and Sealing Specification ....................................................................................... 27
Alternative Air Distribution System Designs .............................................................................. 34
System Design Characteristics ....................................................................................................... 36
Energy Conservation Potential ...................................................................................................... 37
Qualitative Observations on Ductwork Design and Specification ........................................... 39
Screening for Duct Leakage ................................................................................................................ 40
Site Selection Criteria ....................................................................................................................... 40
Screened Systems ............................................................................................................................. 41
Rejected Systems .............................................................................................................................. 48
Duct System Leakage Measurements ................................................................................................ 49
Duct System Leakage in Multifamily Buildings with Gypsum Board Exhaust ...................... 54
Retrofit Duct Leakage Sealing Results .............................................................................................. 55
Costs of Retrofit Duct Leakage Sealing ............................................................................................. 60
Operational Costs of Duct Leakage and Potential Retrofit Duct Sealing Cost Effectiveness .... 63
Screening and Duct Leakage Diagnostics ......................................................................................... 70
Information Sources......................................................................................................................... 70
Discussion ................................................................................................................................................. 80
Observations on Duct Leakage Measurements ............................................................................... 80
Observations of Retrofit Duct Sealing ........................................................................................... 80
Pilot Study ................................................................................................................................................. 88
Results .................................................................................................................................................... 89
Conclusions ............................................................................................................................................... 93
Duct Leakage in Minnesota ................................................................................................................ 93
Retrofit Duct Sealing ............................................................................................................................ 93
Challenges Associated with Retrofit Duct Sealing .......................................................................... 94
Screening Systems for Opportunity and Cost Effectiveness .......................................................... 95
System Types .................................................................................................................................... 95
Operating Pressure .......................................................................................................................... 95
Design Flow ...................................................................................................................................... 95
Apparent Tightness ......................................................................................................................... 95
Recommendations for CIP .................................................................................................................. 96

iii
Measures in Existing Programs ..................................................................................................... 96
Outreach ............................................................................................................................................ 97
Program for New Construction ..................................................................................................... 97
Future Work .......................................................................................................................................... 98
References ................................................................................................................................................. 99
Appendix A: Sample Survey Summary Report ................................................................................. 101
Minnesota engineers' duct design practices ................................................................................... 101
Appendix B: Leakage Measurement and Instrumentation Development ..................................... 110
Air Leakage Measurements via Pressurization Method .............................................................. 110
As-Operated Duct Leakage .......................................................................................................... 111
Powered Flow Hood ...................................................................................................................... 119
Appendix C: Additional Leakage Results .......................................................................................... 122
Appendix D: Measurement Comparisons .......................................................................................... 124
Comparing Duct Leakage Measurements ...................................................................................... 124
Practical Considerations of Duct Leakage Measurements ........................................................... 126
Tracer Gas ....................................................................................................................................... 126
Pressurization Measurements ...................................................................................................... 128
Aeroseal Commercial Duct Sealing Equipment Pressure Testing Evaluation ...................... 131
Appendix E: Additional Sealing Results ............................................................................................ 139
Appendix F: Interview Questions for Field Personnel ..................................................................... 141
Appendix G: Aeroseal Duct Leakage Scorecard ................................................................................ 150
List of Figures
Figure 1: Aeroseal SmartSeal system....................................................................................................... 2
Figure 2: Aeroseal sealant accumulates at the small, distributed leaks in a duct system. The left image shows a large 3/8” corner leak filled with sealant (viewed from inside). The right image shows a ¼” test hole filled with sealant (viewed from outside) ......................................................... 2
Figure 3: Percent of original duct leakage sealed via retrofit duct sealing. The systems that were included in the pilot are designated in blue. .......................................................................................... 4
Figure 4: Energy savings from retrofit duct sealing. ............................................................................. 5
Figure 5: Cost savings from retrofit duct sealing. ................................................................................. 5
Figure 6: Simple payback of initial systems, initial systems back-screened, and pilot systems sealed on screening criteria....................................................................................................................... 6

iv
Figure 7: Examples of longitudinal seams found in sheet metal ductwork (a) tongue and grove and (b) Pittsburgh Lock ........................................................................................................................... 10
Figure 8: Basic slip and drive joints for transverse joints (a) plain S slip, (b) a drive cleat ............ 11
Figure 9: Flanged transverse joint using Duct Mate connection2 ...................................................... 11
Figure 10: Examples of available spiral seams ..................................................................................... 12
Figure 11: Type of supply system design by floor area ...................................................................... 24
Figure 12: Type of return system design by floor area (n = 7) ........................................................... 24
Figure 13: Type of terminal unit by floor area ..................................................................................... 25
Figure 14: Type of VAV by floor area ................................................................................................... 26
Figure 15: Contribution of equipment to leakage (n = 8) ................................................................... 27
Figure 16: Contribution of accessories to leakage (n = 8) ................................................................... 28
Figure 17: Estimates of code compliance with state code requirements for duct sealing (n = 8) . 29
Figure 18: Sealing specifications for projects with supply ducts located above the ceiling (n = 8) .................................................................................................................................................................... 31
Figure 19: Specification of supply duct leakage class on supply ducts (n = 8) ............................... 32
Figure 20: Duct sealing specifications on return and exhaust ducts (n = 8) .................................... 33
Figure 21: Specification of return and exhaust duct leakage class (n = 8) ....................................... 33
Figure 22: Specification of alternative ductwork (n = 8) .................................................................... 34
Figure 23: Frequency of supply duct systems in C&I buildings ....................................................... 37
Figure 24: Operating pressure as a function of design flow (n = 24). ............................................... 51
Figure 25: Individual leakage results Filled: sealed, Open: Unsealed, Circle - Downstream, Diamond - Upstream, Triangle - Upstream & Downstream, Square - Exhaust Riser (n=24) ....... 52
Figure 26: Distribution of leakage fraction (n = 24). ............................................................................ 52
Figure 27: Duct leakage as a function of design flow (n = 24) ........................................................... 53
Figure 28: Leakage fraction as a function of design flow (n = 24). .................................................... 54
Figure 29: Duct leakage sealed by retrofit duct sealing process (n = 20) ......................................... 58
Figure 30: Percent of duct leakage sealed by retrofit duct sealing process (n = 20) ....................... 58
Figure 31: Pre and post leakage fractions for successful sealing projects (n = 15) .......................... 59
Figure 32: Sealed leakage as a function of design flow for successful sealing projects (n = 15) ... 59
Figure 33: Energy penalty of duct leakage for successfully sealed systems (absolute units) ....... 64

v
Figure 34: Energy penalty of duct leakage for successfully sealed systems (percentage of total energy use) ................................................................................................................................................ 65
Figure 35: Operational costs of duct leakage for successfully sealed systems (absolute costs). ... 67
Figure 36: Operational costs of duct leakage for successfully sealed systems (percentage of total leakage costs). ........................................................................................................................................... 68
Figure 37: Visible evidence of duct leakage; fouling caused by leakage over time (a) at slip drive corner, (b) VAV box connection, and (c) a branch take off ................................................................ 76
Figure 38: Example of major leakage path discovered via duct inspection: uncapped supply branch sealed with damper only. .......................................................................................................... 76
Figure 39: Access panels prone to leaking include spring lock and cam lock designs; deformation or gasket degradation results in leakage ....................................................................... 77
Figure 40: Application of screening criteria to systems in this project ............................................. 78
Figure 41: Duct blocking is necessary to isolate a section of ductwork for the Aeroseal process (a) A foam blocking is taped into place against a reheat coil as shown from outside the access panel opening and (b) the diffuser cone is removed and a round foam slab is inserted and taped into the diffuser collar. ............................................................................................................................ 82
Figure 42: Aeroseal equipment for pressurization testing and sealant delivery setup and ready .................................................................................................................................................................... 83
Figure 43: Aeroseal accumulation in ducts (a) fill of ¼” drilled hole (external view), (b) fill of 3/8” pre-existing corner hole at transition, (c) accumulation of sealant in collar, and (d) accumulation of sealant in poly tube near injector system ................................................................ 85
Figure 44: Traditional sealing measures including (a) external mastic spray, (b) external taping (shown during preparation stage), and (c) internal mastic spray ..................................................... 86
Figure 45: Sealing results from (a) external mastic spray over slip and drive transverse joint and (b) internal mastic spray over longitudinal seam and branch out. ................................................... 87
Figure 46: Pilot screening characteristics ............................................................................................. 89
Figure 47: Duct blocking locations for the pressurization testing of a downstream duct system .................................................................................................................................................................. 110
Figure 48: Tracer gas injector as described by the LBNL Patent. .................................................... 112
Figure 49: CEE developed tracer gas injector ..................................................................................... 113
Figure 50: Duct mounted CO2 injection whip ................................................................................... 113
Figure 51: Three probe analyzer (a) in the field (b) and as a diagram ............................................ 114
Figure 52: UC Davis tracer gas injection system with heated regulator, heater, and mass flow controller ................................................................................................................................................. 116
Figure 53: Laboratory downstream commercial duct system used for testing duct leakage instrumentation. ..................................................................................................................................... 117

vi
Figure 54: Laboratory accuracy of tracer gas measurement with multi-point injection and multi-point analyzer probe. ............................................................................................................................. 118
Figure 55: Single point tracer gas concentrations for a well-mixed measurement ....................... 118
Figure 56: Accuracy of the residential powered flow hood modified for commercial applications (24” x 24” diffusers). .............................................................................................................................. 120
Figure 57: Impact of a change in system pressure due to an airflow measurement at a single diffuser. .................................................................................................................................................... 121
Figure 58: Leakage per duct length (lineal ft) as a function of design flow rate. .......................... 122
Figure 59: Leakage per duct surface area (sqft) as a function of design flow rate. ....................... 122
Figure 60: Estimated leakage (CFM) at 100 Pa pressurization as a function of design flow rate. .................................................................................................................................................................. 123
Figure 62: A comparison of CEE and contractor pressurization measurements .......................... 129
Figure 63: Calibration facility and testing setup ................................................................................ 135
Figure 64: Complete testing setup (absent injection wand). ............................................................ 136
Figure 65: A test at the operating pressure (target = operating) can be substituted for a multi-point test .................................................................................................................................................. 137
Figure 66: Change in cross sectional area from variability in gate setting. (a) Natural gate setting, and (b) Artificially adjusted gate setting ............................................................................................ 138
Figure 68: Leakage flow sealed by retrofit duct sealing as a function of flow rate ...................... 139
Figure 69: Change in leakage (normalized to 100 Pa) after retrofit duct sealing as a function of operating pressure ................................................................................................................................. 139
Figure 70: Change in leakage (normalized to 100 Pa) after retrofit duct sealing as a function of flow rate ................................................................................................................................................... 140
Figure 71: Aeroseal duct leakage scorecard ....................................................................................... 150
List of Tables
Table 1: Minnesota air distribution system design experience of survey respondents ................. 18
Table 2: Type of buildings designed with ceiling plenum returns and fully ducted returns (n = 18) ............................................................................................................................................................... 25
Table 3: Building types where sealing specifications are more stringent than regular specifications (n = 8) ................................................................................................................................ 30
Table 4: Unique circumstances where alternative air distribution system designs are specified (n = 8) .............................................................................................................................................................. 35

vii
Table 5: Prevalence of air distribution system characteristics weighted and unweighted according to designed floor area (n = 8) ............................................................................................... 36
Table 6: Estimate of the leakage potential due to the absence of sealing specification by engineers in Minnesota C&I building stock weighted by designed floor area ............................... 38
Table 7: Supply system selection criteria based on expected prevalence of air distribution characteristics in Minnesota C&I building stock ................................................................................. 40
Table 8: Buildings and general system criteria for systems selected for study ............................... 42
Table 9: Detailed system characteristics for commercial and institutional systems selected for study .......................................................................................................................................................... 43
Table 10: Detailed system characteristics for multifamily systems selected for study .................. 45
Table 11: Systems rejected from study during site screening ............................................................ 48
Table 12: Operating points and initial duct leakage ........................................................................... 50
Table 13: Operating points and initial duct leakage for multi-family gypsum board exhaust systems ...................................................................................................................................................... 54
Table 14: Retrofit duct sealing results for successful sealing projects .............................................. 56
Table 15: Retrofit duct sealing results for unsuccessful sealing projects ......................................... 57
Table 16: Retrofit duct sealing costs ...................................................................................................... 61
Table 17. Contractor cost comparison ................................................................................................... 63
Table 18: Energy penalty due to duct leakage ..................................................................................... 63
Table 19: Operational costs of duct leakage and simple payback of retrofit duct sealing ............. 66
Table 20: Pilot system characteristics .................................................................................................... 88
Table 21: Pilot sealing results ................................................................................................................. 90
Table 22: Pilot sealing costs .................................................................................................................... 91
Table 23: Pilot sealing cost effectiveness ............................................................................................... 91
Table 24: Results from a single-point analyzer mixing test ............................................................. 119
Table 25: A comparison of as-operated and pressurization test duct leakage measurements ... 124
Table 26: A comparison of pressurization measurements ............................................................... 129
Table 27: Description of test configurations ....................................................................................... 134
Table 28: Percentage errors in flow rate measurement as a function of gate setting and fan box pressure ................................................................................................................................................... 136
Table 29: Interview questions for field personnel ............................................................................. 141

viii
Definitions Aeroseal Company offering duct-sealing products and patented method for duct
sealing
ASHRAE American Society of Heating, Refrigerating, and Air-Conditioning
Engineers
AHP Air horsepower
AHU Air handling unit
BAS Building automation system
C&I Commercial and institutional (buildings)
CAV Constant air volume
CBECS Commercial Building Energy Consumption Survey
CDD Cooling degree day
CL Ductwork leakage class
CMU Concrete masonry unit (concrete block)
COP Coefficient of performance
dP Pressure rise (inch w.g., Pa)
EIA Energy Information Administration
ELA Estimated Leakage Area, estimated hole or gap area required to give
measured leakage
F Measured leakage rate per 100 cfm
FHP Friction horse power
fL Leakage fraction, percent of total flow lost to duct leakage
FTE Full time employee
HDD Heating degree day
HVAC Heating, ventilation, and air conditioning (equipment)
HR Heat recovery
LBNL Lawrence Berkeley National Laboratory
η Efficiency
P Measured operating static pressure ( in w.g.) , Power (kW)
Ply The number of folded sheet metal layers on standard sheet metal duct
work connections
Q Airflow (cfm)
SEER Seasonal energy efficiency ratio
Slip & Drive Conventional sheet mental ductwork connector
SMACNA Sheet Metal & Air Conditioning Contractors’ National Association
TAB Test, Adjusting& Balancing
TEC The Energy Conservatory, Minneapolis based company offering pressure
measurement equipment
VAV Variable air volume
VFD Variable frequency drive

Duct Leakage & Retrofit Duct Sealing in MN C&I Buildings COMM-54682 | Dec 2016 Center for Energy and Environment 1 | P a g e
Executive Summary
Introduction/Background
Air leakage from distribution ductwork wastes energy by increasing fan power and discarding conditioned air. In Minnesota commercial and institutional (C&I) buildings, HVAC fans consume about 2,800 GWh of electricity per year (EIA 2008). Assuming about 5% duct leakage, approximately 380 GWh of fan power are lost on duct leakage per year. Duct leakage also results in significant heating and cooling energy penalties when conditioned air leakage is discarded from the envelope in exhaust or relief air systems.
Duct leakage has traditionally been framed as a performance issue rather than an energy efficiency issue. However, a significant body of research developed over the last 20 years suggests that duct systems are not particularly tight and may be a major energy inefficiency in building HVAC systems. This discovery coincides with the development of a novel, patented sealing process (Aeroseal) that makes it possible to tightly seal ductwork in retrofit applications. The Aeroseal method requires significantly less access compared to traditional methods, and it may represent a path toward cost-effective energy savings from retrofit duct sealing.
The growing recognition of duct leakage as a major cause of HVAC energy waste provided motivation to explore the possibility of retrofit duct sealing as an energy efficiency opportunity in Minnesota. This project characterized duct leakage in several types of Minnesota C&I buildings, completed retrofit duct sealing on a subset of C&I duct systems, and estimated the energy savings and cost effectiveness of retrofit sealing measures. The project then analyzed the results to develop screening criteria that displace cost-prohibitive leakage measurements and tested the criteria in a short pilot program to identify cost-effective duct sealing opportunities.
How it Works
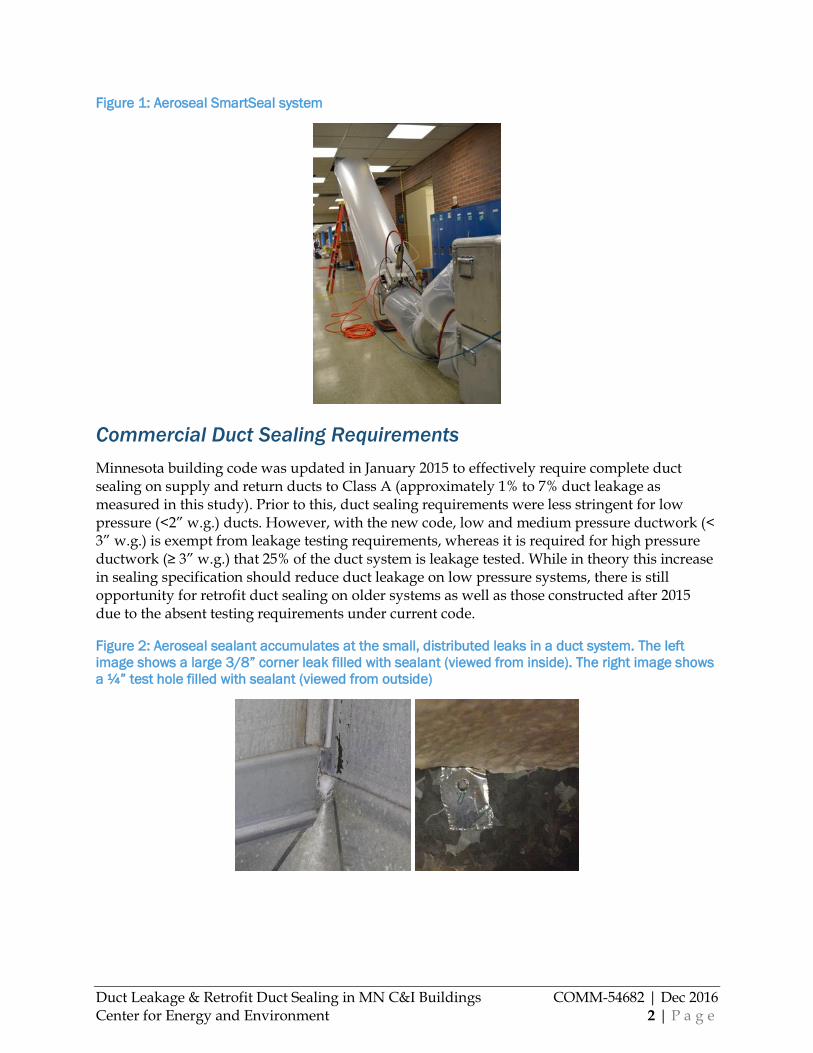
Conventional duct sealing methods typically utilize tapes and mastics applied via spray or brush. These methods are challenging to apply in a retrofit fashion due to limited accessibility from external insulation and other building elements in a finished building. A relatively new system (Figure 1) developed by Aeroseal for sealing ducts does not share this limitation. Rather, it relies on injecting an aerosolized sealant at a single point in a duct system that is isolated by blocking. The aerosol is delivered by a fan that pressurizes the ductwork, forcing the airflow carrying the sealant to escape through the leaks. As the air escapes through the leaks, the aerosol particles deposit on the surface of the leaks, sealing them over time (Figure 2). The Aeroseal method eliminates most access issues, thus extending the feasibility of retrofit duct sealing measures.
Duct Leakage & Retrofit Duct Sealing in MN C&I Buildings COMM-54682 | Dec 2016 Center for Energy and Environment 2 | P a g e
Figure 1: Aeroseal SmartSeal system
Commercial Duct Sealing Requirements
Minnesota building code was updated in January 2015 to effectively require complete duct sealing on supply and return ducts to Class A (approximately 1% to 7% duct leakage as measured in this study). Prior to this, duct sealing requirements were less stringent for low pressure (<2” w.g.) ducts. However, with the new code, low and medium pressure ductwork (< 3” w.g.) is exempt from leakage testing requirements, whereas it is required for high pressure ductwork (≥ 3” w.g.) that 25% of the duct system is leakage tested. While in theory this increase in sealing specification should reduce duct leakage on low pressure systems, there is still opportunity for retrofit duct sealing on older systems as well as those constructed after 2015 due to the absent testing requirements under current code.
Figure 2: Aeroseal sealant accumulates at the small, distributed leaks in a duct system. The left
image shows a large 3/8” corner leak filled with sealant (viewed from inside). The right image shows
a ¼” test hole filled with sealant (viewed from outside)

Duct Leakage & Retrofit Duct Sealing in MN C&I Buildings COMM-54682 | Dec 2016 Center for Energy and Environment 3 | P a g e
Methodology
This study emphasized understanding ductwork in MN C&I buildings and its applicability toward retrofit duct sealing measures. It consisted of three parts:
1. Characterize ductwork in Minnesota C&I buildings. Surveys and interviews of C&I air distribution design engineers and field personal were used to develop expectations for air distribution systems in C&I buildings. This information was used to develop selection criteria to ensure a representative sample of buildings.
2. Measure the duct leakage of 27 systems, carefully selected from a screening of 63 systems. A pressurization method, tracer gas measurements, and a powered flow hood were used to measure leakage and compare against contractor measurements.
3. Seal 23 of the systems using both conventional methods and the Aeroseal method.
Study Objectives 1. Characterize duct leakage in a variety of Minnesota C&I buildings.
2. Seal ductwork using conventional techniques and the Aeroseal method.
3. Estimate the costs, savings, and payback of retrofit duct sealing measures.
4. Develop a screening protocol to identify opportunities for cost-effective duct sealing.
5. Test screening criteria in a pilot program.
Aeroseal Sealing Process 1. Isolate ductwork — Systems are typically sealed in sections, with fans turned off and a
portion of the system blocked. This usually requires taping in place pieces of rigid foam
to fill the cross sectional area. Large blocking may require backer rods to add strength.
2. Setup the Aeroseal equipment — Setup and connect the equipment to an opening in the
isolated ductwork, usually through an access panel or diffuser.
3. Measure pre-leakage — The equipment pressurizes the section of ductwork to the
operating pressure and measures initial leakage (cfm).
4. Seal the Leakage — Aerosol sealant is injected into the system, slowly sealing the leaks.
Sealing typically lasts 45 to 90 minutes.
5. Measure post-leakage — The equipment pressurizes the sealed section of ductwork to
the operating pressure and measures final leakage (cfm).
6. Generate report — Remove the blocking and generate a leakage report, calculating the
leakage sealed from the difference between pre- and post-leakage measurements.
Results
Duct Leakage
Duct leakage for C&I ductwork systems was one-half to two-thirds less than anticipated, between 0% and 29% of measured flow rates:
75% of systems tested had leakage below 8%.

Duct Leakage & Retrofit Duct Sealing in MN C&I Buildings COMM-54682 | Dec 2016 Center for Energy and Environment 4 | P a g e
Systems with prior sealing had duct leakage that was less than 2%.
Duct leakage fractions and other leakage metrics were not well correlated to operating
conditions or system characteristics.
Duct leakage measurements taken from tracer gas and pressurization testing methods are
prohibitively expensive for identifying retrofit duct sealing opportunities.
Duct Sealing
Retrofit duct leakage sealing was very successful:
Retrofit duct sealing was successful in 75% of systems using both traditional and Aeroseal
methods. Unsuccessful sealing projects had system characteristics that indicate they
should be avoided and are easily identified for future work.
An average of 81% leakage was sealed and the median sealing rate was 86% (Figure 3).
The Aeroseal method was effective in a variety of scenarios, often reducing leakage
effectively to zero including:
o Initially tight and leaky ductwork;
o Supply and exhaust ductwork; and
o Upstream and downstream ductwork.
Blocking ducts for pressurization and sealant delivery is the most expensive component
of the Aeroseal method.
Figure 3: Percent of original duct leakage sealed via retrofit duct sealing. The systems that were
included in the pilot are designated in blue.
Energy and Cost Savings from Duct Sealing
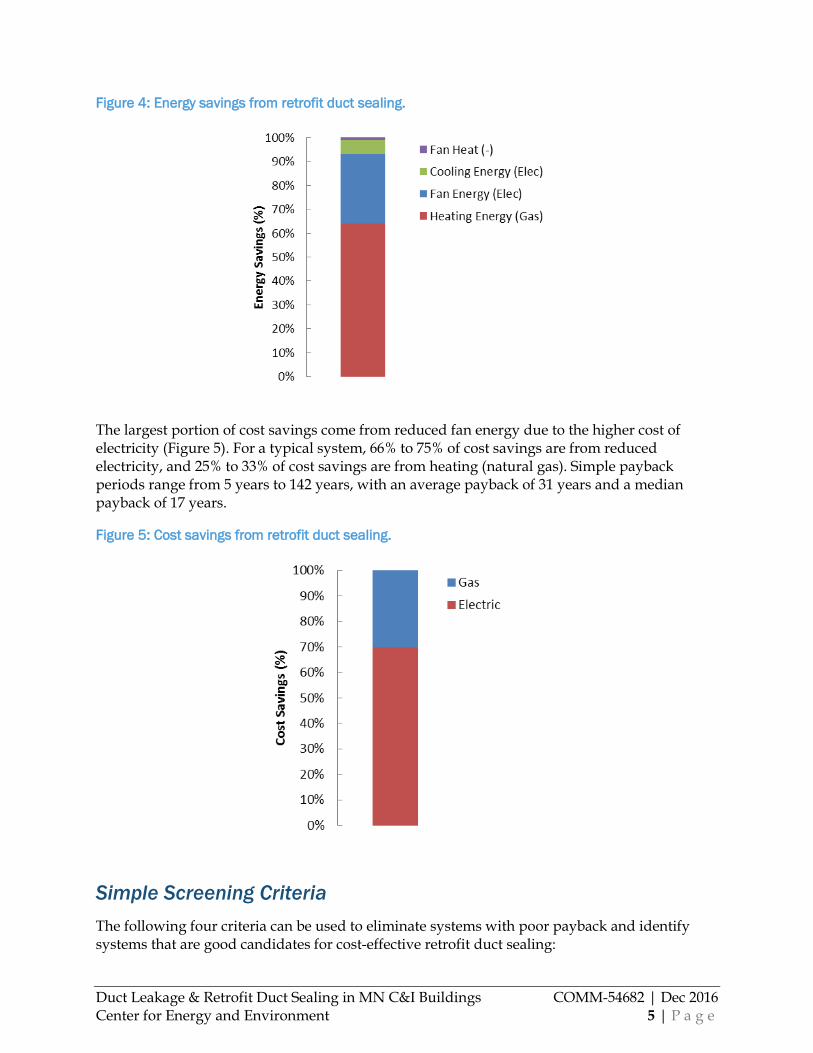
In most sealed systems, the largest fraction of energy savings was from heating energy, followed by fan energy and cooling energy (Figure 4). For a typical system, 64% of energy saved was from heating (natural gas), 29% was from fan energy (electrical), and 6% was from cooling (electrical).
Duct Leakage & Retrofit Duct Sealing in MN C&I Buildings COMM-54682 | Dec 2016 Center for Energy and Environment 5 | P a g e
Figure 4: Energy savings from retrofit duct sealing.
The largest portion of cost savings come from reduced fan energy due to the higher cost of electricity (Figure 5). For a typical system, 66% to 75% of cost savings are from reduced electricity, and 25% to 33% of cost savings are from heating (natural gas). Simple payback periods range from 5 years to 142 years, with an average payback of 31 years and a median payback of 17 years.
Figure 5: Cost savings from retrofit duct sealing.
Simple Screening Criteria
The following four criteria can be used to eliminate systems with poor payback and identify systems that are good candidates for cost-effective retrofit duct sealing:

Duct Leakage & Retrofit Duct Sealing in MN C&I Buildings COMM-54682 | Dec 2016 Center for Energy and Environment 6 | P a g e
1. System Type: Exhaust systems, especially those traversing unconditioned space; supply
systems located in ceiling plenum returns; or supply systems with fully ducted returns
are preferred.
2. Operating Pressure: Operating pressure of at least 0.5” w.g. are acceptable, above 1.0”
w.g. are preferred.
3. Design Flow: Design flows greater than 4,000 cfm are acceptable, greater than 10,000 cfm
are preferred.
4. Apparent Tightness: Systems with existing sealant and systems of apparently tight
construction are rejected (e.g. spiral, flanged & gasketed ductwork).
Pilot Results
Screening potential systems according to simple criteria in lieu of measuring duct leakage provided a dramatic improvement in cost-effectiveness (Figure 6):
Average payback was reduced from 31 years to 15 years when the screening criteria were
back-tested to original 20 systems.
Average payback was reduced to 7 years (n = 5) when screening criteria were used as the
basis of system selection in a short pilot program.
Figure 6: Simple payback of initial systems, initial systems back-screened, and pilot systems sealed
on screening criteria.
Recommendations for CIP
As energy efficiency upgrades become harder to identify, duct leakage in existing buildings has emerged as a new opportunity. Although measured leakage rates were lower than anticipated, project results suggest that about 10% to 15% of C&I buildings have leakage rates high enough to justify retrofit duct sealing work with moderate to good payback of 7 years or less. In the

Duct Leakage & Retrofit Duct Sealing in MN C&I Buildings COMM-54682 | Dec 2016 Center for Energy and Environment 7 | P a g e
small sample, careful screening efforts successfully identified the following utility program opportunities.
Measures in Existing Programs
Retrofit duct sealing should be incorporated as a savings measure into existing commercial auditing, recommissioning, and turn-key savings programs. A duct leakage screening process is critical to quickly identify and rule out systems that are unlikely to prove cost effective. A process based on the results of this report can be immediately included into these services to identify the 10-15% of systems that are likely to achieve cost-effective retrofit duct sealing savings. Retrofit duct sealing merits consideration alongside more established energy efficiency measures that make up commercial programs and may see increased adoption when bundled with other measures.
Outreach
Significant outreach efforts are necessary to inform and educate vendors and trade allies about the benefits of tight ductwork and potential retrofit duct sealing measures. Targeted outreach efforts are necessary so that informed vendors can evaluate retrofit duct sealing opportunities and recommend them where feasible.
New Construction
While not considered in this project, one of the most promising applications of commercial Aeroseal duct sealing is new construction. In light of code changes requiring the sealing of all commercial ductwork to Class A specification, the Aeroseal method should be able to compete with traditional duct sealing measures in new construction. Medium and high pressure ductwork requires testing so the total cost of the Aeroseal method may be competitive with traditional duct sealing and separate testing processes. Even lower pressure ductwork, without testing requirements can benefit from the sealing and testing upon construction, especially small systems, where cost effectiveness of retrofit opportunities to improve installed performance will be difficult.
In addition, sealing ductwork prior to balancing and commissioning offers guaranteed savings. These savings would be significant and could qualify for rebates, even if one assumes the moderate rates of leakage encountered in this project.
Future Work
While this research validated the potential of retrofit duct sealing in Minnesota C&I buildings, continued efforts are necessary to refine the understanding of opportunities, savings, and costs. In light of the uncertainties regarding the cost-effectiveness of retrofit duct sealing measures, we recommend collaboration with duct sealing and commercial program vendors to create and maintain a database of screening and sealing results that will allow for continued improvement of screening efficiency as well as the ability to predict energy and cost savings.

Duct Leakage & Retrofit Duct Sealing in MN C&I Buildings COMM-54682 | Dec 2016 Center for Energy and Environment 8 | P a g e
Introduction
The goal of this project is to quantify the energy savings achievable by sealing duct systems in large commercial and institutional (C&I) buildings in Minnesota and identify how retrofit duct sealing in large C&I buildings may contribute to Minnesota’s 1.5%/year energy savings goal. Supply, return and exhaust fans account for 27% of the primary energy used by HVAC systems in C&I buildings (Westphalen and Koszalinski 1999, 2001). In Minnesota C&I HVAC fans consume about 2,800 GWh of electricity per year (EIA 2008). Assuming C&I ducts leak at only 5%, approximately 380 GWh per year of fan power alone are lost on duct leakage. In addition to wasting fan energy, duct leakage can cause significant heating and cooling energy penalties, even when ducts are located in conditioned space (Modera 2005).
Sealing codes and duct construction standards have traditionally focused on high pressure systems, greater than 3” water gauge (w.g.) duct static pressure. These standards have long mandated relatively good sealing specifications and tightness performance standards that are validated by leakage testing requirements. However low and medium pressure ducts, < 3 “w.g., have typically not required testing to validate tightness and in many cases require less sealing. However a significant body of research has developed over the last 20 years that suggests low pressure systems are not particularly tight and in fact may be a major energy inefficiency in building HVAC systems.
Furthermore the development of a novel duct sealing process, ideal for retrofit applications, has reached maturity after nearly 20 years of development. This Aeroseal process requires significantly less duct access than traditional sealing methods and may represent a new path toward cost effective energy savings from retrofit duct sealing.
Prior research to measure duct leakage has primarily taken place in California. Wray et al. (2005) summarized research projects that measured the leakage flow fraction (fL) in 10 systems. Seven systems had leakage of 9% to 26% of flow (average 15.6%), while three had leakage less than 5%. These studies were often coupled with experiments to test and develop an aerosol based duct-sealing process. Using the prototype aerosol method, Modera (2005) reduced the effective leakage area (ELA) by 84% to 90% in the horizontal runs of four systems in a 78,000 sqft office building; this amounted to 69% to 82% of total system leakage. These investigators later sealed between 75% and 93% of ELA in nine other systems (Modera 2007). Diamond et al. (2003) and Wray and Matson (2003) measured and modeled fan energy savings ranging from 20% to 50% when the leakage fraction was reduced from 20% to 5%.
While sealing ducts in large buildings appears to have significant potential, Minnesota-specific research and development is needed. Insufficient data are available on key physical characteristics of the existing stock of large commercial duct systems. These attributes affect savings potential and sealing feasibility. To date, only a small number of large commercial duct systems have been tested to quantify leakage and most of these have been in California, where construction practices may differ significantly from those in Minnesota. Subsequently, few of these systems have been sealed, leaving questions about leakage reduction, cost effectiveness, and the practical implementation of these services. Practical methods are needed to screen and pre-qualify large C&I systems for duct-sealing savings potential.
Duct Leakage & Retrofit Duct Sealing in MN C&I Buildings COMM-54682 | Dec 2016 Center for Energy and Environment 9 | P a g e
Duct leakage is conventionally measured by blocking portions of ductwork and measuring the flow rates in the sealed section using a calibrated fan that pressurizes the system to operating pressures. However as duct system pressure varies from the fan to the outlet and leaks are non-uniformly distributed, a single operating pressure may not characterize the system. Wray et al. concluded that low leakage rate measurements from this method are good indicator that a system is tight, but high leakage rates do not necessarily mean that system leakage is significant during operation.
On the other hand, measuring the leakage flow fraction directly presents significant challenges. Lawrence Berkeley National Laboratory (LBNL) has published on research-grade methods to obtain accurate measurements of duct leakage involving tracer gas and powered-flow hood instruments. Recently The Energy Conservatory (TEC) developed a powered flow hood that performed well in LBNL tests on residential outlets. That device, modified for commercial sized outlets and calibrated using laboratory and field measurements, may provide a method for diagnostic measurements of duct leakage on a production basis. LBNL has also identified a tracer gas method to obtain accurate measurements of system flows. The mass of tracer gas injected into the system is compared to the increase in tracer gas concentration during the injection period to compute the air flow rate.
The identification of duct-leakage as a major potential HVAC energy loss, even in low pressure ductwork, has given impetus to research retrofit duct sealing as an energy efficiency measure in Minnesota. In this this project duct leakage is characterized in several types of Minnesota Commercial and Institutional buildings. Retrofit duct sealing measures were completed on a subset of these systems to estimate potential energy savings, sealing costs, and simple paybacks of retrofit duct sealing. The results were analyzed to develop screening and diagnostic procedures to displace costly measurements. These criteria were tested in a short pilot program to identify cost effective duct sealing opportunities that enable the Minnesota Department of Commerce, Division of Energy Resources (DER) and utilities to assess the viability of large commercial duct sealing programs in Minnesota.

Duct Leakage & Retrofit Duct Sealing in MN C&I Buildings COMM-54682 | Dec 2016 Center for Energy and Environment 10 | P a g e
Background
HVAC Duct Construction
There are a variety of types of materials used to construct ducts and plenums in commercial and institutional buildings, but galvanized sheet metal steel ductwork is by far most prevalent type of ductwork found in C&I buildings. Sections of galvanized sheet metal are usually delivered partially formed to the site, where the final construction, modification, and assembly take place.
Rectangular sections of ductwork are typically comprised of two L-shaped pieces that fit together using a type of folded sheet metal joint, which creates two longitudinal seams that run the horizontal length of the ductwork. Round ductwork typically only has one longitudinal seam. The simplest joint is a tongue and grove system (Figure 7(a)). The Pittsburgh lock (Figure 7(b)) is an example of more sophisticated folded sheet metal connectors with more folded sheet metal layers or “plys”. These seams create a rigid and secure section of duck work, but it is not air tight.
Figure 7: Examples of longitudinal seams found in sheet metal ductwork (a) tongue and grove1 and
(b) Pittsburgh Lock2
(a)
(b)
Folded sheet metal connections are also used at joints between sections of ductwork. One common example is the slip and drive joint, shown in Figure 8. Two sections of ductwork each with a preformed grove are brought together with an “S” slip and a connecting cleat or “drive” fastens the aligned vertical lips of the two sections to join them together. There are a variety of types of slips and drives, but they all employ the same principle; they create rigid and secure joints that are not air tight.
1 Ductwork Installation Guide, 2014. Snappy, (http://www.snappyco.com/media/134689/snappy-installation-guide.pdf), Retrieved on 06/29/2015.
2 Spiral Manufacturing, (http://www.spiralmfg.com/spiral_low_pressure/rec_sheet_metal.html), Retrieved on 06/29/2015.

Duct Leakage & Retrofit Duct Sealing in MN C&I Buildings COMM-54682 | Dec 2016 Center for Energy and Environment 11 | P a g e
Sections of ductwork can also be joined by flanges, which can provide a tighter seal, especially with the use of gaskets. One common example is the Duct Mate (Figure 9), a type of joint where duct sections have pre-rolled flanges, which are affixed using cleats. When gasketed and proper attention is paid to corners, these joints can be assumed to be reasonably air tight. However the joints are only as good as the gaskets, which may degrade over time. Sheet metal ducts can also be welded together at joints and seams to create a virtually air tight duct system.
Figure 8: Basic slip and drive joints for transverse joints (a) plain S slip, (b) a drive cleat
(a)
(b)
Figure 9: Flanged transverse joint using Duct Mate connection2
Spiral ducts (Figure 10) have a single longitudinal seam that “spirals” around each duct section; however, these folded metal connections are secured during fabrication, which generally enables them to be consistently tighter and more rigid than seams joined in the field. Furthermore a variety of enhancements, e.g. self-sealing and gasketing technologies are more easily incorporated into these seams during fabrication. In practice, spiral ducts are reasonably air tight.

Duct Leakage & Retrofit Duct Sealing in MN C&I Buildings COMM-54682 | Dec 2016 Center for Energy and Environment 12 | P a g e
Figure 10: Examples of available spiral seams3
Flex ducts are wire spirals lined with one or more plastic liners, typically used to attach outlets to rigid ductwork. Typically flex is attached to rigid collars using nylon cable ties and an auto-tensioning cable tie gun. Unless punctured, this ductwork is reasonably air tight. Duct leakage tends to occur at the joints with the rigid components. These joints tend to be secure and reasonably air tight, except in circumstances where take offs and collars are very short or the flex is subject to a very small bending radius or otherwise under tension from a stretched or very cramped run.
There are several alternative duct constructions including fiberglass (duct board), gypsum board (dry wall), and concrete masonry units (CMUs). Of these, gypsum boards may be the most common because they are sometimes used as general exhaust shafts for cost and convenience.
Duct Leakage in HVAC Systems
Ducts distribute conditioned air in buildings, but ducts are generally not air tight. Air leakage occurs when there is a leakage path between ducts and their surroundings and a pressure difference across the leakage path. A leakage path is any unintended passageway in a duct through which air might move, e.g. seams, connections, penetrations, balancing ports, screw holes, and cracks.
Ducts that supply conditioned air to spaces have higher pressure than ambient space around them. Subsequently air leaks from the ducts to the space surrounding them. Ducts that remove air from spaces have lower pressure than the ambient space around them and air leaks into the ducts from the surrounding space. Large systems, spanning hundreds of feet or more, particularly vertical duct risers, can traverse areas with both higher and lower pressure. In these cases leaks are possible in both directions.
3 Sheet Metal Connectors Inc., (http://www.smcduct.com/spiral-pipe-and-fittings/spiral-pipe), Retrieved 06/29/2015

Duct Leakage & Retrofit Duct Sealing in MN C&I Buildings COMM-54682 | Dec 2016 Center for Energy and Environment 13 | P a g e
Air leakage can be viewed as a system inefficiency because the energy used to move and condition leakage air is either wasted, lost, or delivered in an unintended manner. The magnitude of this inefficiency depends on specific system details. Several types of systems and consequences for duct leakage are qualitatively introduced below. There are significantly more possibilities, but these systems describe the types of HVAC systems encountered in this project.
Supply systems that convey air inside of return plenums: Plenums serve the same purpose as ducts except they are usually just architectural areas versus fabricated ductwork sections. The most common example is the ceiling return plenum. The interstitial space above an (often dropped) ceiling serves as the return air path. When supply ducts traverse return plenums, air leaks from the supply to the return. The leakage air is not used to ventilate or condition the space. The fan energy to move that air is wasted and some of the energy to condition the air is wasted. The amount of heating and cooling energy wasted depends on the fraction of return air that is recirculated back into the duct system. If all of the return air is recirculated, then thermal energy losses are negligible. If all of the return air is evacuated from the envelope, then all of the thermal energy is lost. These supply systems are prevalent in large commercial and institutional buildings in Minnesota
Supply systems with exposed ductwork: In these systems the supply ducts that convey the air are located in, and “exposed” to, the conditioned space. Air leaks from these ducts into the conditioned space. Since the air leaks are uncontrolled, they do not enter the space at the expected locations (diffusers). Hence there is some inefficiency with respect to the distribution of ventilation air and heating and cooling energy. However since the air leakage finds itself in the conditioned space, these inefficiencies are small and consequently the energy penalties are small. Exposed ducts are common in small to mid-size commercial and institutional buildings and to a lesser extent larger buildings or open sections of large buildings.
Supply systems that convey air through unconditioned spaces: The energy to move (fan energy) and the energy to condition that leakage air (heating and cooling energy) is wasted. Air that leaks from these systems is lost and the energy penalty is large. This ductwork is not common in Minnesota.
Exposed return ducts: Exposed return ducts draw air from the space through leaks. While this results in an unintended return path, the energy consequences are minor. This ductwork is not common in Minnesota.
Ceiling return plenums: Leakage from return plenums, specifically ceiling return plenums is functionally similar to exposed return ductwork since ceiling return plenums are adjacent to conditioned space. Hence energy penalties are negligible. The exception is infiltration from unconditioned space or the building exterior, but this is addressed as a building envelope leakage rather than duct leakage. Ceiling return plenums are very common in large commercial and institutional buildings in Minnesota
Ducted returns that convey air through unconditioned spaces: Like supply systems, return ducting that runs through unconditioned space wastes fan and potentially thermal energy. Fan energy is wasted to move the leakage air and the leakage air must be conditioned by the heating or cooling system. Fully ducted return systems are typically found in specific types of buildings with heightened air quality concerns, including laboratories, health care facilities, and some school buildings.

Duct Leakage & Retrofit Duct Sealing in MN C&I Buildings COMM-54682 | Dec 2016 Center for Energy and Environment 14 | P a g e
Exhaust systems: Exhaust systems remove air from locations in conditioned and unconditioned spaces and evacuate it from the building envelope. They are usually, but not always, lower pressure than the surrounding space. When exhaust systems traverse unconditioned space, they bring in unconditioned air through leaks. The fan power to move air leakage is unnecessary, hence fan energy is wasted. However, there is no thermal penalty because the leaks are of unconditioned air. Exhaust systems that traverse conditioned space have the same fan energy penalty. They also have a relatively large thermal penalty because the conditioned air is leaked and evacuated from the building. In addition to the energy penalties, there are some additional consequences of duct leakage. For example, air leakage may result in inadequate heating or cooling of some spaces and unfiltered leakage air may prematurely foul HVAC ducting and system components. Furthermore, air leakage from unconditioned spaces can bring in dust, mold, or contaminants that reduce indoor air quality.
Duct Leakage Standards
The requirements for duct construction, sealing and insulation in the state mechanical and energy codes from 1994 to the present were reviewed. Over this time, MN codes have referenced various standards including ASHRAE 90.1, IECC, IMC, SMACNA, and UMC. Many of these requirements have changed relatively little in the past 21 years. The main sealing requirements are presented here and contrasted with prior codes.
Minnesota Code was updated in January 2015. Provisions on duct sealing and construction generally reference IMC 2012, IECC 2012, and ASHRAE 90.1-2010. Prior to this update, Minnesota Mechanical Code referenced IMC 2006 (2009-2015), IMC 2000 (2004-2009), and UMC 1991 (1994 – 2004).
Both IECC and ASHRAE 90.1-2010 effectively require complete duct sealing on supply and return ducts. From IECC 2012:
Low pressure duct systems (< 2” w.g. duct static)
“All longitudinal and transverse joints, seams, and connections of supply and return ducts … shall be sealed with welds, gaskets, mastics, mastic-plus-embedded-fabric systems or tapes”
With the exception,
“Continuously welded and locking type longitudinal joints and seams”
Medium pressure duct systems (2 – 3” w.g. duct static)
“All ducts and plenums … shall be sealed in accordance with Section 403.2.7”
which points to Section 603.9 of the IMC standard and reads similar to the sealing requirement for low pressure duct systems with added language including labeling requirements and sealing “duct connections to flanges.”
High pressure duct systems (>3” w.g. duct static)

Duct Leakage & Retrofit Duct Sealing in MN C&I Buildings COMM-54682 | Dec 2016 Center for Energy and Environment 15 | P a g e
In addition to matching the aforementioned sealing requirements, high pressure ductwork must be leak-tested in accordance with SMACNA HVAC Air Duct Leakage Test Manual with the an air leakage rate or leakage class (CL) less or equal to 6, where CL is determined by,
𝟔 ≤ 𝑪𝑳 = 𝑭/𝑷𝟎.𝟔𝟓
Where F is the measured leakage rate per 100 cfm and P is the static pressure (in. w.g.) of the test. Results must be documented and at least 25% of the duct area must be tested.
Alternatively ASHRAE90.1-2010 is essentially the same with a bit more specificity,
“Ductwork and all plenums with pressure class ratings shall be constructed to seal class A … Openings for rotating shafts shall be sealed with bushings or other devices that seal off air leakage. … All connections shall be sealed, including but not limited to spin-ins, taps, other branch connections, access doors, access panels, and duct connections to equipment. Sealing that would void product listings is not required. Spiral lock seams need not be sealed. All duct pressure class ratings shall be designated in the design documents.”
where class A sealing effectively means all joints, seams and connections. The ASHRAE 90.1 2010 effectively points to the same testing requirements as IECC for duct statics above 3” w.g. The sealing requirements in ASHRAE 90.1-2010 are somewhat more stringent than IECC in that they evidently include all ductwork, whereas IECC specifically mentions supply and return ductwork.
Generally the changes to duct sealing code requirements have been small over the past few decades. Between 2005 and 2015, Minnesota Rules, Chapter 1346, based on IMC 2000 and 2006, allowed an exception to sealing for ducts less than 0.5“ w.g. A few of the duct sealing requirements were different for the period from 1994-2004 (1991 UMC Section 1002(c)). Requirements for sealing of duct wall penetrations were less strict, while those for sealing of transverse joints were stricter. Specifically, penetrations did not have to be sealed in exterior ductwork with design pressures of 3” w.g. or less or in interior ductwork with design pressures greater than 0.5”and less than or equal to 3” w.g. Transverse joints did have to be sealed where design static pressures were greater than 0.25” w.g. Transverse joints of ducts within return, relief or exhaust plenums had to be sealed down to design static pressures of 0.25” inclusive. The biggest change to duct sealing codes was the recent code transition in June 2015 to the IMC 2012 / ASHRAE 90.1-2010. Prior to this standard, sealing requirements were less stringent on low pressure (<2” w.g.) and medium pressure (2 - 3 “ w.g.), which previously required less sealing (sealing class C and B, respectively). It is anticipated that low pressure ductwork from past construction is more prone to leakage due to the relaxed requirements for sealing and testing. In theory the recently updated sealing specification should reduce duct leakage on low pressure systems, but no testing process is required to verify the more stringent requirement.
Retrofit Duct Leakage Sealing
During new construction, leakage paths are typically sealed using a variety of tape or mastic products that are applied by hand, brush, or spray. These methods are fairly straightforward to apply during the construction phase when duct access is available. Retrofit duct sealing poses a challenge due to access limitations introduced by dropped ceilings, finished ceilings, sealed risers, external insulation, and building activities. These challenges can be overcome at high

Duct Leakage & Retrofit Duct Sealing in MN C&I Buildings COMM-54682 | Dec 2016 Center for Energy and Environment 16 | P a g e
cost. For this reason, retrofit duct sealing hasn’t been generally considered as viable option for addressing leaky ducts. Recently however, a new process for duct sealing has gained traction.
This Aeroseal process (the Aeroseal company) uses a novel approach that does not require the same level of duct access. Operationally, the Aeroseal process is similar to procedures for measuring duct leakage. A portion of the ductwork is isolated by physically blocking it off from the duct system and the building. The Aeroseal equipment is hooked up to this isolated duct section and a fan blows aerosol sealant into the duct work. The sealant escapes through leaks in the duct work, slowly depositing on the edges of gaps and sealing them upon exit. As the ductwork is sealed, the pressure rises and the leakage flow is reduced. In most cases this injection process takes between 45 and 90 minutes to seal the duct work. The fan for injecting the aerosol is also used to measure duct leakage before and after sealing. It is due to this new method, that cost-effective retrofit duct sealing has become a new energy efficiency measure for consideration.
Duct Leakage & Retrofit Duct Sealing in MN C&I Buildings COMM-54682 | Dec 2016 Center for Energy and Environment 17 | P a g e
Methodology
Characterizing Commercial and Institutional Duct Leakage
Air distribution system characteristics strongly influence the potential for energy savings from duct sealing. Reliable information on the design and installation of duct systems in existing large commercial and institutional (C&I) buildings in Minnesota is needed to quantify the potential for energy savings from duct sealing and determine building selection criteria. This data was acquired by surveying C&I air distribution design engineers and supplemented with interviews of a sample group of sheet metal contractors, test and balancers, and code officials. The survey and interviews cover the current and historical prevalence of various design features and construction practices for duct systems, the rationale for these features and practices, and the interviewees’ experience with duct leakage. This methodology section provides details about the survey design and interview process.
Design Engineer Web Survey
Two methods were used to collect data about air distribution systems in the Minnesota C&I building stock. The first was a web-based survey used to gain quantitative and qualitative information about ducting systems in C&I buildings as designed and specified by design engineers. The survey received responses from eight experienced engineers who design air distribution systems for C&I buildings in Minnesota. They answered up to 47 questions based on the following categories:
1. system design 2. duct sealing specifications 3. alternative air distribution systems.
The first category included questions on the major design choices for air distribution systems, including terminal units and supply and return systems. The second category covered duct sealing specifications and compliance with specifications. The last category included questions on alternative air distribution systems such as gypsum board, above and below grade CMUs, and fiberglass ducts. The majority of the questions provided quantifiable responses; several questions gave the opportunity for comments. These comments are included when necessary to illustrate key points. The survey summary report is included as Appendix A.
The number of responses (n = 8) provides some validity to the results under some circumstances (e.g. when there is strong agreement), but the response count is too low to provide a rigorous statistical treatment of Minnesota C&I building stock. However, the validity of these results is reinforced by comparing the respondents’ experience to Minnesota C&I building stock. Experience data are summarized in Table 1.
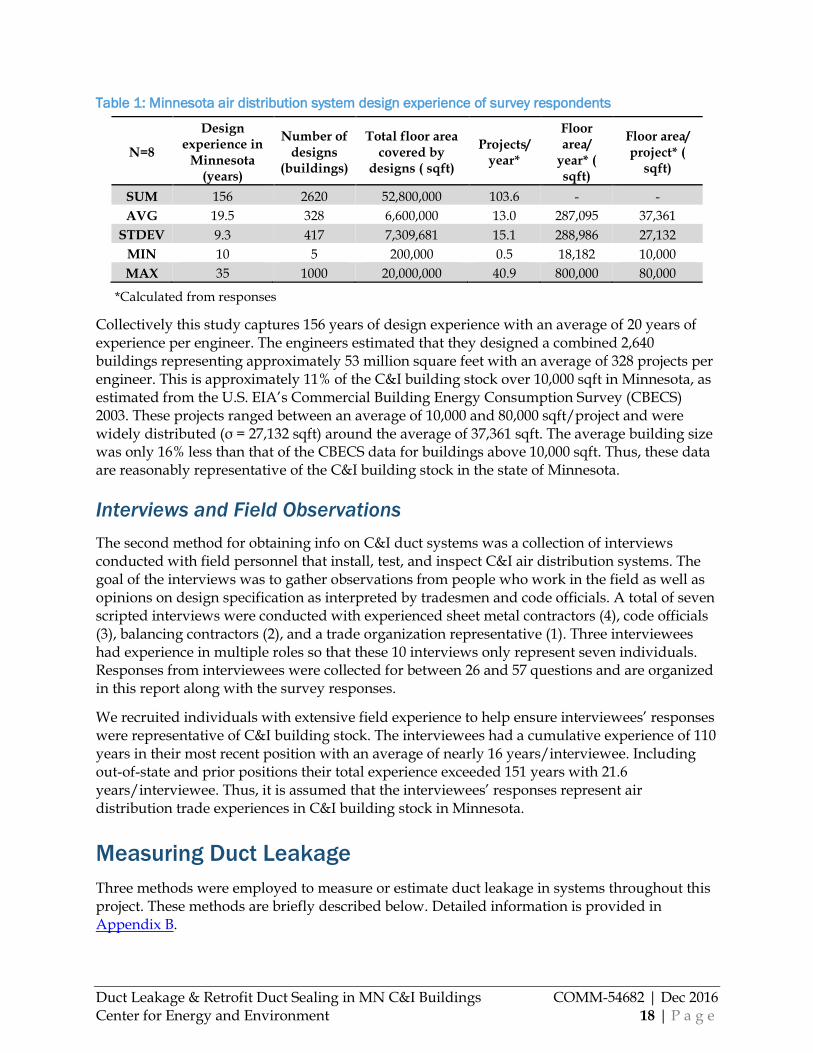
Duct Leakage & Retrofit Duct Sealing in MN C&I Buildings COMM-54682 | Dec 2016 Center for Energy and Environment 18 | P a g e
Table 1: Minnesota air distribution system design experience of survey respondents
N=8
Design experience in
Minnesota (years)
Number of designs
(buildings)
Total floor area covered by
designs ( sqft)
Projects/ year*
Floor area/
year* ( sqft)
Floor area/ project* (
sqft)
SUM 156 2620 52,800,000 103.6 - -
AVG 19.5 328 6,600,000 13.0 287,095 37,361
STDEV 9.3 417 7,309,681 15.1 288,986 27,132
MIN 10 5 200,000 0.5 18,182 10,000
MAX 35 1000 20,000,000 40.9 800,000 80,000
*Calculated from responses
Collectively this study captures 156 years of design experience with an average of 20 years of experience per engineer. The engineers estimated that they designed a combined 2,640 buildings representing approximately 53 million square feet with an average of 328 projects per engineer. This is approximately 11% of the C&I building stock over 10,000 sqft in Minnesota, as estimated from the U.S. EIA’s Commercial Building Energy Consumption Survey (CBECS) 2003. These projects ranged between an average of 10,000 and 80,000 sqft/project and were widely distributed (σ = 27,132 sqft) around the average of 37,361 sqft. The average building size was only 16% less than that of the CBECS data for buildings above 10,000 sqft. Thus, these data are reasonably representative of the C&I building stock in the state of Minnesota.
Interviews and Field Observations
The second method for obtaining info on C&I duct systems was a collection of interviews conducted with field personnel that install, test, and inspect C&I air distribution systems. The goal of the interviews was to gather observations from people who work in the field as well as opinions on design specification as interpreted by tradesmen and code officials. A total of seven scripted interviews were conducted with experienced sheet metal contractors (4), code officials (3), balancing contractors (2), and a trade organization representative (1). Three interviewees had experience in multiple roles so that these 10 interviews only represent seven individuals. Responses from interviewees were collected for between 26 and 57 questions and are organized in this report along with the survey responses.
We recruited individuals with extensive field experience to help ensure interviewees’ responses were representative of C&I building stock. The interviewees had a cumulative experience of 110 years in their most recent position with an average of nearly 16 years/interviewee. Including out-of-state and prior positions their total experience exceeded 151 years with 21.6 years/interviewee. Thus, it is assumed that the interviewees’ responses represent air distribution trade experiences in C&I building stock in Minnesota.
Measuring Duct Leakage
Three methods were employed to measure or estimate duct leakage in systems throughout this project. These methods are briefly described below. Detailed information is provided in Appendix B.
Duct Leakage & Retrofit Duct Sealing in MN C&I Buildings COMM-54682 | Dec 2016 Center for Energy and Environment 19 | P a g e
Pressurization method: A section of ductwork is isolated (blocked off) from the system with the use of rigid airtight baffling. The isolated portion of the system is pressurized using a calibrated fan (TEC Duct Blaster). The flow through the calibrated fan is an estimate of duct leakage at the pressure achieved during the test. The pressurization (or depressurization) test for this project followed an eight step process created based on the equipment manufacturer’s (The Energy Conservatory) recommendations. In most cases, duct leakage measurements presented in this report are based on this pressurization method.
Tracer gas method: A lengthy investigation was completed to determine whether an in-situ tracer gas technique could reliably and quickly measure duct leakage in operating HVAC systems. In this method, a CO2 tracer gas is injected into ductwork as the HVAC system is operating. Downstream of the injection, after sufficient mixing has taken place, the CO2 concentration is measured by a gas analyzer. A flow rate is calculated from the concentration measurement assuming uniform CO2 concentration. If this process is repeated at two different locations on a branch of ductwork, the duct leakage between the locations is equivalent to the difference in flow rate measurements. In practice, it was difficult to consistently achieve sufficient mixing of the CO2 within the ducts to allow good measurements.
Tracer gas and flow hood method: As above, a flow rate measurement is made using the tracer gas technique. A second tracer gas measurement is replaced by a series of measurements of the airflow out of each outlet diffuser downstream of the tracer gas measurements. These diffuser measurements are summed to obtain a total outlet flow. The difference between the outlet flow and the tracer gas measurement is the duct leakage in that section. The diffuser flows are measured using a calibrated fan (TEC Duct Blaster) attached to the flow hood (TEC Custom Fabric Hood). The fan speed modulates such that the pressure in the hood matches that of the space, which eliminates the impact of the hood on the system operation. In practice, hood measurements were found to be very accurate, but the method was often subject to limitations by the upstream tracer gas measurement.
Energy and Cost Savings of Duct Sealing
The energy losses due to duct leakage depend on the system and its operating environment. In many cases there is a fan energy penalty to move the leakage air. In some cases there is a thermal energy penalty because conditioned air is lost through leaks. Energy and cost estimates can be derived from measured values or assumed values. In this section, basic calculations of both energy and operating costs of duct leakage are detailed. These estimates were developed to be simple and accessible.
It takes energy to move and condition air. Air that enters unconditioned spaces or that is evacuated from the building prior to fulfilling its intended purpose is wasted. Generally duct work is not air tight, thus air leaks to and from HVAC ductwork, (duct leakage). The energy embodied by the leaked air is often wasted, resulted in increased energy use and operating costs.
The power delivered by a fan to the air flow (air horse power, AHP) is the volumetric flow, Q, times the total pressure rise, dP.
𝑨𝑯𝑷 =𝑸𝐝𝐩𝐓𝐨𝐭𝐚𝐥
𝟔𝟑𝟓𝟔
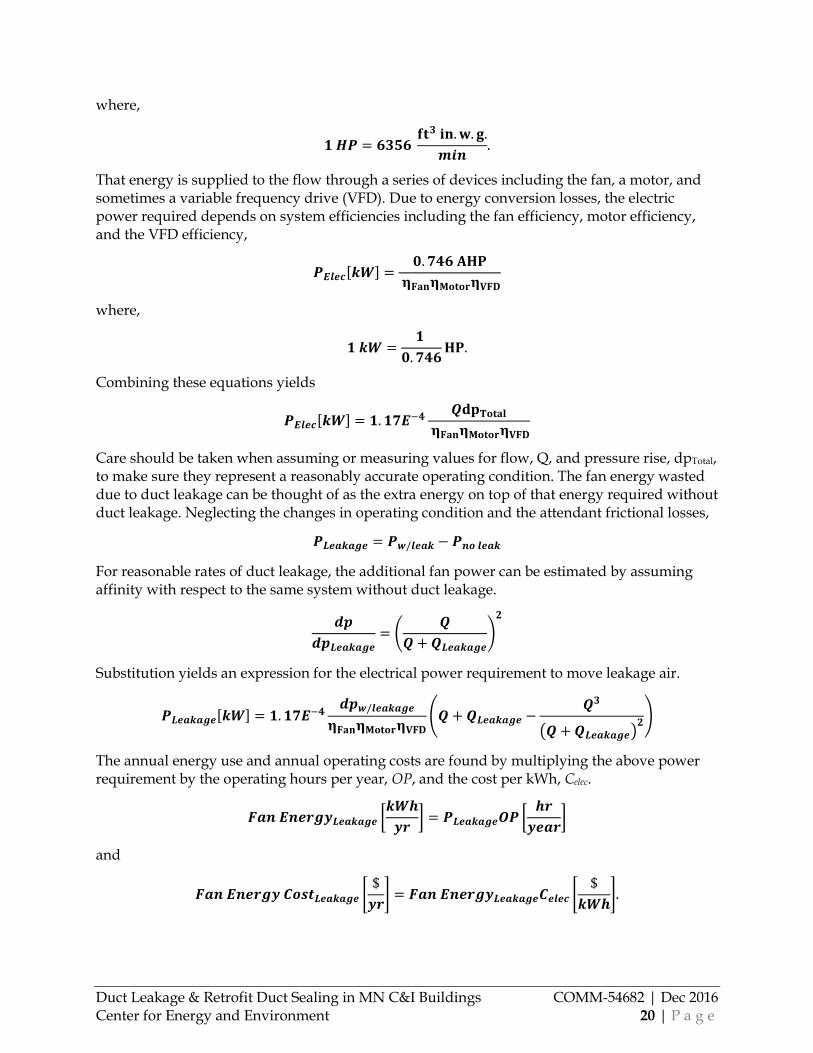
Duct Leakage & Retrofit Duct Sealing in MN C&I Buildings COMM-54682 | Dec 2016 Center for Energy and Environment 20 | P a g e
where,
𝟏 𝑯𝑷 = 𝟔𝟑𝟓𝟔 𝐟𝐭𝟑 𝐢𝐧. 𝐰. 𝐠.
𝒎𝒊𝒏.
That energy is supplied to the flow through a series of devices including the fan, a motor, and sometimes a variable frequency drive (VFD). Due to energy conversion losses, the electric power required depends on system efficiencies including the fan efficiency, motor efficiency, and the VFD efficiency,
𝑷𝑬𝒍𝒆𝒄[𝒌𝑾] =𝟎. 𝟕𝟒𝟔 𝐀𝐇𝐏
𝛈𝐅𝐚𝐧𝛈𝐌𝐨𝐭𝐨𝐫𝛈𝐕𝐅𝐃
where,
𝟏 𝒌𝑾 =𝟏
𝟎. 𝟕𝟒𝟔𝐇𝐏.
Combining these equations yields
𝑷𝑬𝒍𝒆𝒄[𝒌𝑾] = 𝟏. 𝟏𝟕𝑬−𝟒𝑸𝐝𝐩𝐓𝐨𝐭𝐚𝐥
𝛈𝐅𝐚𝐧𝛈𝐌𝐨𝐭𝐨𝐫𝛈𝐕𝐅𝐃
Care should be taken when assuming or measuring values for flow, Q, and pressure rise, dpTotal, to make sure they represent a reasonably accurate operating condition. The fan energy wasted due to duct leakage can be thought of as the extra energy on top of that energy required without duct leakage. Neglecting the changes in operating condition and the attendant frictional losses,
𝑷𝑳𝒆𝒂𝒌𝒂𝒈𝒆 = 𝑷𝒘/𝒍𝒆𝒂𝒌 − 𝑷𝒏𝒐 𝒍𝒆𝒂𝒌
For reasonable rates of duct leakage, the additional fan power can be estimated by assuming affinity with respect to the same system without duct leakage.
𝒅𝒑
𝒅𝒑𝑳𝒆𝒂𝒌𝒂𝒈𝒆= (
𝑸
𝑸 + 𝑸𝑳𝒆𝒂𝒌𝒂𝒈𝒆)
𝟐
Substitution yields an expression for the electrical power requirement to move leakage air.
𝑷𝑳𝒆𝒂𝒌𝒂𝒈𝒆[𝒌𝑾] = 𝟏. 𝟏𝟕𝑬−𝟒𝒅𝒑𝒘/𝒍𝒆𝒂𝒌𝒂𝒈𝒆
𝛈𝐅𝐚𝐧𝛈𝐌𝐨𝐭𝐨𝐫𝛈𝐕𝐅𝐃(𝑸 + 𝑸𝑳𝒆𝒂𝒌𝒂𝒈𝒆 −
𝑸𝟑
(𝑸 + 𝑸𝑳𝒆𝒂𝒌𝒂𝒈𝒆)𝟐
)
The annual energy use and annual operating costs are found by multiplying the above power requirement by the operating hours per year, OP, and the cost per kWh, Celec.
𝑭𝒂𝒏 𝑬𝒏𝒆𝒓𝒈𝒚𝑳𝒆𝒂𝒌𝒂𝒈𝒆 [𝒌𝑾𝒉
𝒚𝒓] = 𝑷𝑳𝒆𝒂𝒌𝒂𝒈𝒆𝑶𝑷 [
𝒉𝒓
𝒚𝒆𝒂𝒓]
and
𝑭𝒂𝒏 𝑬𝒏𝒆𝒓𝒈𝒚 𝑪𝒐𝒔𝒕𝑳𝒆𝒂𝒌𝒂𝒈𝒆 [$
𝒚𝒓] = 𝑭𝒂𝒏 𝑬𝒏𝒆𝒓𝒈𝒚𝑳𝒆𝒂𝒌𝒂𝒈𝒆𝑪𝒆𝒍𝒆𝒄 [
$
𝒌𝑾𝒉].

Duct Leakage & Retrofit Duct Sealing in MN C&I Buildings COMM-54682 | Dec 2016 Center for Energy and Environment 21 | P a g e
The friction in the conversion of shaft energy into flow energy (friction horse power), also called fan heat, is often transferred to the air flow as a heat gain. The fan heat may be similarly calculated by retracing the previous steps by substituting the friction horse power (FHP) for AHP and carrying it through the calculation to yield,
𝑭𝑯𝑷 = 𝑨𝑯𝑷 (𝟏
𝜼𝑭𝒂𝒏− 𝟏)
𝑷𝑭𝒂𝒏 𝑯𝒆𝒂𝒕[𝑩𝒕𝒖
𝒉𝒓] = 𝟎. 𝟒𝒅𝒑 (𝑸 + 𝑸𝑳 −
𝑸𝟑
(𝑸 + 𝑸𝑳𝒆𝒂𝒌𝒂𝒈𝒆)𝟐
) (𝟏 −𝟏
𝜼𝑭𝒂𝒏
)
where,
𝟏 [𝑩𝒕𝒖
𝒉𝒓] =
𝑯𝑷
𝟐𝟓𝟒𝟒.
In heating season this fan heat displaces some of the heating load. In cooling season; fan heat adds to the cooling load. Since the ratio of HDD/CDD in Minnesota is typically large, in favor of HDD, the added cooling energy can generally be neglected. In buildings with long cooling seasons it may be reconsidered. Depending on their configuration, some systems may have additional heat gains from motor heat. Furthermore since gains are small, the impact of fan heat is also neglected energy for heating operation.
The heating and cooling energy lost due to duct leakage depends on the system and building configuration. In this study we primarily considered three scenarios.
1. Generic ducted system (no thermal energy loss to duct leakage) A baseline case that considers fan energy penalties only in all duct systems
2. Supply ducts located within ceiling return plenums A common scenario thought to have additional energy penalties due to thermal losses
3. Depressurized exhaust systems located in conditioned space A scenario thought to have additional energy penalties due to thermal losses and a higher likelihood for higher duct leakage due to lack of sealing specification.
For supply systems within ceiling return plenums, air that has been conditioned (heated or cooled) leaks directly into the return plenum. A part of the return flow is exhausted as relief air and the energy to heat or cool it is lost. Make up air at some outside air fraction (OAF) is introduced and conditioned to replace this air. Heat recovery systems diminish the thermal loss of duct leakage (1-ηHR). These factors and the efficiency of the heating system factors into the thermal power lost due to duct leakage, expressed below in Btu/hr for heating and cooling respectively. The degree day method is used to aggregate the annual heating and cooling demand of the ventilation air, a fraction of which is lost through leakage air.
𝑬𝒉𝒆𝒂𝒕 [𝑩𝒕𝒖
𝒉𝒓] = 𝟏. 𝟎𝟖 ∗
𝑯𝑫𝑫
𝜼𝒉𝒆𝒂𝒕𝑶𝑨𝑭(𝟏 − 𝜼𝑯𝑹)𝑸𝒍𝒆𝒂𝒌𝒂𝒈𝒆
and
𝑬𝒄𝒐𝒐𝒍 [𝑩𝒕𝒖
𝒉𝒓] = 𝟏. 𝟎𝟖 ∗
𝑪𝑫𝑫
𝜼𝒄𝒐𝒐𝒍𝑶𝑨𝑭(𝟏 − 𝜼𝑯𝑹)𝑸𝒍𝒆𝒂𝒌𝒂𝒈𝒆
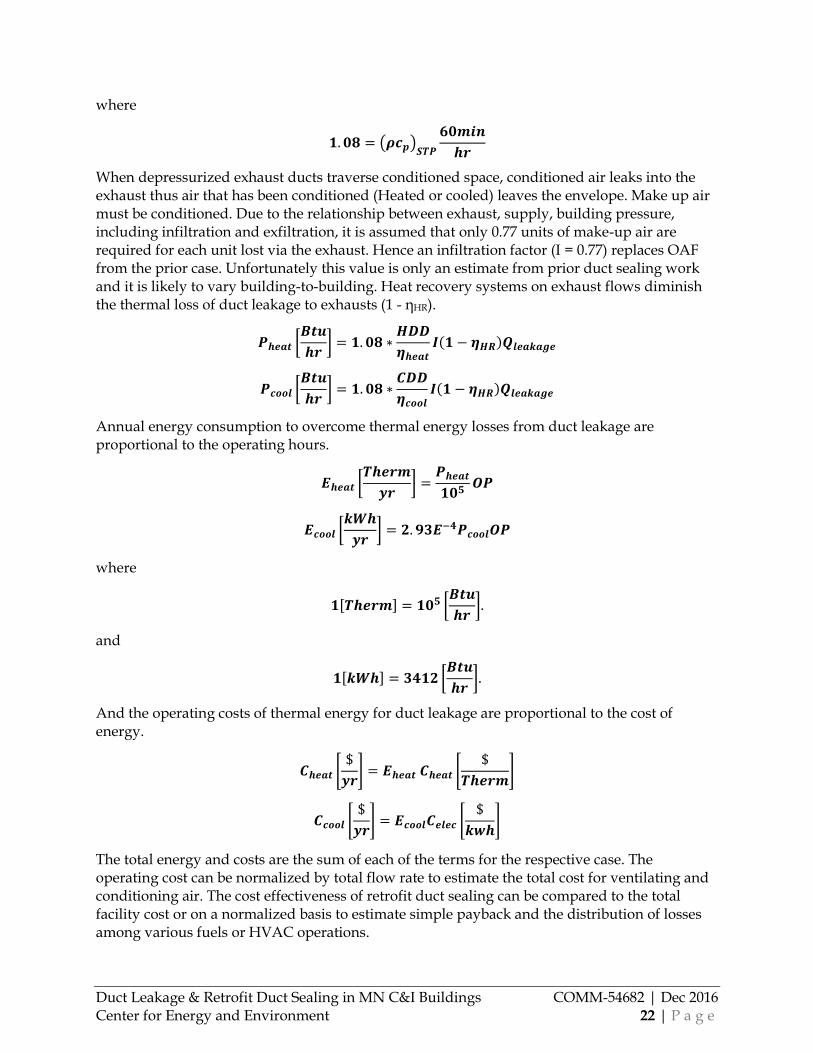
Duct Leakage & Retrofit Duct Sealing in MN C&I Buildings COMM-54682 | Dec 2016 Center for Energy and Environment 22 | P a g e
where
𝟏. 𝟎𝟖 = (𝝆𝒄𝒑)𝑺𝑻𝑷
𝟔𝟎𝒎𝒊𝒏
𝒉𝒓
When depressurized exhaust ducts traverse conditioned space, conditioned air leaks into the exhaust thus air that has been conditioned (Heated or cooled) leaves the envelope. Make up air must be conditioned. Due to the relationship between exhaust, supply, building pressure, including infiltration and exfiltration, it is assumed that only 0.77 units of make-up air are required for each unit lost via the exhaust. Hence an infiltration factor (I = 0.77) replaces OAF from the prior case. Unfortunately this value is only an estimate from prior duct sealing work and it is likely to vary building-to-building. Heat recovery systems on exhaust flows diminish the thermal loss of duct leakage to exhausts (1 - ηHR).
𝑷𝒉𝒆𝒂𝒕 [𝑩𝒕𝒖
𝒉𝒓] = 𝟏. 𝟎𝟖 ∗
𝑯𝑫𝑫
𝜼𝒉𝒆𝒂𝒕𝑰(𝟏 − 𝜼𝑯𝑹)𝑸𝒍𝒆𝒂𝒌𝒂𝒈𝒆
𝑷𝒄𝒐𝒐𝒍 [𝑩𝒕𝒖
𝒉𝒓] = 𝟏. 𝟎𝟖 ∗
𝑪𝑫𝑫
𝜼𝒄𝒐𝒐𝒍𝑰(𝟏 − 𝜼𝑯𝑹)𝑸𝒍𝒆𝒂𝒌𝒂𝒈𝒆
Annual energy consumption to overcome thermal energy losses from duct leakage are proportional to the operating hours.
𝑬𝒉𝒆𝒂𝒕 [𝑻𝒉𝒆𝒓𝒎
𝒚𝒓] =
𝑷𝒉𝒆𝒂𝒕
𝟏𝟎𝟓𝑶𝑷
𝑬𝒄𝒐𝒐𝒍 [𝒌𝑾𝒉
𝒚𝒓] = 𝟐. 𝟗𝟑𝑬−𝟒𝑷𝒄𝒐𝒐𝒍𝑶𝑷
where
𝟏[𝑻𝒉𝒆𝒓𝒎] = 𝟏𝟎𝟓 [𝑩𝒕𝒖
𝒉𝒓].
and
𝟏[𝒌𝑾𝒉] = 𝟑𝟒𝟏𝟐 [𝑩𝒕𝒖
𝒉𝒓].
And the operating costs of thermal energy for duct leakage are proportional to the cost of energy.
𝑪𝒉𝒆𝒂𝒕 [$
𝒚𝒓] = 𝑬𝒉𝒆𝒂𝒕 𝑪𝒉𝒆𝒂𝒕 [
$
𝑻𝒉𝒆𝒓𝒎]
𝑪𝒄𝒐𝒐𝒍 [$
𝒚𝒓] = 𝑬𝒄𝒐𝒐𝒍𝑪𝒆𝒍𝒆𝒄 [
$
𝒌𝒘𝒉]
The total energy and costs are the sum of each of the terms for the respective case. The operating cost can be normalized by total flow rate to estimate the total cost for ventilating and conditioning air. The cost effectiveness of retrofit duct sealing can be compared to the total facility cost or on a normalized basis to estimate simple payback and the distribution of losses among various fuels or HVAC operations.
Duct Leakage & Retrofit Duct Sealing in MN C&I Buildings COMM-54682 | Dec 2016 Center for Energy and Environment 23 | P a g e
Results
Commercial and Institutional Duct Characterization
The state of commercial and institutional duct design and construction in Minnesota was characterized in order to provide context and selection criteria for the 30 systems studied in detail. Two data sources, the design engineer survey and the industry interviews, described in the Methodology section, were used. The results allow ductwork design specifications to be compared and contrasted with field staff’s opinions. Due to the open-ended format of the surveys and interviews, quantitative analysis of the interview data is not possible. The analysis presents the two main perspectives on C&I ductwork in Minnesota as designed/specified and as installed/encountered. The results are organized into three categories:
1) system design, 2) duct sealing specifications, and 3) alternative ductwork constructions.
Due to the extensive nature of the survey data and interview responses, only the key findings are presented here. The reported averages are provided as representative responses, but are not weighted by project experience because of the relatively small number of respondents. In the discussion section the individual responses are weighted by the building floor area designed by each respondent to inform expectations of C&I building stock for selection purposes.
Air Distribution System Design Characteristics
Figure 11 shows estimates of the eight individual design engineers for percentage of floor area they designed with four types of supply systems: those that have (a) ductwork above the ceiling, (b) exposed ducts, (c) no ducts, and (d) under floor air distribution. Supply ducts are located above the ceiling in 55% to 80% of the designed floor area (average 70%). Exposed supply ducts are specified for 10% to 40% of the floor area with an average of 22%. Floor area with no ductwork or served by under floor air distribution are specified at an average of 7% and 2% of floor space, respectively. Two interviewees indicated that supply ducts are located above the ceiling 80% of the time.

Duct Leakage & Retrofit Duct Sealing in MN C&I Buildings COMM-54682 | Dec 2016 Center for Energy and Environment 24 | P a g e
Figure 11: Type of supply system design by floor area
Figure 12 shows the percentage of floor area served by (a) ceiling plenum return and (b) fully-ducted returns for floor area designed with supply ductwork located above the ceiling as reported by seven of the engineers. Ceiling return plenums are used for 40% to 95% of the designed floor area with an average of 64%, thus fully-ducted returns are found in a minority of all buildings.
Figure 12: Type of return system design by floor area (n = 7)
The field personnel that install, test, and inspect C&I air distribution systems (seven individuals representing ten interviews) responded similarly to the design engineers indicating that 80% (2), 60%, and 50% of projects use ceiling plenum returns compared to fully-ducted returns. Multiple interviewees suggested that project cost and ceiling restrictions are the predominant factors in the choice of return.
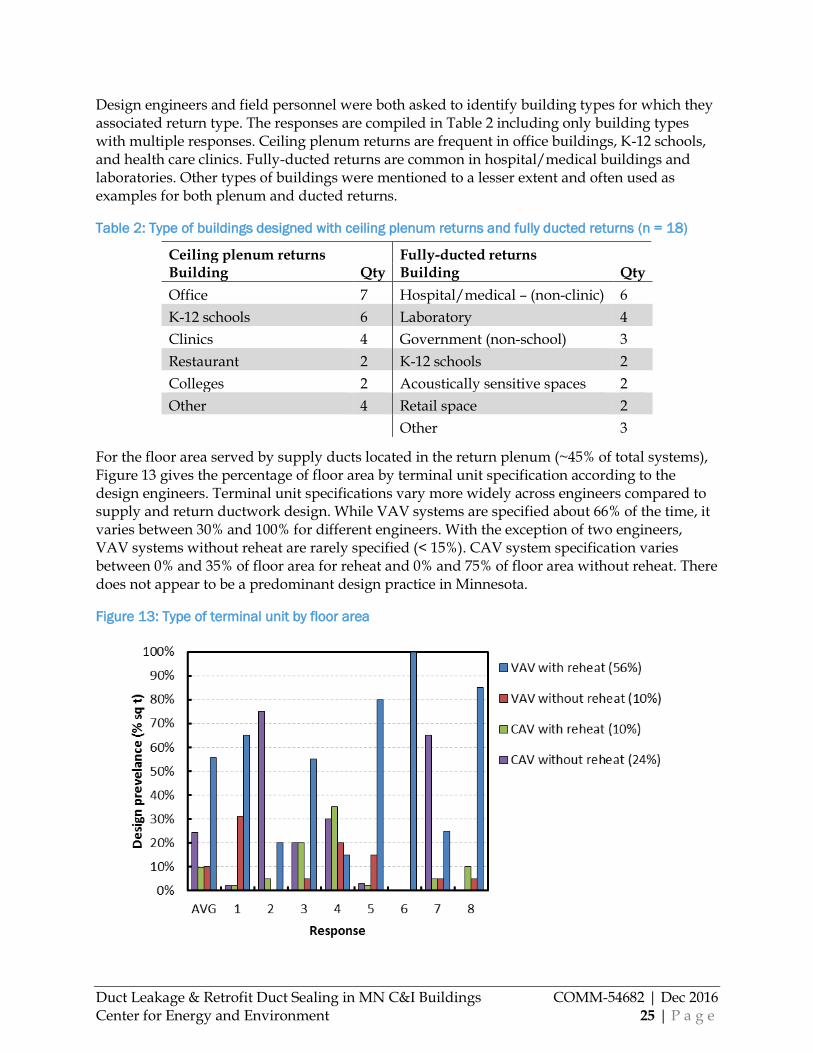
Duct Leakage & Retrofit Duct Sealing in MN C&I Buildings COMM-54682 | Dec 2016 Center for Energy and Environment 25 | P a g e
Design engineers and field personnel were both asked to identify building types for which they associated return type. The responses are compiled in Table 2 including only building types with multiple responses. Ceiling plenum returns are frequent in office buildings, K-12 schools, and health care clinics. Fully-ducted returns are common in hospital/medical buildings and laboratories. Other types of buildings were mentioned to a lesser extent and often used as examples for both plenum and ducted returns.
Table 2: Type of buildings designed with ceiling plenum returns and fully ducted returns (n = 18)
Ceiling plenum returns Fully-ducted returns Building Qty Building Qty
Office 7 Hospital/medical – (non-clinic) 6
K-12 schools 6 Laboratory 4
Clinics 4 Government (non-school) 3
Restaurant 2 K-12 schools 2
Colleges 2 Acoustically sensitive spaces 2
Other 4 Retail space 2
Other 3
For the floor area served by supply ducts located in the return plenum (~45% of total systems), Figure 13 gives the percentage of floor area by terminal unit specification according to the design engineers. Terminal unit specifications vary more widely across engineers compared to supply and return ductwork design. While VAV systems are specified about 66% of the time, it varies between 30% and 100% for different engineers. With the exception of two engineers, VAV systems without reheat are rarely specified (< 15%). CAV system specification varies between 0% and 35% of floor area for reheat and 0% and 75% of floor area without reheat. There does not appear to be a predominant design practice in Minnesota.
Figure 13: Type of terminal unit by floor area
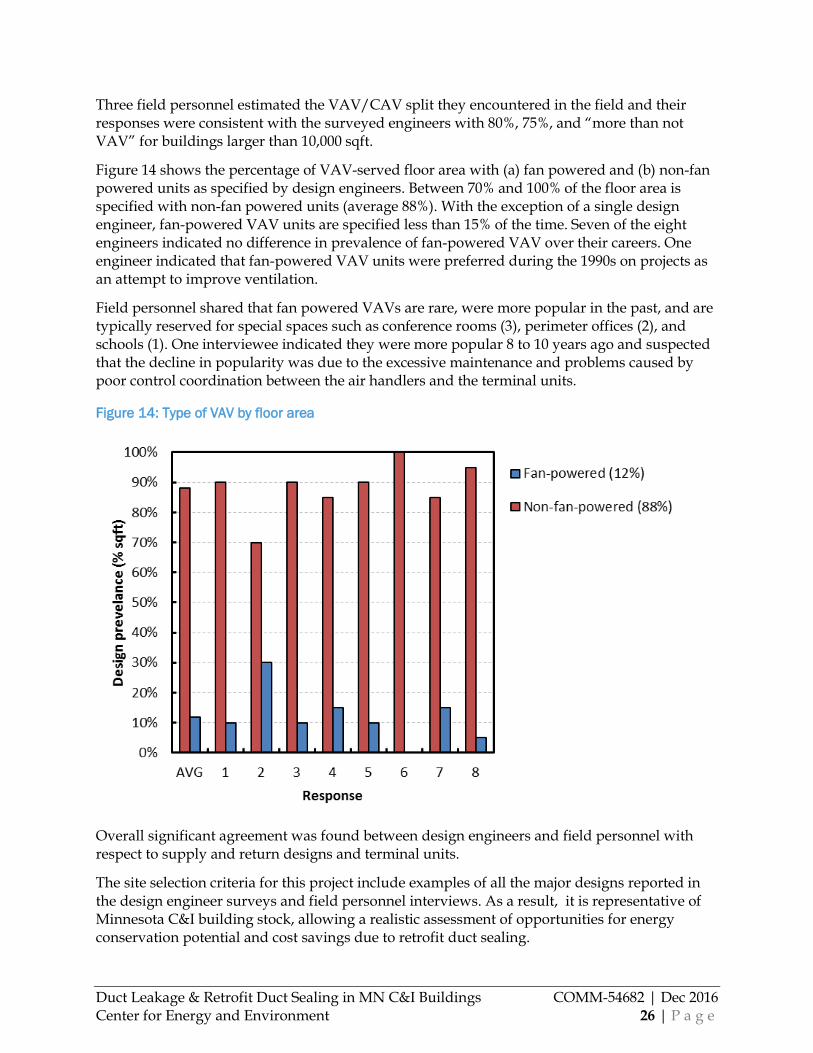
Duct Leakage & Retrofit Duct Sealing in MN C&I Buildings COMM-54682 | Dec 2016 Center for Energy and Environment 26 | P a g e
Three field personnel estimated the VAV/CAV split they encountered in the field and their responses were consistent with the surveyed engineers with 80%, 75%, and “more than not VAV” for buildings larger than 10,000 sqft.
Figure 14 shows the percentage of VAV-served floor area with (a) fan powered and (b) non-fan powered units as specified by design engineers. Between 70% and 100% of the floor area is specified with non-fan powered units (average 88%). With the exception of a single design engineer, fan-powered VAV units are specified less than 15% of the time. Seven of the eight engineers indicated no difference in prevalence of fan-powered VAV over their careers. One engineer indicated that fan-powered VAV units were preferred during the 1990s on projects as an attempt to improve ventilation.
Field personnel shared that fan powered VAVs are rare, were more popular in the past, and are typically reserved for special spaces such as conference rooms (3), perimeter offices (2), and schools (1). One interviewee indicated they were more popular 8 to 10 years ago and suspected that the decline in popularity was due to the excessive maintenance and problems caused by poor control coordination between the air handlers and the terminal units.
Figure 14: Type of VAV by floor area
Overall significant agreement was found between design engineers and field personnel with respect to supply and return designs and terminal units.
The site selection criteria for this project include examples of all the major designs reported in the design engineer surveys and field personnel interviews. As a result, it is representative of Minnesota C&I building stock, allowing a realistic assessment of opportunities for energy conservation potential and cost savings due to retrofit duct sealing.

Duct Leakage & Retrofit Duct Sealing in MN C&I Buildings COMM-54682 | Dec 2016 Center for Energy and Environment 27 | P a g e
Duct Leakage and Sealing Specification
Information on specifications for duct leakage and sealing practices was gathered from the survey and interviews and is summarized below.
Leakage
Figure 15 and Figure 16 show the opinions of design engineers on the leakage of equipment and accessories, respectively. Most engineers (88%+) think that leakage from VAV boxes and reheat coils are minor or not factors contributing to duct leakage. Opinions are split (50%) on whether air handlers are a minor or a major factor contributing to duct leakage. Although this was not directly asked, one balancer interviewed opined that leakage through VAV boxes is higher than specified by manufacturers (up to 3-5%). However, there are few or no reported measurements to confirm this claim. The American Society of Heating, Refrigerating, and Air-Conditioning Engineers' (ASHRAE) method of test to Determine Leakage Airflows and Fractional Leakage of Operating Air-Handling Systems (SPC 215) is currently under-review. Research is needed for further development of this standard, but it may eventually shed light on equipment leakage.
Figure 15: Contribution of equipment to leakage (n = 8)

Duct Leakage & Retrofit Duct Sealing in MN C&I Buildings COMM-54682 | Dec 2016 Center for Energy and Environment 28 | P a g e
Figure 16: Contribution of accessories to leakage (n = 8)
Engineers indicated that accessories and connections to diffusers contribute more to duct leakage than equipment. Sixty-three percent of engineers identified access doors and connections to outlets as major factors contributing to duct leakage. Balancing dampers are considered to be a moderate contributor to duct leakage; an equal number (38%) of engineers specified them as a major or a minor factor. Fire dampers were considered the accessory contributing the least to duct leakage, regarded as a minor factor by 75% of engineers.
In contrast to the engineers, those working with the equipment in the field stated that final connections are usually unsealed, but are tight and consist of auto-tensioned nylon ties that crimp flex ducts to the collar of the diffuser. They explained that sealing at the connection prevents (easy) removal of the diffuser. Furthermore a pressure drop so close to the diffuser outlet is negligible, subsequently resulting in negligible leakage. One interviewee expressed the opinion that leakage percentage metrics hold the contractors accountable for leaky equipment and accessories. This interviewee stated that research tasks that evaluated and quantified this accessory leakage would be well received by trade groups.
In summary these data indicate that engineers and field staff disagree on the leakiness of equipment and accessories. Field personnel generally think leakage from equipment and accessories is greater than engineers suggest.
Figure 17 shows design engineers’ opinions on the quality of code compliance in various Minnesota municipalities. Engineers feel that code compliance with respect to duct tightness is good less than 1/3 of the time, indicating a potential opportunity to better identify poorly sealed ducts prior to occupancy. Although the distinction is small, there is some opinion that code compliance is better in the Twin Cities and metro-area suburbs compared to smaller cities and outstate Minnesota. Field personal were generally in agreement with these findings, but drew a stronger distinction between the Twin Cities and outstate Minnesota. They indicated that mechanical inspectors were more thorough in larger cities such as Minneapolis, St. Paul, and Bloomington and that in general inspections deteriorate as one moves into smaller

Duct Leakage & Retrofit Duct Sealing in MN C&I Buildings COMM-54682 | Dec 2016 Center for Energy and Environment 29 | P a g e
municipalities. Field personal indicated that in the larger cities mechanical inspectors are typically trade specific and have experience as sheet metal workers. By contrast, smaller cities typically have a single inspector for everything and these inspectors “can’t know everything.” For example, trade-specific inspectors are better at catching sealing errors on supply ducts operating at low pressure whereas non trade-specific inspectors miss these types of details in favor of other issues. A similar opinion was offered with respect to mechanical contractors in the metro area versus outstate Minnesota. Further investigation into code compliance, including duct leakage and sealing specifications is currently underway as part of CARD Grant #87858 “Commercial Energy Code Compliance Enhancement Pilot.”
Figure 17: Estimates of code compliance with state code requirements for duct sealing (n = 8)
All of the engineers indicated that certain projects have more stringent sealing requirements than others. These building types are given in Table 3. In addition to the buildings where the sealing standards are driven by health and safety considerations (laboratories and others with hazardous material exhaust), one interviewee said that buildings using federal guidelines require tight balancing requirements (±5%) and leakage testing on both high and low pressure sides. State and federal projects require independent balancers and are usually specified by the larger plan/spec. engineering firms. However, most office spaces, multi-family buildings, and design/build projects do not require an independent balancer. It was also shared that many mechanical contractors will do uncertified in-house balancing, which can lead to reduced quality.

Duct Leakage & Retrofit Duct Sealing in MN C&I Buildings COMM-54682 | Dec 2016 Center for Energy and Environment 30 | P a g e
Table 3: Building types where sealing specifications are more stringent than regular specifications (n
= 8)
Building Qty
Ductwork conveying chemicals / Pharmaceutical exhaust / Industrial manufacturing
3
Institutional / government / schools 3
High pressure ductwork 2
Laboratories 2
Clean room 1
High rise vertical risers 1
Hospitals 1
Medium pressure ductwork 1
Pressurized building enclosures 1
Under floor air distribution 1
Sealing Specifications
Figure 18 shows engineers’ sealing specifications for projects with supply ducts located above the ceiling. The options include none, transverse joints only, transverse joints and longitudinal seams, and transverse joints, longitudinal seams, and duct wall penetrations. Supply duct sealing specifications vary widely among design engineers. All engineers specify, as a minimum, sealing at transverse joints for supply ducts upstream of terminal units. A total of 63% specify sealing for transverse joints and longitudinal seams on all supply ducts and 38% specify sealing on transverse joints, longitudinal seams, and duct wall penetrations for all supply ducts.
Low pressure supply ducts (downstream of both VAV boxes and CAV reheat coils) are subject to fewer sealing specifications and half of the design engineers specify sealing transverse joints only or no sealing at all. One engineer specifies sealing all ducts and makes no distinction between the supply and return side; they specify sealing everything except spiral and flex duct. Half of the engineers indicated that sealing specifications have changed over time. These respondents all indicated that their in-house specifications were recently updated (early 2000s, 2005, 2006, and 2007).
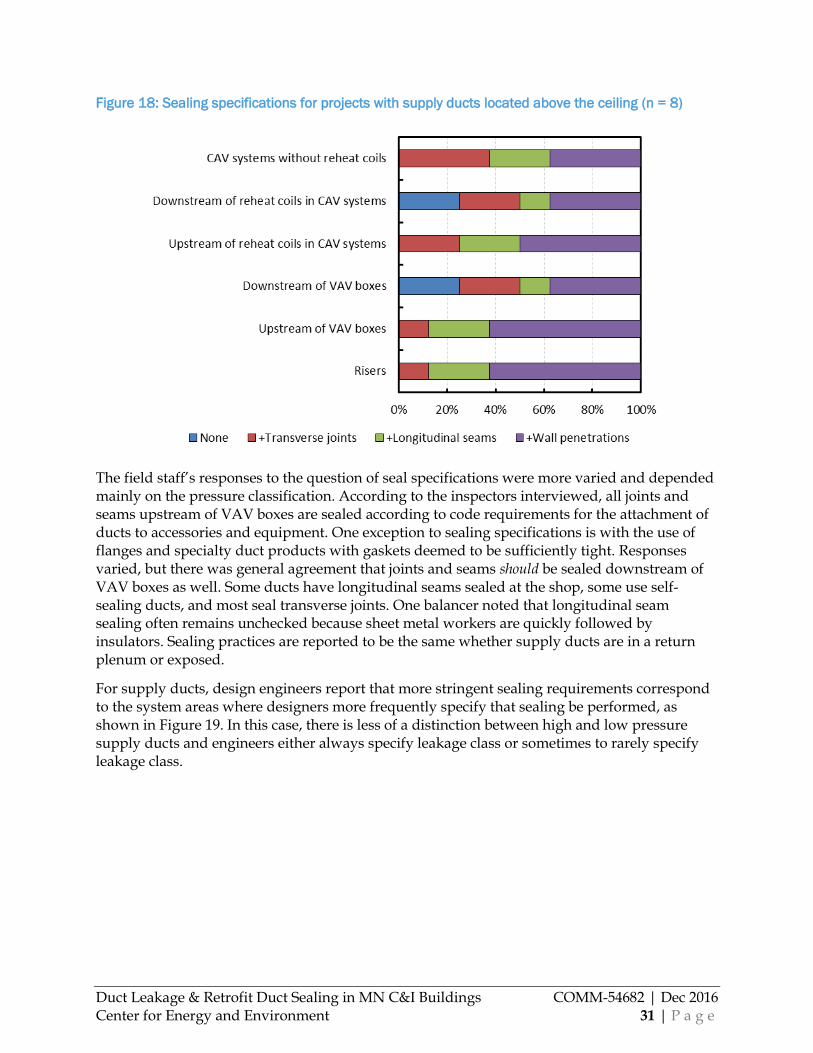
Duct Leakage & Retrofit Duct Sealing in MN C&I Buildings COMM-54682 | Dec 2016 Center for Energy and Environment 31 | P a g e
Figure 18: Sealing specifications for projects with supply ducts located above the ceiling (n = 8)
The field staff’s responses to the question of seal specifications were more varied and depended mainly on the pressure classification. According to the inspectors interviewed, all joints and seams upstream of VAV boxes are sealed according to code requirements for the attachment of ducts to accessories and equipment. One exception to sealing specifications is with the use of flanges and specialty duct products with gaskets deemed to be sufficiently tight. Responses varied, but there was general agreement that joints and seams should be sealed downstream of VAV boxes as well. Some ducts have longitudinal seams sealed at the shop, some use self-sealing ducts, and most seal transverse joints. One balancer noted that longitudinal seam sealing often remains unchecked because sheet metal workers are quickly followed by insulators. Sealing practices are reported to be the same whether supply ducts are in a return plenum or exposed.
For supply ducts, design engineers report that more stringent sealing requirements correspond to the system areas where designers more frequently specify that sealing be performed, as shown in Figure 19. In this case, there is less of a distinction between high and low pressure supply ducts and engineers either always specify leakage class or sometimes to rarely specify leakage class.

Duct Leakage & Retrofit Duct Sealing in MN C&I Buildings COMM-54682 | Dec 2016 Center for Energy and Environment 32 | P a g e
Figure 19: Specification of supply duct leakage class on supply ducts (n = 8)
According to engineers, sealing specifications on return and exhaust ducts (Figure 20) vary more compared to supply ducts. Design engineer specifications vary between no sealing for risers and branches and runouts to full sealing (transverse joints, longitudinal seams, and wall penetrations). Sealing transverse joints on return risers is specified by 75% of engineers while sealing longitudinal seams is only specified by 38% of engineers. Sealing transverse joints on return branches and runouts is specified by 63% of engineers, but sealing longitudinal seams is rarely specified, only by 13% of engineers. Sealing wall penetrations on return risers is specified by 38% of engineers and sealing wall penetrations on return branches and runouts is specified by 25% of engineers. For exhaust risers, branches and runouts, transverse joint sealing is specified by 75% of engineers and longitudinal seam sealing is specified by 50% of engineers. Wall penetration sealing is specified by 13% of engineers for exhaust branches and runouts and by 25% of engineers for exhaust risers. To emphasize the high level of variability we found in design practice, an equal number, about 25%, of engineers specify sealing all return and exhaust ducts or no sealing. The remaining engineers (half of the eight surveyed) recommend sealing some, but not all ducts.
Leakage class specification4 for returns and exhausts is shown in Figure 21. Leakage class is rarely or never specified for return and exhaust risers, branches and runouts by between 38% and 62% of engineers. Twenty-five percent of engineers sometimes specify leakage class for risers, branches and runouts with the exception of return risers (13%). Thirty-eight percent of
4 Leakage classification specifies acceptable leakage rates per duct surface area according to duct static pressure level. The Sheet Metal and Air Conditioning National Association (SMACNA) and the National Environmental Balancing Bureau (NEBB) recommend the use of leakage class for specifying allowable leakage in ducts.
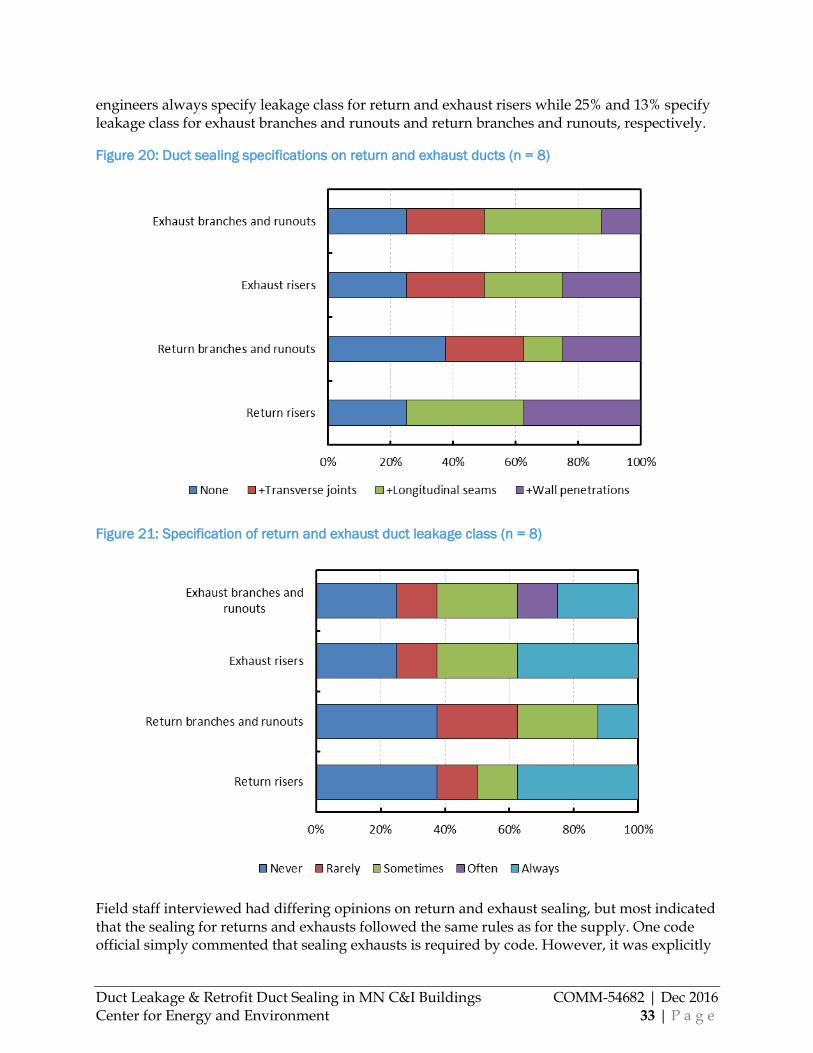
Duct Leakage & Retrofit Duct Sealing in MN C&I Buildings COMM-54682 | Dec 2016 Center for Energy and Environment 33 | P a g e
engineers always specify leakage class for return and exhaust risers while 25% and 13% specify leakage class for exhaust branches and runouts and return branches and runouts, respectively.
Figure 20: Duct sealing specifications on return and exhaust ducts (n = 8)
Figure 21: Specification of return and exhaust duct leakage class (n = 8)
Field staff interviewed had differing opinions on return and exhaust sealing, but most indicated that the sealing for returns and exhausts followed the same rules as for the supply. One code official simply commented that sealing exhausts is required by code. However, it was explicitly

Duct Leakage & Retrofit Duct Sealing in MN C&I Buildings COMM-54682 | Dec 2016 Center for Energy and Environment 34 | P a g e
noted that sealing returns is less important due to low pressure and that the industry believes sealing supplies is more important than returns or exhausts.
One inspector noted the intent of the code would apply sealing requirements to ceiling plenum returns, but it is unenforceable due to lack of resources and jurisdictional issues between building and mechanical inspectors. He stated that compliance relies entirely on the commissioning agent or balancer. Over the last 10-15 years a “fair attempt” has been made to seal ceiling return plenums, but prior to that there was little integrity between spaces. CMU and gypsum board exhaust risers are often unsealed because it is not the responsibility of the sheet metal contractors to seal. Sheet metal lined passageways may not be much better due to the difficulty of sealing.
Alternative Air Distribution System Designs
Survey results indicate that alternative air distribution system designs, including gypsum board, fiberglass, as well as above and below grade CMU or concrete air passageways, are rarely specified by design engineers (Figure 22). Specific instances of these alternative ductwork specifications are given in Table 4.
Figure 22: Specification of alternative ductwork (n = 8)

Duct Leakage & Retrofit Duct Sealing in MN C&I Buildings COMM-54682 | Dec 2016 Center for Energy and Environment 35 | P a g e
Table 4: Unique circumstances where alternative air distribution system designs are specified (n = 8)
Circumstances
Gypsum board air shafts
Hotel toilet room exhaust shafts
Only encountered on remodels in pre1990 buildings
Once for a return/exhaust plenum in the early 1980s and leakage was considerable, problems developed, never did it again.
Commonly used for corridor return shafts in multi-family housing to save money
Traditional office building design and aesthetically challenging spaces
Lagging ductwork for sound and fire rating
CMU passageways (above grade)
Displacement ventilation plenums in performing arts center
Only encountered on remodels on large 4+ story pre1980s institutional buildings
Outside air intakes and return/exhaust risers, rarely for supply
CMU passageways (below grade)
Displacement ventilation plenums for performing arts centers
Only encountered on remodels on large 4+ story pre1980s institutional buildings
Older schools undergoing retrofits
Outside air intakes and return/exhaust risers, rarely for supply
Churches (2)
A performing arts center on grade
Fiberglass ducts
Design/build product and would never recommend or specify
Fiberglass ductwork has never been allowed
Only when required by a specific exhaust gas
Only a few projects, have replaced with sheet metal on remodel projects
Below grade ductwork
Remodels generally require removal and replacement with new sheet metal
Large public lobbies

Duct Leakage & Retrofit Duct Sealing in MN C&I Buildings COMM-54682 | Dec 2016 Center for Energy and Environment 36 | P a g e
Seventy-five percent of the engineers have either rarely or never specified above grade concrete air passageways. Below grade CMU passageway specification is also infrequent; 75% of the engineers specified it rarely or never. Fiberglass ducts appear to be the least common ducts, specified “rarely” by 38% of engineers and “never” by 62% of engineers. Circumstances for which engineers recalled specifying alternative duct constructions are given in Table 4. Field personnel indicated gypsum board air shafts are rarely encountered in the field and are mainly found in hotels and multi-family buildings. They indicated that fiberglass ducts have declined in use due to indoor air quality concerns; for example, they have been removed from schools due to the presence of glass fibers.
System Design Characteristics
The comments from both the engineers and field personnel yielded useful data on air distribution system characteristics of C&I buildings in Minnesota. The survey results gave equal weight to each designer’s responses regardless of the extent of their experience. To estimate the characteristics of Minnesota C&I building stock, these responses are weighted both by the designer’s total designed floor area and by building type. The results, normalized against the total reported floor area, are shown in Table 5 in the column labeled “Weighted by designed area and building type.” Results in Table 5 only focus on supply ducts that are located above the ceiling since it is the most prevalent supply type in Minnesota, and by extension, the ceiling plenum return system within that category.
Table 5: Prevalence of air distribution system characteristics weighted and unweighted according to
designed floor area (n = 8)
Type Unweighted Weighted by designed area and building type
Extrapolated prevalence in MN
Supply ducts above ceiling 70% 72% 72%
Ceiling plenum return 64% 59% 43%
VAV with reheat 56% 42% 18%
VAV without reheat 10% 8% 3%
CAV with reheat 10% 16% 7%
CAV without reheat 24% 34% 14%
Overall, there is little difference between the weighted and unweighted results. The proportion of floor space with above-ceiling supply ducts, exposed supply ducts, and alternative distribution systems remains relatively unchanged with the weighting (i.e. 70% unweighted and 72% weighted). The prevalence of ceiling plenum returns compared to fully-ducted returns decreases by only 5% (i.e. 64% to 59%) when weighted by designed floor area. However, even though VAV systems with reheat remain the most common system, they are no longer a majority based on the designed areas (i.e. 56% to 42%). Additionally, the combined proportion of CAV systems (with and without reheat) compared to VAV systems increases from about one third of systems (34%) to half of all systems (50%) with supply ducts located in the ceiling plenum. The relatively good agreement between the weighted and unweighted estimates suggests a reasonably representative sample of design engineers.
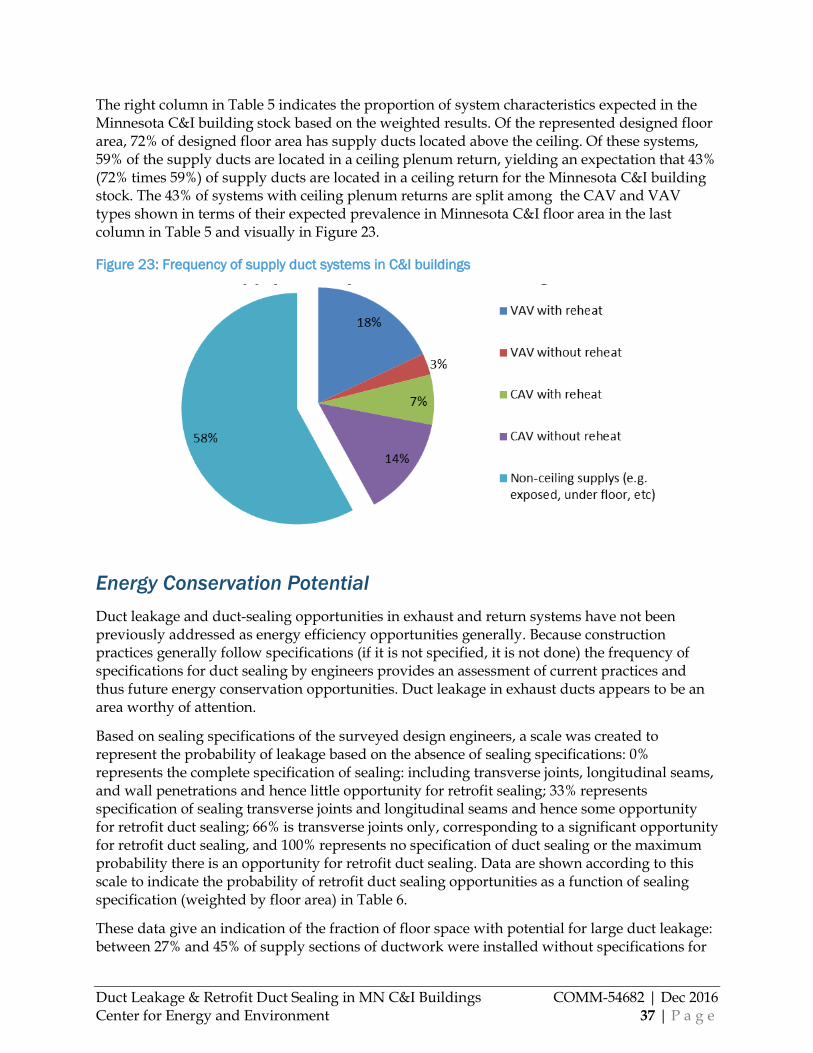
Duct Leakage & Retrofit Duct Sealing in MN C&I Buildings COMM-54682 | Dec 2016 Center for Energy and Environment 37 | P a g e
The right column in Table 5 indicates the proportion of system characteristics expected in the Minnesota C&I building stock based on the weighted results. Of the represented designed floor area, 72% of designed floor area has supply ducts located above the ceiling. Of these systems, 59% of the supply ducts are located in a ceiling plenum return, yielding an expectation that 43% (72% times 59%) of supply ducts are located in a ceiling return for the Minnesota C&I building stock. The 43% of systems with ceiling plenum returns are split among the CAV and VAV types shown in terms of their expected prevalence in Minnesota C&I floor area in the last column in Table 5 and visually in Figure 23.
Figure 23: Frequency of supply duct systems in C&I buildings
Energy Conservation Potential
Duct leakage and duct-sealing opportunities in exhaust and return systems have not been previously addressed as energy efficiency opportunities generally. Because construction practices generally follow specifications (if it is not specified, it is not done) the frequency of specifications for duct sealing by engineers provides an assessment of current practices and thus future energy conservation opportunities. Duct leakage in exhaust ducts appears to be an area worthy of attention.
Based on sealing specifications of the surveyed design engineers, a scale was created to represent the probability of leakage based on the absence of sealing specifications: 0% represents the complete specification of sealing: including transverse joints, longitudinal seams, and wall penetrations and hence little opportunity for retrofit sealing; 33% represents specification of sealing transverse joints and longitudinal seams and hence some opportunity for retrofit duct sealing; 66% is transverse joints only, corresponding to a significant opportunity for retrofit duct sealing, and 100% represents no specification of duct sealing or the maximum probability there is an opportunity for retrofit duct sealing. Data are shown according to this scale to indicate the probability of retrofit duct sealing opportunities as a function of sealing specification (weighted by floor area) in Table 6.
These data give an indication of the fraction of floor space with potential for large duct leakage: between 27% and 45% of supply sections of ductwork were installed without specifications for

Duct Leakage & Retrofit Duct Sealing in MN C&I Buildings COMM-54682 | Dec 2016 Center for Energy and Environment 38 | P a g e
sealing. More importantly this estimate suggests that a majority of exhaust ducts (79% - 80%) may not be sealed, indicating a higher potential for duct leakage. However, leakage is a function of unsealed area and pressure. Pressures are lower downstream than upstream which may offset some of the savings potential.
Table 6: Estimate of the leakage potential due to the absence of sealing specification by engineers
in Minnesota C&I building stock weighted by designed floor area
Supply Leakage probability
Corresponding sealing specification
Risers 27% Longitudinal seams - Wall
penetrations
Upstream of VAV boxes 27% Longitudinal seams - Wall
penetrations
Downstream of VAV boxes 45% Transverse joints - Longitudinal
seams Upstream of reheat coils (CAV) 34% Longitudinal seams
Downstream of reheat coils (CAV)
45% Transverse joints - Longitudinal
seams Ducts with no reheat coils
(CAV) 34% Longitudinal seams
Return
Risers 51% Transverse joints - Longitudinal
seams
Branches and runouts 54% Transverse joints - Longitudinal
seams
Exhaust
Risers 79% None - Transverse joints Branches and runouts 80% None - Transverse joints
The design engineer’s survey results were compared to the estimates of energy conservation potential in the literature. Based on the survey data, the incidence of supply ducts located within a ceiling return plenum (43%) is lower than expected (70% - 95%) from reports in the literature. The difference is due to increased use of exposed supply ducts (19%), fully-ducted returns (30%) and un-ducted or under floor distribution (10%) in Minnesota buildings. However, the observations of field personnel are close to those expected from the literature (average 68% ceiling return plenums). One possible explanation for the difference is that exposed supply ducts are currently a popular design approach and the designer’s responses could be skewed by recent experience. In addition, the average floor space per project of the sampled engineers (37,261 sqft) is slightly smaller than that estimated for Minnesota C&I building stock (43,517 sqft). This indicates a weighting toward smaller building sizes, which may result in underestimating energy conservation potential from this data.
Overall the data indicate a lower than estimated incidence of ceiling-plenum returns (which are a duct type with a high potential for savings); they also indicate increased opportunities for retrofit sealing of terminal units and point to return and exhaust ducts as a potential site of energy wasting leakage.
Duct Leakage & Retrofit Duct Sealing in MN C&I Buildings COMM-54682 | Dec 2016 Center for Energy and Environment 39 | P a g e
Qualitative Observations on Ductwork Design and Specification
The compilation of engineer survey and interview response comments lead to the following general observations:
1) Air distribution system specifications are important. Neglected or ambiguous system specifications (e.g. sealing/testing requirements and leakage class) may result in lower duct quality and lack of code compliance due to:
a) Unfamiliarity with SMACNA standards (e.g. no license requirement) may result in unskilled labor performing duct sealing imperfectly,
b) A lack of specifications means that design decisions are made by workmen on the job with no oversight and an inadequate skill base,
c) A lack of specifications may subject design decisions to time and budget pressure during installation because it has not been included in the materials or schedule, and
d) Ambiguity in specifications that may result in the “minimum work to get the job done.”
2) Duct leakage is mainly considered in terms of HVAC performance and not energy efficiency: if adequate air flow reaches the space the system “passes” even if this requires excessive fan energy or some of the conditioned air never reaches the occupied space.
3) Exhaust and return duct sealing specifications and testing requirements are a lower priority than for supply ducts; thus they are subject to less attention by design engineers and contractors and receive less scrutiny by inspectors compared to supply ducts.
4) Low pressure supply duct sealing specifications and testing requirements are subject to less attention by design engineers and contractors and receive less scrutiny by inspectors compared to high pressure supply ducts because leaks are harder to detect and may not prevent the system from maintaining the necessary working pressure.
5) Alternative air distribution passageways are subject to higher potential leakage due to:
a) Jurisdictional conflicts between building inspectors and mechanical inspectors,
b) Functional conflicts between sheet metal contractors and other contractors (e.g. masons or general contractors), and
c) The high permeability of concrete and gypsum compared to sheet metal.
6) It is difficult to identify leakage below 10% from standard testing and balancing due to:
a) Compound error on normal test equipment of 8% to 10%,
b) ±10% balance is considered acceptable by balancers, contractors, and building owners, and
c) Resheaving to increase flow is common and easier than leakage identification and correction (and the energy penalty is not considered)
7) The quality of inspections and mechanical contractors is roughly proportional to city size due to:
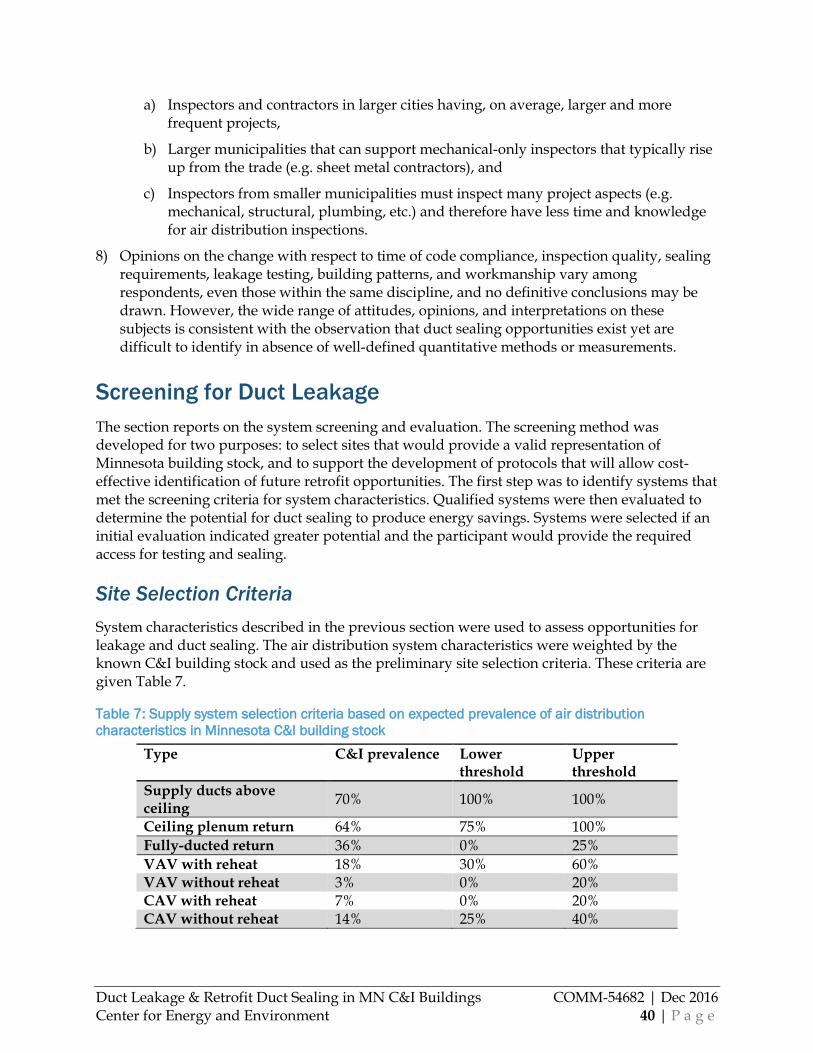
Duct Leakage & Retrofit Duct Sealing in MN C&I Buildings COMM-54682 | Dec 2016 Center for Energy and Environment 40 | P a g e
a) Inspectors and contractors in larger cities having, on average, larger and more frequent projects,
b) Larger municipalities that can support mechanical-only inspectors that typically rise up from the trade (e.g. sheet metal contractors), and
c) Inspectors from smaller municipalities must inspect many project aspects (e.g. mechanical, structural, plumbing, etc.) and therefore have less time and knowledge for air distribution inspections.
8) Opinions on the change with respect to time of code compliance, inspection quality, sealing requirements, leakage testing, building patterns, and workmanship vary among respondents, even those within the same discipline, and no definitive conclusions may be drawn. However, the wide range of attitudes, opinions, and interpretations on these subjects is consistent with the observation that duct sealing opportunities exist yet are difficult to identify in absence of well-defined quantitative methods or measurements.
Screening for Duct Leakage
The section reports on the system screening and evaluation. The screening method was developed for two purposes: to select sites that would provide a valid representation of Minnesota building stock, and to support the development of protocols that will allow cost-effective identification of future retrofit opportunities. The first step was to identify systems that met the screening criteria for system characteristics. Qualified systems were then evaluated to determine the potential for duct sealing to produce energy savings. Systems were selected if an initial evaluation indicated greater potential and the participant would provide the required access for testing and sealing.
Site Selection Criteria
System characteristics described in the previous section were used to assess opportunities for leakage and duct sealing. The air distribution system characteristics were weighted by the known C&I building stock and used as the preliminary site selection criteria. These criteria are given Table 7.
Table 7: Supply system selection criteria based on expected prevalence of air distribution
characteristics in Minnesota C&I building stock
Type C&I prevalence Lower threshold
Upper threshold
Supply ducts above ceiling
70% 100% 100%
Ceiling plenum return 64% 75% 100%
Fully-ducted return 36% 0% 25%
VAV with reheat 18% 30% 60% VAV without reheat 3% 0% 20% CAV with reheat 7% 0% 20% CAV without reheat 14% 25% 40%

Duct Leakage & Retrofit Duct Sealing in MN C&I Buildings COMM-54682 | Dec 2016 Center for Energy and Environment 41 | P a g e
Based on prevalence and potential savings considerations, the study focused on supply ducts located above the ceiling. Lower and upper thresholds were established to ensure a sufficiently representative sample of buildings.
Supply ducts
Supply ducts located above the ceiling were consistently estimated to be the most common and most likely to need sealing. They are estimated to be present in between 66% and 80% of all buildings and therefore form the bulk of included sites. Supply ducts located in the ceiling plenum were initially favored over fully-ducted returns due to the added thermal savings potential. Their high savings potential is due to leakage into unconditioned space or directly into return plenums. Exposed supply ducts present less of an opportunity for duct sealing because any leakage is going into the conditioned space; hence they were not included in this study.
Terminal units
A relatively equal distribution of VAV systems (30-60%) and CAV systems (25-40%) was included in the site selection criteria because both types of systems present savings potential.
Alternative air distribution systems
With the exception of gypsum board ducts, alternative duct constructions were not included in this study due to low estimated incidence in C&I buildings. Gypsum board systems were included do to a coincident study on multi-family exhaust systems (Bohac, 2016). In that work, traditional sealing methods proved inadequate and difficult to apply. Given this distinction and the observed realities of sealing these systems, they are described separately in the results.
Exhaust systems
While not initially a target, the lack of specification of sealing requirements by design engineers suggests an increased opportunity for duct leakage. Secondary to the ceiling supply systems, this study attempted to screen and characterize some representative exhaust systems.
Screened Systems
Interviews, surveys, and potential for savings opportunities from sealing duct leakage were considered in order to identify an initial population of 63 systems in 19 buildings. Thirty systems from nine buildings were selected from this set for continuation in the project. The selected systems were in buildings ranging in size from 27,000 to 900,000 sqft. The design flow rates of individual systems ranged from 120 to 28,215 cfm. The general characteristics of each system and site are outlined in Table 8, while detailed system characteristics are listed in Table 9. General characteristics of the multifamily buildings with gypsum board exhaust shafts, treated separately in this study, are given in Table 10.

Duct Leakage & Retrofit Duct Sealing in MN C&I Buildings COMM-54682 | Dec 2016 Center for Energy and Environment 42 | P a g e
Table 8: Buildings and general system criteria for systems selected for study
Site Code
Space Use Size (sqft)
System Code
System Type Flow Type
O1 Multi-story Office 525,000 S1 Supply with ceiling return VAV
K1 Recreation / Child care 27,000 S2 Supply with ceiling return CAV
K1 Recreation / Child care 27,000 S3 Supply with ceiling return CAV
K1 Recreation / Child care 27,000 S4 Supply with ceiling return CAV
O2 Mixed Office / Shop 603,000 S5 Supply with ceiling return VAV
O2 Mixed Office / Shop 603,000 S6 Supply with ceiling return VAV
H1 Higher Education / Clinic 125,000 S7 Supply with ceiling return VAV, CAV
H1 Higher Education / Clinic 125,000 S8 Supply with ceiling return VAV, CAV
H2 Higher Education Lab 900,000 S9 Exhaust CAV
H2 Higher Education Lab 900,000 S10 Exhaust CAV
H2 Higher Education Lab 900,000 S11 Exhaust CAV
O3 Multi-story Office 425,000 S12 Supply with ceiling return VAV
O3 Multi-story Office 425,000 S13 Supply with ceiling return VAV
O3 Multi-story Office 425,000 S14 Supply with ceiling return VAV
O3 Multi-story Office 425,000 S15 Supply with ceiling return VAV
O3 Multi-story Office 425,000 S16 Supply with ceiling return VAV
K2 Elementary School 54,000 S17 Supply with ceiling return CAV
K2 Elementary School 54,000 S18 Supply with ceiling return CAV
K2 Elementary School 54,000 S19 Supply with ceiling return CAV
K2 Elementary School 54,000 S20 Supply with ceiling return CAV
K2 Elementary School 54,000 S21 Supply with ceiling return CAV
K2 Elementary School 54,000 S22 Supply with ceiling return CAV
K2 Elementary School 54,000 S23 Supply with ceiling return CAV
K2 Elementary School 54,000 S24 Supply with ceiling return CAV
K2 Elementary School 54,000 S25 Supply with ceiling return CAV
K2 Elementary School 54,000 S26 Supply with ceiling return CAV
K2 Elementary School 54,000 S27 Supply with ceiling return CAV
M1 Multi-Family 296,408 S28 Exhaust CAV
M1 Multi-Family 296,408 S29 Exhaust CAV
M2 Multi-Family 96,540 S30 Exhaust CAV
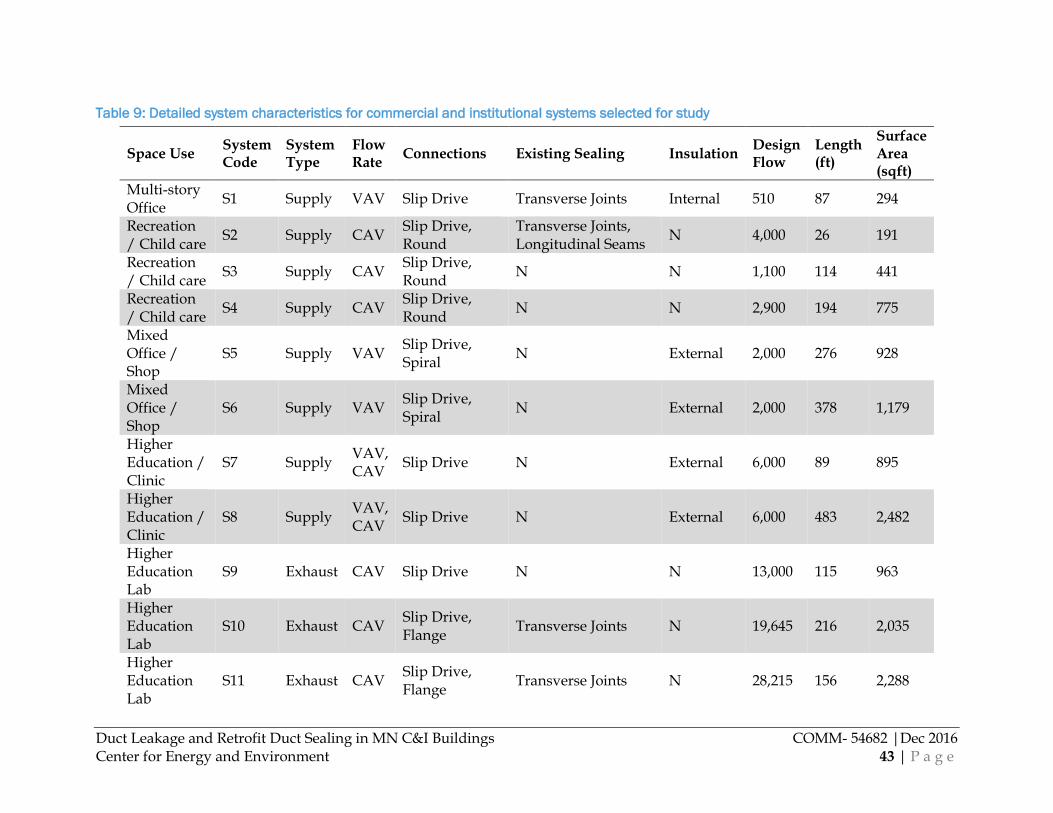
Duct Leakage and Retrofit Duct Sealing in MN C&I Buildings COMM- 54682 |Dec 2016 Center for Energy and Environment 43 | P a g e
Table 9: Detailed system characteristics for commercial and institutional systems selected for study
Space Use System Code
System Type
Flow Rate
Connections Existing Sealing Insulation Design Flow
Length (ft)
Surface Area (sqft)
Multi-story Office
S1 Supply VAV Slip Drive Transverse Joints Internal 510 87 294
Recreation / Child care
S2 Supply CAV Slip Drive, Round
Transverse Joints, Longitudinal Seams
N 4,000 26 191
Recreation / Child care
S3 Supply CAV Slip Drive, Round
N N 1,100 114 441
Recreation / Child care
S4 Supply CAV Slip Drive, Round
N N 2,900 194 775
Mixed Office / Shop
S5 Supply VAV Slip Drive, Spiral
N External 2,000 276 928
Mixed Office / Shop
S6 Supply VAV Slip Drive, Spiral
N External 2,000 378 1,179
Higher Education / Clinic
S7 Supply VAV, CAV
Slip Drive N External 6,000 89 895
Higher Education / Clinic
S8 Supply VAV, CAV
Slip Drive N External 6,000 483 2,482
Higher Education Lab
S9 Exhaust CAV Slip Drive N N 13,000 115 963
Higher Education Lab
S10 Exhaust CAV Slip Drive, Flange
Transverse Joints N 19,645 216 2,035
Higher Education Lab
S11 Exhaust CAV Slip Drive, Flange
Transverse Joints N 28,215 156 2,288

Duct Leakage and Retrofit Duct Sealing in MN C&I Buildings COMM- 54682 |Dec 2016 Center for Energy and Environment 44 | P a g e
Space Use System Code
System Type
Flow Rate
Connections Existing Sealing Insulation Design Flow
Length (ft)
Surface Area (sqft)
Multi-story Office
S12 Supply VAV Slip Drive Transverse Joints, Longitudinal Seams
External 1,800 124 949
Multi-story Office
S13 Supply VAV Slip Drive Transverse Joints, Longitudinal Seams
External 1,800 85 398
Multi-story Office
S14 Supply VAV Slip Drive Transverse Joints, Longitudinal Seams
External 2,500 122 930
Multi-story Office
S15 Supply VAV Slip Drive Transverse Joints, Longitudinal Seams
External 2,400 212 573
Multi-story Office
S16 Supply VAV Slip Drive Transverse Joints, Longitudinal Seams
External 2,300 173 1,070
Elementary School
S17 Supply CAV Slip Drive N External 8,995 178 1,656
Elementary School
S18 Supply CAV Slip Drive N External 10,530 220 2,985
Elementary School
S19 Supply CAV Slip Drive N External 4,525 194 524
Elementary School
S20 Supply CAV Slip Drive N External 4,070 186 748
Elementary School
S21 Supply CAV Slip Drive N External 4,765 189 694
Elementary School
S22 Supply CAV Slip Drive N External 4,765 192 533
Elementary School
S23 Supply CAV Slip Drive N External 23,395 249 2,060
Elementary School
S24 Supply CAV Slip Drive N External 4,900 120 809
Elementary School
S25 Supply CAV Slip Drive N External 5,140 198 822
Elementary School
S26 Supply CAV Slip Drive N External 2,840 110 350
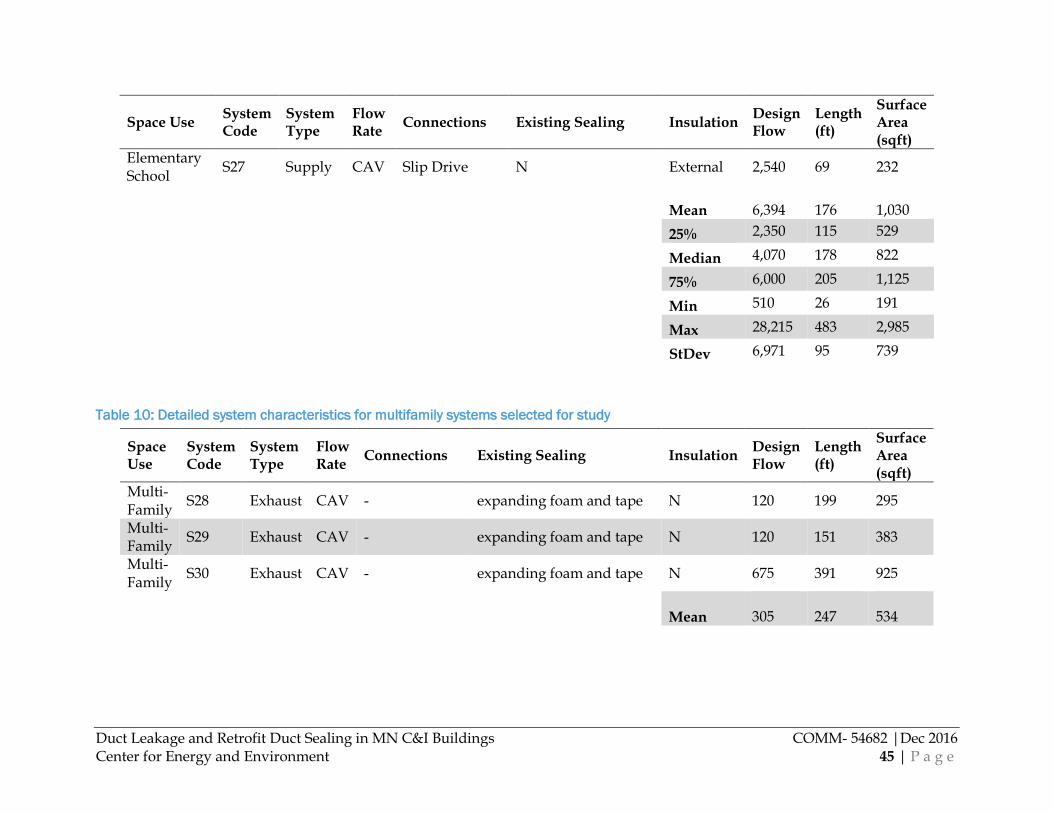
Duct Leakage and Retrofit Duct Sealing in MN C&I Buildings COMM- 54682 |Dec 2016 Center for Energy and Environment 45 | P a g e
Space Use System Code
System Type
Flow Rate
Connections Existing Sealing Insulation Design Flow
Length (ft)
Surface Area (sqft)
Elementary School
S27 Supply CAV Slip Drive N External 2,540 69 232
Mean 6,394 176 1,030
25% 2,350 115 529
Median 4,070 178 822
75% 6,000 205 1,125
Min 510 26 191
Max 28,215 483 2,985
StDev 6,971 95 739
Table 10: Detailed system characteristics for multifamily systems selected for study
Space Use
System Code
System Type
Flow Rate
Connections Existing Sealing Insulation Design Flow
Length (ft)
Surface Area (sqft)
Multi-Family
S28 Exhaust CAV - expanding foam and tape N 120 199 295
Multi-Family
S29 Exhaust CAV - expanding foam and tape N 120 151 383
Multi-Family
S30 Exhaust CAV - expanding foam and tape N 675 391 925
Mean 305 247 534

Duct Leakage & Retrofit Duct Sealing in MN C&I Buildings COMM-54682 | Dec 2016 Center for Energy and Environment 46 | P a g e
The 30 systems selected for this study were located in nine buildings and include the following spaces:
37% (11 systems in 1 building) were elementary school space,
20% (6 systems in 1 building) were multi-story office space,
10% (3 systems in 1 buildings) were higher education lab space,
10% (3 systems in 2 buildings) were multi-family housing, and
23% (7) were mixed use space. Of the mixed use space: o 10% (3 systems in 1 building) were recreation and child care, o 7% (2 systems in 2 buildings) were mixed office and shop space, and o 7% (2 systems in 1 building) were mixed higher education and clinic space.
While building use was not specifically used for site selection, retrofit duct leakage opportunities were expected in elementary school, clinic, and higher education spaces based on prior interviews and surveys.
The majority of the systems in this study (80% or 24) were systems where supply ducts ran through ceiling plenums serving as the air return path, while the remaining systems (20% or 6) were exhaust systems. The selection criteria were fulfilled in this respect; the initial goal focused on above ceiling supply systems with a high fraction of those having above ceiling return plenums. Fully ducted returns were identified, but infrequently encountered in this project and the few candidates were rejected for logistical reasons. The remaining exhaust systems (20%), matches the goal to explore the characterization from the engineer survey that exhaust may have duct leakage opportunities due to infrequent sealing specification. Systems with exposed ductwork were not included in this project due to the diminished potential energy savings expected from these systems.
Systems were categorized with respect to their location within the building ventilation system. This study consists of three ductwork locations, upstream supply, downstream supply, and exhaust systems. Upstream and downstream sections refer to ductwork that is upstream or downstream of a terminal unit (reheat coil or VAV box). Of the systems considered in the study, 43% (13) were within the downstream portion of the supply ductwork, 27% (8) were within the upstream portion of the supply ductwork, 13% (4) contained both upstream and downstream portions of the supply ductwork, 10% (3) were located exclusively within the riser portions of the exhaust ductwork, and 7% (2) were complete exhaust systems. This provided a relatively even split of upstream, downstream, and exhaust sections of systems. The inclusion of downstream sections is consistent with the expectation of low sealing specification, but tended to reduce the average flow rate of systems considered in this project.
The types of supply systems in this study were: 67% (20) constant volume (CAV) systems, 27% (8) variable volume systems (VAV), and 7% (2) shared attributes of both CAV and VAV systems, meaning that in these systems constant speed fans fed both reheat coils and VAV boxes. This was slightly more VAV systems than initially targeted for inclusion in the study. Prior to the systems screening, a split of approximately 60% VAV systems and 40% CAV systems was sought, although based on the findings from this study, these distinctions are not considered important with respect to duct leakage.
The CAV and VAV supply systems in this study all had reheat coils, meaning they have similar upstream and downstream characteristics. In other words, for duct leakage, the distinguishing

Duct Leakage & Retrofit Duct Sealing in MN C&I Buildings COMM-54682 | Dec 2016 Center for Energy and Environment 47 | P a g e
feature is not the variable damper, but the pressure drop across the reheat coil, which delineates the high pressure from the low pressure ductwork. Based on the information from designers it was expected that the CAV systems would not have reheat coils, but the CAV supply systems included in this study all had reheat coils. While it is possible that there would be different leakage attributes for CAV systems without coils and their commensurate pressure drop, the difference would likely have minor overall consequences.
Almost all (90% or 27) of the systems studied were of sheet metal construction and the remaining 10% (3) were of gypsum board construction. The gypsum board ductwork was exclusive to multi-family general exhaust systems. The sheet metal ductwork included 67% (20) slip/drive construction, 10% (3) combined slip/drive and round construction, 7% (2) combined of slip/drive and spiral construction, and 7% (2) combined slip/drive and flanged (duct mate) construction. Originally the focus was to study sheet metal duct construction of varying types and one example of gypsum board construction. The three small gypsum board exhaust systems were included due to challenges encountered in their sealing in (Bohac, 2016).
Preliminary data from the screening process did not provide an indication of the frequency of the types of sheet metal construction methods expected in practice. Slip/drive construction dominated in the selected buildings. Most systems with a preponderance of spiral ductwork were rejected during screening due to expectations of low leakage.
Many of the selected systems were insulated to some degree, despite being entirely within the building thermal envelope. Of these systems, 67% (20) were insulated with external insulation, 3% (1) was insulated with internal insulation, and 30% (9) were uninsulated, including all exhaust systems. In terms of existing duct sealing among selected systems with sheet metal construction, 60% (18) systems were completely unsealed, 10% (3) were sealed only at transverse joints, 20% (6) and were sealed at both transverse joints and longitudinal seams. The focus of this study was on systems without sealing or with significantly deteriorated sealing, where leakage was anticipated. The screening process rejected 14% (9) of (all 63 screened) systems due to preexisting sealing. The three multifamily exhausts were subject to recent external sealing measures comprised of tape and expanding foam.
The buildings and systems that participated in the study largely confirmed expectations of space use, system type, and flow rate. One notable exception was the unexpected preponderance of CAV systems with reheat coils; no CAV systems without reheat coils were encountered. Supply ducts located in return plenums and exhaust systems were selected because those were likely to have more opportunities for energy savings. Although the building sizes were relatively large, the individual systems in the study tended to have smaller flow rates than anticipated, consequently 30 systems were included in the testing as opposed to the original plan of only 10-20 systems. Of these, three systems (S5, S7, and S9) were discarded from the study, resulting in 27 presented measurements. Leakage measurements revealed that there were either very large concentrated leaks or undocumented branch connections in inaccessible portions of these sections. Systems incorporated in the study are thought to reasonably representative of systems in Minnesota for which duct leakage is an important issue and retrofit duct sealing might be considered.

Duct Leakage & Retrofit Duct Sealing in MN C&I Buildings COMM-54682 | Dec 2016 Center for Energy and Environment 48 | P a g e
Rejected Systems
Thirty three systems were rejected from the study. The building type, system type, and the reason for their rejection are provided in Table 11. There were four categories of approximately ten reasons for rejecting the systems:
48% were rejected because they were either thought to have exceptionally tight ductwork due to existing sealing or were of spiral or welded seam construction;
15% were rejected for logistical reasons based on study considerations such as similarity to other systems in the study (i.e. overlap) or inaccessibility (i.e. a closed ceiling);
29% were rejected due to logistical reasons outside the scope of the study such as ongoing construction and little available downtime, and
7% were rejected due to low savings expectations caused by exposed supply ductwork.
Table 11: Systems rejected from study during site screening
Site Code Bldg. Desc. System Desc. Reason for Rejection
H3 Higher Education Supply Spiral ductwork
H3 Higher Education Supply Exposed ductwork
H4 Higher Education Supply Exposed ductwork
H5 Higher Education Supply Exposed ductwork
H5 Higher Education Supply Sealed
H6 Higher Education Supply Sealed
C1 Health Care Supply Sealed
C1 Health Care Supply Sealed
C1 Health Care Supply Critical facility
C1 Health Care Supply Critical facility
C1 Health Care Supply Critical facility
C1 Health Care Supply Critical facility
O1 Multi-story Office Supply Sealed
O2 Multi-story Office Supply Sealed
O4 Lab Exhaust Spiral ductwork
O4 Lab Exhaust Spiral ductwork
O4 Lab Exhaust Spiral ductwork
O4 Lab Exhaust Spiral ductwork
O4 Lab Exhaust Welded ductwork
O4 Office / Lab Exhaust Welded ductwork
O4 Office / Lab Supply Sealed
O4 Office Supply Sealed
O4 Office Supply Sealed
O2 Office / Lab Supply Overlap
O2 Office / Lab Supply Overlap
O2 Office / Lab Supply Scheduled for replacement
O2 Office / Lab Supply Scheduled for replacement
O3 Office / Lab Supply Scheduled for replacement

Duct Leakage & Retrofit Duct Sealing in MN C&I Buildings COMM-54682 | Dec 2016 Center for Energy and Environment 49 | P a g e
Site Code Bldg. Desc. System Desc. Reason for Rejection
O4 Multi-story Office Supply Existing construction
O4 Multi-story Office Supply Existing construction
H2 Multi-story Office Supply Closed ceiling
I1 Library Supply Closed ceiling
I1 Library Supply Closed ceiling
Totals 48% Tight ductwork
15% Logistics (CEE)
29% Logistics (participant)
7% Low savings
Duct System Leakage Measurements
The duct leakage for typical operating conditions was measured and reported for 24 C&I and three multi-family systems for a total of 27 measurements. Leakage flow rates are reported at the operating pressure of each duct system. The pressurization method was used for 21 systems and the tracer gas technique was attempted on 18 of the systems. Table 12 shows the design flow rate, measured flow rate, operating pressure, duct leakage, leakage fraction, leakage per duct length, and leakage per duct surface area for each of the 24 C&I systems.
Unless otherwise noted, the leakage estimates presented are from pressurization tests and the flow rates presented are from tracer gas measurements. Design flow rates were used to calculate the leakage fraction when measured flow rates were unavailable. Four of the systems had leakage measurements that produced nonphysical leakage fractions (i.e. duct leakage was calculated to be less than zero), and these were rounded to zero for this project. All four of these leakage estimates are from the tracer gas method. Two are within the uncertainty limits of the equipment and errors on all four are likely due to inadequate mixing required for the tracer gas measurements. None of these four systems were sealed in this study; others at the site were also not pursued due to low measured leakage. The three multi-family exhaust systems were included as a work scope extension to investigate sealing of gypsum board ductwork. Since the duct construction and leakage characteristics are significantly different from the 24 C&I systems, the results for the multi-family systems are analyzed separately.
Duct leakage was measured for C&I duct systems with design flow rates between 510 cfm and 28,215 cfm (n=24). For these systems, the average flow rate is 6,318 cfm, the median flow rate is 4,035 cfm, and the standard deviation is 7,224 cfm. These measurements reflect leakage from a relatively large number of small systems contrasted by a smaller number of very large systems. The quartiles reveal this explicitly as over 75% of the systems have flow rates below the mean. Measured flow rates are similarly distributed, varying between 757 cfm and 22,200 cfm with an average of 5,511 cfm and a median of 2,829 cfm.

Duct Leakage & Retrofit Duct Sealing in MN C&I Buildings COMM-54682 | Dec 2016 Center for Energy and Environment 50 | P a g e
Table 12: Operating points and initial duct leakage
System Code
Design Flow
Measured Flow (cfm)
Operating Pressure
(Pa)
Duct Leakage
(cfm)
Leakage Fraction
(fL)
Leakage per
length (cfm/ft)
Leakage per area
(cfm/sqft)
S1 510 897 46 214 24% 2.47 0.75
S2 4,000 2,829 146 32 1% 1.25 0.13
S3 1,100 757 4 68 9% 0.60 0.50
S4 2,900 2,611 9 622 24% 3.21 0.92
S6 2,000 1,911 326 5501 29% 1.46 0.03
S8 6,000 6,165 127 985 16% 2.04 0.02
S10 19,645 16,745 -1804 183 1% 0.85 0.01
S11 28,215 22,200 485 1374 6% 8.81 0.02
S12 1,800 1,763 285 -71,3 0%3 0.00 0.00
S13 1,800 1,770 31 -2061,3 0%3 0.00 0.00
S14 2,500 2,493 247 1471 6% 1.20 0.02
S15 2,400 2,346 106 -1671,3 0%3 0.00 0.00
S16 2,300 2,277 264 -561,3 0%3 0.00 0.00
S17 8,995 10,750 172 438 4% 2.46 0.02
S18 10,530 10,041 125 755 8% 3.43 0.01
S19 4,525 4,975 120 272 5% 1.40 0.16
S20 4,070 5,192 130 177 3% 0.95 0.05
S21 4,765 4,414 37 158 4% 0.84 0.11
S22 4,765 4,575 38 358 8% 1.86 0.43
S23 23,395 - 163 1038 4% 4.17 0.03
S24 4,900 - 72 299 6% 2.49 0.10
S25 5,140 - 72 214 8% 1.08 0.07
S26 2,840 - 50 116 5% 1.05 0.27
S27 2,540 - 50 59 2% 0.85 0.31
Mean 6,318 5,511 137 336 7% 1.77 0.17
25% 2,375 2,094 44 66 2% 0.84 0.02
Median 4,035 2,829 1224 198 5% 1.23 0.04
75% 5,355 5,678 1654 466 8% 2.46 0.19
Min 510 757 44 0 0% 0.00 0.00
Max 28,215 22,200 4854 1,374 29% 8.81 0.92
StDev 7,224 5,704 1164 373 8% 1.87 0.25
1 Tracer gas estimate 2 Design flow used for leakage fraction 3 Non-physical leakage (negative fL) zeroed for statistics 4 Absolute values of operating pressure used in statistics
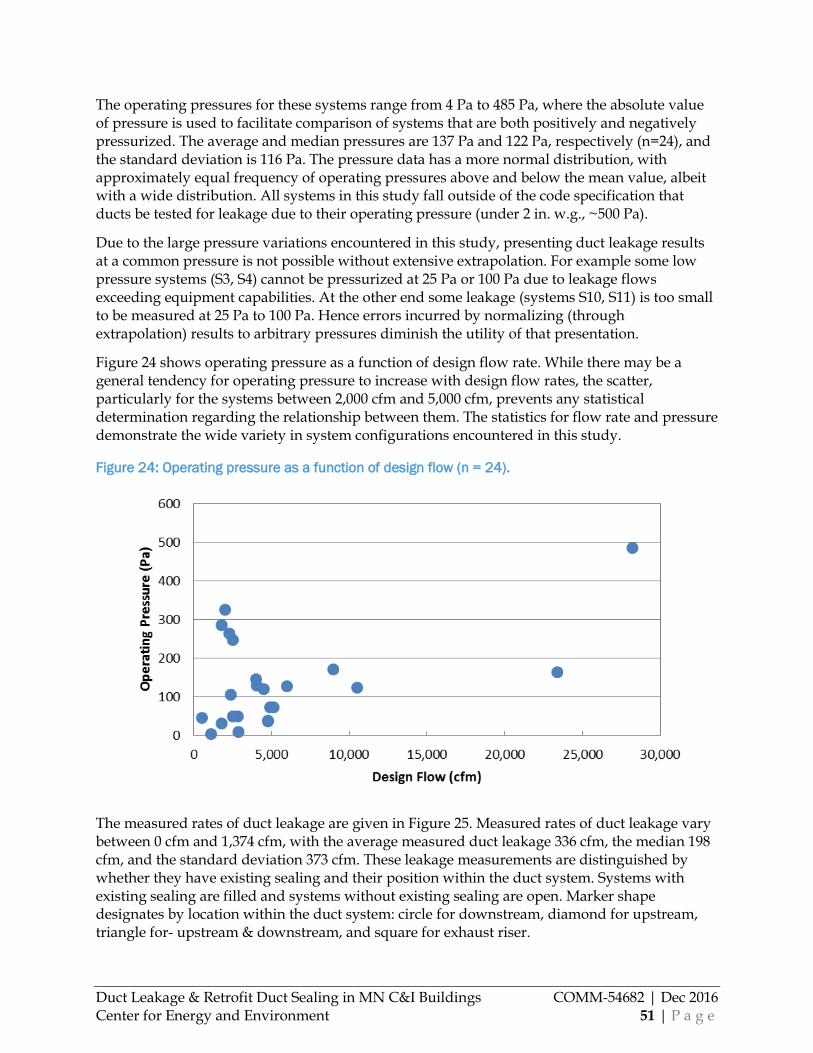
Duct Leakage & Retrofit Duct Sealing in MN C&I Buildings COMM-54682 | Dec 2016 Center for Energy and Environment 51 | P a g e
The operating pressures for these systems range from 4 Pa to 485 Pa, where the absolute value of pressure is used to facilitate comparison of systems that are both positively and negatively pressurized. The average and median pressures are 137 Pa and 122 Pa, respectively (n=24), and the standard deviation is 116 Pa. The pressure data has a more normal distribution, with approximately equal frequency of operating pressures above and below the mean value, albeit with a wide distribution. All systems in this study fall outside of the code specification that ducts be tested for leakage due to their operating pressure (under 2 in. w.g., ~500 Pa).
Due to the large pressure variations encountered in this study, presenting duct leakage results at a common pressure is not possible without extensive extrapolation. For example some low pressure systems (S3, S4) cannot be pressurized at 25 Pa or 100 Pa due to leakage flows exceeding equipment capabilities. At the other end some leakage (systems S10, S11) is too small to be measured at 25 Pa to 100 Pa. Hence errors incurred by normalizing (through extrapolation) results to arbitrary pressures diminish the utility of that presentation.
Figure 24 shows operating pressure as a function of design flow rate. While there may be a general tendency for operating pressure to increase with design flow rates, the scatter, particularly for the systems between 2,000 cfm and 5,000 cfm, prevents any statistical determination regarding the relationship between them. The statistics for flow rate and pressure demonstrate the wide variety in system configurations encountered in this study.
Figure 24: Operating pressure as a function of design flow (n = 24).
The measured rates of duct leakage are given in Figure 25. Measured rates of duct leakage vary between 0 cfm and 1,374 cfm, with the average measured duct leakage 336 cfm, the median 198 cfm, and the standard deviation 373 cfm. These leakage measurements are distinguished by whether they have existing sealing and their position within the duct system. Systems with existing sealing are filled and systems without existing sealing are open. Marker shape designates by location within the duct system: circle for downstream, diamond for upstream, triangle for- upstream & downstream, and square for exhaust riser.

Duct Leakage & Retrofit Duct Sealing in MN C&I Buildings COMM-54682 | Dec 2016 Center for Energy and Environment 52 | P a g e
Figure 25: Individual leakage results Filled: sealed, Open: Unsealed, Circle - Downstream, Diamond -
Upstream, Triangle - Upstream & Downstream, Square - Exhaust Riser (n=24)
The distribution of duct leakage fraction, fL, is shown in Figure 26. The duct leakage fraction varies between 0% and 29%, with the average leakage fraction 7% and median leakage fraction of just 5%. Half of the systems (12) had leakage fractions that were less than 5%. Thirty three percent (8) of the systems had leakage fractions between 5% and 10% and the remaining four systems has leakage fractions 16%, 24%, 24%, and 29%. Duct leakage encountered in buildings pre-selected for duct leakage was less than anticipated.
Figure 26: Distribution of leakage fraction (n = 24).
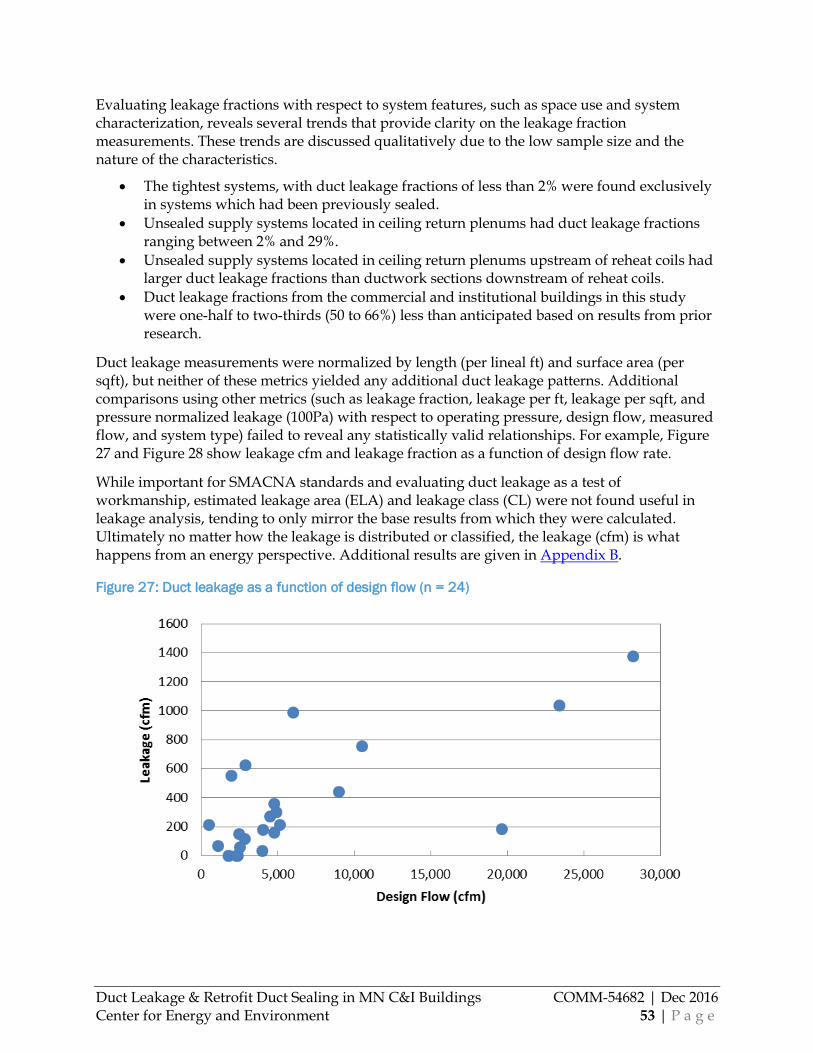
Duct Leakage & Retrofit Duct Sealing in MN C&I Buildings COMM-54682 | Dec 2016 Center for Energy and Environment 53 | P a g e
Evaluating leakage fractions with respect to system features, such as space use and system characterization, reveals several trends that provide clarity on the leakage fraction measurements. These trends are discussed qualitatively due to the low sample size and the nature of the characteristics.
The tightest systems, with duct leakage fractions of less than 2% were found exclusively in systems which had been previously sealed.
Unsealed supply systems located in ceiling return plenums had duct leakage fractions ranging between 2% and 29%.
Unsealed supply systems located in ceiling return plenums upstream of reheat coils had larger duct leakage fractions than ductwork sections downstream of reheat coils.
Duct leakage fractions from the commercial and institutional buildings in this study were one-half to two-thirds (50 to 66%) less than anticipated based on results from prior research.
Duct leakage measurements were normalized by length (per lineal ft) and surface area (per sqft), but neither of these metrics yielded any additional duct leakage patterns. Additional comparisons using other metrics (such as leakage fraction, leakage per ft, leakage per sqft, and pressure normalized leakage (100Pa) with respect to operating pressure, design flow, measured flow, and system type) failed to reveal any statistically valid relationships. For example, Figure 27 and Figure 28 show leakage cfm and leakage fraction as a function of design flow rate.
While important for SMACNA standards and evaluating duct leakage as a test of workmanship, estimated leakage area (ELA) and leakage class (CL) were not found useful in leakage analysis, tending to only mirror the base results from which they were calculated. Ultimately no matter how the leakage is distributed or classified, the leakage (cfm) is what happens from an energy perspective. Additional results are given in Appendix B.
Figure 27: Duct leakage as a function of design flow (n = 24)

Duct Leakage & Retrofit Duct Sealing in MN C&I Buildings COMM-54682 | Dec 2016 Center for Energy and Environment 54 | P a g e
Figure 28: Leakage fraction as a function of design flow (n = 24).
Duct System Leakage in Multifamily Buildings with Gypsum Board
Exhaust
In addition to the C&I ductwork, the study was expanded to include three general exhaust systems from multi-family buildings. These systems are treated separately due to space use (multi-family), duct construction (gypsum board), and leakage characteristics. The outlet flow rates of these systems was measured using a TrueFlow Air Handler Flow Meter and the leakage flows are those measured using the pressurization test at the stated operating pressure. The operating points and leakage measurements are given in Table 13.
Table 13: Operating points and initial duct leakage for multi-family gypsum board exhaust systems
System Code
Design Flow
Measured Flow (cfm)
Operating Pressure
(Pa)
Duct Leakage
(cfm)
Leakage Fraction
(fL)
Leakage per
length (cfm/ft)
Leakage per area
(cfm/sqft)
S28 120 278 -35 238 80% 1.11 0.92
S29 120 649 -35 459 71% 3.04 1.12
S30 675 1,030 -25 563 55% 1.44 0.29
Mean 305 652 -32 420 68% 1.86 0.78
The design flows and operating pressures for these systems was generally less than the C&I systems. Design flows, determined as the sum of exhaust grill flows necessary for code compliance, range between 120 and 675 cfm. Measured flows at the roof were significantly greater than the design flow in each case, ranging between 278 and 1,030 cfm. Two of the systems had operating pressures of -35 Pa and one of -25 Pa.

Duct Leakage & Retrofit Duct Sealing in MN C&I Buildings COMM-54682 | Dec 2016 Center for Energy and Environment 55 | P a g e
Duct leakage flows were extremely high for the given system sizes, ranging 238 to 563 cfm and corresponding to leakage fractions of 55% to 80%. It is important to note these measurements were taken after efforts to seal these exhaust systems using traditional measures proved unsuccessful. Attempts to tape and foam seams in these systems were largely unsuccessful due to limited access to most of the duct surface area. The large leakage fractions and duct inaccessibility were the motivating factors to include these systems into the study.
Retrofit Duct Leakage Sealing Results
Twenty systems were sealed under controlled conditions to quantify the benefits of retrofit duct sealing. Three were done by a contractor employing traditional duct sealing methods and 17 by a contractor using the Aeroseal process. The existing leakage characteristics of these systems are included in the previous section. Not all of the sealing efforts were successful; for this reason, the results are separated into two groups to facilitate comparison and to highlight the very different results between the two groups. Table 14 provides sealing results for the 15 (75%) systems where sealing was successful.
Table 15 presents the sealing results for the remaining five systems, all of which had major complications prior to, during, or after the sealing process. Sealing results for all 20 systems are consolidated in the figures.
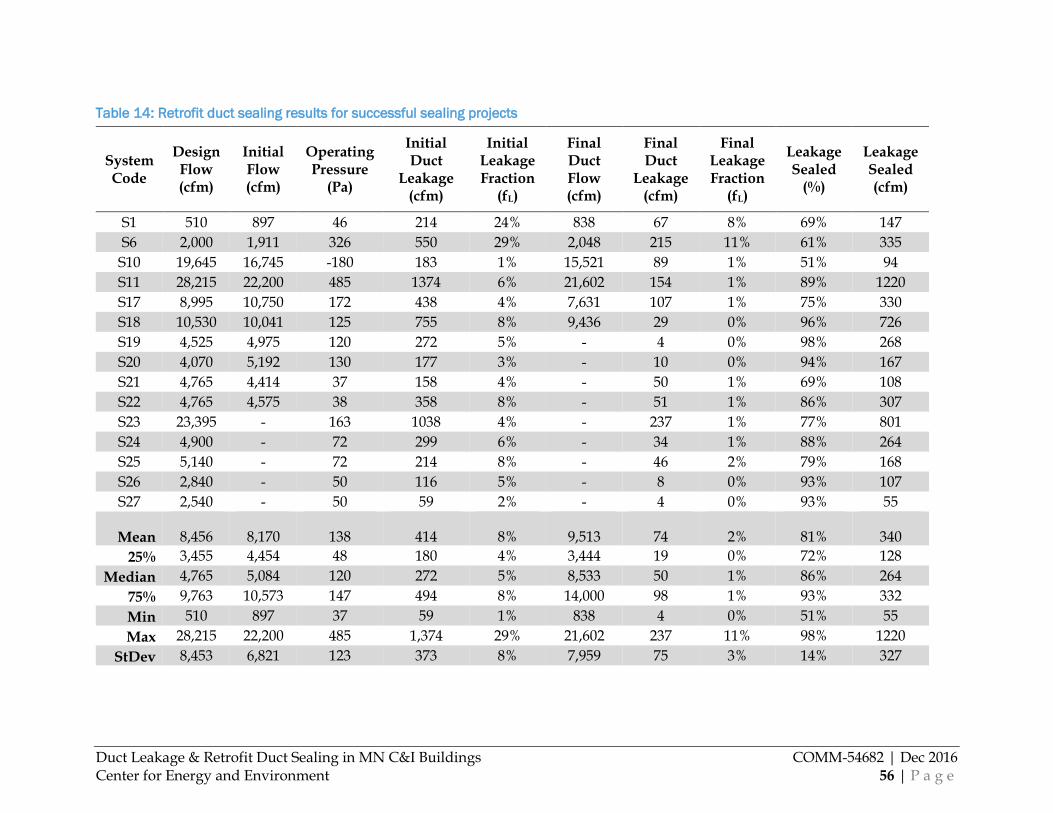
Duct Leakage & Retrofit Duct Sealing in MN C&I Buildings COMM-54682 | Dec 2016 Center for Energy and Environment 56 | P a g e
Table 14: Retrofit duct sealing results for successful sealing projects
System Code
Design Flow (cfm)
Initial Flow (cfm)
Operating Pressure
(Pa)
Initial Duct
Leakage (cfm)
Initial Leakage Fraction
(fL)
Final Duct Flow (cfm)
Final Duct
Leakage (cfm)
Final Leakage Fraction
(fL)
Leakage Sealed
(%)
Leakage Sealed (cfm)
S1 510 897 46 214 24% 838 67 8% 69% 147
S6 2,000 1,911 326 550 29% 2,048 215 11% 61% 335
S10 19,645 16,745 -180 183 1% 15,521 89 1% 51% 94
S11 28,215 22,200 485 1374 6% 21,602 154 1% 89% 1220
S17 8,995 10,750 172 438 4% 7,631 107 1% 75% 330
S18 10,530 10,041 125 755 8% 9,436 29 0% 96% 726
S19 4,525 4,975 120 272 5% - 4 0% 98% 268
S20 4,070 5,192 130 177 3% - 10 0% 94% 167
S21 4,765 4,414 37 158 4% - 50 1% 69% 108
S22 4,765 4,575 38 358 8% - 51 1% 86% 307
S23 23,395 - 163 1038 4% - 237 1% 77% 801
S24 4,900 - 72 299 6% - 34 1% 88% 264
S25 5,140 - 72 214 8% - 46 2% 79% 168
S26 2,840 - 50 116 5% - 8 0% 93% 107
S27 2,540 - 50 59 2% - 4 0% 93% 55
Mean 8,456 8,170 138 414 8% 9,513 74 2% 81% 340
25% 3,455 4,454 48 180 4% 3,444 19 0% 72% 128
Median 4,765 5,084 120 272 5% 8,533 50 1% 86% 264
75% 9,763 10,573 147 494 8% 14,000 98 1% 93% 332
Min 510 897 37 59 1% 838 4 0% 51% 55
Max 28,215 22,200 485 1,374 29% 21,602 237 11% 98% 1220
StDev 8,453 6,821 123 373 8% 7,959 75 3% 14% 327
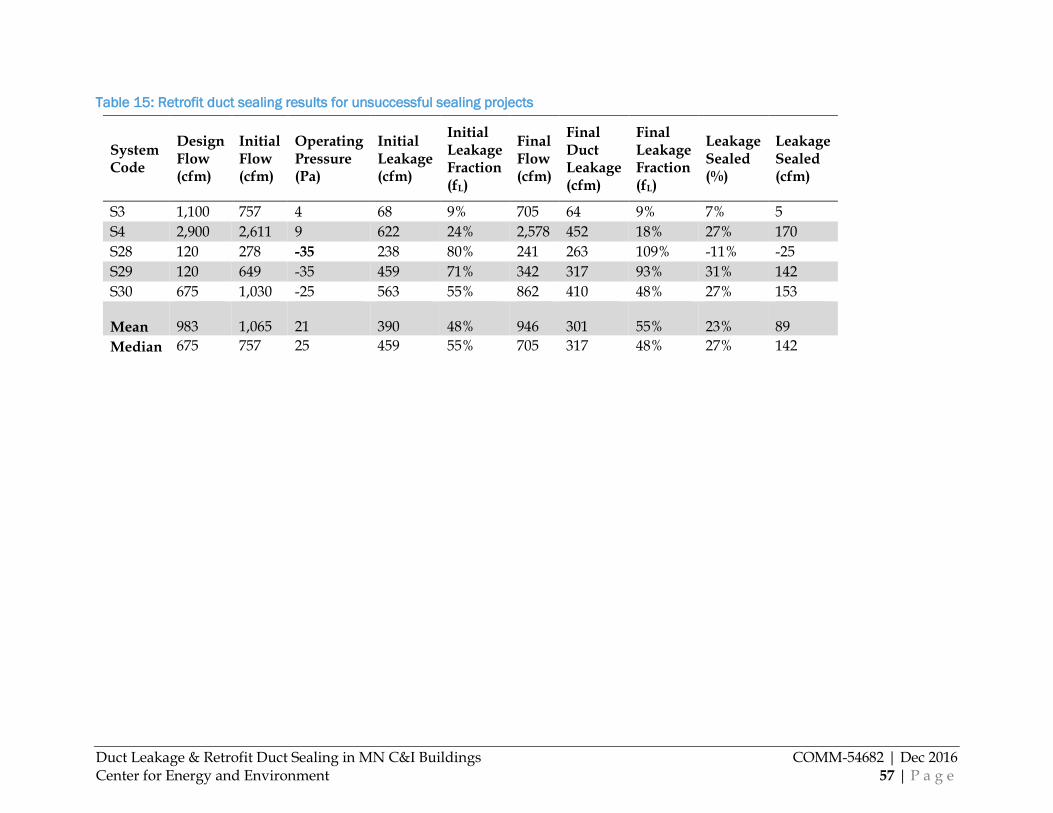
Duct Leakage & Retrofit Duct Sealing in MN C&I Buildings COMM-54682 | Dec 2016 Center for Energy and Environment 57 | P a g e
Table 15: Retrofit duct sealing results for unsuccessful sealing projects
System Code
Design Flow (cfm)
Initial Flow (cfm)
Operating Pressure (Pa)
Initial Leakage (cfm)
Initial Leakage Fraction (fL)
Final Flow (cfm)
Final Duct Leakage (cfm)
Final Leakage Fraction (fL)
Leakage Sealed (%)
Leakage Sealed (cfm)
S3 1,100 757 4 68 9% 705 64 9% 7% 5
S4 2,900 2,611 9 622 24% 2,578 452 18% 27% 170
S28 120 278 -35 238 80% 241 263 109% -11% -25
S29 120 649 -35 459 71% 342 317 93% 31% 142
S30 675 1,030 -25 563 55% 862 410 48% 27% 153
Mean 983 1,065 21 390 48% 946 301 55% 23% 89
Median 675 757 25 459 55% 705 317 48% 27% 142
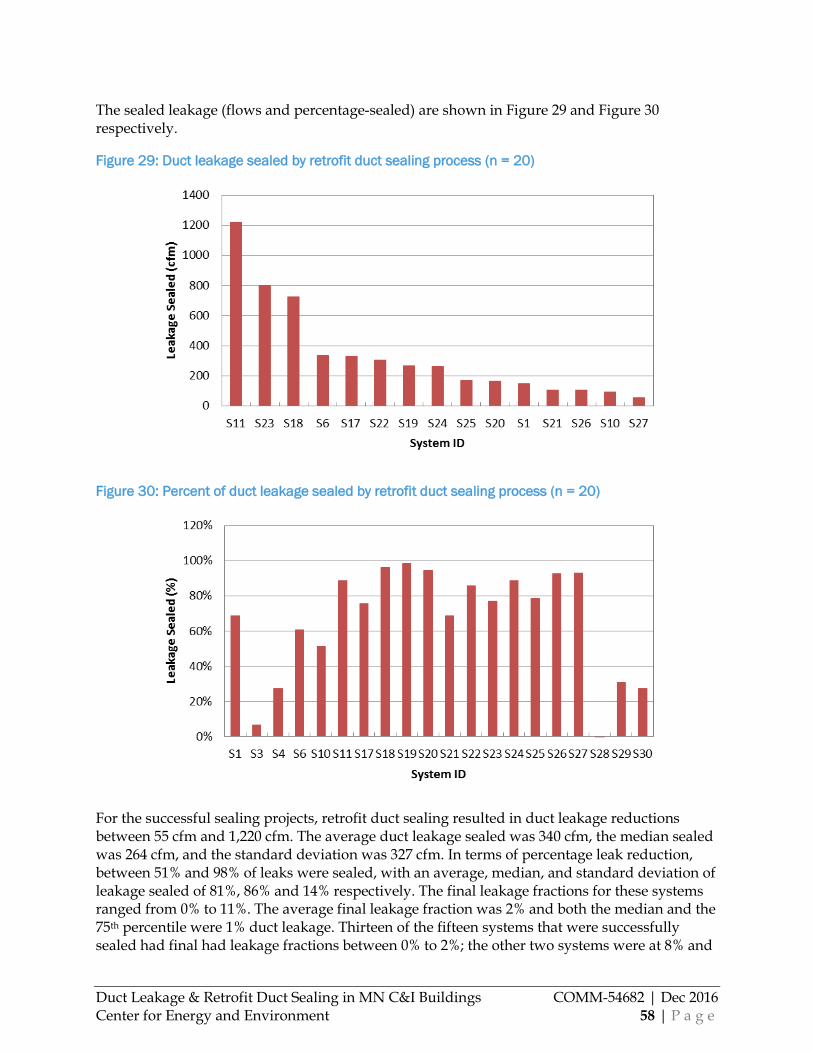
Duct Leakage & Retrofit Duct Sealing in MN C&I Buildings COMM-54682 | Dec 2016 Center for Energy and Environment 58 | P a g e
The sealed leakage (flows and percentage-sealed) are shown in Figure 29 and Figure 30 respectively.
Figure 29: Duct leakage sealed by retrofit duct sealing process (n = 20)
Figure 30: Percent of duct leakage sealed by retrofit duct sealing process (n = 20)
For the successful sealing projects, retrofit duct sealing resulted in duct leakage reductions between 55 cfm and 1,220 cfm. The average duct leakage sealed was 340 cfm, the median sealed was 264 cfm, and the standard deviation was 327 cfm. In terms of percentage leak reduction, between 51% and 98% of leaks were sealed, with an average, median, and standard deviation of leakage sealed of 81%, 86% and 14% respectively. The final leakage fractions for these systems ranged from 0% to 11%. The average final leakage fraction was 2% and both the median and the 75th percentile were 1% duct leakage. Thirteen of the fifteen systems that were successfully sealed had final had leakage fractions between 0% to 2%; the other two systems were at 8% and

Duct Leakage & Retrofit Duct Sealing in MN C&I Buildings COMM-54682 | Dec 2016 Center for Energy and Environment 59 | P a g e
11%.Overall, retrofit duct sealing was highly successful and leakage was virtually eliminated in most systems.
Pre-sealing and post-sealing leakage fractions are compared in Figure 31 and sealed leakage flow is compared against design flow in Figure 32 for each system. The relationship between sealed-leakage and design flow is weak. As with pre-sealing leakage measurements, a comparison of leakage metrics and operational characteristics are given in Appendix D. Again there are no identifiable trends based on system characteristics or operating conditions such as operating pressure, design flow, or duct size metrics, thus these results suggest leakage generally depends on specific duct system construction.
Figure 31: Pre and post leakage fractions for successful sealing projects (n = 15)
Figure 32: Sealed leakage as a function of design flow for successful sealing projects (n = 15)
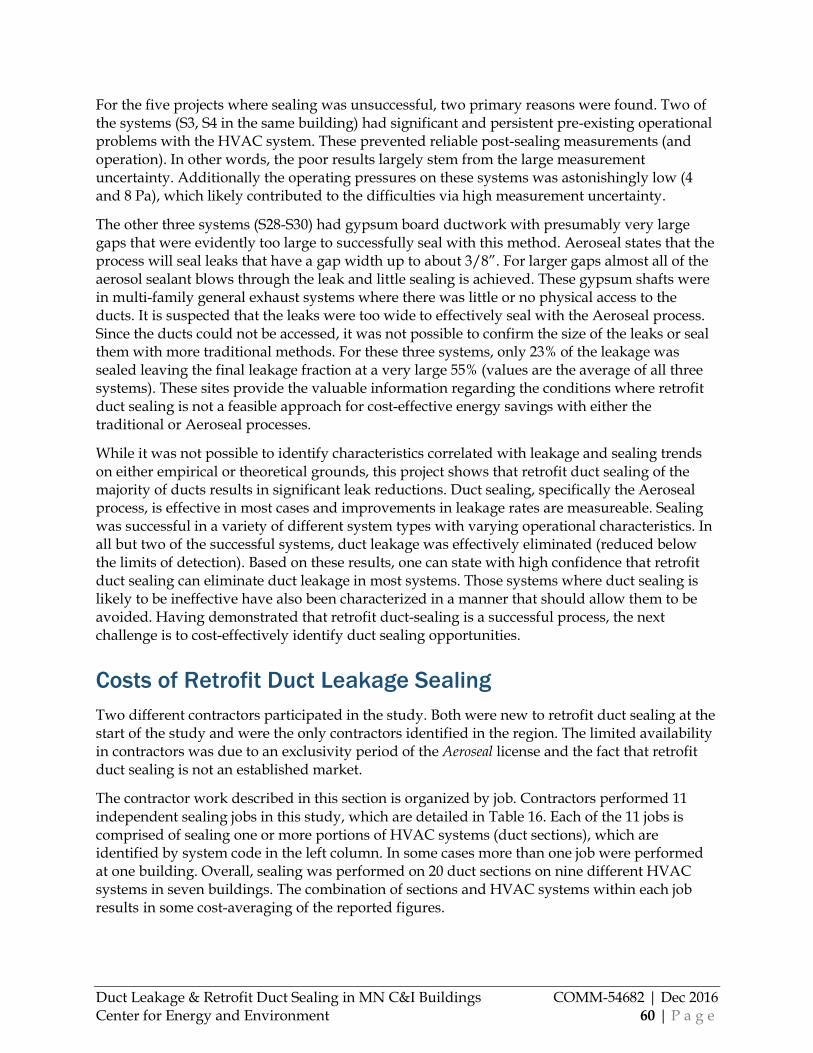
Duct Leakage & Retrofit Duct Sealing in MN C&I Buildings COMM-54682 | Dec 2016 Center for Energy and Environment 60 | P a g e
For the five projects where sealing was unsuccessful, two primary reasons were found. Two of the systems (S3, S4 in the same building) had significant and persistent pre-existing operational problems with the HVAC system. These prevented reliable post-sealing measurements (and operation). In other words, the poor results largely stem from the large measurement uncertainty. Additionally the operating pressures on these systems was astonishingly low (4 and 8 Pa), which likely contributed to the difficulties via high measurement uncertainty.
The other three systems (S28-S30) had gypsum board ductwork with presumably very large gaps that were evidently too large to successfully seal with this method. Aeroseal states that the process will seal leaks that have a gap width up to about 3/8”. For larger gaps almost all of the aerosol sealant blows through the leak and little sealing is achieved. These gypsum shafts were in multi-family general exhaust systems where there was little or no physical access to the ducts. It is suspected that the leaks were too wide to effectively seal with the Aeroseal process. Since the ducts could not be accessed, it was not possible to confirm the size of the leaks or seal them with more traditional methods. For these three systems, only 23% of the leakage was sealed leaving the final leakage fraction at a very large 55% (values are the average of all three systems). These sites provide the valuable information regarding the conditions where retrofit duct sealing is not a feasible approach for cost-effective energy savings with either the traditional or Aeroseal processes.
While it was not possible to identify characteristics correlated with leakage and sealing trends on either empirical or theoretical grounds, this project shows that retrofit duct sealing of the majority of ducts results in significant leak reductions. Duct sealing, specifically the Aeroseal process, is effective in most cases and improvements in leakage rates are measureable. Sealing was successful in a variety of different system types with varying operational characteristics. In all but two of the successful systems, duct leakage was effectively eliminated (reduced below the limits of detection). Based on these results, one can state with high confidence that retrofit duct sealing can eliminate duct leakage in most systems. Those systems where duct sealing is likely to be ineffective have also been characterized in a manner that should allow them to be avoided. Having demonstrated that retrofit duct-sealing is a successful process, the next challenge is to cost-effectively identify duct sealing opportunities.
Costs of Retrofit Duct Leakage Sealing
Two different contractors participated in the study. Both were new to retrofit duct sealing at the start of the study and were the only contractors identified in the region. The limited availability in contractors was due to an exclusivity period of the Aeroseal license and the fact that retrofit duct sealing is not an established market.
The contractor work described in this section is organized by job. Contractors performed 11 independent sealing jobs in this study, which are detailed in Table 16. Each of the 11 jobs is comprised of sealing one or more portions of HVAC systems (duct sections), which are identified by system code in the left column. In some cases more than one job were performed at one building. Overall, sealing was performed on 20 duct sections on nine different HVAC systems in seven buildings. The combination of sections and HVAC systems within each job results in some cost-averaging of the reported figures.

Duct Leakage & Retrofit Duct Sealing in MN C&I Buildings COMM-54682 | Dec 2016 Center for Energy and Environment 61 | P a g e
One (C1 in tables below) provided “not to exceed” bids and invoiced for the actual cost (2 jobs). The second contractor (C2 in tables below) used a time and materials estimate (9 jobs). The projects were not competitively bid, but all 30 of the systems at each of the nine sites received bids before work was agreed upon. Bids were typically submitted after completion of a site visit to trace out ductwork and complete a plan review.
Contractor C1 used traditional sealing and bid on lineal feet of ductwork. Contractor C2 used the Aeroseal method and bid on design flow rate and a site evaluation. Sealing costs are also reported normalized by project effort (full-time equivalent days or FTE-days) and per cfm-sealed. For most C2 jobs (7 of 9) actual costs were less than the bid amounts (by 4% to 65%) and for the other two jobs the costs exceeded the bid (by 6% and 8%).
Sealing costs for these 11 sealing jobs are normalized according to several metrics, shown in Table 16.
Table 16: Retrofit duct sealing costs
System Code
Contrac-tor
System Type
Design Flow
Sealing Cost
Cost per cfm-design
Cost per lineal ft
Cost per FTE-day
Cost per cfm-sealed
S1 C1 VAV 510 $983 $1.93 $11.30 $491 $6.68
S3, S4 C1 CAV 4,000 $3,950 $0.99 $6.41 $494 $22.58
S6 C2 VAV 2,000 $4,049 $2.02 $14.67 $831 $12.10
S10 C2 Exhaust 19,645 $5,050 $0.26 $23.38 $860 $53.89
S11 C2 Exhaust 28,215 $5,703 $0.22 $36.56 $800 $17.23
S17, S18 C2 CAV 23,395 $5,778 $0.22 $27.86 $730 $7.21
S19 - S22 C2 CAV 15,420 $7,752 $0.61 $13.37 $877 $13.05
S23 C2 CAV 19,525 $8,374 $0.39 $21.04 $817 $7.22
S24 - S27 C2 CAV 19,125 $8,890 $0.45 $7.79 $671 $15.25
S28, S29 C2 Exhaust 240 $5,703 $23.76 $5.43 - $27.85
S30 C2 Exhaust 675 $4,151 $6.15 $10.62 $678 $27.16
Mean 12,068 $5,489 $3.36 $16.22 $725 $19.11
Median 15,420 $5,703 $0.61 $13.37 $765 $15.25
Min 240 $983 $0.22 $5.43 $491 $6.68
Max 28,215 $8,890 $23.76 $36.56 $877 $53.89
StDev 10,643 $2,279 $6.98 $9.87 $141 $13.80
The range of costs varies considerably for all metrics considered. The average unit cost using the design flow rate was 3.36 $/cfm-design, however the range varied by over a factor of 100, from 0.22 $/cfm-design to 23.76 $/cfm-design and the median was 0.61 $/cfm-design (n = 11). Better consistency in the results is achieved if the two smallest systems (both under 500 cfm) are excluded (S28 and S29). Then the average cost of 1.32 $/cfm-design (n = 10) or 26% less than the pre-project expected cost of the Aeroseal process (~$1.80) although individual sealing costs still ranged considerably, from 0.22 $/cfm-design to 6.15 $/cfm-design. The median cost for sealing the systems with a design flow over 500 cfm is 0.53 $/cfm-design, or 70% below the pre-project expected costs. When considering these ranges, it is important to note that measured flow rates

Duct Leakage & Retrofit Duct Sealing in MN C&I Buildings COMM-54682 | Dec 2016 Center for Energy and Environment 62 | P a g e
were about 15% less than design flows on average and the standard deviation of sealing costs was relatively large (1.82 $/cfm-design).
The sealing costs per lineal foot of ductwork varied somewhat less, by a factor of just under seven, from 5.43 $/lineal-ft to 36.56 $/lineal-ft, with an average of 16.22 $/lineal-ft (n=11). The figures for sealing cost per surface area are similar. This narrow spread may be due to the fact that the length or surface area of ductwork better represents size in terms of the labor requirement (and therefore costs) for each sealing job compared to flow rate.
On average, about 82% of the total cost of duct sealing was attributed to labor, with the remainder split relatively evenly between materials, equipment rental, and a licensing fee for the Aeroseal process. In other words, the fixed costs were about 18% of the job. This is reflected in a fairly tight cost spread when total costs are normalized by the number of workers multiplied by the duration of the job (FTE-days). The average cost of all the jobs per FTE-day was $725 (n = 11, range: $491 - $877). For contractor C1 (traditional sealing), sealing costs were 491 and 494 $/FTE-day and for contractor C2 (Aeroseal method) between 671 and 877 $/FTE-day. These differences reflect the different rates for the two contractors and the additional overhead of Aeroseal equipment costs and licensing fees. Most jobs were scoped and worked as full days; only one used a partial day.
Eight of the 11 jobs were completed in a single day, two jobs took 1.5 and 2 days, and a one job took 3 days. The labor duration was relatively invariant over a wide range of system sizes (120 cfm to 28,215 cfm). Contractors tended to add workers rather than extend job duration. There was only a weak correlation with cost as additional workers were added to complete a given job. While no quantitative data were collected, observations indicate that the primary determinant of labor hours was the amount and difficulty of the duct blocking. Across all the jobs, costs ranged from $4,000 to $6,000 per day.
For fixed blocking requirements, the cost of sealing 10,000 cfm to 20,000 cfm systems is only marginally more than sealing 2,000 cfm to 5,000 cfm systems. This difference is exacerbated as larger portions of systems tend to have fewer duct-blocking requirements and more accessible ductwork. For approximately fixed costs, system size (cfm-design) imposes an upper limit on the amount of leakage that can ultimately be sealed (cfm-sealed). Combining these two facts suggest a floor for cost-effectiveness.
The cost per cfm-sealed is the metric that directly computes the cost effectiveness of the retrofit duct sealing process. It enables an easy and direct comparison to the operational costs of both moving (fan power) and conditioning (heating and cooling energy) the air that was previously lost to leakage. Unfortunately, while an ideal metric, it also has an unacceptable level of variation as a project cost estimating tool: in this study the cost per cfm-sealed varied by a factor of eight, from 6.68 $/cfm-sealed to 53.89 $/cfm-sealed. The average was 19.11 $/cfm-sealed, the median was 15.25 $/cfm-sealed, and the standard deviation was 13.80 $/cfm-sealed (n = 11).
For larger systems (15,420 cfm - 28,215 cfm), the cost per design flow rate ranges by a factor of three. Almost all leakage is eliminated and the sealing cost does not vary significantly with amount of sealing (labor for sealing time is not that significant). Thus, flow rate sealed is impacted by existing leakage but cost for doing the sealing is not.
Limited data from contractor C1, prevents a thorough comparison between the contractor using traditional sealing measures (C1) and the contractor using the Aeroseal process (C2). Work was

Duct Leakage & Retrofit Duct Sealing in MN C&I Buildings COMM-54682 | Dec 2016 Center for Energy and Environment 63 | P a g e
limited for contractor C1 because they declined to carry forward work on the research project due to competing job responsibilities. Nonetheless, Table 17 gives the sealing costs for like-systems, including cost metrics such as $/cfm-design, $/lineal ft, $/FTE-day, and $/cfm-sealed. Similar systems were restricted to low pressure supply systems downstream of VAV boxes and CAV reheat coils between 510 cfm and 4,765 cfm.
There are eleven systems that can be used for the comparison, 3 for contractor C1 (S1, S2, and S3) and 8 for contractor C2 (S6, S19 – S22, and S25 – S27). Contractor C1 had lower costs based on lineal-ft and FTE-day and contractor C2 had lower costs based on cfm-design, while costs per cfm-sealed were roughly equivalent. Even for substantially similar systems, a cost comparison showed no clear cost-advantage to either contractor, suggesting variability in job details are more significant factors than sealing methods. Similarity the cost per cfm-sealed suggest that the cost-effectiveness of both processes may be similar for low pressure supply systems downstream of VAV boxes and CAV reheat coils. However, in certain situations, such as where duct access is difficult or not possible, Aeroseal remains the only practical sealing method.
Table 17. Contractor cost comparison
Contractor Cost per
cfm-design Cost per lineal ft
Cost per FTE-day
Cost per cfm-sealed
C1 (Traditional) $1.46 $8.85 $493 $14.63
C2 (Aeroseal) $1.03 $11.94 $793 $13.47
Operational Costs of Duct Leakage and Potential Retrofit
Duct Sealing Cost Effectiveness
The operational costs of duct leakage were calculated for the nine successful sealing jobs comprising 15 systems, across 6 HVAC systems, and 4 buildings. The fan, heating, and cooling energies and the operating costs associated with these are given in Table 18.
Figure 33 and Figure 34 show the fan, heating, and cooling energies associated with duct leakage in absolute units (kWh) and as a percent of total leakage energy, respectively. Overall, prior to duct sealing, the energy penalty for duct leakage ranges from 614 kWh/yr to over 20,000 kWh/yr for the considered systems, or between 8 kWh/cfm-yr and 26 kWh/cfm-yr approximately.
Table 18: Energy penalty due to duct leakage
System Code
Initial Duct
Leakage (cfm)
Leakage Fan
Power (W)
Leakage Fan Energy (kWh/yr)
Fan Heat (Therm/yr)
Heating Energy
(Therm/yr)
Leakage Cooling Energy
(kWh/yr)
S1 214 283 973 6.5 18 213.1
S6 550 309 1152 7.8 399 1673
S10 183 151 1301 9.0 50 229
S11 1374 855 7348 49.0 374 1719
S17 438 340 1417 9.8 103 295
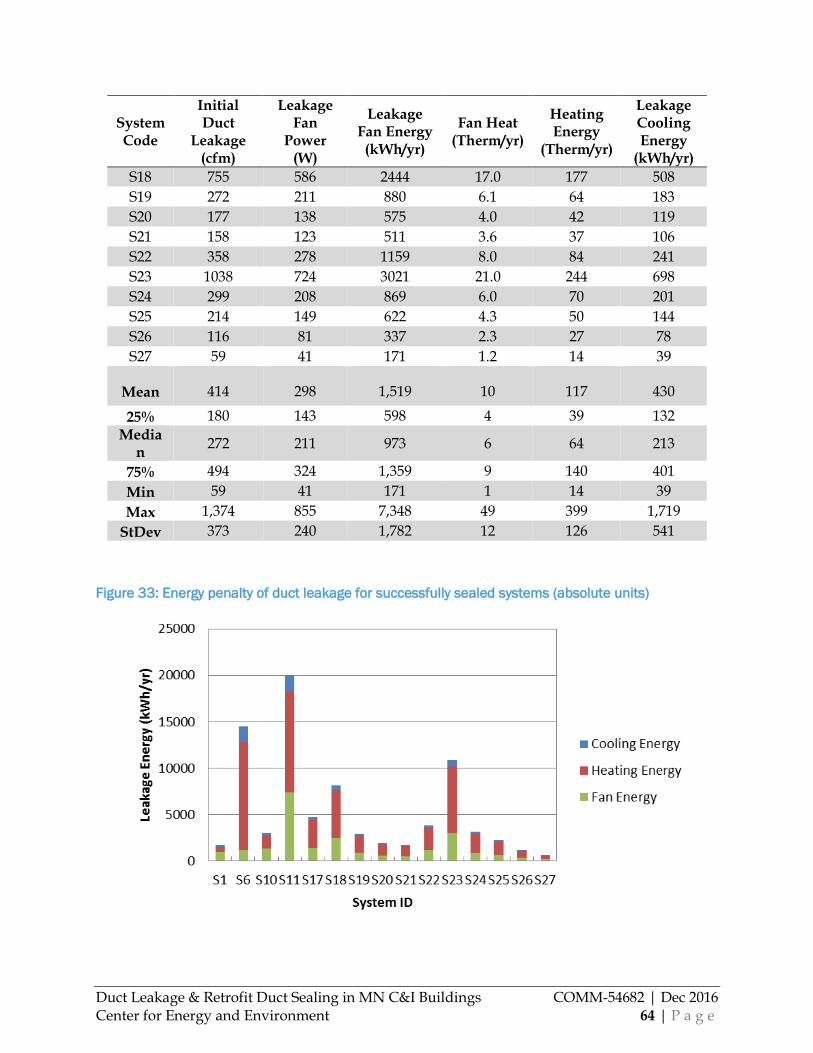
Duct Leakage & Retrofit Duct Sealing in MN C&I Buildings COMM-54682 | Dec 2016 Center for Energy and Environment 64 | P a g e
System Code
Initial Duct
Leakage (cfm)
Leakage Fan
Power (W)
Leakage Fan Energy (kWh/yr)
Fan Heat (Therm/yr)
Heating Energy
(Therm/yr)
Leakage Cooling Energy
(kWh/yr)
S18 755 586 2444 17.0 177 508
S19 272 211 880 6.1 64 183
S20 177 138 575 4.0 42 119
S21 158 123 511 3.6 37 106
S22 358 278 1159 8.0 84 241
S23 1038 724 3021 21.0 244 698
S24 299 208 869 6.0 70 201
S25 214 149 622 4.3 50 144
S26 116 81 337 2.3 27 78
S27 59 41 171 1.2 14 39
Mean 414 298 1,519 10 117 430
25% 180 143 598 4 39 132
Median
272 211 973 6 64 213
75% 494 324 1,359 9 140 401
Min 59 41 171 1 14 39
Max 1,374 855 7,348 49 399 1,719
StDev 373 240 1,782 12 126 541
Figure 33: Energy penalty of duct leakage for successfully sealed systems (absolute units)

Duct Leakage & Retrofit Duct Sealing in MN C&I Buildings COMM-54682 | Dec 2016 Center for Energy and Environment 65 | P a g e
Figure 34: Energy penalty of duct leakage for successfully sealed systems (percentage of total
energy use)
The largest variations occurred for the heating energy lost to duct leakage which is proportional to the total volume of each system’s leakage. It varied principally due to system type (either supply or exhaust), outside air fraction, balance point temperature, and finally the leakage sealed. The site energy consumed for heating leakage air ranged from 14 and 399 therm/yr and comprised between 30% and 81% of the total leakage energy. For all systems except S1, the heating energy penalty was the largest energy impact of duct leakage. Job S1 had a very low balance point temperature (~32F) and a high efficiency heating system, which lowered the heating energy lost via duct leakage substantially. At the other extreme, the heating energy for system S6, a 100% outside air supply system, comprised 81% of the total energy lost to leakage. Otherwise for typical outside air fractions in this study (20% - 32%), about 60% to 70% of the total leakage energy was from heating. The heating energy loss in exhaust systems S10 and S11, which had 48% and 55% total leakage energy respectively, were mitigated by an energy recovery system with a 78% total effectiveness.
Variations in fan and cooling energies were significantly less and varied primarily due to measured or assumed operating time and system efficiencies (e.g. fan, motor, VFD, COP). The extra fan energy required for duct leakage varied between 171 kWh/yr and 1,359 kWh/yr (8% and 57% of the total energy) or between 2.1 kWh/cfm-yr and 7.1 kWh/cfm-yr. Cooling energy was the smallest contribution (neglecting fan heat), varying between 39 kWh/yr and 1,719 kWh/yr or between 6% and 12% of the site energy required for duct leakage. For reference, the fan heat penalty associated with these systems varied between 1 Therm/yr and 49 Therm/yr and 65% to 85% of this energy contributes toward heating during heating season, hence incurring no energy penalty and only a minor inefficiency in fuel cost.
Once leakage cfm and fan power were determined, a sensitivity analysis of remaining parameters was performed. Due to simple linear relationships between key parameters and energy consequence of duct leakage, any change in energy consumption of duct leakage is
Duct Leakage & Retrofit Duct Sealing in MN C&I Buildings COMM-54682 | Dec 2016 Center for Energy and Environment 66 | P a g e
directly proportional to any change in HDD, outside air fraction, infiltration ratio, operating hours, or system efficiency in the calculation. For example, a 20% increase in operating hours or outside airflow each correspond to 20% higher energy penalty for duct leakage. In this way, once a determination of leakage has been made it is a straight forward exercise to explore the consequences over a range of operating conditions and system assumptions. Hence from this exercise, the parameters that vary the most have the largest impact. The order of these effects for these systems is:
1. Energy recovery (varied by factor of 4.5), 2. Outside air fraction/infiltration ratio (factor of 4.0), 3. Operating hours (factor of 2.7), 4. Heating degree days (factor 2.2),
Changes in operating efficiencies have smaller potential impacts, on the order 3% to 22%.
For the most typical supply system with ceiling return plenum, the breakdown in energy from duct leakage is 6% cooling, 65% heating, and 29% fan energy. That is for a system with no energy recovery, 80% heating efficiency, 12 SEER, 6,093 HDD, 2356 CDD, 32% outside air fraction, and 4,171 operating hours/yr. For those conditions the energy per cfm of duct leakage is: cooling is 0.7 kWh/cfm-yr, heating = 0.2 Therm/cfm-yr, and fan = 3.2 kWh/cfm-yr.
The cost of each type of energy penalty incurred by duct leakage and the simple payback are given in Table 19. For ease of comparison, energy costs were assumed to be the same for each system: 0.837 $/Therm and 0.117 $/kWh5. Sealing costs from the jobs with multiple systems were split among systems based on contractor’s cost breakdowns. The absolute operational costs and the percentage of each energy cost incurred by duct leakage are given in Figure 35 and Figure 36 respectively.
Table 19: Operational costs of duct leakage and simple payback of retrofit duct sealing
System Code
Fan Energy
Cost ($/yr)
Heating Energy
Cost ($/yr)
Cooling Energy
Cost ($/yr)
Total Leakage
Cost ($/yr)
Operational Cost ($/cfm)
Payback (yr)
S1 $114 $15 $25 $154 $0.72 9.3
S6 $135 $334 $196 $664 $1.21 10.0
S10 $152 $42 $27 $221 $1.21 44.6
S11 $860 $313 $201 $1,374 $1.00 4.7
S17 $166 $86 $34 $286 $0.65 13.4
S18 $286 $148 $59 $494 $0.65 6.1
S19 $103 $53 $21 $178 $0.65 11.1
S20 $67 $35 $14 $116 $0.65 17.7
S21 $60 $31 $12 $103 $0.65 27.4
S22 $136 $70 $28 $234 $0.65 9.6
S23 $353 $204 $82 $639 $0.62 17.0
5 Fuel prices: natural gas = $0.837/therm and electricity = $0.117/kWh as specified by the U.S. Energy Information Administration for the 2015-15 forecast for the Midwest region (March 2015)
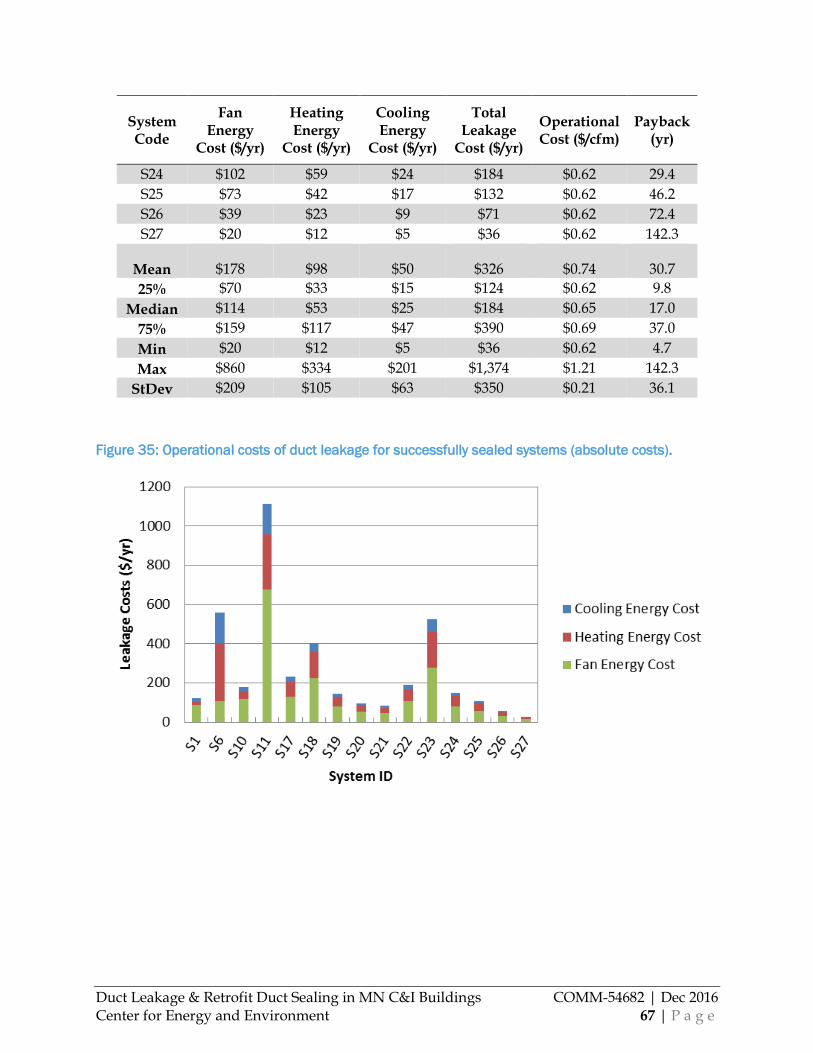
Duct Leakage & Retrofit Duct Sealing in MN C&I Buildings COMM-54682 | Dec 2016 Center for Energy and Environment 67 | P a g e
System Code
Fan Energy
Cost ($/yr)
Heating Energy
Cost ($/yr)
Cooling Energy
Cost ($/yr)
Total Leakage
Cost ($/yr)
Operational Cost ($/cfm)
Payback (yr)
S24 $102 $59 $24 $184 $0.62 29.4
S25 $73 $42 $17 $132 $0.62 46.2
S26 $39 $23 $9 $71 $0.62 72.4
S27 $20 $12 $5 $36 $0.62 142.3
Mean $178 $98 $50 $326 $0.74 30.7
25% $70 $33 $15 $124 $0.62 9.8
Median $114 $53 $25 $184 $0.65 17.0
75% $159 $117 $47 $390 $0.69 37.0
Min $20 $12 $5 $36 $0.62 4.7
Max $860 $334 $201 $1,374 $1.21 142.3
StDev $209 $105 $63 $350 $0.21 36.1
Figure 35: Operational costs of duct leakage for successfully sealed systems (absolute costs).
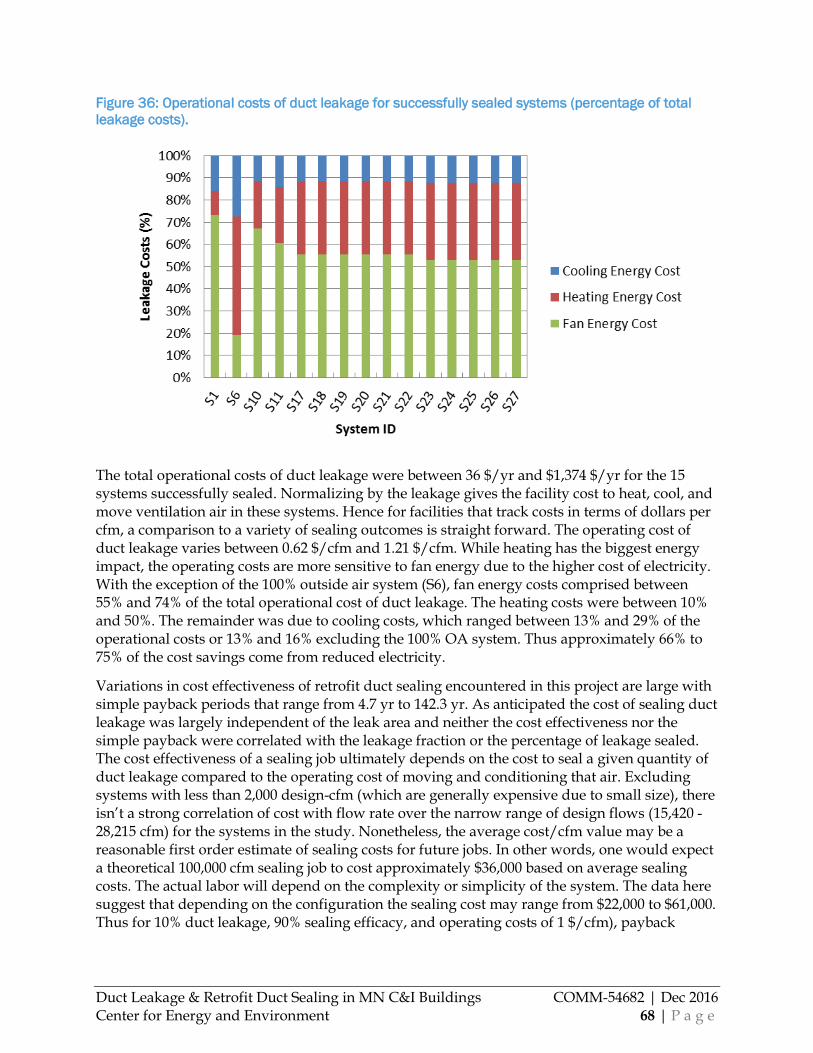
Duct Leakage & Retrofit Duct Sealing in MN C&I Buildings COMM-54682 | Dec 2016 Center for Energy and Environment 68 | P a g e
Figure 36: Operational costs of duct leakage for successfully sealed systems (percentage of total
leakage costs).
The total operational costs of duct leakage were between 36 $/yr and $1,374 $/yr for the 15 systems successfully sealed. Normalizing by the leakage gives the facility cost to heat, cool, and move ventilation air in these systems. Hence for facilities that track costs in terms of dollars per cfm, a comparison to a variety of sealing outcomes is straight forward. The operating cost of duct leakage varies between 0.62 $/cfm and 1.21 $/cfm. While heating has the biggest energy impact, the operating costs are more sensitive to fan energy due to the higher cost of electricity. With the exception of the 100% outside air system (S6), fan energy costs comprised between 55% and 74% of the total operational cost of duct leakage. The heating costs were between 10% and 50%. The remainder was due to cooling costs, which ranged between 13% and 29% of the operational costs or 13% and 16% excluding the 100% OA system. Thus approximately 66% to 75% of the cost savings come from reduced electricity.
Variations in cost effectiveness of retrofit duct sealing encountered in this project are large with simple payback periods that range from 4.7 yr to 142.3 yr. As anticipated the cost of sealing duct leakage was largely independent of the leak area and neither the cost effectiveness nor the simple payback were correlated with the leakage fraction or the percentage of leakage sealed. The cost effectiveness of a sealing job ultimately depends on the cost to seal a given quantity of duct leakage compared to the operating cost of moving and conditioning that air. Excluding systems with less than 2,000 design-cfm (which are generally expensive due to small size), there isn’t a strong correlation of cost with flow rate over the narrow range of design flows (15,420 - 28,215 cfm) for the systems in the study. Nonetheless, the average cost/cfm value may be a reasonable first order estimate of sealing costs for future jobs. In other words, one would expect a theoretical 100,000 cfm sealing job to cost approximately $36,000 based on average sealing costs. The actual labor will depend on the complexity or simplicity of the system. The data here suggest that depending on the configuration the sealing cost may range from $22,000 to $61,000. Thus for 10% duct leakage, 90% sealing efficacy, and operating costs of 1 $/cfm), payback
Duct Leakage & Retrofit Duct Sealing in MN C&I Buildings COMM-54682 | Dec 2016 Center for Energy and Environment 69 | P a g e
would vary between 2.4 and 7.1 years. While not perfect, this back-of-the-envelope estimate, may give direction to facilities considering retrofit duct sealing.
While it is not possible to provide precise cost-benefit estimates, a rule of thumb was developed: For a facility with an operational cost of $1/cfm-yr combined with typical contractor costs of about $5000/day, the sealing contractor needs to seal 1,000 cfm/day to achieve a 5 yr payback or 500 cfm/day for a 10 yr payback. Operationally the difference between these two values can be thought of as the difference between sealing a relatively modest 5% (10 yr payback) and a more impressive 10% (5 year payback) of duct leakage on a 10,000 cfm system. For this reason, scale clearly matters: simple, large systems of 20,000 cfm can be cost effective to seal even when considered tight (6% duct leakage) to begin with. On the other hand, spending $5,000/day on systems with rated capacities of less than 4,000 cfm is unlikely to be cost effective unless they are abnormally leaky (25%+). In this study, the observed payback distribution was driven by the system size: since a majority of systems were relatively small (2,000 to 5,000 cfm) many paybacks were long (>10 years).
Energy efficiency measures must necessarily consider the combined fuel savings of duct leakage. The electricity costs of duct leakage range between 68% and 90% of the total while 60% to 70% of the energy wasted is from heating (natural gas). Due to price disparity, the cost impact on heating energy loss is only between 10% and 32% of the operational costs of duct leakage. The best example of this case is illustrated by the large exhaust systems S10 and S11. If one analyzes these systems without energy recovery, thermal energy lost is increased by nearly a factor of five and the cost savings from heating are 51% and 57%. Hence in most cases a combined rebate scheme is necessary to recognize both cost and energy savings from heating (natural gas) and fan energy (electricity).
A major caveat with respect to theoretical potential energy savings and the cost effectiveness in this study is that energy savings were not always fully realized. The most common reason savings were not achieved, which occurred in 75% (12) of the systems, was that the systems failed to meet design flows, both prior to and sometimes after sealing. This study did not attempt to assess whether designed flows of the systems were adequate to meet the intended ventilation requirements, as this was outside the scope of the project. Actual savings from duct leakage were not realized on one system (S10) because the improvement in flow rate was too small for a pulley adjustment on the constant volume fan, so the delivered flow rate was increased as a result of the duct sealing. In another case, system S1, savings could be automatically realized because it had a VAV supply and the control system would reduce the fan speed to realize the savings. However in the particular case, the expected reduction in fan power was only about 0.15%, which is below the limits of detection. In general, one would expect projects with large enough scope to realize a measurable and optimal reduction in fan power from sealing VAV systems. In other situations, (for example S6), the improvements due to retrofit duct sealing allowed the system to operate as designed for the first time since it was installed by redistributing 25% of the system flow to a VAV box that had been chronically starved of supply air. This VAV box, on a long isolated run of duct, went from 120 cfm to 400 cfm, which accounted for a redistribution of approximately 71% of the air leakage.
This research design did not prioritize measurements of the change in fan, heating, and cooling energy, generally because sealing and characterization were performed on only portions of a system. This choice provided the benefit of documenting existing leakage fraction and sealing

Duct Leakage & Retrofit Duct Sealing in MN C&I Buildings COMM-54682 | Dec 2016 Center for Energy and Environment 70 | P a g e
for a wider variety of systems. The drawback was that sealing a smaller fraction of the system did not often provide the ability to easily achieve measurable effects on energy.
Observations on the effect of concomitant changes on the cost effectiveness of retrofit duct sealing are detailed below.
1. Concomitant changes for VAV systems are not expected to adversely impact cost-effectiveness of retrofit duct sealing. VAV systems have the distinct advantage in that savings can be realized with simple control changes, or in many cases, automatically, as the system adjusts to lower fan power requirements.
2. Relatively “simple,” CAV fan powered systems such as exhaust risers or large upstream supply branches may not achieve full cost-effectiveness (by up to 20%) after adding the cost of necessary changes. Simple flow balancing (duct velocity traverses) and pulley change outs are typical additional marginal costs (<$1,000). However, costs increase if more labor intensive flow rate measurements are necessary.
3. The sealing of complex CAV systems, such as downstream sections with diffuser outlets, will be less cost effective if rebalancing is necessary. Because rebalancing diffuser flows is labor intensive cost-effectiveness may be decreased by 20%-50%. Unfortunately, pre-sealing diagnostic procedures have not yet been developed to predict the distribution of leaks so the need to correct post-sealing flow imbalances is only discovered by measurement after the fact.
Screening and Duct Leakage Diagnostics
In most cases, we expect that duct leakage measurements separate from the sealing process are cost prohibitive and that qualitative screening criteria and simple measurements are the tools available to estimate leakage and sealing cost effectiveness. Possible duct leakage screening methods are listed below.
Information Sources
Plans and Other Documentation
System, building, and project plans and documents as well as commissioning reports and testing, adjusting and balancing (TAB) reports were not useful as the only source of information for evaluating duct leakage, and generally, they were either unavailable or incomplete. Nonetheless, when available these were the most valuable and reliable sources of information and “context” for every system screening. Screening is more time consuming and less effective without system documentation.
Mechanical & HVAC Building Plans are essential and the fastest way to guide an investigator through a system. Additionally, they are the major source of information for bidding and planning sealing work. Inaccurate or unavailable plans add significant overhead in screening for duct leakage.
In theory, Commissioning and TAB Reports by themselves or potentially coupled with simple calculations from design documents can support a hypothesis that ducts are leaky. As such they should be examined first and their results should inform the screening process. In practice their

Duct Leakage & Retrofit Duct Sealing in MN C&I Buildings COMM-54682 | Dec 2016 Center for Energy and Environment 71 | P a g e
utility was often restricted to providing more up-to-date information than found in building plans or design documents. Measured flow rates were in disagreement with TAB data by values on the order of anticipated duct leakage, which made it difficult to estimate duct leakage from TAB data alone.
Automation system data or other preexisting measurements may provide a more current source for system information compared to documentation, but the utility of these data and details will vary strongly from site to site. Airflow sensors and pressure sensors are the most useful (building automation system) BAS points. In theory a well-instrumented HVAC system could provide enough data to deduce duct leakage by providing airflow rates at two places in the duct system. Practically it is more likely to provide only some supporting indication of leakage or substitute for one of the necessary time-consuming measurements. The main limitation will be the absence or the lack of reliability in airflow sensors. Only one building in the study was equipped with reliable flow stations at either end of the duct section. In this case the accuracy of the station was sufficient for BAS control (+-10%), but insufficient to estimate duct leakage. Investigators should be careful about drawing leakage conclusions based on BAS data alone, especially absent data quality verification. Questions that may be resolved from documentation and the automation system are:
1. What are the operating flows and pressures in the system? 2. Where is the fan operating with respect to design? 3. Is there any evidence that equipment was adjusted or replaced during commissioning or
balancing to mitigate duct leakage or insufficient performance? 4. Is there any evidence of insufficient flow, pressure, or heating & cooling, particularly at
the end of branches?
System Trace
Inevitably tracing or walking out the system is necessary in a duct leakage screening process. In the best case, its purpose is to confirm data and information obtained from HVAC plans. In the worst case it’s the only way to learn anything about a duct system. Likely it is necessary to fill and validate information from other sources of data. If an Aeroseal process is considered for retrofit duct sealing, a complete system trace is necessary to verify the absence of undocumented openings (large leaks) and verify the completeness of blocking, especially in sensitive environments. Questions that can often be answered though system trace are:
1. What is the condition of the duct work? 2. Does the ductwork match the plans? Are there undocumented branches or openings? 3. How “complicated” is the ductwork? Is there a lot of branching, size changes, and
bends? 4. Can the system be partitioned in a logical and accessible way?
Operating Pressure
Operating pressures, obtained from any source, are an important and necessary variable in screening systems for duct leakage. Pressures can initially be obtained from any source (BAS, control panel, documentation, etc.), but pressure measurements are simple and fast enough that they should be used to validate other sources or provide additional information. Some specific points to consider include:

Duct Leakage & Retrofit Duct Sealing in MN C&I Buildings COMM-54682 | Dec 2016 Center for Energy and Environment 72 | P a g e
1. Absent BAS pressure points or recent documentation, a measurement is the only way to determine the current operating pressure.
2. Fan pressure can also be a useful measurement in some circumstances where the entire system is being evaluated. If one can simultaneously measure fan pressure and electric power, generate a system curve, and access a fan curve, then flow rates and operating points can be estimated for comparison to other documentation (e.g. TAB, commissioning, or design documentation) to further understand duct leakage.
3. Measuring pressure throughout a system, for example at the start of the main trunk and before the terminal unit on a long branch out, gives the investigator an estimate of the pressure drop in the system, and hence a better idea of the operating pressure that should be used in a pressurization test to estimate duct leakage for the whole system. The operating pressure is necessary to compute energy and cost savings, for example that would be reported to builder owner and utility.
4. Pressure logging over hours or days provides data for natural variations in system pressure (and potentially flow and leakage) with respect to spot measurements. This is useful for validating operating schedule, normal system fluctuations, and a baseline with which post-sealing results can be compared.
5. Characterizing the operating pressure is not part of the Aeroseal bidding, measuring, or sealing process
Temperature logging
Theoretically strategically placed temperature loggers can indicate duct leakage in some configurations. For example, during heating operation duct leakage from insulated supply ducts in ceiling return plenums would increase the temperature of the air pulled from the occupied space into the return. This temperature rise could be revealed by logging space, return, and supply temperatures over time. However, our efforts to deduce duct leakage from these measurements proved universally unsuccessful. Upon additional analysis, one needs large temperature differences between the return and supply and large leakage rates to overcome temperature probe uncertainty, heat transfer, envelope leakage, variations in space temperature, and uncertainty in plenum mixing.
Operators, Occupants, and Owners
Anecdotal data and the impressions of operators, occupants, and owners may assist a duct leakage investigation, but are likely unreliable as a main source or a quantitative indicator of duct leakage. Specific input is more valuable than either qualified or unqualified impressions. For example, “I felt air coming out of the seams when I was troubleshooting the VAV box on floor 12,” is significantly more useful and reliable than “I think the ducts are leaky.” Similarly with occupants, more specific information is also useful. It’s worth an investigators time to solicit general comments from operators, occupants and owners, but also to take the time to engage them and try to discern specific information that can be validated. In particular:
1. Can duct leakage be described specifically? 2. Is there inadequate ventilation or heating and cooling, particularly at the end of long
branches, in systems that otherwise meet design conditions (flow & duct static)?
Duct Leakage & Retrofit Duct Sealing in MN C&I Buildings COMM-54682 | Dec 2016 Center for Energy and Environment 73 | P a g e
Screening Criteria for Retrofit Duct Sealing
In review of the projects tested and sealed in this project, several important criteria were determined to have a substantial impact on duct leakage and the cost effectiveness of retrofit duct sealing. After a list and short description, these criteria are applied to the systems screened, tested, and sealed to deduce their screening efficacy. While these criteria are based on a relatively small sample set of systems, they form the basis for a process to be continuously assessed via a continued retrofit duct sealing pilot or efficiency program.
Operating Pressure
Duct leakage is proportional to operating pressure. Systems operating at high pressures are more likely to have substantial leakage, whereas systems at <0.1 “ w.g. can have large, open holes without consequential duct leakage. Guidelines follow:
Greater than 1” w.g.(Yes) Systems between 1 – 3 “w.g. have not typically been subject to leakage testing by code, hence sealing may be substandard or non-existent.
Greater than 0.5 - 1” w.g. (Marginal) These systems have the potential for moderate to large duct leakage.
Less than than 0.5 ” w.g.(No) These systems do not have large enough pressure differential to drive consequential duct leakage.
System Size
System size is important in two respects. First, larger systems have a greater potential for leakage flow rate to be sealed. Secondly they cost less per cfm-sealed. Guidelines follow:
Large 10,000 cfm-design systems (Yes) Even small to moderate leakage rates in large systems have the potential for consequential energy penalties and sealing is likely to be more cost-effective
Medium 4,000 – 10,000 cfm (Marginal) May have moderate to large energy penalties, but are less cost effective to seal, require consideration of more information.
Small <4,000 cfm (No) Small systems are likely to need disproportionately (20%+) large rates of duct leakage to make retrofit duct sealing cost effective.
Duct System Complexity
The major contribution to Aeroseal costs is the labor for duct blocking. Even traditional duct sealing measures will be more labor intensive for complex geometries by limiting sealing methods and decreasing accessibility. Guidelines follow:
Duct Leakage & Retrofit Duct Sealing in MN C&I Buildings COMM-54682 | Dec 2016 Center for Energy and Environment 74 | P a g e
More than 1000 cfm-design per duct blocking (Yes) Simple layouts of long straight ducts with relatively little branching are advantageous by reducing duct blocking labor, favoring trunks and large branches.
Between 300 and 1000 cfm-design per blocking (Marginal) These systems will tend to have higher labor costs for retrofit duct sealing, but may have other attributes that warrant consideration.
Less than 300 cfm-design per duct blocking (No) Systems with complicated layouts, significant branching, or otherwise excessive blocking; in most situations more than 1 blocking per 300 cfm is realized when final outlets (diffusers) must be blocked.
System Type
System types with different contributions to energy savings were identified. This criterion was successfully used to avoid additional investigation of systems with low energy saving potential. In light of the disproportionate contribution of fan energy to cost effectiveness, systems with fan only energy savings should be more strongly considered in the future, including fully-ducted returns due to increased fan energy savings.
Fan energy and thermal energy savings (Yes) Fan energy and thermal energy penalties due to the loss of conditioned air from the envelope.
1. Exhaust systems in conditioned space 2. Supply systems within ceiling return plenums 3. Make up air systems in unconditioned space
Fan energy savings (Yes) Fan energy penalties only.
1. Exhaust systems in unconditioned space 2. Supply systems with ducted returns
Low savings (No) Fan and thermal energy will likely only be redistributed to offer mainly non-energy benefits.
1. Systems with exposed ductwork
System Operation
18-24/day Operating hours (Yes) Systems that operate 18-24 hour days have 50% to 100% higher energy losses compared to systems that operate 12 hr per day
Apparent Duct Tightness
Unsealed ducts or deteriorated sealing (yes) Regular, sheet metal ducts with unsealed or deteriorated sealing have the potential for consequential duct leakage via the large distribution of small uniform leaks.

Duct Leakage & Retrofit Duct Sealing in MN C&I Buildings COMM-54682 | Dec 2016 Center for Energy and Environment 75 | P a g e
Sealed ducts, Spiral ducts, and welded ducts (No) Systems that are sealed or otherwise use tight construction methods are unlikely to have consequential duct leakage.
Large, inaccessible gaps (e.g. gypsum board ducts in multi-family exhausts) (No) Gypsum board ducts, inaccessible for conventional sealing measures, and especially amendable to large (5/8+” gap width) leakage areas at joints and transitions, are unlikely candidates for cost-effective sealing. We note here, that we are not making a general recommendation against gypsum board ducts, just those of the type encountered in this project. The recommendation for multi-family gypsum exhaust ducts is that they need to be visibly inspected (either accessible or use a remote system) to confirm that there are no large (> 3/8”) gaps or that those large gaps can be sealed with traditional techniques.
Outside air fraction
The fraction of return air that is exhausted outside has a direct impact on the energy loss of supply duct leakage into the return plenum. A higher fraction results in greater sealing savings.
High Outside air fraction (Yes) High outside air fractions, e.g. 100% make up systems have approximately 75% larger thermal energy penalties compared to systems with nominal (20% - 30%) outside air fractions. A higher fidelity assessment cannot be given because outside air fractions encountered in this study were effectively the same except for the 100% make up system.
Duct Inspection
The qualitative and subjective nature of this procedure suggests it be used to aid other measures for assessing duct leakage. Similarly documenting these findings along with other screening results will significantly increase their utility with increasing investigator experience. The following observations are more important at locations corresponding to high surface area leaks, e.g. joints, seams, and penetrations over point sources such as unsealed TAB ports.
1. Visual leakage - Duct leakage over time can develop fouling patterns as particles evacuate the ductwork and settle nearby in jet or starburst patterns (Figure 37). Large leaks can be spotted easily if duct work is inspected (Figure 38).
2. Audible leakage – Duct leakage can be heard, particularly in isolated deadened spaces (ceiling return plenums, exhaust shafts) Sounds vary in frequency and range from high pitch whistling to white noise.
3. Felt leakage – Duct leakage can be felt at seams and joints, particularly on the face or wet skin. On externally insulated ducts when leakage can be felt at insulation breaks, one must bear in mind the accumulation of duct surface over which that flow develops. What may seem as substantial leakages, may simply be the outflow of 10 cfm over a very large covered surface area
4. Sealing – The lack of sealing on slip & drive ductwork or the deterioration and cracking of prior sealant may be evidence of duct leakage, especially when deteriorated sealing corresponds to visual, audible, or felt leakage.

Duct Leakage & Retrofit Duct Sealing in MN C&I Buildings COMM-54682 | Dec 2016 Center for Energy and Environment 76 | P a g e
5. Accessories & Equipment Leakage– VAV boxes, diffuser collars, access panels, unsealed TAB holes all contribute to duct leakage, but are not by themselves, indicative of energy loss or cost effective sealing. Access panels, particularly spring lock and cam lock panels were particularly subject to leakage (Figure 39). Although the leakage amount was not quantified, leakage flows were nearly always observed at these panels. Generally the leakage was attributed to deformation of the panel or opening or significant degradation in the gasket. These types of leaks and losses are to be noted, but unless they are egregious and numerous; sealing these leaks should be left as a best practice for maintenance and TAB procedures.
Figure 37: Visible evidence of duct leakage; fouling caused by leakage over time (a) at slip drive
corner, (b) VAV box connection, and (c) a branch take off
(a) (b)
(c)
Figure 38: Example of major leakage path discovered via duct inspection: uncapped supply branch
sealed with damper only.

Duct Leakage & Retrofit Duct Sealing in MN C&I Buildings COMM-54682 | Dec 2016 Center for Energy and Environment 77 | P a g e
Figure 39: Access panels prone to leaking include spring lock and cam lock designs; deformation or
gasket degradation results in leakage
(a)
(b)
Application of Criteria in this project
The levels for the above criteria were developed from the systems encountered in this project in an attempt to find the most cost-effective projects. The results are given in Figure 40, where black fills indicate “yes,” stripped indicates “marginal,” and white fills indicate “no” to meeting the criterion. Many of the criteria were not obtained for all sites. The two primary reasons for this were 1) site rejection prior to complete investigation and 2) duct inspections were frequently prohibited by external insulation or accessibility.
System type was used explicitly to identify systems for screening in the recruiting process, thus all systems meet this criteria. If one isolates systems by each criteria, there are only three criteria that emerge to reasonably isolate good sealing opportunities systems from bad, albeit imperfectly. If one rejects systems that are apparently tight based on construction, 25 (40%) of systems are eliminated. This is unsurprising since this was generally observed throughout the study and confirmed by leakage measurements on some apparently tight systems.
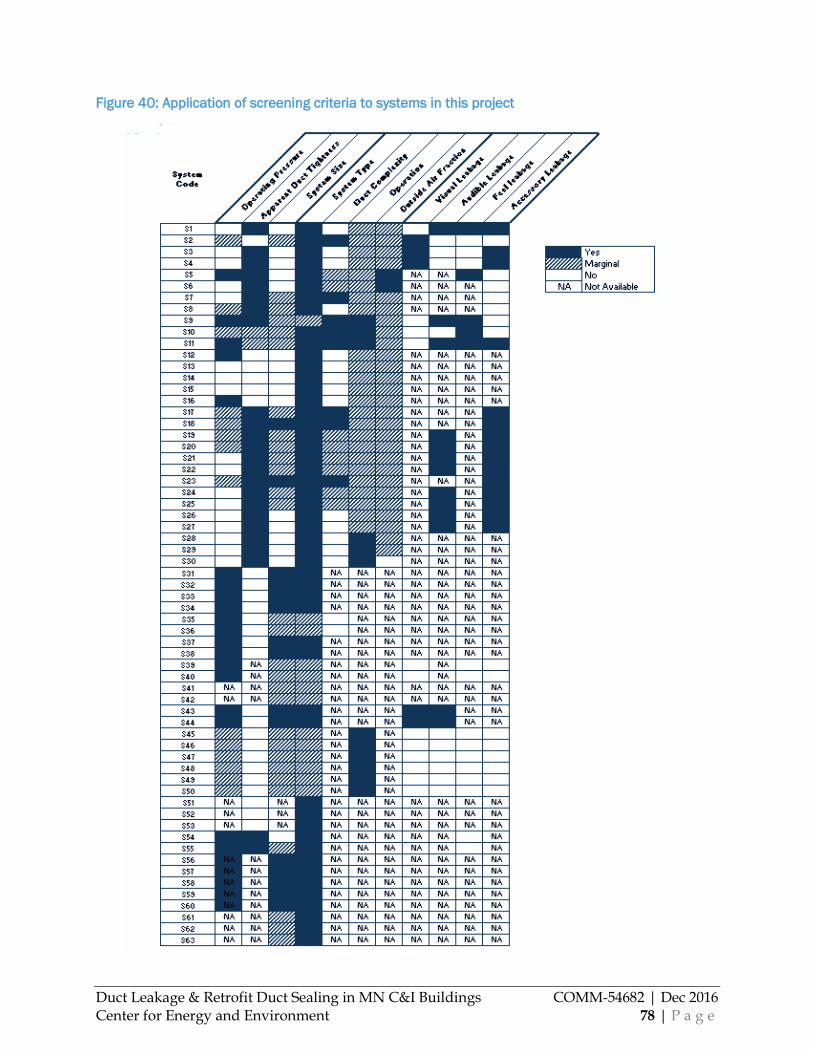
Duct Leakage & Retrofit Duct Sealing in MN C&I Buildings COMM-54682 | Dec 2016 Center for Energy and Environment 78 | P a g e
Figure 40: Application of screening criteria to systems in this project

Duct Leakage & Retrofit Duct Sealing in MN C&I Buildings COMM-54682 | Dec 2016 Center for Energy and Environment 79 | P a g e
If one rejects systems less than 4,000 cfm, 16 systems (25%) of the 63 systems are eliminated. Of the eliminated systems, 7 systems were sealed in this project, but 5 of these 7 systems had poor cost effectiveness (paybacks greater than 27 years). However rejecting on size would have removed systems S1 and S6, which were sealed, and had moderate paybacks periods of 9 and 10 years, respectively.
If one rejects systems less than 0.5” w.g. operating pressure, 18 systems (29%) are eliminated, including 11 of the 20 systems sealed in the project. Of these systems, 8 of 11 had poor cost effectiveness, with payback exceeding 27 years. Again systems S1 and S6 would have been rejected using this criteria, as well as S22, which had a moderate payback of 10 years.
Consequently, four criteria (system type, design flow, operating pressure, and apparent tightness) would have screened out 41 (65%) of the systems in this project. We would have screened out 20 (66%) of the systems that were tested for duct leakage and we would have screened out 13 (65%) of the systems that were eventually sealed. We leakage tested two systems that survived these criteria, S8 proved to be low leakage, and S9 could not be properly isolated to complete the test. Of the remaining sealed systems, the average and median paybacks drop to 15 years and 12.5 years from 31 and 17 years, respectively.
There is no way to choose criteria such that only cost effective sealing jobs remain, thus they are far from perfect. In the best case, we lose a few cost effective projects and keep a few projects that are not cost effective. However, on the whole, we see a relatively large increase in cost effectiveness. A major advantage comes from the fact that very little effort is necessary to evaluate systems based on these criteria. Hence, they may be an appropriate starting point for future work looking to identify cost effective retrofit duct sealing opportunities.
We also note that, in this project, visual, audible, and felt leakage were, by themselves, inadequate indicators of duct leakage or cost effective opportunities. They may assist other screening measures, but a frequent barrier to a duct inspection is external insulation.

Duct Leakage & Retrofit Duct Sealing in MN C&I Buildings COMM-54682 | Dec 2016 Center for Energy and Environment 80 | P a g e
Discussion
Observations on Duct Leakage Measurements
Duct leakage was measured using a combination of pressurization testing (uncertainty ±3%), a tracer gas technique (±2 - 5%), a powered flow hood (±3%), and a TrueFlow Meter (±7%). The TrueFlow Meter, powered hood, and tracer gas measurements are considered “as-operated” measurements because in theory, they measure duct leakage noninvasively while the system is under normal operation. In contrast, pressurization (or depressurization) tests require that the system be shut down with the grilles and openings to other portions of the ductwork sealed. Calibrated test fans are then used to measure the flow rate (duct leakage from the sealed system) over a range of pressures. The relationship between flow rate and operating pressure is used to estimate leakage at the average system average operating pressure. In some cases it may be difficult to determine the correct operating pressure. While measurements by Wray et al. (2005) suggested that pressurization tests may over estimate duct leakage due to spatially varying operating pressures, care was taken in this study to isolate duct sections such that reasonably uniform operating pressures were obtained per section.
For 19 duct leakage measurements both pressurization and one of the as-operated techniques were used to measure duct leakage. A detailed comparison of these measurements is given in Appendix C. Practical observations about the tracer gas technique and the pressurization tests inherent to the Aeroseal process are given in the Appendix. Conclusions from these comparisons and observations are given below.
In summary, the error for supply system tracer gas flow rate measurements was too high to provide accurate estimates of as-operated duct leakage. The technique needs to be applied downstream of large scale turbulence or other methods must be developed to generate better mixing.
Despite the advantages of the pressurization test, it is typically too expensive to use the test as a diagnostic technique for identifying ductwork that would be cost-effective to seal. The cost to perform the pressurization test is estimated at 70% to 80% of the cost of the actual retrofit duct sealing using the Aeroseal process, because the two procedures are very similar. Most of the labor for both retrofit duct sealing via Aeroseal and pressurization testing is used for blocking and sealing-off sections of ductwork. The Aeroseal process includes preliminary pressurization measurements as well as post-sealing measurements. While an advantage of the Aeroseal process compared to traditional alternatives, it presents a serious dilemma for identifying retrofit duct sealing projects. Performing the test as an independent diagnostic procedure followed by a separate visit to seal the ducts nearly doubles total project cost.
Observations of Retrofit Duct Sealing
One or more members of the project team were present for the majority (9 of 11) sealing jobs and made a number of general observations, which are detailed in this section.
The two contractors were initially inexperienced with retrofit duct sealing; this is because this type of duct sealing for C&I buildings is a new service in Minnesota and no contractors have yet

Duct Leakage & Retrofit Duct Sealing in MN C&I Buildings COMM-54682 | Dec 2016 Center for Energy and Environment 81 | P a g e
performed enough jobs to be considered “experienced.” Thus, they were representative of contractors who are likely to provide duct sealing services while this becomes an established service offering. Both contractors have significant background working on HVAC systems, specifically with duct cleaning and insulation, including installation, removal, and abatement. The contractor who applied traditional measures (C1) was inexperienced with duct sealing and had to deploy new, but largely familiar, tools for the sealing process. The contractor who used the Aeroseal process (C2) acquired the necessary license and equipment and underwent manufacturer’s training on the process during the course of this study. To the knowledge of the project staff, the systems sealed in this project constituted a significant fraction of the contractor’s sealing projects to date.
The most challenging part of the Aeroseal process is operating the custom application machinery, which requires significantly more knowledge, skill, and training than any of the other work involved in the sealing process. C2, still on the learning curve, encountered one or more unexpected problems relating to either the machinery or the duct blockage in virtually all of the sealing jobs in this project. None of the problems kept properly screened jobs from being completed. In the case of the multi-family exhaust systems, the failures were because their design rendered them incompatible with retrofit duct sealing and they would have been excluded had this been known in advance.
Aeroseal Retrofit Duct Sealing
As observed in this study, the Aeroseal process consists of three components: setup, blocking, and sealing. More specifically, Aeroseal’s training for contractors consists of a 7 step process:
1. Duct system inspection 2. AHU (upstream) isolation 3. Diffuser (downstream) blocking 4. Pre-testing 5. Sealing 6. Post-testing, and 7. Rebalance/adjustment.
The first and last hour of the job were largely devoted to setup; moving equipment, setting up equipment, and cleaning up at the end of the day. We estimate about 75% of the labor (4-6 hours) per day of the job is devoted toward blocking ducts and then removal of the blocking from ducts after the treatment. The third task, pressurization testing and sealing (the Aeroseal process) generally accounts for about 10% of the time on site (~1 hr).
In jobs with large number of openings to be blocked, additional labor was brought in specifically for this step. It is assumed that the skill level for temporarily sealing openings is less than that required to operate the custom Aeroseal machine, which explains the fact that these jobs did not differ much in cost from jobs without supplemental labor needs. For the systems in the study, every job required essentially the same equipment and setup time. The main differentiating factor in time and cost of the sealing jobs was the amount of blocking necessary.
Blocking off ductwork typically consists of custom cutting and fitting foam slabs to match the cross sectional area of the ductwork. Foam pieces are then temporarily fixed in place with an elastic tape. Duct blocking examples are shown in Figure 41. In Figure 41(a) foam blocking is

Duct Leakage & Retrofit Duct Sealing in MN C&I Buildings COMM-54682 | Dec 2016 Center for Energy and Environment 82 | P a g e
taped into place against a reheat coil as shown from outside the access panel opening. In Figure 41(b) the diffuser cone is removed and a round foam slab is inserted and taped into the diffuser collar. For the sealing jobs in this study, foam slabs ranged from 6” diameter pieces to block diffuser inlets to multiple 2x3 ft sections required to fill up to 48” x 60” sections of ductwork. Any ducts that were larger than 2x3 ft typically required multiple foam slabs and backing rods to support the foam when pressurized by the sealant system (up to 600 Pa).
Figure 41: Duct blocking is necessary to isolate a section of ductwork for the Aeroseal process (a) A
foam blocking is taped into place against a reheat coil as shown from outside the access panel
opening and (b) the diffuser cone is removed and a round foam slab is inserted and taped into the
diffuser collar.
(a)
(b)
The required labor, and hence most of the sealing costs, for the jobs in this project were directly related to the amount of blocking necessary and the accessibility of the sections that needed to be blocked. While a larger size (e.g. flow rate or duct length) system will generally require more blocking, other variables impact the amount of blocking so that there is not always a strong relationship between system size and blocking costs. For example, large systems with few blocking sites required a low amount of labor, while small systems with many blocking sites required a large amount of labor. Large, upstream supply runs (S18, S23) required blocking at one to two upstream locations and at three to five downstream VAV or reheat coils. Large exhaust risers (S10, S11) required the lowest labor because blocking is only required at each end of the system. On the other hand, small exhaust systems, such as those found in multifamily buildings in this study, tended to be the most expensive systems to seal as they did not allow isolation of the riser portions. Instead, they required blocking at 10 to 30 inlet locations and therefore a relatively large amount of labor relative to their flow rate. Downstream portions of supply systems (post VAV box or reheat coil) sealed in this study were similar as they required blocking at the reheat coil and at each diffuser outlet (typically 7 to 14), another large number when compared to the relatively low flows.
The sealing equipment is usually setup and idle while the blocking is finished. The pressurization and sealant delivery system is shown in Figure 42. Two fan boxes are used to pressurize the duct system and carry the aerosol sealant into the ducts. They also contain the calibrated fans used to measure the leakage flow rate. The fan boxes feed the heated injection

Duct Leakage & Retrofit Duct Sealing in MN C&I Buildings COMM-54682 | Dec 2016 Center for Energy and Environment 83 | P a g e
system, which heats and aerosolizes the sealant before delivery. The injection system connects through the ductwork through an access panel opening using a poly tube. A pressure sensor for measuring duct pressure is inserted at the connection to the ductwork.
Once the blocking is complete, a pre-leakage flow estimate is made via a pressurization test using the Aeroseal equipment. Sealing commences immediately after the test. The Aeroseal equipment injects liquid sealant combined with compressed air through a nozzle that creates an aerosol under conditions which are controlled for temperature and fan flow. A fan at the access point into the duct work simultaneously blows the aerosol into the ductwork and pressurizes the sealed section so the only escape path for the aerosol sealant (carried by the fan airflow) are the leaks in the duct. As the leaks are sealed, the total leak area decreases causing the system pressure to increase. The duct sealing continues until the rate of sealing reaches a point of diminishing returns. This stage typically occurs around 600 Pa system pressure, but sealing can continue until 900 Pa of pressure if necessary. The system flow rate is reduced if the pressure gets too high. The actual sealing occurs as the air, carrying the sealant, escapes the duct. The aerosol sealant sticks onto the edge of the gaps and then agglomerates onto itself and fills the void with a flexible elastomeric seal.
Figure 42: Aeroseal equipment for pressurization testing and sealant delivery setup and ready

Duct Leakage & Retrofit Duct Sealing in MN C&I Buildings COMM-54682 | Dec 2016 Center for Energy and Environment 84 | P a g e
To ensure adequate sealing delivery, the operator adjusts the system’s pump and fan settings based on a real-time graph that shows the calculated leakage rate (based on an assumed operating pressure). The graph helps the operator monitor and control the sealing rate, identify any problems (in the case of an atypical trend in the sealing line), and determine when the job can be considered complete. The system software also has automated features such as a safety shut-down when there is a sudden loss of pressure that would occur if the blocking releases. Most of the other workers are idle during the sealing process, although some, who had gained experience with the sealing process, were sometimes needed to address problems that arose during sealing.
During sealing problems related to the machinery often took longer to correct than the actual sealing time. However this typically did not adversely affect leakage reduction, but added time and cost. The problems observed during the Aeroseal process which caused delays included:
Exceeding pressure limits during the sealing process, which caused the equipment to malfunction. This was resolved by troubleshooting, part replacement, or restarting the sealing process.
Exceeding duct pressure limits during sealing, which caused access panels to be blown off and/or sealing connections to rupture. This was resolved by halting the sealing process, troubleshooting, and restarting the process.
Discovering that not all duct openings had been blocked, primarily due to undocumented diffusers and branches. This required halting the process to complete the blocking. In several instances, the leakage of the sealant into open spaces had to be remediated by deploying HEPA filters for filtering any excessive aerosolized sealant from the air.
The presence of leaks too large for the Aeroseal process, which allowed sealant to escape and fog the surrounding space. This required the deployment of the HEPA filters to evacuate the aerosolized sealant from the air and make a determination whether Aeroseal could be effective (i.e. multifamily exhausts).
The quantity of sealant used in the process is quite small, about a gallon or less for most systems. Of this, a significant portion condenses before it leaves the injection system (Figure 43 (d)) and does not enter the ductwork. Another significant portion of sealant condenses on the collar (Figure 43 (c)) that connects the sealing equipment to the ductwork system, likely due to the complex flow and pressure distributions in this area. Thus, the sealant that is injected into the ducts is a fraction of what is actually used. Multiple observations during this project confirmed that sealant was generally confined to leakage paths (Figure 43(a) and (b)) and that adherence to other ductwork portions was negligible, which is consistent with Aeroseal claims.

Duct Leakage & Retrofit Duct Sealing in MN C&I Buildings COMM-54682 | Dec 2016 Center for Energy and Environment 85 | P a g e
Figure 43: Aeroseal accumulation in ducts (a) fill of ¼” drilled hole (external view), (b) fill of 3/8” pre-
existing corner hole at transition, (c) accumulation of sealant in collar, and (d) accumulation of
sealant in poly tube near injector system
(a)
(c)
(b)
(d)
The Aeroseal process works well and reduces duct leakage substantially. As contractors gain experience with this process, including not only sealing, but also duct blocking, bidding, and estimation, there will be improvements in the fraction of leakage area sealed and cost effectiveness of the process. Similarly development of Aeroseal’s evolving platform and training procedures should increase contractor ability and generally improve duct sealing results.
Retrofit Duct Sealing using Traditional Measures
The mobile sealant delivery system used by Contractor C1 is considered to be a traditional measure because the methods have been largely used to seal ductwork in the past, although typically on new construction. This system uses a liquid sealant that is applied to joints and seams externally as shown in Figure 44(a). The most basic external sealing method is the manual application of butyl tape to longitudinal seams, transverse joints, and equipment take offs and transitions. In Figure 44(b), a worker has prepared duct access for the application of

Duct Leakage & Retrofit Duct Sealing in MN C&I Buildings COMM-54682 | Dec 2016 Center for Energy and Environment 86 | P a g e
butyl tape to the longitudinal seams. A newer method, borrowed from duct cleaning operations uses a robot to seal ducts internally using a rotating spray nozzle, is shown in Figure 44(c). The same mobile sealant delivery system is used for both internal and external sealing.
Figure 44: Traditional sealing measures including (a) external mastic spray, (b) external taping
(shown during preparation stage), and (c) internal mastic spray
(a) (b)
(c)
Both the spray and tape methods were observed to be highly successful after some initial fine tuning of the nozzles. Examples of sealing from these systems are shown in Figure 44. The external nozzle on the mobile delivery system had the advantage that joints, seams, penetrations, and transitions could be specifically targeted and the disadvantage was that the environment (confined ceiling plenums) is often awkward and, particularly longitudinal seams, difficult to target, access, and verify sealing. In addition, the spray wand operator could only seal approximately 3-4 feet before moving, which involved disentangling themselves from the dropped ceiling, moving their ladder, and starting again at the next location. The robot had the significant advantage that it could very quickly traverse straight, horizontal sections of ductwork, especially compared to slower external movement of a human. The disadvantages of the robot were that the vast majority (estimated 95% or more) of the liquid sealant was applied to areas of the duct that did not need sealing and that the robot could not traverse vertical sections or transitions and required a significant setup period. While taping seams externally appears effective, it was the most labor intensive job observed and can only be used when there is easy access to the duct work.

Duct Leakage & Retrofit Duct Sealing in MN C&I Buildings COMM-54682 | Dec 2016 Center for Energy and Environment 87 | P a g e
Figure 45: Sealing results from (a) external mastic spray over slip and drive transverse joint and (b)
internal mastic spray over longitudinal seam and branch out.
(a)
(b)
While experiences with the traditional measures were limited, observations indicate that these sealing methods can be as successful as the Aeroseal method when the right conditions are present. Additional experience with the different methods, particularly when to apply one over the other, will result in the ability for contractors to select the method that will provide the fastest and most effective sealing for a given duct system.
The limitation of the traditional methods with respect to the Aeroseal method is duct access. Duct accessibility severely limits the applicability of traditional measures. One of the most commonly encountered limitations was the existence of external insulation on ductwork, which makes it impossible to use external sprays or tapes. Additionally the lack of access to risers and ductwork in closed wall and ceiling areas prevents these methods from being used universally.
Although neither contractor had much prior experience, both were able to complete all of the sealing jobs without exceeding their preliminary cost estimates. It is likely that with additional experience and optimization, duct sealing by either method will become a more efficient and effective process, leading to reduced sealing costs.
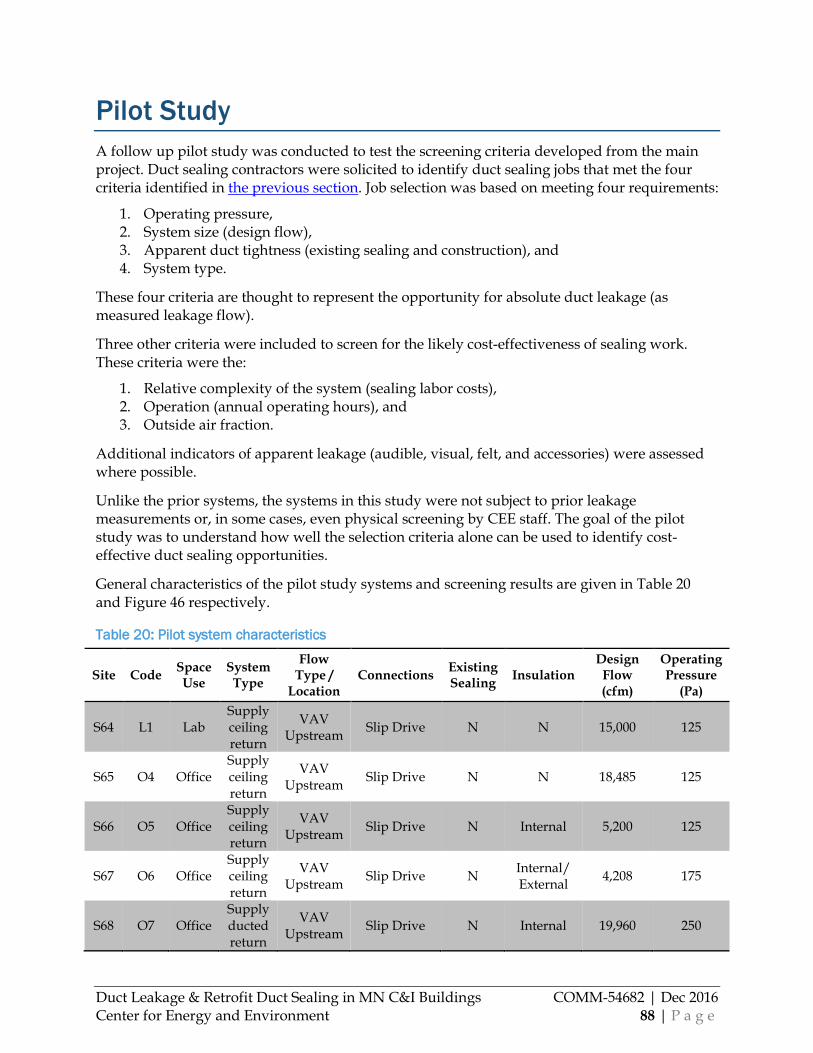
Duct Leakage & Retrofit Duct Sealing in MN C&I Buildings COMM-54682 | Dec 2016 Center for Energy and Environment 88 | P a g e
Pilot Study
A follow up pilot study was conducted to test the screening criteria developed from the main project. Duct sealing contractors were solicited to identify duct sealing jobs that met the four criteria identified in the previous section. Job selection was based on meeting four requirements:
1. Operating pressure, 2. System size (design flow), 3. Apparent duct tightness (existing sealing and construction), and 4. System type.
These four criteria are thought to represent the opportunity for absolute duct leakage (as measured leakage flow).
Three other criteria were included to screen for the likely cost-effectiveness of sealing work. These criteria were the:
1. Relative complexity of the system (sealing labor costs), 2. Operation (annual operating hours), and 3. Outside air fraction.
Additional indicators of apparent leakage (audible, visual, felt, and accessories) were assessed where possible.
Unlike the prior systems, the systems in this study were not subject to prior leakage measurements or, in some cases, even physical screening by CEE staff. The goal of the pilot study was to understand how well the selection criteria alone can be used to identify cost-effective duct sealing opportunities.
General characteristics of the pilot study systems and screening results are given in Table 20 and Figure 46 respectively.
Table 20: Pilot system characteristics
Site Code Space Use
System Type
Flow Type /
Location Connections
Existing Sealing
Insulation Design
Flow (cfm)
Operating Pressure
(Pa)
S64 L1 Lab Supply ceiling return
VAV Upstream
Slip Drive N N 15,000 125
S65 O4 Office Supply ceiling return
VAV Upstream
Slip Drive N N 18,485 125
S66 O5 Office Supply ceiling return
VAV Upstream
Slip Drive N Internal 5,200 125
S67 O6 Office Supply ceiling return
VAV Upstream
Slip Drive N Internal/ External
4,208 175
S68 O7 Office Supply ducted return
VAV Upstream
Slip Drive N Internal 19,960 250

Duct Leakage & Retrofit Duct Sealing in MN C&I Buildings COMM-54682 | Dec 2016 Center for Energy and Environment 89 | P a g e
Figure 46: Pilot screening characteristics
The systems chosen for the pilot were conventional in most respects. They were all VAV supply systems of slip and drive sheet metal construction, and they all consisted of ductwork upstream of VAV boxes with the exception of S67 where one portion downstream of a VAV box was also sealed. None of the systems had existing sealing.
Systems sealed in this pilot either fully or marginally satisfied the four screening criteria. None of these systems had tight duct construction or existing sealing. The supply ductwork was located within a ceiling plenum return, with the exception of S68 which had a fully-ducted return. Three systems (S64, S65, and S68) had design flows greater than 10,000 cfm and fully-satisfied the size criterion. Systems S66 and S67 were between 4,000 and 10,000 cfm and marginally satisfied this criterion. The operating pressure criterion was marginally satisfied for four of the five systems with operating pressures between 0.5 and 1 in. w.g. System S68 had an operating pressure greater than 1 in. w.g.
Of the factors expected to improve the cost effectiveness of sealing (duct complexity, operation, and outside air fraction), these criteria were fully or marginally satisfied. Four systems operated with outside air fractions greater than 20%, while one system (S67) had an outside air fraction of only 10%. System S67 was run for a relatively low number of hours per year (< 3000 hr/yr), whereas the other systems had a higher number of operating hours. Two systems (S65, S66) were run 24x7.
As for assessing apparent leakage success was mixed, as was the case with the prior work. While there were strong indicators of duct leakage in systems S67 and S68, these indicators were difficult to qualify and relate to other screening criteria.
Results
Sealing results for the pilot are given in Table 21. In all five cases initial leakage fractions were much larger than the mean and median leakage fraction of prior results (Table 12). The pre-sealing mean and median leakage fractions for the pilot group were 29% and 23% respectively. In other words, application of the screening criteria resulted in the selection of systems that were more than four times as leaky as those in the main study. Leakier systems have a greater opportunity for increased sealed cfm compared to tight systems. This is an important result as it suggests that consulting basic information about a system will help emphasize those systems with high potential.

Duct Leakage & Retrofit Duct Sealing in MN C&I Buildings COMM-54682 | Dec 2016 Center for Energy and Environment 90 | P a g e
All systems in the pilot were sealed by the same contractor using the Aeroseal method. Duct leakage measurements were made by the sealing contractor, at first under the direction of CEE staff, later with oversight from CEE staff, and finally by the sealing contractor without CEE involvement. Duct sealing was largely successful in these systems. Ninety percent or greater duct leakage was sealed in systems S64, S65, and S66. In system S67, 84% duct leakage was sealed, approximately matching Aeroseal assumptions of 85% duct sealing. System S68 stands out with a relatively low fraction sealed (68%) and a large fraction (21%) of leakage post-sealing.
The three systems that were internally lined (S66, S67, and S68) required more sealant and longer sealing times. In the case of S66 and S67, the final sealing fraction was still quite low, 3% and 4% respectively. However, the sealing work on S68 was significantly impeded by the internal lining, which was probably due to a combination of its very large surface area and length compared to S66 and S67. In system S68 the actual sealing times were lower than desired due to overtime restrictions written into the contract. Sealing was halted before the typical 85% target was reached due the limited window of time that the sealing could be completed. The contractor also estimated that continuing to seal this system until the typical 85%+ rates would have incurred an extra $2,000 - $3,000 in sealant costs. While it is reasonable to expect that longer sealing times would have achieved more sealing, it likely would have impacted cost effectiveness. Nonetheless the final leakage fraction of 21% is quite high and fairly unprecedented for an Aeroseal project.
Table 21: Pilot sealing results
System Code
Design Flow (cfm)
Operating Pressure
(Pa)
Pre Leakage
(cfm)
Pre Leakage Fraction
(fL)
Sealed Leakage
(cfm)
Sealed Leakage
(%)
Final Leakage
(cfm)
Final Leakage Fraction
(fL)
S64 15,000 125 1,710 11% 1,531 90% 179 1%
S65 18,485 125 2,687 15% 2,640 98% 47.5 0%
S66 5,200 125 1,622 31% 1,483 91% 139.5 3%
S67 4,208 175 953 23% 796 84% 156.5 4%
S68 39,920 250* 26,347 66% 17,920 68% 8427 21%
Mean 16,563 160 6,664 29% 4,874 86% 1,790 6%
Median 15,000 125 1,710 23% 1,531 90% 157 3%
* Representative pressure, actual system operates over a range of pressures up to 840 Pa (Plenum) to -130 Pa (Return)
Systems that were excluded from the pilot after failing the screening requirements are not documented here, in part because CEE did not play a central role in pursuing system leads and thus does not have significant statistics to present as to the ratio of selected versus rejected systems.
Cost-effectiveness was vastly improved in this pilot where the aim was to identify cost-effective opportunities. With the exception of S67, payback was reduced by over a factor of 2 from the selection of systems meeting these criteria in the main project and by a factor of 4 compared to all systems sealed.
Pilot sealing costs are detailed in Table 22. The values for cost of the sealing work per design cfm were in the range of prior results, but were overall higher as a group. The mean and
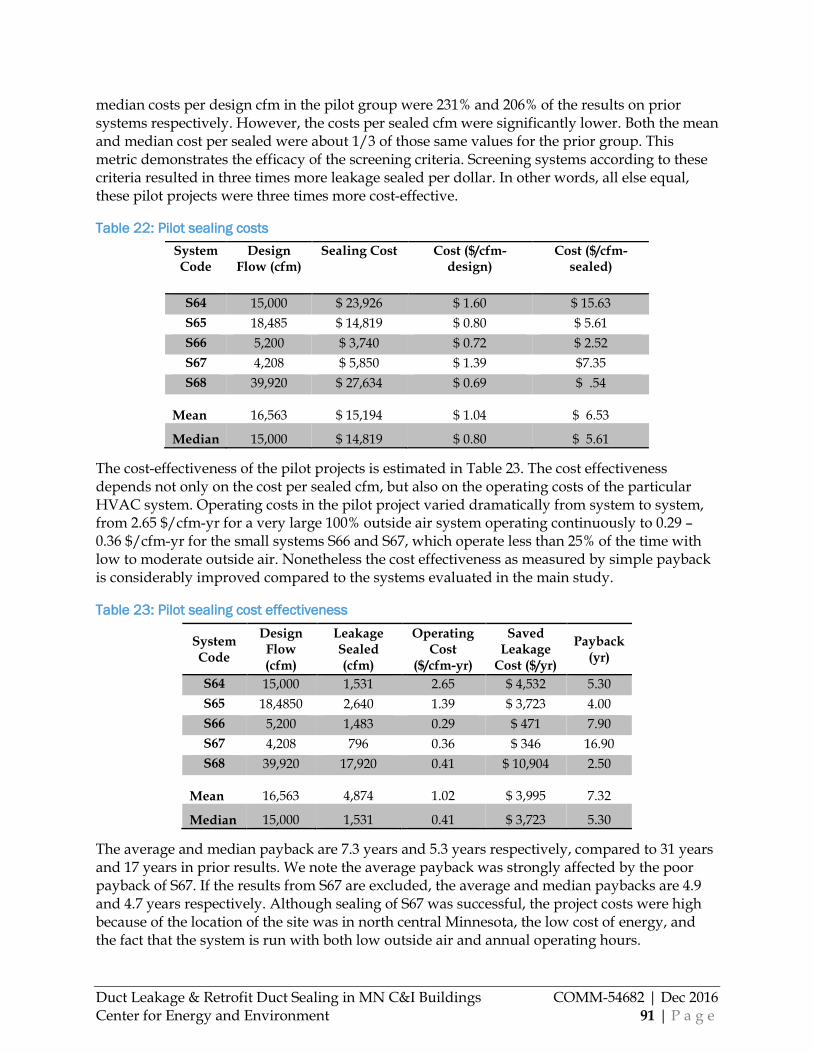
Duct Leakage & Retrofit Duct Sealing in MN C&I Buildings COMM-54682 | Dec 2016 Center for Energy and Environment 91 | P a g e
median costs per design cfm in the pilot group were 231% and 206% of the results on prior systems respectively. However, the costs per sealed cfm were significantly lower. Both the mean and median cost per sealed were about 1/3 of those same values for the prior group. This metric demonstrates the efficacy of the screening criteria. Screening systems according to these criteria resulted in three times more leakage sealed per dollar. In other words, all else equal, these pilot projects were three times more cost-effective.
Table 22: Pilot sealing costs
System Code
Design Flow (cfm)
Sealing Cost Cost ($/cfm-design)
Cost ($/cfm-sealed)
S64 15,000 $ 23,926 $ 1.60 $ 15.63
S65 18,485 $ 14,819 $ 0.80 $ 5.61
S66 5,200 $ 3,740 $ 0.72 $ 2.52
S67 4,208 $ 5,850 $ 1.39 $7.35
S68 39,920 $ 27,634 $ 0.69 $ .54
Mean 16,563 $ 15,194 $ 1.04 $ 6.53
Median 15,000 $ 14,819 $ 0.80 $ 5.61
The cost-effectiveness of the pilot projects is estimated in Table 23. The cost effectiveness depends not only on the cost per sealed cfm, but also on the operating costs of the particular HVAC system. Operating costs in the pilot project varied dramatically from system to system, from 2.65 $/cfm-yr for a very large 100% outside air system operating continuously to 0.29 – 0.36 $/cfm-yr for the small systems S66 and S67, which operate less than 25% of the time with low to moderate outside air. Nonetheless the cost effectiveness as measured by simple payback is considerably improved compared to the systems evaluated in the main study.
Table 23: Pilot sealing cost effectiveness
System Code
Design Flow (cfm)
Leakage Sealed (cfm)
Operating Cost
($/cfm-yr)
Saved Leakage
Cost ($/yr)
Payback (yr)
S64 15,000 1,531 2.65 $ 4,532 5.30
S65 18,4850 2,640 1.39 $ 3,723 4.00
S66 5,200 1,483 0.29 $ 471 7.90
S67 4,208 796 0.36 $ 346 16.90
S68 39,920 17,920 0.41 $ 10,904 2.50
Mean 16,563 4,874 1.02 $ 3,995 7.32
Median 15,000 1,531 0.41 $ 3,723 5.30
The average and median payback are 7.3 years and 5.3 years respectively, compared to 31 years and 17 years in prior results. We note the average payback was strongly affected by the poor payback of S67. If the results from S67 are excluded, the average and median paybacks are 4.9 and 4.7 years respectively. Although sealing of S67 was successful, the project costs were high because of the location of the site was in north central Minnesota, the low cost of energy, and the fact that the system is run with both low outside air and annual operating hours.

Duct Leakage & Retrofit Duct Sealing in MN C&I Buildings COMM-54682 | Dec 2016 Center for Energy and Environment 92 | P a g e
The success of simple screening criteria advances the opportunity for claiming energy savings from retrofit duct sealing. We have previously demonstrated that retrofit duct sealing, particularly the Aeroseal method, works to tighten ductwork. However, finding opportunities by direct measurement is not cost effective. In absence of direct measurements, we have a short list of criteria that, when applied in practice, works to identify high-leakage systems. The leakage measurements that accompany an Aeroseal retrofit duct sealing job have proved to be a very reliable measurement of sealed leakage. Furthermore, the energy penalties of duct leakage break down very simply to a ratio between the cost per leakage sealed and the facility cost of conditioning and moving ventilation air. Thus we have demonstrated the ability to identify systems with a higher propensity for duct leakage and estimate the energy and cost savings from retrofit duct sealing work.
The results of this pilot reinforce the notion that there are some system characteristics that, while not impacting the quantity of duct leakage, do play a role in the cost-effectiveness of a project. Energy and cost savings are proportionate to annual operating hours and outside air fraction. The cost of duct sealing work increases for systems with complex geometries and significant branching. These criteria should be considered after systems with a potential for high leakage are identified.
During the pilot period a “Duct Leakage Scorecard” was independently developed by Aeroseal to identify duct leakage opportunities. The Scorecard (Appendix H) takes a different approach than the one used in this pilot by assessing duct leakage via a visual duct inspection process. It is essentially an expanded version of our inspection criteria that relied on visual, audible, felt, and accessory leakage. It consists of 15 questions designed to identify various paths of duct leakage. The responses to these questions are assigned a score that is ultimately used to estimate a leakage rate. As before, this information can be a useful adjunct, but it does not consider operating pressure or flow rate, two factors that are the basis for absolute leakage flow and any subsequent opportunities. We imagine its best use would be for an inspection following a preliminary estimation of opportunity that was based on flow, pressure, system type, and tightness of construction.
Duct Leakage & Retrofit Duct Sealing in MN C&I Buildings COMM-54682 | Dec 2016 Center for Energy and Environment 93 | P a g e
Conclusions
This project investigated duct leakage in Minnesota commercial and institutional buildings in three major phases. In the first phase, duct leakage was measured in a variety of types of systems and buildings to characterize representative leakage rates. In the second phase, buildings were sealed with both conventional and aerosol based methods to assess the efficacy of retrofit duct sealing and the associated energy impacts. In the final phase, a short pilot study was conducted to test whether simple screening criteria can be used to identify cost-effective retrofit duct sealing opportunities.
Duct Leakage in Minnesota
Duct leakage varies greatly in commercial and institutional buildings in Minnesota, according to field work completed for this study. In portions of 27 air distribution systems, leakage rates varied between 0% and 29% of total flow. The average measured leakage fraction was 7% and the median leakage fraction was 5%. These values are one-half to two-thirds less than anticipated from previously published work. Seventy-five percent of systems had leakage fractions below 8%. Systems with existing sealing had a median leakage rate of 1%, demonstrating that duct sealing of some sort is crucial for obtaining very tight ductwork. Based on this sample, we expect that about 15% of systems have high enough duct-leakage rates (exceeding 10%) to justify pursuit of retrofit duct sealing. When screening criteria were applied during the pilot study, the average leakage fraction was 29% and the median leakage fraction 23%.
The energy penalties of duct leakage consist of wasted fan energy (and attendant fan heat), thermal energy for heating leakage air, and thermal energy for cooling/dehumidifying leakage air. Fan energy for conveying the air leakage was the most consistent energy penalty and the one that drives energy savings. Often the largest energy penalty is the energy wasted to heat ventilation leakage air during winter months; however the magnitude depends on the configuration of the air distribution system, the percent outside air, the presence of energy recovery, and infiltration or exfiltration rates. The energy wasted to cool outside air depends on similar factors and is usually much smaller due to Minnesota’s heating dominated climate. In a supply system within a ceiling return plenum, about 35% of the site energy penalty is on the electric side and 65% of the energy penalty is on the gas side. However, due to the difference in energy costs, about 70% of the cost savings are electric savings and 30% of the cost savings are gas.
Retrofit Duct Sealing
Retrofit duct sealing is very effective at reducing air leakage and its associated energy penalties as well as improving air distribution that was previously impacted by duct leakage. In most retrofit situations limited access to ductwork favors the Aeroseal aerosol duct sealing method over conventional measures. For this reason, the Aeroseal method became the preferred method in this study. The Aeroseal method was effective in a variety of scenarios, including both tight and leaky ductwork, supply and exhaust ductwork, downstream (post-VAV/reheat) ductwork, and upstream (pre VAV/reheat) ductwork. In addition, a significant advantage of the Aeroseal

Duct Leakage & Retrofit Duct Sealing in MN C&I Buildings COMM-54682 | Dec 2016 Center for Energy and Environment 94 | P a g e
method is the built-in measurement and verification of sealed leakage. The Aeroseal method begins and ends with pressurization tests to estimate duct leakage. When these tests are performed near the operation pressures, the results are sufficiently accurate to serve as the basis for savings estimates. Blocking ducts for pressurization and sealant delivery is the most expensive component of the Aeroseal sealing and pressurization testing process. Consequently, the cost for measuring duct leakage is only somewhat greater than the cost for measuring and sealing the leakage.
Sealing results were deemed successful in 75% of the projects in the main study. All five pilot projects were successful. Unsuccessful sealing projects had system characteristics that can be avoided in future work, namely gypsum board ductwork and very low pressure or erratically operated HVAC systems.
The sealing rates for systems varied between 53% and 98% of duct leakage sealed. The average sealed leakage was 81% and the median sealed leakage was 86% over the twenty systems in the main study. In the pilot study, sealed leakage was improved to an average of 86% and a median 90%. Sealing fractions less than 80% can be attributed to contractor inexperience and system specific details. Duct systems with leakage paths greater than 3/8” gap width cannot be effectively sealed via the Aeroseal method. Internally lined ducts also present a unique challenge. These systems can be sealed at very high rates; however, the lining slows the sealing process significantly such that scheduling or sealant quantity constraints may result in lower sealing fractions.
The cost recovery or savings from retrofit duct leakage varied between 5 and 140 years. The average payback was 31 years and the median payback was 17 years. For systems that were screened in the pilot, the average and median paybacks dropped dramatically to 7 years and 5 years respectively. Cost recovery follows the cost penalties of duct leakage; for supply systems, about 70% of the cost recovery is from electric savings and 30% of the cost penalty is from gas savings. For exhaust systems and 100% outside air systems, about 50% the cost recovery is from gas and 50% from electrical.
In most cases, systems with VFDs and duct static control will automatically adjust to sealed leakage by lowering speed while hitting the same duct static, which avoids potentially costly system adjustments to recognize energy savings. Adjusting constant volume systems and rebalancing are required in some cases and incur additional costs. Savings estimates based on leakage contractor-provided measurements plus some verification of change in fan operation are sufficient for estimating savings. The easiest validation of achieved savings occurs for VFD systems for which power information is available before and after the process. Measuring electrical fan power directly is another option. From this information, a few system details and site operating costs can be used to reliably calculate thermal and electrical energy savings.
Challenges Associated with Retrofit Duct Sealing
The main challenge with retrofit duct sealing is the expensive nature of duct leakage measurements. In most cases, the process required for measuring duct leakage (via the pressurization method) is similar to the process required to seal ducts via the Aeroseal method. Without this measurement, there is a significant uncertainty as to the rate of duct leakage and
Duct Leakage & Retrofit Duct Sealing in MN C&I Buildings COMM-54682 | Dec 2016 Center for Energy and Environment 95 | P a g e
its subsequent costs. In light of this uncertainty, screening criteria have been developed to rule out systems unlikely to yield cost-effective savings from retrofit duct leakage.
Another challenge is that duct leakage is historically and still is considered an HVAC performance issue and not an energy efficiency issue. Engineers do not make sealing specification on 20% to 50% of potential leakage paths on supply systems and on 50% to 80% of potential leakage paths on return and exhaust systems. Lack of specification in ductwork and duct sealing leaves a significant amount of decision making to unqualified workers and/or last minute budget and scheduling constraints. Despite recent code changes (June 2015) that require all new ductwork to be sealed completely, testing below 3“ w.g. (750 Pa) operating pressure is not (and has never been) required for code compliance despite evidence that leakage flow rate is appreciable at these pressures.
Screening Systems for Opportunity and Cost Effectiveness
A variety of criteria were considered as potential screening criteria to identify duct leakage and retrofit duct sealing opportunities. Four criteria were found to eliminate most systems with poor payback and retain systems with moderate to good payback. These criteria are:
System Types
Exhaust systems, especially those traversing unconditioned space.
Supply systems located in ceiling plenum returns.
Supply systems with fully ducted returns.
Operating Pressure
Operating pressure of at least 0.5“ w.g. are acceptable.
Operating pressure above 1.0“ w.g. are preferred.
Design Flow
Design flows greater than 4,000 cfm are acceptable.
Design flows greater than 10,000 cfm are preferred.
Apparent Tightness
Systems with existing sealant are rejected.
Systems of apparently tight construction are rejected, e.g. Spiral ductwork, flanged & gasketed ductwork.
These criteria tend to favor larger systems. Leakage is driven by moderate to large operating pressures and where absolute leakage flows (cfm) are large enough to justify the cost of retrofit duct sealing. These criteria tend to exclude smaller systems and portions of ductwork downstream of VAV boxes and reheat coils. While system traces can help identify the visual, audible, and felt signals of duct leakage, they should be subordinate to the above criteria and used in an adjunct capacity.

Duct Leakage & Retrofit Duct Sealing in MN C&I Buildings COMM-54682 | Dec 2016 Center for Energy and Environment 96 | P a g e
During the pilot study, systems encountered by the sealing contractors were screened according to these criteria. Five sites that met these criteria were selected for sealing. Screened systems performed substantially better than unscreened systems. Screening systems resulted in the selection of systems that were more than four times as leaky (29% duct leakage) compared to unscreened systems (7% duct leakage). Screening systems resulted in three times more leakage sealed per dollar compared to unscreened systems. Screening systems improved average and median payback by 3.8 and 3.2 times compared to prior results, down to 7 years and 5 years respectively.
Other criteria were identified for improving the cost effectiveness of retrofit duct sealing opportunities. While not used for screening, these criteria impact the cost recovery via either the cost of a specific amount of duct leakage or the cost of the sealing process. These criteria include:
Systems with outside air fractions greater than 30% (includes exhausts) preferred.
Systems that run 24x7 are preferred.
Systems with simple ductwork are preferred (e.g. less than 1 blocking per 300 cfm required to isolate ductwork).
Recommendations for CIP
As energy efficiency upgrades become harder to identify, duct leakage in existing buildings has emerged as a new opportunity. Although measured leakage rates in this study were lower than anticipated, they still represent about 460 GWh/yr of wasted electricity and 2,900 MMCF of wasted natural gas. From this research it is estimated that about 10% to 15% of commercial and institutional buildings have leakage rates high enough to justify retrofit duct sealing work with moderate to good payback of less than 7 years for a retrofit that should have a measure life of at least 15 years. In our small sample, careful screening efforts have successfully identified these opportunities.
Measures in Existing Programs
Retrofit duct sealing should be incorporated as a savings measure into existing commercial auditing, recommissioning, and turn-key savings programs. A duct leakage screening process is critical to quickly rule out systems that are unlikely to prove cost effective. A screening process based off the results of this report, can be immediately included into these services to identify the 10%-15% of systems that are likely to achieve cost-effective retrofit duct sealing savings. The extra attention given to commercial sites in these programs may allow follow-up work beyond simple screening efforts. This work may include simple measurements, collection and review of prior work, and documentation at the site (e.g. TAB or RCx reports), or system walk-throughs and the completion of the Aeroseal Duct Leakage Scorecard. Bundling retrofit duct sealing with other measures will alleviate the risk associated with unknown preliminary leakage while still providing energy-saving and non-energy benefits of tight ductwork. Any screening efforts and follow-up attention to evaluate duct leakage should be centrally reported regardless of implementation in order to expand the knowledge base for further improvement of screening protocols.

Duct Leakage & Retrofit Duct Sealing in MN C&I Buildings COMM-54682 | Dec 2016 Center for Energy and Environment 97 | P a g e
Outreach
Despite gaining significant attention in residential construction, retrofit duct sealing measures remain under recognized in the commercial space. Duct leakage is not recognized as an energy issue. Cost-effective retrofit duct sealing is a relatively new idea, mainly made possible with the advent of the Aeroseal method. Significant outreach efforts are necessary to inform and educate vendors and trade allies involved in existing commercial programs about the consequences of duct leakage and potential retrofit duct sealing measures. It is necessary to emphasize the importance of screening efforts and educate vendors about the risks associated with retrofit duct sealing; namely 1) preliminary duct leakage cannot be known without an expensive measurement and 2) savings from retrofit duct sealing are reduced in cases where the existing system does not meet ventilation, heating, or cooling specifications due to duct leakage. Targeted outreach efforts are necessary so that informed vendors can evaluate retrofit duct sealing opportunities and recommend them where feasible.
Another consequence of low visibility is the lack of competition in this space. During the proposal period for this project, there were no licensed Aeroseal vendors and the project team anticipated working with Aeroseal directly for sealing work. Shortly into the sealing phase of the project, the first local contractor became licensed and they were the only contractor available for the majority of this project. In the Pilot study, a second contractor became licensed. In addition to educating vendors, there is an opportunity to increase competition, which may help reduce the costs of duct sealing with obvious benefits to cost-effectiveness.
One valuable result from the screening process demonstrated in this pilot is that it mainly consists of basic information gathering that can be completed by most building personal. By reaching out to building staff and TAB and mechanical contractors on duct leakage and screening criteria, it may be possible to effectively begin widespread screening efforts. If screening protocols can be completed by on site staff, leads can be generated and followed up upon by qualified vendors and sealing contractors who may now afford to spend more time analyzing opportunities developed from encouraging and prioritized leads.
Program for New Construction
While not considered in this project, one of the most promising applications of commercial Aeroseal duct sealing is new construction. The Aeroseal process is already an established alternative to traditional sealing for residential ductwork. In light of code changes requiring the sealing of all commercial ductwork to Class A specification, the Aeroseal method should compete with traditional duct sealing measures on new construction. For medium and high pressure ductwork, where testing is required, the total costs of the Aeroseal method may be competitive with traditional duct sealing and separate testing measures. Even lower pressure ductwork, without testing requirements can benefit from the sealing and testing upon construction, especially small systems, where cost effectiveness of retrofit opportunities to improve installed performance will be difficult.
Sealing ductwork prior to balancing and commissioning the system offers guaranteed savings. The sealed duct system will have a known leakage rate, whereas code requires either no testing or up to 25% of ductwork operating at 3 “ w.g. or greater. These savings would be significant and rebateable, even if one assumes the low rates of leakage encountered in this project. For

Duct Leakage & Retrofit Duct Sealing in MN C&I Buildings COMM-54682 | Dec 2016 Center for Energy and Environment 98 | P a g e
example, sealing a VAV supply system with 2” w.g. duct static and 20% OA down to 1% duct leakage will result in approximately 22% lower operating costs compared to a system with 5% duct leakage (median measured in this project). A variety of metrics would lend to simple prescriptive rebates based on final leakage rates. Using an aerosol method to seal ducts in new systems that do not require testing may also be a measure to incorporate into design assistance programs.
Future Work
The main drawback of this work is the low sample size of systems and buildings, particularly in the pilot program, coupled with the relative uncertainty of existing duct leakage rates (absent expensive measurements). While this research has validated the potential of retrofit duct sealing in Minnesota buildings, continued efforts are necessary to refine this understanding of opportunities, savings, and costs. In light of the uncertainties as to the cost effectiveness of retrofit duct sealing measures, we recommend collaboration with duct sealing and commercial program vendors to create and maintain a database of screening and sealing results that will allow for continued improvement of screening efficiency as well as the ability to predict energy and cost savings.

Duct Leakage & Retrofit Duct Sealing in MN C&I Buildings COMM-54682 | Dec 2016 Center for Energy and Environment 99 | P a g e
References
ASHRAE 2009. Handbook of Fundamentals. Chapter 21: Duct Design. Atlanta, GA: American Society for Heating, Refrigerating and Air Conditioning Engineers.
Bahnfleth W, McWhirter D, Novosel D 2008. Impact of Air Return Strategy on Building Energy Consumption and Indoor Air Quality – Literature Review. Report NCEMBT-081010. Alexandria, VA: National Center for Energy Management and Building Technologies.
Bohac D, Feuermann D, Harrje D 1988. "Extended Testing of a Multifamily Building Using Modified Constant Concentration Methods." 9th AIVC Conference - Effective Ventilation, Air Infiltration and Ventilation Centre, Great Britain, AIVC-PROC-9-88.
Bohac D, Harrje D, Feuermann D 1985. "Constant Concentration Measurement Techniques: An Analysis of its Accuracy and Field Measurements." Proceedings of the ASHRAE/DOE/BTECC Conference on Thermal Performance of the Exterior Envelopes of Buildings, Clearwater, Florida.
Bohac, D.L., C. Bastian, J. Fitzgerald, and K. Kolehma, 2016. Reducing the Energy Cost of Effective Ventilation in Multi-Unit Buildings (to be published)
Diamond R, Wray C, Dickerhoff D, Matson N, Wang D 2003. Thermal Distribution Systems in Commercial Buildings. LBNL-51860. Berkeley, CA: Lawrence Berkeley National Laboratory.
EIA 2008. Commercial Buildings Energy Consumption Survey 2003. Table E3A. Electricity Consumption (Btu) by End Use for All Buildings, 2003. Released September 2008.
EIA 2006. Commercial Buildings Energy Consumption Survey 2003. Table A2. Census Region, Number of Buildings and Floorspace for All Buildings (Including Malls), 2003. Released June 2006.
EIA 1994. Energy End-Use Intensities in Commercial Buildings. Washington, DC: Energy Information Administration. DOE/EIA-0555(94)/2.
Fisk WJ, Delp W, Diamond R, Dickerhoff D, Levinson R, Modera M, Nematollahi, M, Wang D 2000. Duct systems in large commercial buildings: physical characterization, air leakage, and heat conduction gains. Energy and Buildings 32: 109-119.
Franconi E, Delp W, Modera M. 1998. Impact of Duct Air Leakage on VAV System Energy Use. LBNL-42417. Berkeley, CA: Lawrence Berkeley National Laboratory.
Modera M 2005. Fixing duct leaks in commercial buildings. ASHRAE Journal, June 2005 p. 22-28.
Modera M 2007. Investigation of leak sealing for supply and exhaust ductwork. 3rd Industry Workshop on Energy Efficient Technologies for Buildings – New and Retrofits. Co-sponsored by US. Department of Defense, U.S. Department of Energy, American Society for Heating, Refrigerating and Air Conditioning Engineers, International Energy Agency ECBCS Annex 46. January 25-26, 2007 Dallas, TX.
NEBB 1998. Procedural Standards for Testing Adjusting Balancing of Environmental Systems. Gaithersburg, MD: National Environmental Balancing Bureau.

Duct Leakage & Retrofit Duct Sealing in MN C&I Buildings COMM-54682 | Dec 2016 Center for Energy and Environment 100 | P a g e
Wang D 2004. TRAMS: A new tracer gas airflow measurement system, Environmental Energy Technologies Division News, 5(3): 7, 11. Jun. 21, 2004. Berkeley, CA: Lawrence Berkeley National Laboratory
Westphalen D, Koszalinski S 2001 Energy Consumption Characteristics of Commercial Building HVAC Systems. Volume I: Chillers, Refrigerant Compressors, and Heating Systems. Cambridge, MA: Arthur D. Little, Inc.
Westphalen D, Koszalinski S 1999. Energy Consumption Characteristics of Commercial Building HVAC Systems. Volume II: Thermal Distribution, Auxiliary Equipment, and Ventilation. Cambridge, MA: Arthur D. Little, Inc.
Wray CP, Diamond RC, Sherman MH 2005. Rationale for Measuring Duct Leakage Flows in Large Commercial Buildings. LBNL-58252. Berkeley, CA: Lawrence Berkeley National Laboratory.
Wray CP, Matson NE 2003. Duct Leakage Impacts on VAV System Performance in California Large Commercial Buildings. LBNL-53605. Berkeley, CA: Lawrence Berkeley National Laboratory.

Appendix A – Sample Survey Summary Report
Duct Leakage & Retrofit Duct Sealing in MN C&I Buildings COMM-54682 | Dec 2016 Center for Energy and Environment 101 | P a g e
Appendix A: Sample Survey Summary Report
Minnesota engineers' duct design practices
1. Experience
1. How long have you been designing HVAC systems for commercial and institutional (C&I) buildings in Minnesota?
28
2. About how many new C&I buildings or additions in Minnesota have you designed HVAC systems for?
100
3. And about how many total square feet is that? 3000000
2. Supply ductwork location and return type
4. About what percent of the total floor area you’ve designed over your career has had each of the following supply configurations:
Supply ductwork above the ceiling? : 70%
Supply ductwork exposed in the conditioned space? : 24%
No ducts (for example, packaged terminal air conditioners, un- ducted unit ventilators)? 5%
Under floor air distribution (UFAD)? : 1%
Total: 100%
What other configurations?
5. Of the new floor area you've designed that has had supply ductwork above the ceiling, about what percent has had each of the following types of return:
Ceiling plenum return? : 80%
Fully ducted return? : 20%
Total: 100%
6. In what types of buildings or types of spaces have you typically used each type of return?
type of returns types of buildings or spaces
Ceiling plenum returns? Office, Clinic,
Fully ducted returns? Healthcare, laboratory

Appendix A – Sample Survey Summary Report
Duct Leakage & Retrofit Duct Sealing in MN C&I Buildings COMM-54682 | Dec 2016 Center for Energy and Environment 102 | P a g e
3. Ductwork located above ceiling: distribution system types
7. Considering only the systems that have had supply ductwork above the ceiling and ceiling plenum returns, about what percent of the floor area has been:
VAV with reheat? : 85%
VAV without reheat? : 5%
Constant volume with reheat? : 10%
Total: 100%
What other types?
8. Thinking only about the VAV systems from the previous question, about what percent of the floor area has been served by:
Fan- powered boxes? : 5%
Non- fan- powered boxes? : 95% Total: 100%
9. Was there any time in the past when your use of fan powered boxes was substantially different than it is now?
No
4. Fan-powered box details
4. About what year(s) did any changes take place, and how was your use of fan powered boxes different in each time period?
5. Under-floor air distribution
10. Have you designed any underfloor air distribution (UFAD) systems that served spaces other than computer rooms?
Yes
6. Under-floor air distribution details
11. What percent of underfloor air distribution ( UFAD) systems you've designed - excluding computer room systems -- has had:
Plenum supply? : 95%
Supply ducted all the way to the outlets? : 5% Total: 100%
Comments:
12. If you have designed any UFAD systems with plenum supply - other than computer rooms - how often have you required leakage testing of the plenum?
Often

Appendix A – Sample Survey Summary Report
Duct Leakage & Retrofit Duct Sealing in MN C&I Buildings COMM-54682 | Dec 2016 Center for Energy and Environment 103 | P a g e
Comments:
7. Current supply duct sealing specifications
13. In a project where the supply ductwork is located above the ceiling, what areas would your current specifications typically require to be sealed for each of the following portions of the ductwork:
None Transverse
joints Longitudinal
seams Duct wall
penetrations
Risers
Ducts upstream of VAV boxes
Ducts downstream of VAV boxes?
Ducts upstream of reheat coils in constant volume
Ducts downstream of reheat coils in constant volume systems?
Ducts in constant volume systems with no reheat coils?
Comments:
14. How often do you currently specify a leakage class (CL) for each of the following positions of the supply duct systems:
Never Rarely Sometimes Often Always
Risers
Ducts upstream of VAV boxes
Ducts downstream of VAV boxes?
Ducts upstream of reheat coils in constant volume
Ducts downstream of reheat coils in constant volume systems?
Ducts in constant volume systems with no reheat coils?
Comments:
15. Was there any time in the past when your typical specification for sealing of supply ductwork was substantially different than it is now?
Yes
8. Previous supply duct sealing specifications

Appendix A – Sample Survey Summary Report
Duct Leakage & Retrofit Duct Sealing in MN C&I Buildings COMM-54682 | Dec 2016 Center for Energy and Environment 104 | P a g e
16. About what year(s) did any changes take place, and how was your specification different in each period?
2005 began specifying sealing classifications for all ducts, not just 4" w.g. construction
9. Current supply duct sealing specifications, ctd.
17. In your experience, is leakage from each of the following items typically a major contributor, a minor contributor, or not a contributor to overall distribution system leakage?
Major Factor
Minor Factor
Not a Factor
Air handling units
VAV boxes
Reheat coils
Fire dampers
Balancing dampers
Access doors
Connections to outlets
Other
Other
18. For what percent of your current projects do you specify duct leakage testing?
100%
19. For what types of projects, buildings or spaces - if any - do you currently specify more stringent duct sealing requirements than your typical specification?
Lab exhaust, clean room supply and return
10. Current supply duct specifications
20. Do you currently specify a maximum length for flexible connectors between the hard duct and the air outlets?
Yes --> What length (feet)? 10 feet
21. In your experience, how well do contractors typically comply with this specification?
Somewhat well
Comments:
22. Do you typically indicate the static pressure class for different portions of duct systems:
Appendix A – Sample Survey Summary Report
Duct Leakage & Retrofit Duct Sealing in MN C&I Buildings COMM-54682 | Dec 2016 Center for Energy and Environment 105 | P a g e
In the specifications?
Comments:
11. Supply duct insulation
23. In a typical project where the supply ductwork is located above the ceiling -- and is not on the top floor -- do you currently specify:
Insulation on the exterior of the ducts
Comments:
24. In a typical project where the supply ductwork is located above the ceiling -- and is on the top floor -- do you currently specify:
Insulation on the exterior of the ducts
Comments:
25. Was there any time in the past when your typical specification for insulating supply ductwork above the ceiling - including whether it was internal or external - was substantially different than it is now?
Yes
12. Previous supply duct insulation specifications
26. About what year s) did any changes take place, and how was your specification for supply duct insulation different in each period?
Approximately 1997 I deleted internal liner from projects due to the onset of IAQ concerns. Have since allowed internal liner on acoustically sensitive projects due to the availability of coatings that inhibit microbial growth
13. Current return duct sealing specifications
27. What areas would your current specifications typically require to be sealed, for each of the following portions of the return ductwork:
None Transverse
joints Longitudinal
seams Duct wall
penetrations
Return risers
Return branches and runouts
Comments:
28. How often do you specify a leakage class ( CL) for each of the following portions of the return duct system:

Appendix A – Sample Survey Summary Report
Duct Leakage & Retrofit Duct Sealing in MN C&I Buildings COMM-54682 | Dec 2016 Center for Energy and Environment 106 | P a g e
Never Rarely Sometimes Often Always
Risers
Ducts upstream of VAV boxes
Comments:
29. Was there any time in the past when your typical specification for sealing return ductwork was substantially different than it is now?
No
14. Previous return duct sealing specifications
5. About what year(s) did any changes take place, and how was your specification for sealing return ductwork different in each period?
15. Current exhaust duct sealing specifications
30. What areas would your current specifications typically require to be sealed, for each of the following portions of toilet, electrical room and similar exhaust ductwork operating under negative pressure:
None Transverse
joints Longitudinal
seams Duct wall
penetrations
Exhaust risers
Exhaust branches and runouts
Comments:
31. How often do you specify a leakage class ( CL) for each of the following portions of toilet, electrical room and similar exhaust duct systems operating under negative pressure:
Never Rarely Sometimes Often Always
Risers
Branches and runouts
Comments:
32. Was there any time in the past when your typical specification for sealing toilet, electrical room and similar exhaust ductwork under negative pressure was substantially different than it is now?
No
16. Previous exhaust duct sealing specifications
Appendix A – Sample Survey Summary Report
Duct Leakage & Retrofit Duct Sealing in MN C&I Buildings COMM-54682 | Dec 2016 Center for Energy and Environment 107 | P a g e
6. About what year(s) did any changes take place, and how was your specification for sealing toilet, electrical room and similar exhaust ductwork different in each period?
17. Code enforcement for duct sealing
33. What do you estimate is the level of compliance with State code requirements for duct sealing in each of the following jurisdictions?
Very Good Good Poor Very Poor
Don’t know
Minneapolis
St. Paul
Rochester
Duluth
Bloomington
Other Twin Cities suburbs
Elsewhere in Minnesota
34. Has the level of compliance changed over your career, and if so when, in what jurisdictions and in what way (higher or lower)?
Compliance has changed with the increased education of inspectors
18. Gypsum board risers
35. Over your career , how often have you used gypsum board air shafts ( without a sheet metal liner) for:
Never Rarely Sometimes Often
Supplies
Returns
Exhausts
36. Is there any pattern to the type of building, size of building, type of owner, jurisdiction, period of time, or any other factor where you have used gypsum board air shafts?
In hotel toiler room exhaust shafts
19. Above grade concrete and concrete block passageways or shafts
37. Over your career, how often have you used above grade concrete or concrete block (CMU) passageways or air shafts ( without a sheet metal liner) for:

Appendix A – Sample Survey Summary Report
Duct Leakage & Retrofit Duct Sealing in MN C&I Buildings COMM-54682 | Dec 2016 Center for Energy and Environment 108 | P a g e
Never Rarely Sometimes Often
Supplies
Returns
Exhausts
38. Is there any pattern to the type of building, size of building, type of owner, jurisdiction, period of time or any other factor where you have used above grade concrete or concrete block passageways or air shafts?
Displacement ventilation plenums in performing arts center
20. Concrete and concrete block tunnels
39. Over your career , how often have you used below grade concrete or concrete block ( CMU) tunnels( without a liner) for:
Never Rarely Sometimes Often
Supplies
Returns
Exhausts
40. Is there any pattern to the type of building, size of building, type of owner, jurisdiction, period of time or any other factor where you have used below grade concrete or concrete block tunnels?
Displacement ventilation plenums for performing arts centers
21. Fibrous glass ducts
41. Over your career , how often have you used fibrous glass ducts for:
Never Rarely Sometimes Often
Supplies
Returns
Exhausts
42. Is there any pattern to the type of building, size of building, type of owner, jurisdiction, period of time, or any other factor where you have used fibrous glass ducts?
This is a design build product and would never recommend or specify
22. Leakage relative to sheet metal
43. In your experience, how does each of the following compare to sheet metal ductwork in terms of leakage?

Appendix A – Sample Survey Summary Report
Duct Leakage & Retrofit Duct Sealing in MN C&I Buildings COMM-54682 | Dec 2016 Center for Energy and Environment 109 | P a g e
Much less
leakage
Somewhat less
leakage
Same amount of
leakage
Somewhat more
leakage
Much more
leakage Don’t know
Gypsum board air shafts
Above grade concrete or CMU passageways and air shafts
Below grade concrete or CMU tunnels
Fibrous glass ductwork
Comments:
23. New Page
44. Is there anything else important you think we should know about air distribution system leakage in C&I buildings in Minnesota?
Outdoor air shafts should be required to be lined with sheet metal and not left to be bare concrete or CMU.
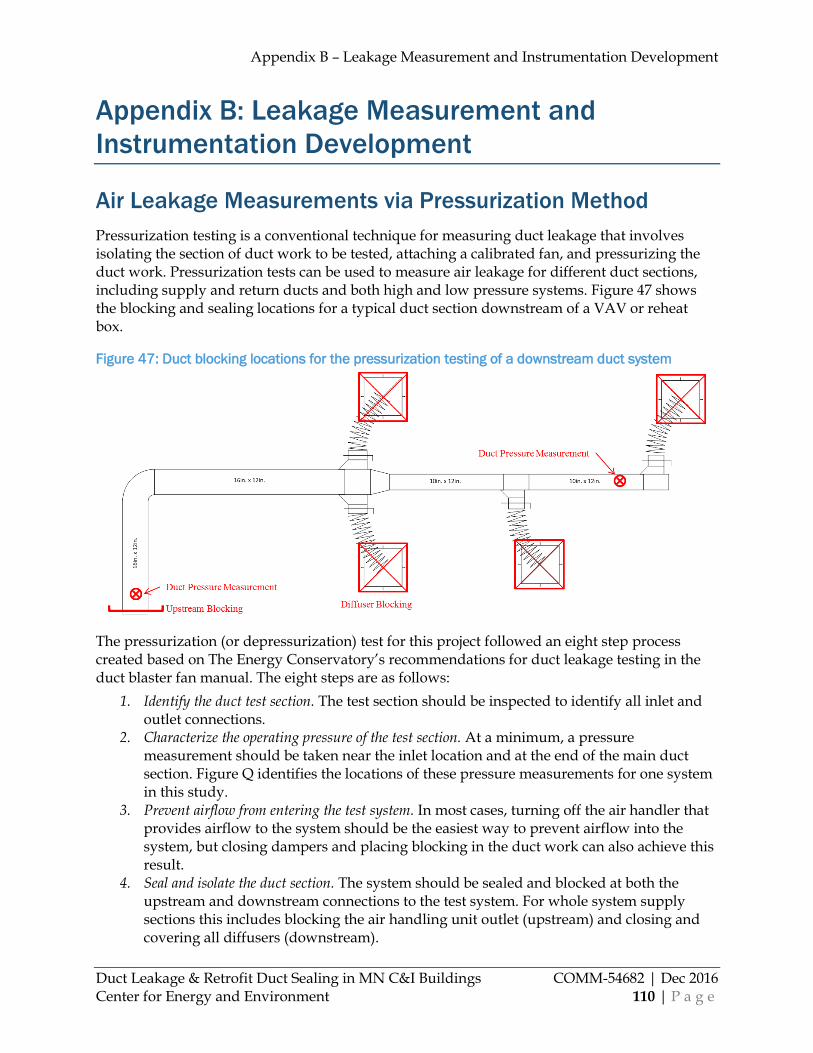
Appendix B – Leakage Measurement and Instrumentation Development
Duct Leakage & Retrofit Duct Sealing in MN C&I Buildings COMM-54682 | Dec 2016 Center for Energy and Environment 110 | P a g e
Appendix B: Leakage Measurement and
Instrumentation Development
Air Leakage Measurements via Pressurization Method
Pressurization testing is a conventional technique for measuring duct leakage that involves isolating the section of duct work to be tested, attaching a calibrated fan, and pressurizing the duct work. Pressurization tests can be used to measure air leakage for different duct sections, including supply and return ducts and both high and low pressure systems. Figure 47 shows the blocking and sealing locations for a typical duct section downstream of a VAV or reheat box.
Figure 47: Duct blocking locations for the pressurization testing of a downstream duct system
The pressurization (or depressurization) test for this project followed an eight step process created based on The Energy Conservatory’s recommendations for duct leakage testing in the duct blaster fan manual. The eight steps are as follows:
1. Identify the duct test section. The test section should be inspected to identify all inlet and outlet connections.
2. Characterize the operating pressure of the test section. At a minimum, a pressure measurement should be taken near the inlet location and at the end of the main duct section. Figure Q identifies the locations of these pressure measurements for one system in this study.
3. Prevent airflow from entering the test system. In most cases, turning off the air handler that provides airflow to the system should be the easiest way to prevent airflow into the system, but closing dampers and placing blocking in the duct work can also achieve this result.
4. Seal and isolate the duct section. The system should be sealed and blocked at both the upstream and downstream connections to the test system. For whole system supply sections this includes blocking the air handling unit outlet (upstream) and closing and covering all diffusers (downstream).

Appendix B – Leakage Measurement and Instrumentation Development
Duct Leakage & Retrofit Duct Sealing in MN C&I Buildings COMM-54682 | Dec 2016 Center for Energy and Environment 111 | P a g e
5. Attach a calibrated fan. The calibrated fan system should be attached to the duct system through an access panel, a hole cut in the ductwork, or a diffuser. The location of the fan should be selected along the main duct branch or in close proximity to the branch to ensure that the airflow into the test system is not restricted.
6. Pressurize (or depressurize) the test system. The flow rates should be measured from the calibrated fan required to pressurize the system to various system pressures (called a multi-point pressurization test). The range of test system pressures in a multi-point test should include measurements at a minimum of five different pressures that cover the full span of operating pressures for the duct work. For a system that operates at 25 Pa, a typical multi-point test would include test pressures of 35, 30, 25, 20, and 15 Pa.
7. Perform data analysis. For this project, the multi-point test data was used to create a curve fit to the flow rate and pressurization data. This relationship between leakage rate and system pressure characterizes the leakage of the system.
8. Determine final duct leakage. Use the relationship between the duct leakage and the system pressure to determine the system leakage at the operating pressure.
As-Operated Duct Leakage
A second approach was taken to measure duct leakage rate under normal operating conditions. This method required measuring the system air flow into the duct work section (upstream) and then measuring the total flow through all the outlets (downstream). The difference between these measurements is the system leakage.
Tracer Gas Measurement
Total system air flow (upstream) was measured at as-operated conditions using a tracer gas injected into the duct over a short period of time. The mass of tracer gas injected into the system was compared to the increase in tracer gas concentration in the airflow stream during the injection period to compute the air flow rate. One problem with single point tracer gas injection is that the flow paths from the injection point to the first leak or outlet are often too short to allow the tracer gas to mix thoroughly, and this significantly degrades measurement accuracy. Because of this, distributed injection and multi-point sampling must be used for accurate measurements over short duct lengths. As a potential solution, LBNL developed an innovative multi-port flexible injector that whips around as the tracer gas is expelled from a pressurized canister to disperse the tracer gas uniformly (Wang 2004, U.S. Patent 7,207,228). Two example injector types were described in the Patent and are shown in Figure 48. The injection system utilizes a series of whips (#170 in (a) and #102 in (b)) to inject tracer gas at multiple points in the same cross section of ductwork. LBNL proposed several possible methods of multi-point injection including (a) a manifold system and (b) a system with a series of individual whips.
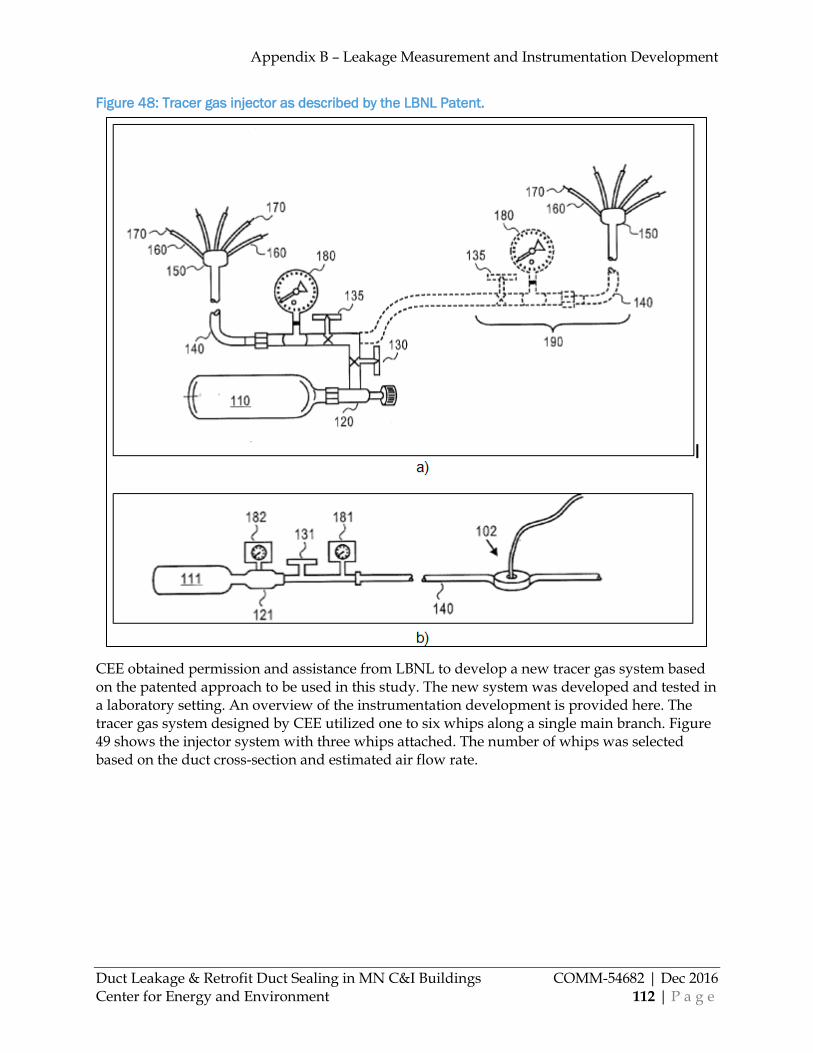
Appendix B – Leakage Measurement and Instrumentation Development
Duct Leakage & Retrofit Duct Sealing in MN C&I Buildings COMM-54682 | Dec 2016 Center for Energy and Environment 112 | P a g e
Figure 48: Tracer gas injector as described by the LBNL Patent.
CEE obtained permission and assistance from LBNL to develop a new tracer gas system based on the patented approach to be used in this study. The new system was developed and tested in a laboratory setting. An overview of the instrumentation development is provided here. The tracer gas system designed by CEE utilized one to six whips along a single main branch. Figure 49 shows the injector system with three whips attached. The number of whips was selected based on the duct cross-section and estimated air flow rate.
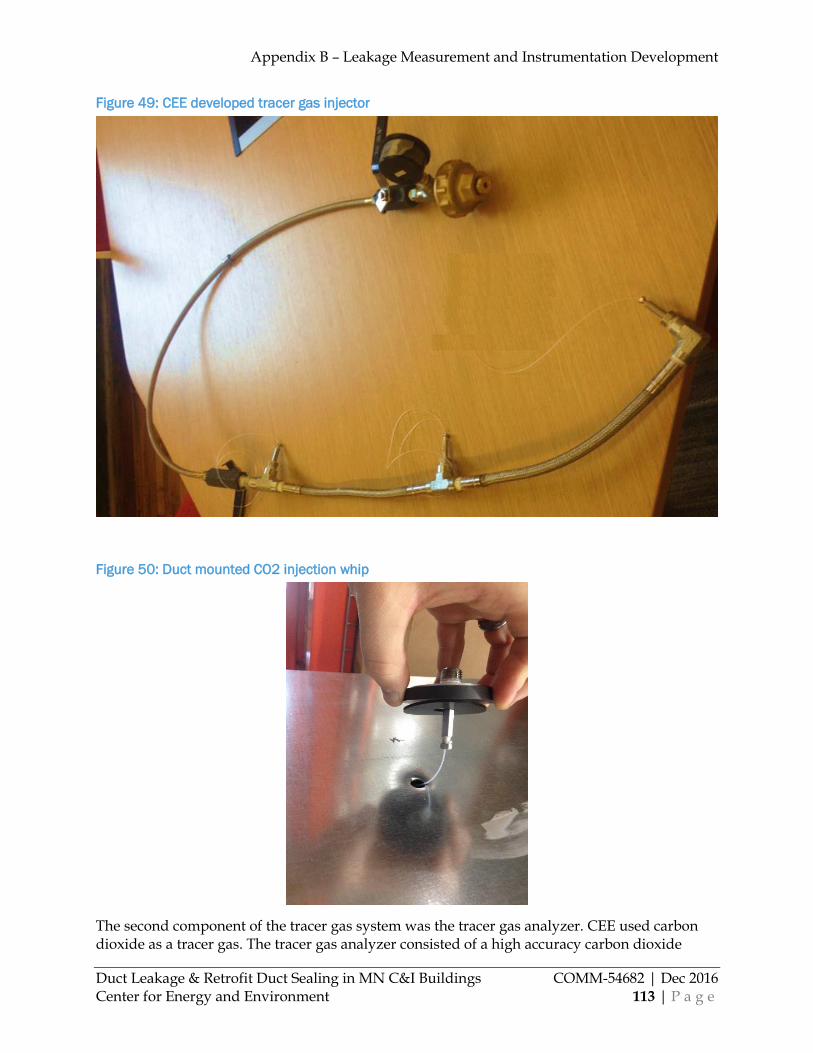
Appendix B – Leakage Measurement and Instrumentation Development
Duct Leakage & Retrofit Duct Sealing in MN C&I Buildings COMM-54682 | Dec 2016 Center for Energy and Environment 113 | P a g e
Figure 49: CEE developed tracer gas injector
Figure 50: Duct mounted CO2 injection whip
The second component of the tracer gas system was the tracer gas analyzer. CEE used carbon dioxide as a tracer gas. The tracer gas analyzer consisted of a high accuracy carbon dioxide
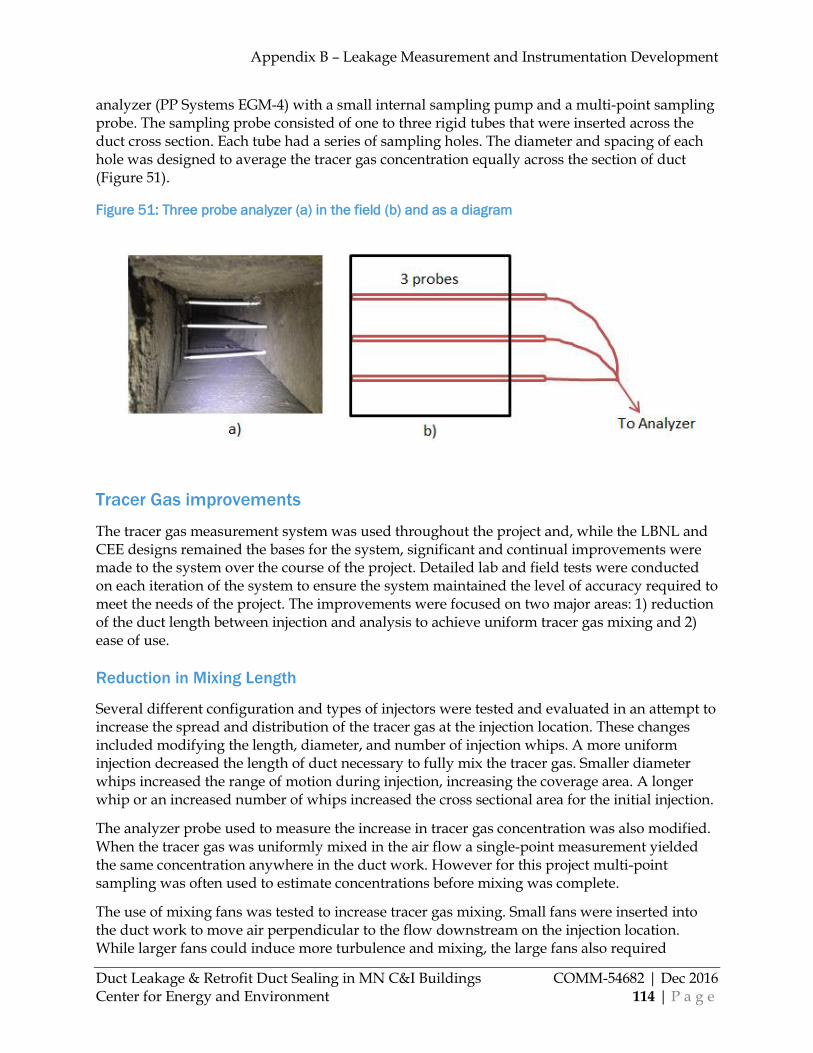
Appendix B – Leakage Measurement and Instrumentation Development
Duct Leakage & Retrofit Duct Sealing in MN C&I Buildings COMM-54682 | Dec 2016 Center for Energy and Environment 114 | P a g e
analyzer (PP Systems EGM-4) with a small internal sampling pump and a multi-point sampling probe. The sampling probe consisted of one to three rigid tubes that were inserted across the duct cross section. Each tube had a series of sampling holes. The diameter and spacing of each hole was designed to average the tracer gas concentration equally across the section of duct (Figure 51).
Figure 51: Three probe analyzer (a) in the field (b) and as a diagram
Tracer Gas improvements
The tracer gas measurement system was used throughout the project and, while the LBNL and CEE designs remained the bases for the system, significant and continual improvements were made to the system over the course of the project. Detailed lab and field tests were conducted on each iteration of the system to ensure the system maintained the level of accuracy required to meet the needs of the project. The improvements were focused on two major areas: 1) reduction of the duct length between injection and analysis to achieve uniform tracer gas mixing and 2) ease of use.
Reduction in Mixing Length
Several different configuration and types of injectors were tested and evaluated in an attempt to increase the spread and distribution of the tracer gas at the injection location. These changes included modifying the length, diameter, and number of injection whips. A more uniform injection decreased the length of duct necessary to fully mix the tracer gas. Smaller diameter whips increased the range of motion during injection, increasing the coverage area. A longer whip or an increased number of whips increased the cross sectional area for the initial injection.
The analyzer probe used to measure the increase in tracer gas concentration was also modified. When the tracer gas was uniformly mixed in the air flow a single-point measurement yielded the same concentration anywhere in the duct work. However for this project multi-point sampling was often used to estimate concentrations before mixing was complete.
The use of mixing fans was tested to increase tracer gas mixing. Small fans were inserted into the duct work to move air perpendicular to the flow downstream on the injection location. While larger fans could induce more turbulence and mixing, the large fans also required
Appendix B – Leakage Measurement and Instrumentation Development
Duct Leakage & Retrofit Duct Sealing in MN C&I Buildings COMM-54682 | Dec 2016 Center for Energy and Environment 115 | P a g e
significant installation time to cut access into the duct work. Similarly static mixers were considered, but deemed unrealistic due to duct access issues.
Ease of Use
CEE looked at several different duct mounting options and tracer gas measurement and storage systems (including the use of a mass analyzer). Ease of use modifications often had an impact on the mixing length and accuracy of the device. For example, a system with six whips requires six holes in the duct work and the attachment of six individual whips. While this installation would take twice as long as a system with only three whips, the system with six whips would have a better distribution of tracer gas in the duct work, reducing the necessary measurement length.
During the course of this project the University of California Davis (UC-Davis) began a project to look at the commercialization of a tracer gas based airflow measurement systems based on the LBNL patent. CEE and UC-Davis began to coordinate efforts to improve and develop the tracer gas system. In November, 2014, UC-Davis developed a second prototype tracer gas system to use in the project and for evaluation as a potential commercial device. Figure 52 shows the UC-Davis prototype device. The device operates on the same principals as the CEE and LBNL device, but was developed with commercialization in mind and this helped to significantly increase the ease of use of the device. The primary benefits of this device were:
1. A mass flow controller that replaced the bottle weighing method for tracer gas injection measurement and allowed for a real-time, digital output of the injection rates that could be compared to the downstream concentration measurements.
2. A wireless connection from the injection and analyzer equipment to a central computer that allowed for data collection and analysis in real time.
3. Two injection systems that were both easy to attach. The first used a single probe with four to ten injection holes and the second used either eight or sixteen whips that were installed in individual holes around the circumference of the ductwork. The whips in the second system were light-weight and used magnetized seals to reduce the time required to install each whip.

Appendix B – Leakage Measurement and Instrumentation Development
Duct Leakage & Retrofit Duct Sealing in MN C&I Buildings COMM-54682 | Dec 2016 Center for Energy and Environment 116 | P a g e
Figure 52: UC Davis tracer gas injection system with heated regulator, heater, and mass flow
controller
Laboratory testing
A test duct assembly was designed and built in a laboratory for testing and verification of the duct leakage testing instrumentation. This system was built to be representative of a commercial supply system downstream of a VAV box. The system contained four 24” by 24” diffusers supplied by a rectangular branch duct and 10” flex duct take offs. Figure 53 shows the specifications of the duct system.

Appendix B – Leakage Measurement and Instrumentation Development
Duct Leakage & Retrofit Duct Sealing in MN C&I Buildings COMM-54682 | Dec 2016 Center for Energy and Environment 117 | P a g e
Figure 53: Laboratory downstream commercial duct system used for testing duct leakage
instrumentation.
Tracer Gas Testing
The tracer gas system was tested between 500 and 1200 CFM through the duct assembly built in the laboratory. Figure 54 shows the results for testing the multi-whip tracer gas injection system. The laboratory testing showed a maximum error for the tracer gas system of 3%. This accuracy level required the tracer gas be fully mixed in the airflow shortly after the injection. Tracer gas mixing was analyzed using a single point concentration measurement at several points across the duct section. The tracer gas was determined to be well mixed if the single point concentrations were uniform across the ductwork. Figure 55 shows the concentration measured at several points during a mixing test. Table 24 shows that at 5 different points in the duct work less than 1% change in the concentration was measured, which resulted in less than 3% change in the airflow measurement. The two mid-point measurements show that even under steady conditions the variance in airflow and concentration can result in approximately 1% variance in the total air flow measurement.
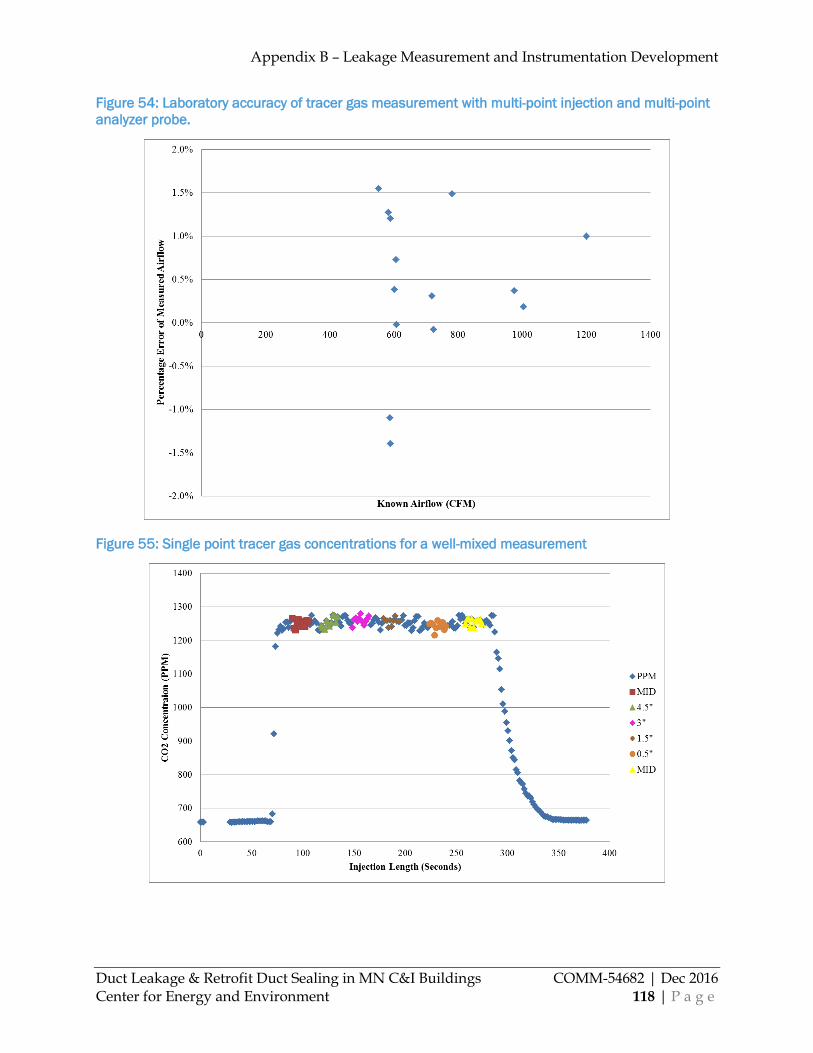
Appendix B – Leakage Measurement and Instrumentation Development
Duct Leakage & Retrofit Duct Sealing in MN C&I Buildings COMM-54682 | Dec 2016 Center for Energy and Environment 118 | P a g e
Figure 54: Laboratory accuracy of tracer gas measurement with multi-point injection and multi-point
analyzer probe.
Figure 55: Single point tracer gas concentrations for a well-mixed measurement

Appendix B – Leakage Measurement and Instrumentation Development
Duct Leakage & Retrofit Duct Sealing in MN C&I Buildings COMM-54682 | Dec 2016 Center for Energy and Environment 119 | P a g e
Table 24: Results from a single-point analyzer mixing test
Analyzer Vertical Duct Position
% Change in Concentration
% Change in Airflow
Mid-point N/A N/A
0.5” from bottom 0.6% -2.0%
1.5” from bottom -0.5% 1.6%
3.0” -0.8% 2.9%
4.5” -0.4% 1.3%
Mid-point -0.3% 1.3%
Powered Flow Hood
Flow from the diffuser outlet is collected in a conventional fabric hood attached to a calibrated fan (e.g. Duct Blaster). The fan speed is controlled to keep the pressure in the hood the same as the pressure in the space so that the restriction caused by the measurement device does not affect the flow. The flow is measured by the calibrated fan at some distance from the diffuser and is not affected by duct entrance conditions. While highly accurate, this method is too labor-intensive to be used outside research applications. LBNL conducted over 1000 lab tests on commercially available flow hoods and found only one that had sufficiently high accuracy (+/-3%) and precision to be used for duct leakage diagnostics. The Energy Conservatory recently developed a powered flow hood that performed well in the LBNL tests on residential outlets. That device was modified for commercial sized outlets and calibrated using laboratory and field measurements to be used in this project.
Two basic methods were used to modify the residential powered flow hood to fit commercial systems. For diffusers with airflow less than 400 CFM, Duct Blaster, The Energy Conservatory’s commercially available residential powered flow hood, was modified to accommodate a fabric hood of 24" by 24". The zero pressure sensor used in the residential hood is only designed for flows less than 400 CFM This product met The Energy Conservatory’s specifications for the powered flow hood with measured air flow of +/- 3%, and the flow hood used for this project had a special calibration, of +/- 1% for flows under 500 CFM (Figure 56). For flows greater than 400 CFM, a different pressure compensation was required and a baseline duct pressure was measured before the powered hood was used for each diffuser. The baseline pressure sensor was installed in the main branch near the diffuser takeoff and the powered hood fan was then used to match the baseline pressure. The flow required to match the baseline pressure was the flow through the diffuser under normal operating conditions. This approach was tested in the laboratory test system and on The Energy Conservatory calibration and test stand. Over a range of flows from 400 to 600 the powered flow hood was within 3.0% of the measured flow.
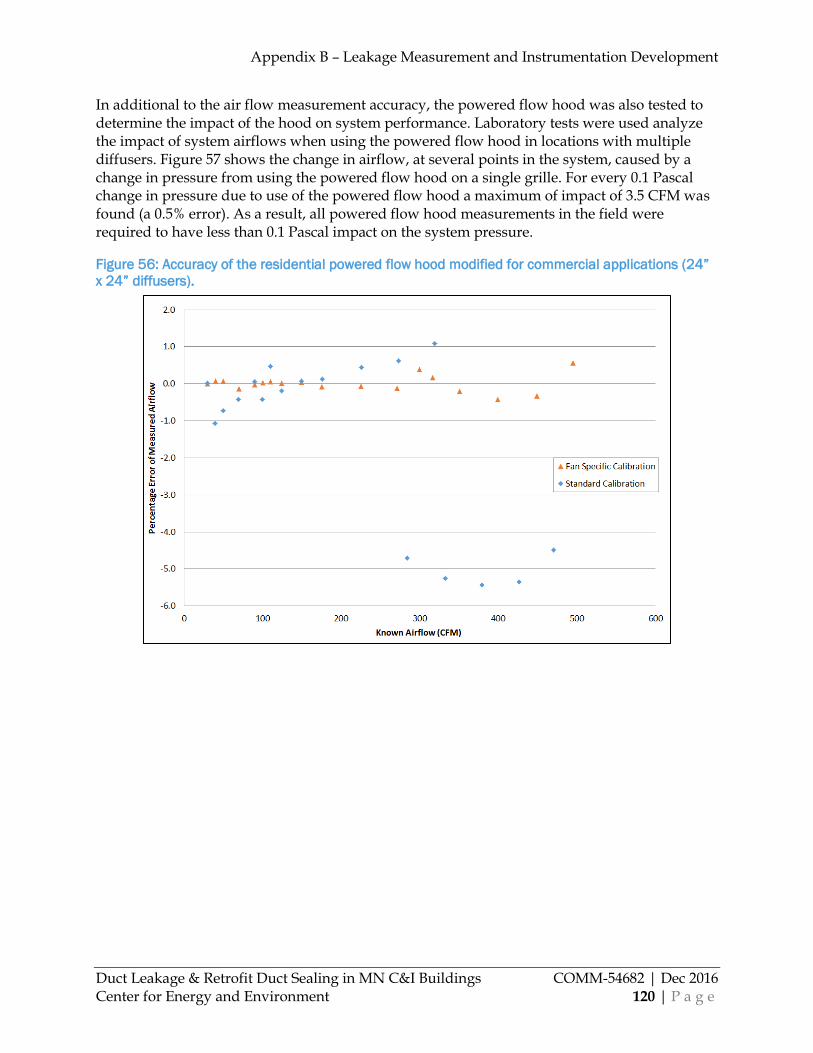
Appendix B – Leakage Measurement and Instrumentation Development
Duct Leakage & Retrofit Duct Sealing in MN C&I Buildings COMM-54682 | Dec 2016 Center for Energy and Environment 120 | P a g e
In additional to the air flow measurement accuracy, the powered flow hood was also tested to determine the impact of the hood on system performance. Laboratory tests were used analyze the impact of system airflows when using the powered flow hood in locations with multiple diffusers. Figure 57 shows the change in airflow, at several points in the system, caused by a change in pressure from using the powered flow hood on a single grille. For every 0.1 Pascal change in pressure due to use of the powered flow hood a maximum of impact of 3.5 CFM was found (a 0.5% error). As a result, all powered flow hood measurements in the field were required to have less than 0.1 Pascal impact on the system pressure.
Figure 56: Accuracy of the residential powered flow hood modified for commercial applications (24”
x 24” diffusers).
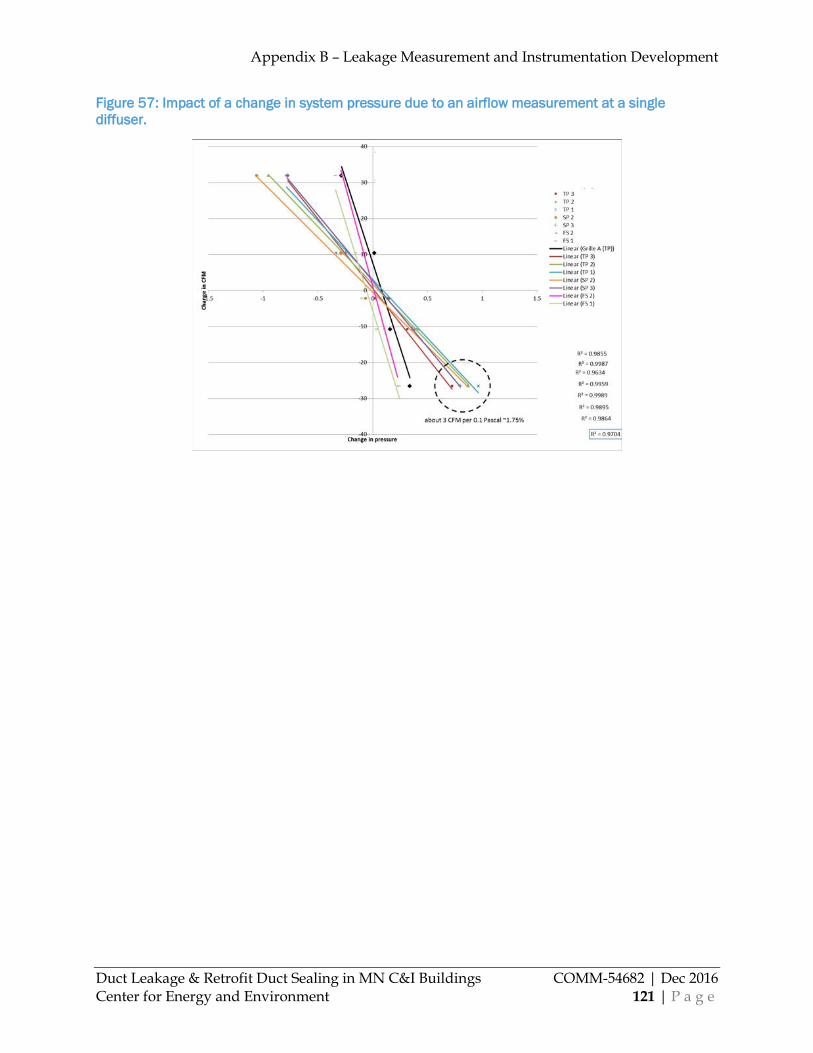
Appendix B – Leakage Measurement and Instrumentation Development
Duct Leakage & Retrofit Duct Sealing in MN C&I Buildings COMM-54682 | Dec 2016 Center for Energy and Environment 121 | P a g e
Figure 57: Impact of a change in system pressure due to an airflow measurement at a single
diffuser.

Appendix C – Additional Leakage Results
Duct Leakage & Retrofit Duct Sealing in MN C&I Buildings COMM-54682 | Dec 2016 Center for Energy and Environment 122 | P a g e
Appendix C: Additional Leakage Results
Figure 58: Leakage per duct length (lineal ft) as a function of design flow rate.
Figure 59: Leakage per duct surface area (sqft) as a function of design flow rate.

Appendix C – Additional Leakage Results
Duct Leakage & Retrofit Duct Sealing in MN C&I Buildings COMM-54682 | Dec 2016 Center for Energy and Environment 123 | P a g e
Figure 60: Estimated leakage (CFM) at 100 Pa pressurization as a function of design flow rate.

Appendix D – Measurement Comparisons
Duct Leakage & Retrofit Duct Sealing in MN C&I Buildings COMM-54682 | Dec 2016 Center for Energy and Environment 124 | P a g e
Appendix D: Measurement Comparisons
Comparing Duct Leakage Measurements
Duct leakage was measured using a combination of pressurization testing (uncertainty ±3%), a tracer gas technique (±2-5%), a powered flow hood (±3%), and a True Flow Meter (±7%). The True Flow Meter, powered hood, and tracer gas measurements are considered “as-operated” measurements because in theory, they measure duct leakage noninvasively while the system is under normal operation. In contrast, pressurization (or depressurization) tests require that the system be shut down with the grilles and openings to other portions of the ductwork sealed. Test fans are then used to measure the duct leakage over a range of pressures. That relationship is used with the estimated system average operating pressure to compute the duct leakage. In some cases it may be difficult to determine the correct operating pressure. Measurements by Wray et al. 2005 suggest that pressurization tests may over estimate duct leakage. For 19 duct leakage measurements both pressurization and one of the as-operated techniques were used to measure duct leakage. A comparison of these measurements is given in Table 25.
Table 25: A comparison of as-operated and pressurization test duct leakage measurements
# Design
Flow (cfm)
Measured Flow (cfm)
As operated Leakage
(cfm)
As operated Leakage
fL
Pressurization (cfm)
Pressurization fL
ΔfL
True Flow & Powered flow hood
1 120 278 221 80% 238 85% -6%
2 120 649 564 87% 459 71% 16%
3 120 241 169 70% 263 109% -39%
4 120 342 216 63% 317 93% -30%
5 675 1,030 568 55% 563 55% 1%
6 675 862 400 46% 410 48% -1%
Mean -10%
Median -6%
Tracer gas & Powered flow hood
7 510 897 199 22% 214 24% -2%
8 510 838 75 9% 67 8% 1%
9 1,100 757 31 4% 68 9% -5%
10 1,100 705 -221 -31% 64 9% -40%
11 2,900 2,578 87 3% 452 18% -14%
12 4,765 4,414 483 11% 158 4% 75%
13 4,765 4,575 500 11% 358 8% 3%
14 6,000 6,165 364 6% 985 16% -10%
15 10,530 10,041 1052 11% 755 78 3%
16 10,530 9,436 410 4% 29 0% 4%
Mean -5%
Appendix D – Measurement Comparisons
Duct Leakage & Retrofit Duct Sealing in MN C&I Buildings COMM-54682 | Dec 2016 Center for Energy and Environment 125 | P a g e
# Design
Flow (cfm)
Measured Flow (cfm)
As operated Leakage
(cfm)
As operated Leakage
fL
Pressurization (cfm)
Pressurization fL
ΔfL
Median -2%
Tracer gas
17 19,645 15,521 327 2% 89 1% 2%
18 28,215 22,200 1399 6% 1374 6% 0%
19 28,215 21,602 30 0% 154 1% -1%
Mean 0%
Median -1%
Six measurements were performed on the general exhaust systems in multifamily buildings using the depressurization test. These results were compared to the measurement from the True Flow meter and powered flow hood combination. In four of the six cases, the as-operated measurements indicated a higher rate of duct leakage than the pressurization technique. On average, the as-operated leakage was higher by 10%. The as-operated median was 6% higher than the depressurization test. Propagating the equipment uncertainties, these two measurements were expected to be within ±11-14% of one another for these cases. While on average these expectations were met, three of the six measurements were outside this range and all the errors were in the same direction. These large errors are likely due to the difficulty of accurately matching the system pressure with and without the True Flow device when the pressure reference is outdoors and wind gusts cause large pressure fluctuations.
A comparison between a combination tracer gas and powered flow hood and the pressurization method was performed on ten measurements of a variety of C&I supply ductwork comprised of upstream and downstream portions. In five of these cases, the poor mixing conditions at the reheat coil did not allow an accurate tracer gas flow measurement at the coil location. For those cases the upstream and downstream portions were tested together. In the remaining five cases, the estimates are for downstream sections only. Generally the as-operated leakage measurements were larger than the pressurization results, with a mean and median of 5% and 2% higher, respectively. In half of these cases the as-operated technique measured greater duct leakage than the pressurization test. Based on the uncertainties of the measurements, the two methods were expected to be within ±6-8 percentage points of one another and this is the case for seven of the ten measurements. Given the reliability of the powered flow hood and pressurization tests, any errors outside the expected uncertainty are most likely due to insufficient mixing for the tracer gas technique. Uncertainty from insufficient mixing is not included in the estimated duct leakage uncertainty.
As-operated tracer gas leakage estimates were compared to pressurization tests for three measurements of extremely long (~150 ft) exhaust risers. This was the most ideal arrangement for tracer gas measurements encountered in this study and there was excellent agreement with the pressurization tests for these three systems. In terms of leakage fraction, they are well within expected error bounds (±6-7%). Some of this improvement is due to the higher flow rates in these systems; absolute differences in flow rate measurements are less consequential.

Appendix D – Measurement Comparisons
Duct Leakage & Retrofit Duct Sealing in MN C&I Buildings COMM-54682 | Dec 2016 Center for Energy and Environment 126 | P a g e
There did not appear to be a tendency for pressurization tests to overestimate duct leakage compared to as-operated measurements. This is in part due to the characterization of pressure distributions in the ductwork prior to measurements. However, the reported pressure for duct leakage in 17 of 19 cases was the same as the single pressure measurement characterization used in the as-operated cases. In two pressurization tests, results were reported less than the as-operated pressure to account for significant variations in pressure along the branch (110 Pa to 80 Pa). In all cases, the pressure drops in the final takeoffs were not accounted for, but these, while significant, did not apparently unjustly amplify duct leakage estimated via pressurization tests.
The main advantage of the pressurization test is that it measures a leakage flow directly with a low uncertainty of (±3%), whereas the as-operated methods measure net flows at two locations each with uncertainties of (±6-10%). Not only are the uncertainties from the measurements additive and higher, they are uncertainties for the net flow measurement, which is a significant source of uncertainty even in the best case. Based on the 19 comparisons above, it is concluded that under most conditions pressurization tests are the best method for duct leakage estimation. However in cases where operating pressures varying significantly over the duct system, pressurization tests will likely not report accurate leakage flow rates unless a representative operating pressure can be determined.
Practical Considerations of Duct Leakage Measurements
Tracer Gas
In this project we attempted to determine whether a CO2 based tracer gas method would enable fast, cost effective duct-leakage measurements. While in principle tracer gas measurements can be a fast and reliable way to measure flow rates in ductwork, we rarely encountered this situation. In the best case, setup and repeatable flow rate measurements could be taken within a few hours. These measurements were possible across blowers, immediately downstream of blowers, or downstream of some dampers. However, in this study these circumstances were rare and we encountered only two sections of exhaust ductwork of sufficient length to enable duct leakage measurements from tracer gas alone. Multiple tracer gas measurements were unreliable on the remaining systems and the powered flow hood was used to measure one of the required net flows.
In addition to reliability concerns, tracer gas measurements were expensive. Labor costs were prohibitively large, requiring 6 to 12 hours on site and additional undocumented offsite hours to identify system-specific issues. There were numerous practical and operational delays and obstacles related to the prototype duct leakage equipment and software. It is likely that continued development could overcome these issues. Instead we emphasize the main obstacle to successful tracer gas duct measurements and our attempts to overcome it.
The difficulties encountered with tracer gases in this study were chiefly due to the inability to get good gas mixing in the HVAC ductwork. In contrast to expectations from prior work and laboratory testing, flows through the HVAC ductwork encountered in this study were not adequately turbulent for the application of the tracer gas technique. The ducts in the two laboratory tests proved to have exceptionally good mixing due to their proximity to large scale

Appendix D – Measurement Comparisons
Duct Leakage & Retrofit Duct Sealing in MN C&I Buildings COMM-54682 | Dec 2016 Center for Energy and Environment 127 | P a g e
fan turbulence. In the field, methods to overcome lack of mixing were generally insufficient. They include the following:
1) Injection variations: Several methods were employed to distribute the tracer gas injection across the cross sectional area of the ductwork. Distributing the injection across the cross-sectional area generally provided for more uniform tracer gas profiles, but did not overcome the fundamental lack of large scale mixing that is necessary for high quality measurements. Injection sites must be located within the largest turbulent length scale to sufficiently mix the flow. These large scales tend to be present downstream of fans and dampers, but die out quickly. In practice the turbulent length scales were difficult to identify, except at obvious locations such as outlets of fans or downstream of dampers, which were fairly effective static mixers.
a. Multi-point injection: Injections were attempted at one, two, three, and eight locations within a cross-sectional plane and an injection manifold with injection nozzles. A rod-shaped 18” distribution manifold was also used.
b. Multiple whip-style injection: Two diameters of semi-rigid nylon whips and one type of elastomer whip were used. The lengths varied between 6” and 24” and inlet pressures varied between 50 and 200 psi to control the distribution of the injector tip and the ‘violence’ with which these whips moved around during injection.
2) Large scale mixing: Attempts were made to facilitate mixing using two different inline fans to add turbulence to the flow. Contrary to Delporte 2004, this method had a negligible effect on the uniformity of tracer gas distribution. While there were changes in tracer gas concentration profiles, they were not sufficiently uniform for <4% uncertainty tracer gas measurements. Furthermore this step significantly increased the measurement effort.
3) Variations in sampling: Multi-point sampling was used, varying from a single sample point to four discrete points and between one and three rod-shaped manifolds with several dozen sampling points along their lengths. Moving around discrete sample points during injections allowed for the verification of unmixed conditions, but did not improve the reliability of measuring an “average” concentration for the air flow rate calculation.
A key observation from working with the tracer gas method is that, in general, for a particular injection and sampling strategy, measurements were extremely repeatable, but often inaccurate. Both injection methods (e.g. bottle weight loss and mass flow controller) could produce multiple measurements to well within ideal uncertainty calculated from flow rates and equipment specifications (e.g. < 2%). Upon further investigation at several sites, it became clear that specific injection strategies simply yielded very consistent tracer gas distributions. As a consequence of good mixing at small scales (less than injector separation) and poor mixing at large scales (greater than injection separation), measurements were repeatable, but ultimately not correct. It was only via additional sampling at discrete locations or varying manifold positions that demonstrated concentration fluctuations indicative of non-uniform mixing.
Prior tracer gas work (Delporte 2004) mentions that fan-assisted mixing may be obtained within two to four hydraulic diameters downstream of injection. In this study, even ideal conditions, such as downstream of fan turbulence, sufficient mixing was not obtained until six to eight

Appendix D – Measurement Comparisons
Duct Leakage & Retrofit Duct Sealing in MN C&I Buildings COMM-54682 | Dec 2016 Center for Energy and Environment 128 | P a g e
hydraulic diameters. Tracer gas distributions could not be adequately adjusted via fan turbulence, and numerous measurement locations (and systems) were discarded due to branching and diffuser take offs, which often prevented getting the requisite uninterrupted mixing length. The problem was exacerbated during attempts to make multiple tracer gas measurements within the same section of ductwork. In many situations the tracer gas locations were either overlapping or were so close that even high rates of expected leakage could not be measured with any certainty. In practice this was overcome by using the powered flow hood to make measurements of the diffuser flows.
In summary, the error for supply system tracer gas flow rate measurements was too high to provide accurate estimates of as-operated duct leakage. The technique needs to be applied downstream of large scale turbulence or other methods must be developed to generate better mixing.
Pressurization Measurements
Pressurization tests were found to achieve accurate results in nearly all situations. This method requires more preparation in order to isolate the system. However, the ease with which reliable measurements can be obtained made this a preferred method over tracer gas methods. The pressurization measurements under isolated conditions remove the difficulty of obtaining steady operation or compensating for varying conditions that occur when conducting tracer gas flow and multiple powered flow hood measurements.
Another advantage is that the pressurization method is employed by the Aeroseal equipment to estimate duct leakage pre and post sealing. This section will focus on our observations of contractor efforts to measure duct leakage via pressurization tests.
The Aeroseal system contains instrumentation with sufficient sensitivity and resolution to quantify pre-sealing and post-sealing duct leakage, thus providing measurement and verification of the duct sealing process. It consists of a fan controller and pressure gauge that are comparable to research grade equipment. While the software previously provided with the equipment was limited, an upgrade in early 2015 proved a significant improvement. The software is now capable of performing a multi-point flow and pressure test. This is the same technique employed by CEE investigators using The Energy Conservatory equipment and software. Due to this product improvement, mid-way through this project, CEE pressurization measurements were incorporated into the sealing work to directly compare against the pressurization measurements using the Aeroseal equipment. Much of the CEE pressurization testing was conducted when the contractor isolated the system for sealing work.
CEE duplicated the pre-sealing and post-sealing measurements of those by the Aeroseal contractor on 6 different systems. The same blocking and duct access methods were used for each test. Ideally these tests would report duct leakage at the same operating pressure within the uncertainty of the equipment. The CEE equipment has a worst case uncertainty of 3%. The Aeroseal equipment uncertainty is not known.
A comparison of pressurization measurements is given in Table 26 and shown in Figure 61. Some ambiguity in the operating pressure of contractor’s reported or measured figures led to a CEE operating pressure adjustment calculation for the 11 systems. Agreement between the two measurements was poor. In general, agreement was better when comparing sealed leakage than

Appendix D – Measurement Comparisons
Duct Leakage & Retrofit Duct Sealing in MN C&I Buildings COMM-54682 | Dec 2016 Center for Energy and Environment 129 | P a g e
when comparing individual leakage measurements. This may indicate the presence of some bias between the two pressurization schemes. Nonetheless, the sealed leakage is the important quantity for energy savings. Four of the eleven estimates of sealed leakage were within the ideal uncertainty of the method (±6%). Unfortunately the remaining seven measurements varied tremendously, between 14% and 62%. The differences in sealed cfm translate proportionately to differences in estimated cost effectiveness. For estimates in disagreement (>6%), the contractor’s measurement under predicted sealed cfm five times and over predicted it two times.
Table 26: A comparison of pressurization measurements
System Code
CEE Pre-Sealing Leakage
(cfm)
Contractor Pre-
Sealing Leakage
(cfm)
CEE Post-Sealing Leakage
(cfm)
Contractor Post-
sealing Leakage
(cfm)
CEE Leakage Sealed (cfm)
Contractor Leakage Sealed (cfm)
Δ (cfm)
Δ %
S17 438 480 107 36 330 444 -114 -35%
S18 755 797 29 114 726 684 42 6%
S19 272 154 4 2 268 152 116 43%
S20 177 93 10 5 167 88 80 48%
S21 158 84 50 2 108 82 26 24%
S22 358 118 51 2 307 116 192 62%
S23 1,038 912 237 91 801 821 -20 -3%
S24 299 229 34 28 264 201 63 24%
S25 214 195 46 3 168 192 -24 -14%
S26 116 114 8 2 107 112 -5 -5%
S27 59 55 4 3 55 53 2 4%
Figure 61: A comparison of CEE and contractor pressurization measurements

Appendix D – Measurement Comparisons
Duct Leakage & Retrofit Duct Sealing in MN C&I Buildings COMM-54682 | Dec 2016 Center for Energy and Environment 130 | P a g e
While the hardware is of sufficient quality, software control and operator training posed some significant challenges to obtaining high quality measurements. Several observations by CEE investigators during the contractor pressurization tests may explain some of the disagreement. These observations are detailed below.
1) Operator error due to poor understanding of the controls: The updated software controls for controlling fan output offered some combination of automatic and manual control. The operator manipulated these controls so that the software would report a value. Their adjustments implied that the equipment training did not facilitate an understanding of the measurement process or the underlying physics. Additionally a combination of automatic and manual fan speed control sometimes caused the software and the operator to essentially fight each other.
2) Poor software interface design failed to clearly distinguish between calculated values and direct measurement. The software operator screen reports various results at different pressures and it is unclear which are calculated values (or how they are calculated) and which are measured values. This uncertainty extended to the operator, who expressed no understanding of the difference between calculated and measured values. Given this confusion we anticipate at least some of the discrepancy in results can be attributed to the unknown origin of some results (calculated or as-measured).
3) Use of the software in unintended ways increased uncertainties of results. CEE investigators instructed the operator to essentially trick the software into performing multi-point tests to facilitate a comparison with the CEE method. In light of observations two and three, this likely exaggerating uncertainties with respect to the reported results.
4) Contractor software continued to report results under conditions where reliability of the results is questionable. The fan flow rate is calculated from a fan pressure. The measurement is accurate for a flow pressures above a specified value and back pressures below a specified value. The Energy Conservatory equipment used by CEE gives a clear indication when the flow pressure drops below a critical value (25 Pa). The contractor software reported results down to fan flow pressures of 1 Pa, which likely results in large errors. There was no indication that these reported values were any less reliable than results at higher fan flow pressures.
5) Some contractor equipment had excessive variance in key settings, leading to calibration errors. A single fan can be used for a wide variety of flows by constricting the fan inlet area. For TEC test fans (e.g. FlowBlasters) the inlet area is varied by using one of four rings, each with a fixed inlet area. In the Aeroseal system, a baffle is adjusted to one of four different locations. However, it was observed in many cases that the baffle can be left in an intermediate position between one of the four settings and that even when it is moved to one of the settings there is movement in the baffle height that can cause small differences in flow area. Potential errors due to intermediate gate placements were observed by CEE during some tests. A later investigation explored variations in the gate positions (and inlet area) graphically. Potential errors caused by gate position were estimated to be unimportant at gate sizes one and two (<1% error in inlet area). However, inlet areas varied up to 14% on gate three and 42% on gate four. Thus at gates 3 and 4 there is the potential for unreliable results due to unknown inlet area.
These issues are responsible for the majority of the discrepancies between the CEE and Aeroseal pressurization test results. Despite these obstacles, the framework is in place to incorporate
Appendix D – Measurement Comparisons
Duct Leakage & Retrofit Duct Sealing in MN C&I Buildings COMM-54682 | Dec 2016 Center for Energy and Environment 131 | P a g e
accurate duct leakage measurements directly into the sealing procedure. With continued software improvements and operator training that addresses critical steps in the protocol, it will eventually be possible for contractors to accurately quantify energy savings as part of commercial retrofit duct sealing projects. The self-measuring nature of the sealing process is a major advantage to energy efficiency programs.
Despite the advantages of the pressurization test, it is typically too expensive to use the test as a diagnostic technique for identifying ductwork that would be cost-effective to seal. It is estimated that the cost to perform the pressurization test independently is 80% of the cost of the actual retrofit duct sealing using the Aeroseal process, which also can provide the pre and post test results at minimal added cost. This is because most of the labor effort for retrofit duct sealing is for isolating (e.g. blocking and sealing-off) sections of ductwork. Thus the cost of sealing the ductwork that is being pressure tested is marginal and should be very cost-effective when considered as an add-on to pressure testing at the same time. While this has the potential to be integrated as an improvement in the construction and/or commissioning process for new ductwork, especially that which must be sealed and tested according to code, it presents a serious dilemma for retrofit duct sealing projects. Performing the test as an independent diagnostic procedure that is followed by a separate visit to seal the ducts nearly doubles the sealing cost.
Aeroseal Commercial Duct Sealing Equipment Pressure Testing
Evaluation
Introduction
Center for Energy and Environment conducted flow rate measurement tests on an Aeroseal commercial duct sealing system to evaluate the measurement capabilities, the measurement control software, and the pressure testing methodology.
Methodology
These tests were performed on The Energy Conservatory (TEC) calibrated fan flow facility. Several tests were performed by manually varying fan speed to match a duct pressure set by the calibration facility or to hit target fan box pressure. The fan box measured flow rates were compared to those from the TEC calibration chamber. The calibration facility is built in accordance with ISO 5167 and AMCA 210, with an implied uncertainty of +/-1%. These tests were performed at all four gate settings over pressure and flow rate operating conditions commonly encountered in duct leakage investigations. The observed variability in the cross sectional area of the gate for nominally the same gate setting lead to two tests for each gate setting, one at a “natural” gate position and one with the gate artificially adjusted to the alignment tick.
Several equipment configurations, predominately differing sealing measures, were tested using Gate 1, prior to settling on the configuration best representing the setup observed in the field. These configurations are listed in Table 27. The test setup and the calibration facility are shown in Figure 62 and Figure 63.

Appendix D – Measurement Comparisons
Duct Leakage & Retrofit Duct Sealing in MN C&I Buildings COMM-54682 | Dec 2016 Center for Energy and Environment 132 | P a g e
These results are obtained by assuming manual control of the test in the software and using the manual knob on the fan box unit to dial in a speed necessary to reach the target pressure established by the calibration facility. These tests therefore do not include errors in the Aerosol software due to an extrapolation from the test target pressure to the operating pressure. Experience comparing Aeroseal results to our measurements in real duct systems have found errors of up to 10% to 15% may occur when extrapolating from target pressures to operating pressures, likely due to the assumptions of the default flow exponent necessary for the extrapolation of a single-point measurement.
Leakage measurements were performed on the fan box unit using a calibrated fan. Several penetrations and seams were sealed independently to measure the leakage on the fan box. Although leakage on the fan box was found to be relatively substantial compared to flow rate for Gates 3 and 4; it was not offered as an explanation for measurement inaccuracy due to 1) uncertainty over whether this leakage is included in the equipment calibration and 2) how this leakage may vary from unit to unit.
Results
Under most conditions the hardware was found to yield very accurate flow rate measurements. Furthermore most circumstances leading to large relative errors are likely to occur during post-sealing measurements with very tight ducts where both flow rates and absolute flow errors are small. Results are summarized in Table 28.
For Gate1 and Gate 2, flow rate measurement error is inversely proportional to fan box pressure. For Gate 1, the Aeroseal measurement is within 2% of the calibrated flow chamber at high fan box pressure (less than -10 Pa). For Gate 2, the measurements are within 4% at high fan box pressure. Accuracy decreases for low fan box pressures. For fan box pressures between -10Pa and 0 Pa the error increases to 6% - 18%.
For Gate 3 and Gate 4 errors mostly depend on the accuracy of the gate position with respect to the calibrated area. For Gate 3, errors ranged between 3% and 23%. For Gate 4, errors ranged between 3% and 58%. In all cases, significantly improved accuracy was obtained when the gate was artificially fixed by using tape to match the alignment ticks on the fan box. In this case, Gate 3 errors were reduced to between 6% and 15%, while errors for Gate 4 were reduced to between 3% and 22%.
Errors given in units of per cent and cfm are plotted as functions of fan box pressure, duct pressure, and calibrated fan flow rate.
The fan box leakage results are given in Figure 24. Fan box leakage increases with decreasing (larger negative) fan box pressures, as expected. Without any sealing, leakage is 18 CFM at -137 Pa. Leakage is reduced to 2.5 CFM at -200 Pa with the top seam sealed. The primary leakage path is the top seam of the main access panel (approximately 90% of the fan box leakage). Furthermore, the difference in results between ½ top seam tape and full top seam tape suggest the leakage is not uniformly distributed over the seam length. Limitations in the testing equipment only allowed fan box pressures up to ~200 Pa. However using the characteristic fan curve for this test (adj. R2 = 0.9999) yields 40 CFM leakage at -600 Pa.
Appendix D – Measurement Comparisons
Duct Leakage & Retrofit Duct Sealing in MN C&I Buildings COMM-54682 | Dec 2016 Center for Energy and Environment 133 | P a g e
Recommendations
Several suggestions for improving the pressurization testing results and methodology are listed below. It is expected that these improvements could be implemented completely in software except for the last recommendation.
We urge improved documentation from the software regarding pressurization testing:
Document the range specifications (fan pressure, duct pressure, and flow rate) and
accuracy (% error for different fan box pressures) and for the fan box unit under
different gate configurations
Document of the length of averaging period and any other assumptions for which flow
rate and pressure measurements are calculated and reported
Report the actual measured flow rate results (at target pressure) in addition to the
calculated flow rate (at the operating pressure)
Document of the formula used to extrapolate the measured results to the operating
pressure
Communicate to the operator and client about the added uncertainty when operating at
low fan pressure (>-10Pa).
Decrease the -4.0 Pa and -0.5 Pa maximum fan pressure recommendations; fan box
pressures less than -10 Pa are where generally accurate measurements were obtained
We would further encourage the pressure testing software to incorporate:
A multi-point test system so that three or four points may be used to develop a power
law fit specific to the system being tested to better predict duct leakage at a different
pressure (see TEC sample report)
o Aside: Envelope leakage testing will need to incorporate a multipoint test method. IECC
2018 and other programs are going to require either ASTM E779 or ASTM E 1827.
Thus if the duct leakage software is a basis for the envelope software, it may be best to
incorporate the multipoint method for ducts as well.
o If the operating pressure of the duct system is uniform over the section to be sealed, and
the fan box can pressurize to the operating pressure, a test at the operating pressure can
be substituted for the multi-point test (Figure 64)
A better software-based proportional fan control algorithm instead of the
timer/countdown based system; additionally have the auto-mode utilize a proportional
control to continuously cruise fan speed to the target pressure (e.g. similar to The Energy
Conservatory TECLOG software).
Finer granularity on the software manual fan control and quantitative feedback (% fan
speed) for the current fan speed
Recommendations for pressurization test method hardware
A more robust method for ensuring the gate setting matches the calibrated cross
sectional area (See Figure 65)

Appendix D – Measurement Comparisons
Duct Leakage & Retrofit Duct Sealing in MN C&I Buildings COMM-54682 | Dec 2016 Center for Energy and Environment 134 | P a g e
Table 27: Description of test configurations
Name Gate setting
Configuration Manual sealing
Gate 1a Natural Complete absent injection wand
Externally sealed empty injector port
Gate 1b Natural Complete absent injection wand
Externally sealed empty injector port, sealed 50% top fan box seam
Gate 1c Artificial Complete absent injection wand
Externally sealed empty injector port, sealed 50% top fan box seam, sealed top of heater box
Gate 1d Artificial Fan box with poly connection only
Sealed 50% top fan box seam
Gate 1e Artificial Complete absent injection wand
Internally sealed empty injector port, sealed 50% top fan box seam
Gate 1f Artificial Complete absent injection wand
Internally sealed empty injector port, sealed 50% top fan box seam
Gate 1g Artificial Complete absent injection wand
Internally sealed empty injector port, sealed 50% top fan box seam
Gate 2a Natural Complete absent injection wand
Internally sealed empty injector port, sealed 50% top fan box seam
Gate 2b Artificial Complete absent injection wand
Internally sealed empty injector port, sealed 50% top fan box seam
Gate 2c Artificial Complete absent injection wand
Internally sealed empty injector port, sealed 50% top fan box seam
Gate 3a Natural Complete absent injection wand
Internally sealed empty injector port, sealed 50% top fan box seam
Gate 3b Artificial Complete absent injection wand
Internally sealed empty injector port, sealed 50% top fan box seam
Gate 3c Artificial Complete absent injection wand
Internally sealed empty injector port, sealed 50% top fan box seam
Gate 4a Natural Complete absent injection wand
Internally sealed empty injector port, sealed 50% top fan box seam
Gate 4b Artificial Complete absent injection wand
Internally sealed empty injector port, sealed 50% top fan box seam
Gate 4c Artificial Complete absent injection wand
Internally sealed empty injector port, sealed 50% top fan box seam

Appendix D – Measurement Comparisons
Duct Leakage & Retrofit Duct Sealing in MN C&I Buildings COMM-54682 | Dec 2016 Center for Energy and Environment 135 | P a g e
Figure 62: Calibration facility and testing setup

Appendix D – Measurement Comparisons
Duct Leakage & Retrofit Duct Sealing in MN C&I Buildings COMM-54682 | Dec 2016 Center for Energy and Environment 136 | P a g e
Figure 63: Complete testing setup (absent injection wand).
Table 28: Percentage errors in flow rate measurement as a function of gate setting and fan box
pressure
Pressure Gate 1 Gate 2 Gate 3 Gate 4 Gate
position
< -30 Pa ≤ 2% ≤ 2% ≤ 23% ≤ 54% Natural
≤ 12% ≤ 20% Artificial
-30 Pa to -10 Pa
≤ 1% ≤ 6% - ≤ 58% Natural
≤ 12% - Artificial
-10 Pa to 0 Pa ≤ 7% ≤ 18% ≤ 20% ≤ 54% Natural
≤ 14% ≤ 22% Artificial

Appendix D – Measurement Comparisons
Duct Leakage & Retrofit Duct Sealing in MN C&I Buildings COMM-54682 | Dec 2016 Center for Energy and Environment 137 | P a g e
Figure 64: A test at the operating pressure (target = operating) can be substituted for a multi-point
test

Appendix D – Measurement Comparisons
Duct Leakage & Retrofit Duct Sealing in MN C&I Buildings COMM-54682 | Dec 2016 Center for Energy and Environment 138 | P a g e
Figure 65: Change in cross sectional area from variability in gate setting. (a) Natural gate setting, and
(b) Artificially adjusted gate setting
(a)
(b)
Appendix E – Additional Sealing Results
Duct Leakage & Retrofit Duct Sealing in MN C&I Buildings COMM-54682 | Dec 2016 Center for Energy and Environment 139 | P a g e
Appendix E: Additional Sealing Results
Figure 66: Leakage flow sealed by retrofit duct sealing as a function of flow rate
Figure 67: Change in leakage (normalized to 100 Pa) after retrofit duct sealing as a function of
operating pressure

Appendix E – Additional Sealing Results
Duct Leakage & Retrofit Duct Sealing in MN C&I Buildings COMM-54682 | Dec 2016 Center for Energy and Environment 140 | P a g e
Figure 68: Change in leakage (normalized to 100 Pa) after retrofit duct sealing as a function of flow
rate

Appendix F – Interview Questions for Field Personnel
Duct Leakage & Retrofit Duct Sealing in MN C&I Buildings COMM-54682 | Dec 2016 Center for Energy and Environment 141 | P a g e
Appendix F: Interview Questions for Field
Personnel
Table 29: Interview questions for field personnel
Interview Profession_Subject_QuestionNo Question
CO_V1_01
SMC_V1_01
SMC_V2_01
BC_V2_01
Just to understand what range of code dates we should talk about, how long have you been a code official? And were you involved in mechanical contracting work before that?
How long have you been doing (did you do) sheet metal work?
How long have you been doing balancing work?
CO_V1_02 Do you do plan review, inspections or both?[For state guys – code consulting]
BC_V2_02
In your experience, which types of projects have an independent balancer and which do not? Does it vary by the type of building, size of building, type of owner, quality of construction, code jurisdiction or other factors?
CO_V1_04
The current Minnesota Rules (Chapter 1346, 2009) for duct sealing are based on design static pressure. My first question about that is pretty basic: the pressures listed in the Rules are positive. Do the requirements apply to exhaust and return ducts that have negative pressures of the same magnitudes, or not?
SMC_V1_05
The current Minnesota Code (Minnesota Rules Chapter 1346, 2009) for duct sealing is based on design static pressure and the pressures listed are positive. In your experience, do sheet metal contractors generally consider these to apply to negative pressure ductwork as well? For example, return shafts? How about toilet and electrical room exhausts? (Or does it just depend on the job specs? Or how the particular code official interprets it?)
SMC_V2_02
In your experience, how often do design engineers in Minnesota specify a more stringent level of duct sealing than required by code? Are they more likely to do that for particular types of projects, and if so, which types? Has it changed over the years?
CO_V1_05
Do you generally find that designers indicate the pressure class for different parts of duct systems on the contract drawings or specifications, or not? (If yes) Where?
SMC_V1_02
Over the years, have you generally found that designers (engineers) indicate the pressure class for different parts of duct systems on the contract drawings or specifications, or not? If yes: Where do you generally find them? Are designers any more or less likely to indicate pressure class now than they used to be?
SMC_V2_03 As you know, the code specifies the amount of duct sealing required based on the design static pressure. Do you find that designers generally indicate the

Appendix F – Interview Questions for Field Personnel
Duct Leakage & Retrofit Duct Sealing in MN C&I Buildings COMM-54682 | Dec 2016 Center for Energy and Environment 142 | P a g e
Interview Profession_Subject_QuestionNo Question
pressure class for different parts of duct systems on the contract drawings or specifications, or not? (If yes) Where?
CO_V1_06
When they don’t, how does the code official determine what design static pressure applies to various parts of the ductwork? [SMACNA duct construction standard says that if the designer doesn’t designate pressure classes, the basis of compliance is 2” for ducts between the supply fan and variable volume control boxes and 1” for all other ducts of any application.]
SMC_V1_03
SMC_V2_04
When the designer doesn’t indicate the pressure class, how do sheet metal contractors determine what design static pressure applies to various parts of the ductwork?
CO_V2_06
SMC_V2_05
BC_V2_13
About what percent of the supply systems you inspect are:
About what percent of the supply systems you install are:
About what percent of the supply systems you balance are:
SMC_V2_06
BC_V2_14
About what percent of the VAV systems you install are:
About what percent of the VAV systems you install are:
About what percent of those that are not fan powered have both a heating and cooling maximum flow, and what percent have only a cooling maximum?
CO_V1_07
What would you say is standard practice for sealing of ductwork in your jurisdiction?
SMC_V2_07 If a project doesn’t specify any requirements beyond code, what level of sealing, if any, would a contractor typically do for supply ducts:
BC_V2_15
In your experience, is ductwork generally sealed:
a. upstream of VAV boxes? b. downstream of VAV boxes? c. upstream of reheat coils in constant volume systems? d. in constant volume systems that don’t have any reheat coils?
CO_V1_08 And is that standard practice code compliant?
CO_V1_09 Is it different in other parts of MN?
SMC_V1_08
SMC_V2_15
In your experience, do sheet metal contractors seal spin-ins, taps and other branch connections in ductwork where they’re sealing transverse seams, or not?
CO_V2_08
SMC_V2_08
BC_V2_16 For any of these, does it make a difference whether the duct work is in a plenum or whether it is exposed in the space served?
CO_V2_09 And what about risers?

Appendix F – Interview Questions for Field Personnel
Duct Leakage & Retrofit Duct Sealing in MN C&I Buildings COMM-54682 | Dec 2016 Center for Energy and Environment 143 | P a g e
Interview Profession_Subject_QuestionNo Question
SMC_V2_09
BC_V2_17
SMC_V2_11
BC_V2_19 Has the amount of sealing done changed over the years?
CO_V2_10 In your interpretation, what level of sealing does the code require for:
SMC_V2_12 What level of sealing, if any, would a contractor do for:
BC_V2_20
In your experience, are return ducts usually sealed or not? (including risers?)/ And how about toilet exhausts, electrical room exhausts and similar exhausts under negative pressure?
a. Return ducts? (Including risers?) b. Toilet exhausts, electrical room exhausts and similar exhausts under
negative pressure?
SMC_V2_13
BC_V2_22
Would that vary by jurisdiction?
Does that vary by jurisdiction?
BC_V2_03
How large would the leakage in a duct system have to be for a good balancer to notice it using their normal balancing procedures? (Expressed as pct of
system flow, or maybe % of branch flow)
BC_V2_04 Would that differ depending on whether it’s a supply, return or exhaust
system?
BC_V2_07
How large would leakage generally have to be before a balancer would note it as a deficiency, either before even completing the balancing, or in the balancing report?
BC_V2_08 Over the years, how often have you run into leakage of that magnitude in systems you were balancing?
BC-V2_10
Are significant leakage problems more common in particular types of system, with particular duct materials, certain types of building or sizes of buildings, certain types of contractor, certain code jurisdictions or any other factor that
you could identify?
BC_V2_11
When you encounter significant leakage problems during balancing, there are presumably three things that can be done – leave the fan at design flow and accept lower flows at the outlets (or inlets), increase the fan flow above the design flow in order to achieve design flows at the outlets (or inlets), or
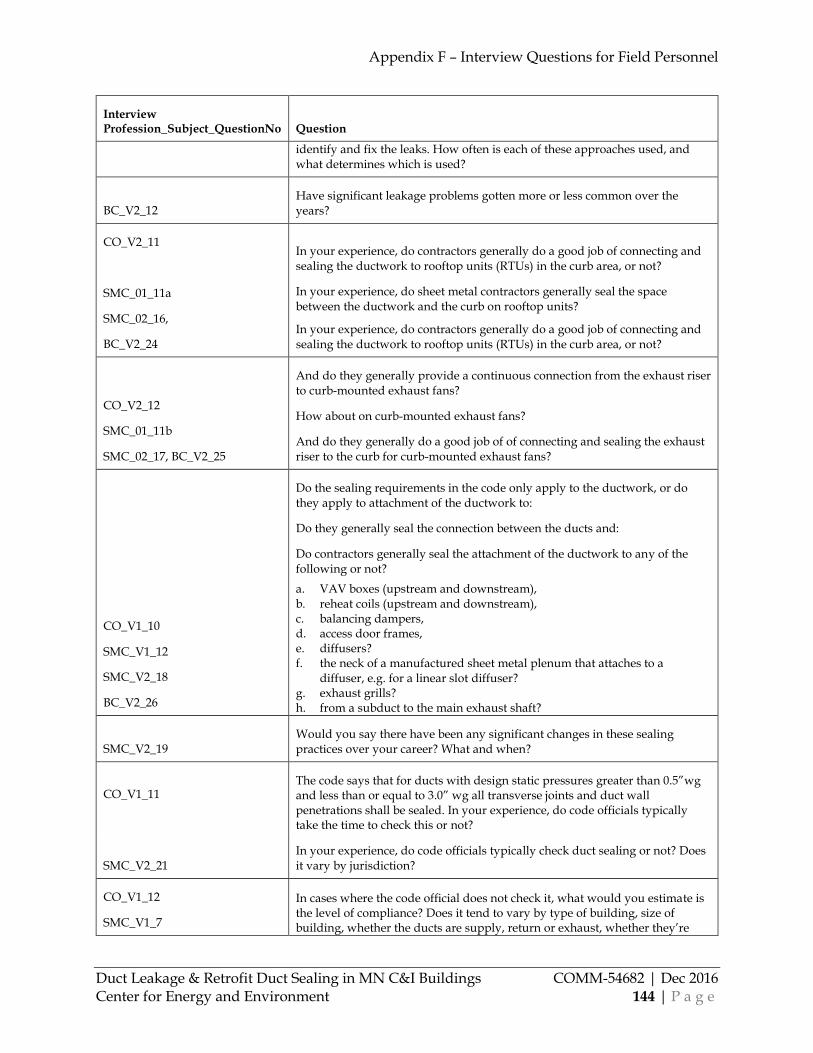
Appendix F – Interview Questions for Field Personnel
Duct Leakage & Retrofit Duct Sealing in MN C&I Buildings COMM-54682 | Dec 2016 Center for Energy and Environment 144 | P a g e
Interview Profession_Subject_QuestionNo Question
identify and fix the leaks. How often is each of these approaches used, and what determines which is used?
BC_V2_12 Have significant leakage problems gotten more or less common over the years?
CO_V2_11
SMC_01_11a
SMC_02_16,
BC_V2_24
In your experience, do contractors generally do a good job of connecting and sealing the ductwork to rooftop units (RTUs) in the curb area, or not?
In your experience, do sheet metal contractors generally seal the space between the ductwork and the curb on rooftop units?
In your experience, do contractors generally do a good job of connecting and sealing the ductwork to rooftop units (RTUs) in the curb area, or not?
CO_V2_12
SMC_01_11b
SMC_02_17, BC_V2_25
And do they generally provide a continuous connection from the exhaust riser to curb-mounted exhaust fans?
How about on curb-mounted exhaust fans?
And do they generally do a good job of of connecting and sealing the exhaust riser to the curb for curb-mounted exhaust fans?
CO_V1_10
SMC_V1_12
SMC_V2_18
BC_V2_26
Do the sealing requirements in the code only apply to the ductwork, or do they apply to attachment of the ductwork to:
Do they generally seal the connection between the ducts and:
Do contractors generally seal the attachment of the ductwork to any of the following or not?
a. VAV boxes (upstream and downstream), b. reheat coils (upstream and downstream), c. balancing dampers, d. access door frames, e. diffusers? f. the neck of a manufactured sheet metal plenum that attaches to a
diffuser, e.g. for a linear slot diffuser? g. exhaust grills? h. from a subduct to the main exhaust shaft?
SMC_V2_19 Would you say there have been any significant changes in these sealing practices over your career? What and when?
CO_V1_11
The code says that for ducts with design static pressures greater than 0.5”wg and less than or equal to 3.0” wg all transverse joints and duct wall penetrations shall be sealed. In your experience, do code officials typically take the time to check this or not?
SMC_V2_21 In your experience, do code officials typically check duct sealing or not? Does it vary by jurisdiction?
CO_V1_12
SMC_V1_7
In cases where the code official does not check it, what would you estimate is the level of compliance? Does it tend to vary by type of building, size of building, whether the ducts are supply, return or exhaust, whether they’re

Appendix F – Interview Questions for Field Personnel
Duct Leakage & Retrofit Duct Sealing in MN C&I Buildings COMM-54682 | Dec 2016 Center for Energy and Environment 145 | P a g e
Interview Profession_Subject_QuestionNo Question
SMC_V2_22 located within a plenum, the contractor, the specific worker, or any other factors that you’ve noticed?
CO_V1_13
For ducts greater than 0.5”wg and less than or equal to 3” wg the requirements seem to have been the same since at least 1994. Do you know what the requirements were before that?
CO_V1_14
For ductwork of 0.5 inches wg and less, the Rules say that “All transverse joints, longitudinal seams and duct wall penetrations shall have no visible gaps and shall be airtight in accordance with Section 1.7 of the SMACNA HVAC Duct Construction Standards – Metal & Flexible.” In your experience, how do code officials interpret this requirement?
CO_V1_15 In your experience, how much sealing if any do contractors typically do in ductwork of design static pressures 0.5” wg or less?
SMC_V2_25
BC_V2_29
Is sheet metal ductwork usually sealed as it’s assembled, or after large portions of it are up? (If after) What would you say is the typical time delay? Is the sealing done by different workers? How are the portions that are mounted tight against the structure sealed? Is dust removed to allow a good seal?
CO_V1_19 What type of attachments do you most commonly see used for flex duct, and how well do they hold up?
CO_V1_23
SMC_V2_26, BC_V2_30
How often do you see gypsum board (without sheet metal ductwork) used for air shafts in commercial buildings? Do you see them for supply, return, exhaust or all three? (In SMC_V2 and BC_V2): Does it vary by jurisdiction? Has this changed over the years? (MN amendments to 1991 UMC in effect in MN from 1994-2004 specifically allowed gyp board exhaust shafts, and the 2000 and 2006 IMC are ambiguous on it).)
CO_V2_21
The 2006 (Sec 603.5.1) and 2000 (Sec 603.4.1) IMCs state that “The use of gypsum boards to form air shafts (ducts) shall be limited to return air systems where the air temperatures do not exceed 125°F (52°C) and the gypsum board surface temperature is maintained above the airstream dew-point temperature…” They define “return air” as “air removed from an approved conditioned space or location and recirculated or exhausted,” so it’s somewhat ambiguous whether this would include exhaust air shafts or not. How do you interpret this for exhausts such as toilet exhausts, electrical room exhausts, etc.?
SMC_V2_27, BC_V2_31
Is there any pattern to the type of building, size of building, ownership type, jurisdiction or anything else where gyp board air shafts are – or have been -- more commonly used?
CO_V2_22
In your interpretation, do the duct sealing requirements apply to gyp board air shafts? Who is responsible for sealing these shafts? Who is responsible for enforcing those requirements?
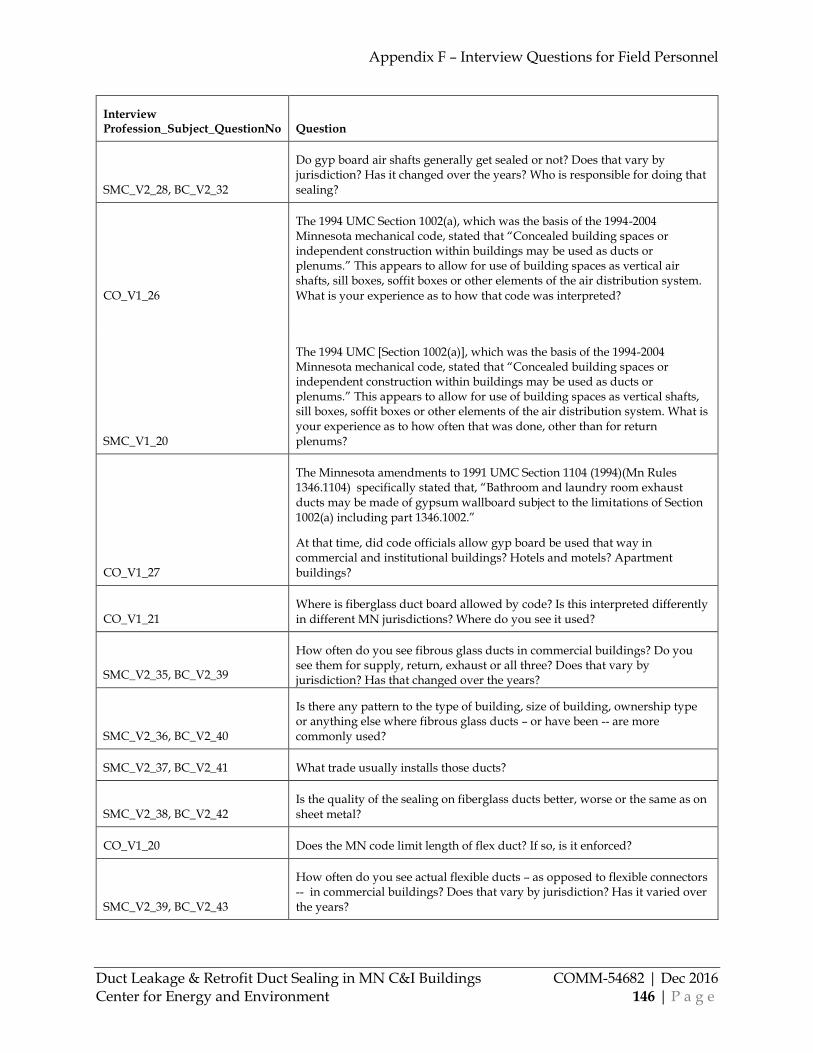
Appendix F – Interview Questions for Field Personnel
Duct Leakage & Retrofit Duct Sealing in MN C&I Buildings COMM-54682 | Dec 2016 Center for Energy and Environment 146 | P a g e
Interview Profession_Subject_QuestionNo Question
SMC_V2_28, BC_V2_32
Do gyp board air shafts generally get sealed or not? Does that vary by jurisdiction? Has it changed over the years? Who is responsible for doing that sealing?
CO_V1_26
The 1994 UMC Section 1002(a), which was the basis of the 1994-2004 Minnesota mechanical code, stated that “Concealed building spaces or independent construction within buildings may be used as ducts or plenums.” This appears to allow for use of building spaces as vertical air shafts, sill boxes, soffit boxes or other elements of the air distribution system.
What is your experience as to how that code was interpreted?
SMC_V1_20
The 1994 UMC [Section 1002(a)], which was the basis of the 1994-2004 Minnesota mechanical code, stated that “Concealed building spaces or independent construction within buildings may be used as ducts or plenums.” This appears to allow for use of building spaces as vertical shafts, sill boxes, soffit boxes or other elements of the air distribution system. What is your experience as to how often that was done, other than for return plenums?
CO_V1_27
The Minnesota amendments to 1991 UMC Section 1104 (1994)(Mn Rules 1346.1104) specifically stated that, “Bathroom and laundry room exhaust ducts may be made of gypsum wallboard subject to the limitations of Section 1002(a) including part 1346.1002.”
At that time, did code officials allow gyp board be used that way in commercial and institutional buildings? Hotels and motels? Apartment buildings?
CO_V1_21 Where is fiberglass duct board allowed by code? Is this interpreted differently in different MN jurisdictions? Where do you see it used?
SMC_V2_35, BC_V2_39
How often do you see fibrous glass ducts in commercial buildings? Do you see them for supply, return, exhaust or all three? Does that vary by jurisdiction? Has that changed over the years?
SMC_V2_36, BC_V2_40
Is there any pattern to the type of building, size of building, ownership type or anything else where fibrous glass ducts – or have been -- are more commonly used?
SMC_V2_37, BC_V2_41 What trade usually installs those ducts?
SMC_V2_38, BC_V2_42 Is the quality of the sealing on fiberglass ducts better, worse or the same as on sheet metal?
CO_V1_20 Does the MN code limit length of flex duct? If so, is it enforced?
SMC_V2_39, BC_V2_43
How often do you see actual flexible ducts – as opposed to flexible connectors -- in commercial buildings? Does that vary by jurisdiction? Has it varied over the years?

Appendix F – Interview Questions for Field Personnel
Duct Leakage & Retrofit Duct Sealing in MN C&I Buildings COMM-54682 | Dec 2016 Center for Energy and Environment 147 | P a g e
Interview Profession_Subject_QuestionNo Question
SMC_V2_40, BC_V2_44 Is there any pattern to the type of building, size of building, ownership type or anything else where flexible ducts are more commonly used?
SMC_V2_41, BC_V2_45
The code limits flexible connectors to 14 ft. Do code officials typically enforce this? The code says the length of actual flexible ducts is unlimited. Are unlimited lengths typically allowed in your experience?
SMC_V2_42, BC_V2_46 Are flex connector connections any more or less likely to leak than hard duct connections? Why?
SMC_V2_43, BC_V2_47 In your experience, does flex connector pressure drop tend to be a significant factor in system performance or not? Why?
SMC_V2_44, BC_V2_48
To change the subject a bit, how often do you work on projects where duct leakage testing is required? What types of projects or types of systems typically require testing?
CO_V1_29
Can concrete or concrete block tunnels (below grade) and corridors (e.g. in mechanical rooms) be used as supply and return ducts? Do the duct sealing requirements apply to these? Who is responsible for doing the sealing, and who is responsible for enforcing the sealing work?
SMC_V2_29, BC_V2_33
How often do you see concrete or concrete block corridors used for air movement (for example in a mechanical room)? Do you see them for supply, return, exhaust or all three? Does that vary by jurisdiction? Has that changed over the years?
SMC_V2_31, BC_V2_35
Do these generally get sealed, for example where they meet the roof deck, or not? Does that vary by jurisdiction? Has it changed over the years? Who is responsible for doing that sealing?
SMC_V2_32, BC_V2_36
How often do you see below-grade concrete or concrete block tunnels used for air movement? Do you see them for supply, return, exhaust or all three? Does that vary by jurisdiction? Has that changed over the years?
SMC_V2_33, BC_V2_37
Is there any pattern to the type of building, size of building, ownership type or anything else where concrete or concrete block tunnels are – or have been -- more commonly used?
SMC_V2_34, BC_V2_38
Do these generally get sealed, for example where they meet the above grade structure, or not? Does that vary by jurisdiction? Has it changed over the
years? Who is responsible for doing that sealing?
SMC_V2_45 BC_V2_49
About what percent of the systems you install have:
About what percent of the systems you balance have:
SMC_V2_46, BC_V2_50 And where do you most commonly see each of those types of systems?
CO_V1_22
Do the duct sealing requirements of the code apply to return air plenums? Is sealing of plenums typically enforced? Who would be responsible for sealing them?

Appendix F – Interview Questions for Field Personnel
Duct Leakage & Retrofit Duct Sealing in MN C&I Buildings COMM-54682 | Dec 2016 Center for Energy and Environment 148 | P a g e
Interview Profession_Subject_QuestionNo Question
SMC_V1_16
So, let’s talk about plenums. Do the duct sealing requirements of Section 603 of the Code apply to plenums? To ask what may be a simple-minded question, would sealing them be the responsibility of the sheet metal contractor or a different contractor? Is there any coordination between the sheet metal and other contractors on this? Is sealing of plenums typically enforced? And if so is it by the mechanical inspector or a different inspector? I assume that return air plenums above ceilings are the most common type of plenums in use today. What other kinds of plenums have you seen?
SMC_V2_47 Beyond ceiling return plenums, what other kinds of plenums do you see, or have you seen in the past?
BC_V2_51 What other kinds of plenums do you see, or have you seen in the past?
CO_V1_25
Are unducted underfloor air distribution systems permitted under the current code? Does the underfloor plenum have to be sealed, and if so who is responsible for doing that work? Who is responsible for enforcing the sealing requirement?
SMC_V1_18 How often do you see unducted underfloor air distribution systems?
SMC_V2_48, BC_V2_52 How often do you see unducted underfloor air distribution systems? Are these typically sealed? Are they typically leak-tested?
SMC_V2_49, BC_V2_53 How often do you see UFAD systems that are fully ducted to the outlets?
CO_V1_24 (SMC_V1_17 & SMC_V2_50) same Q & BC_V2_54)
In older buildings/some buildings I have seen systems that ducted air to a plenum-like sill box enclosure below the windows and between the columns, and be diffused through linear slot diffusers in the sill box. The back and sides of the sill box were the curtain wall and the gyp board column enclosure. Is this construction allowable under the current code in your interpretation? How often do you see systems like this in new construction? Was it common at one time and if so, when?
CO_V1_30 In your experience, what types of systems or what parts of systems or are most likely to have significant leakage?
CO_V1_31
The options for sealing existing ductwork may depend on whether and how they are insulated. My reading of current Minnesota Rules (1346) (2009) is that ducts in plenums within conditioned spaces do not have to be insulated. Is that correct? Did earlier versions of the code ever require these ducts to be insulated? How common would you say it has been over the years to insulate supply ducts in plenums? Have they more often been insulated on the inside or outside?
SMC_V1_25
The options for sealing existing ductwork may depend on whether and how they are insulated. How common would you say it’s been over the years to insulate supply ducts within ceiling return plenums insulated? And were they more often insulated on the inside or the outside?

Appendix F – Interview Questions for Field Personnel
Duct Leakage & Retrofit Duct Sealing in MN C&I Buildings COMM-54682 | Dec 2016 Center for Energy and Environment 149 | P a g e
Interview Profession_Subject_QuestionNo Question
SMC_V2_51, 52, BC_V2_55, 56
The options for sealing existing ductwork may depend on whether and how they are insulated. How common is it to insulate supply ducts within ceiling return plenums? Does it vary by type of project? Has that changed over the years? Are ducts like that more often insulated on the inside or the outside? Has that changed over the years?
CO_V1_32
My reading of current Minnesota Rules is that exhaust ducts do not have to be insulated, except within 3 feet of the outlet. Is that correct? Did earlier versions of the code ever require these ducts to be insulated? How common would you say it is to insulate these ducts? Are they more often insulated on
the inside or outside?
SMC_V1_26
SMC_V2_53, BC_V2_57
How often do you see exhaust ducts insulated, other than within a few feet of their exit from the building? (If at all often: are they more often insulated on the inside or the outside?)
CO_V1_33
SMC_V2_54 Is there anything else I should know about air distribution system leakage?
BC_V2 (not numbered) What air outlet capacity do we need for the flow hoods? Dimensions and flow range of types of diffusers.
CO_V1_34 Is there anyone else you think I should talk to?

Appendix G – Aeroseal Duct Leakage Scorecard
Duct Leakage & Retrofit Duct Sealing in MN C&I Buildings COMM-54682 | Dec 2016 Center for Energy and Environment 150 | P a g e
Appendix G: Aeroseal Duct Leakage Scorecard
Figure 69: Aeroseal duct leakage scorecard