ductility demands on cfs structural connections of
TRANSCRIPT

Proceedings of the Cold-Formed Steel Research Consortium Colloquium 20-22 October 2020 (cfsrc.org)
Ductility Demands on CFS Structural Connections of Advanced High Strength Steel
Chu Ding1, Zhanjie Li2, Hannah Blum3, Yu Xia4, Benjamin W. Schafer5
Abstract
The objective of this paper is to investigate the ductility demand for typical cold-formed steel (CFS) connections when advanced high strength steel (AHSS) is used for the components. Although currently AHSS is mostly used in the automotive industry, the availability of AHSS sheet thicknesses directly applicable for typical CFS use, and similar forming techniques, makes AHSSs ideal candidates for developing next-generation cold-formed construction steel. Research in the last few decades has led to entire families of AHSS grades with unique combinations of strength and ductility (i.e., elongation). For the pursuit of safety and economy, it is important to determine the actual ductility demand of CFS construction so that acceptable ranges of ductility capacity and associated strength reduction factors can be established. Since connections often present the highest ductility demand for materials in CFS construction, this study attempts to bound the ductility demand by testing AHSS in lap-shear bolted connections. The testing program includes five AHSS grades (two dual-phase and three martensitic) and one mild steel grade. Four primary failure modes are studied: bearing, tilting/bearing, net section, and end tear-out. The connection strengths are compared to predictions by design equations in code and literature. The influence on connection strength and deformation resulting from using AHSS are studied. An in-depth understanding of these influences from a fracture standpoint is also explored through numerical simulations. Overall the work intends to provide the first steps towards bringing a wider class of sheet steels to CFS construction.
1. Introduction
For civil engineering construction, typically steels with the yield strength Fy greater than 450 MPa (65 ksi) are regarded as high strength steel. In recent years, the usage of high strength steel has started to pick up in construction, for both buildings and bridges. The report [1] provides a comprehensive summary of the current usage of high strength steels in building and bridge construction. As reported in [1], in the United States (US), 150 North Riverside which was completed in New York in 2017, employed quenched and self-tempered (QST) steels with Fy = 450 MPa (65 ksi) and 485 MPa (70 ksi). Similar examples include 217 W. 57th St. (Chicago, IL) using QST with Fy = 485 MPa (70 ksi), One Manhattan West (New York, NY), and 425 Park Avenue (New York, NY) [1]. For bridge construction, the development of High-Performance Steel (HPS) has started since 1992, resulting in HPS grades 50W,
1 Graduate Research Assistant, Department of Civil & System Engineering, Johns Hopkins University, [email protected] 2 Associate Professor of Civil Engineering, State University of New York Polytechnic Institute, [email protected] 3 Assistant Professor, Department of Civil & Environmental Engineering, University of Wisconsin-Madison, [email protected] 4 Graduate Research Assistant, Department of Civil & Environmental Engineering, University of Wisconsin-Madison, [email protected] 5 Professor, Department of Civil & Environmental Engineering, Johns Hopkins University, [email protected]
70W, and 100W which have Fy = 345 MPa (50 ksi), 480 MPa (70 ksi), and 690 MPa (100 ksi) respectively [1]. Nowadays, the 70W grade has been recognized as a reasonable engineering option for steel plate girders. Currently, the vast majority of the high strength steel adopted for construction belongs to the category of high strength low alloy (HSLA) steel. However, one particular kind of high strength coil steel, generally termed as advanced high strength steel (AHSS), so far has not been studied for its application to construction.
AHSS is the product of the last two decades’ of rapid development in material science [2]. AHSS does not represent a specific steel grade, instead, it represents a still-expanding family of currently over 20 steel grades. These steel grades vary in strength and ductility, but all fall under the name of AHSS. AHSS expand the strength and elongation potential past traditional mild or high strength

2
low alloy (HSLA) steels. Among the AHSS family, the yield strength can exceed 145 ksi (1000 MPa), e.g., martensitic (MS) grades as shown in Figure 1. These steels are also called “GigaPascal steel”.
Figure 1: Steel material space – the range of strength and ductility [2]
Currently, AHSS has been primarily applied in the automotive industry, where the AHSS sheets are formed into shapes for various car components. However, AHSS is an ideal candidate for the next generation of cold-formed construction steels. The forming techniques commonly employed in the automobile industry are highly relevant to cold-formed steel member manufacturing, which assures that forming will not be the primary hurdle to AHSS application in the cold-formed steel construction industry. Even the sheet thicknesses commonly employed in AHSS automotive applications are compatible with cold-formed steel construction. Together, these two factors along with the unique properties of AHSS make the material worthy of further study for use in steel construction.
2. Design with High-Strength Steel
At present, the American Iron and Steel Institute (AISI) Specification [3] lists no AHSS grades in Section A3.1 as applicable steels. For steels within the scope of applicable steels, a certain reduction on strength is required based on elongation. For elongation between 3% and 10%, a strength reduction factor of 0.9 is required on both Fy and Fu. For elongation smaller than 3%, a strength reduction factor of 0.75 is required, and the specification caps the maximum to 60 ksi (414 MPa) for Fy and 62 ksi (427 MPa) for the Fu. For steels outside the scope of the applicable steels, certain requirements on the uniform and local ductility and further restrictions are made regarding structural usage.
For AHSS, the marginal cost of the increase in ductility is significantly larger than that of higher strength. Therefore, the economy of using AHSS as construction steel is dependent on the level of steel ductility that a building requires.
Steel ductility is commonly evaluated by elongation or strain. The current specification on steel ductility is primarily based on the work of Dhalla and Winter [3][4]. They recognized that strain varied along the length of fractured tensile coupons instead of being uniform, and proposed the concepts of
uniform ductility and local ductility. The concept of the uniform and local ductility is based on the simplification that the strain distribution is the superposition of a low strain uniformly distributed over the entire length and a high strain concentrated over a small length. It was proposed that uniform and local ductility can be determined from strain at 3 in (76.2 mm) gauge and 1/2 in (12.7 mm) gauge length. Their work lay the groundwork for the AISI-S903 test standard [5]. The uniform-local ductility approach was later applied to high strength G550 steel by Rogers and Hancock [7]. Beyond tension coupon tests, Rogers and Hancock also studied bolted lap shear connections and concluded that no strength reduction was required for G550 bolted connections, though G550 steel was found to satisfy only part of the ductility requirements proposed by Dhalla and Winter [4]. The uniform-local concept allows for identifying different steels based on the nature in which they yield. For example, two steel grades with the same 2 in. (50 mm) elongation can have different uniform and local ductility combinations. In the contemporary literature, a similar idea has been proposed for evaluating metal forming [8], which uses the terms of uniform formality and local formality.
Connections usually present the highest strain demand on a material as evidenced by high elastic stress concentration factors among many common connections. Based on the above consideration, this study attempts to evaluate AHSS’ ductility from a series of tests on lap-shear bolted connections. The testing program herein includes five AHSS grades and one mild steel for comparison. Each steel grade is tested for four distinct failure modes. They include bearing, net section, tilting/bearing (out-of-plane shear), and end tear-out. The ultimate loads are compared to the predictions by the AISI S100 to determine if these steel grades can be directly designed by the current specification or if a strength reduction is required. It is assumed that current design expressions inherently require sufficient ductility, thus unconservative tested strengths imply that the studied AHSS grades have insufficient ductility.
3. Tensile Coupon Testing
The steel grades considered in this investigation consisted of five distinct AHSS grades and one mild steel grade. Tensile coupon tests were conducted on all the steel grades per ASTM E08 [9]. A 1 inch (25 mm) MTS extensometer was used for strain measurement. The results are summarized in Table 1.
Both 0.2% yield stress and ultimate tensile stress are reported for each material. The yield stresses of the AHSS grades tested range from 365 MPa to 1467 MPa. All of the AHSS grades tested have the 𝐹𝑢/𝐹𝑦,0.2 ratio higher than
1.05, which is one of the requirements proposed by Dhalla and Winter [4]. The 𝐹𝑢/𝐹𝑦,0.2 ratios of the DP steels are equal
or greater than that of the mild steels tested, indicating good
3
strain hardening ability, while the 𝐹𝑢/𝐹𝑦,0.2 ratios of the MS
steels are smaller than that of the mild steels tested.
Material ductility parameters are also reported. The reported ductility parameters are %EL (percent elongation), 𝜖𝑢 (strain
at ultimate tensile stress), 𝜖𝑓 (strain at fracture), 𝜖𝑢𝑛𝑖𝑓𝑜𝑟𝑚
(uniform ductility), 𝜖𝑙𝑜𝑐𝑎𝑙 (local ductility), and 𝜖𝑓𝑟𝑎𝑐 (true
fracture strain). Both 𝜖𝑢 and 𝜖𝑓 are based on the readings of
a 1 inch (25 mm) gauge length MTS extensometer. Though the standard gauge length is 2 inch (50 mm), 1 inch (25 mm) is deemed acceptable, because the coupon strain distribution over the length remains mostly uniform before necking. It is worth noting that the percent elongation %EL
is essentially 𝜖𝑓 in the percentage format, and comparison
to elongation over 2 inch (50 mm) length should be conducted with caution. Figure 2 shows the stress-strain
curve of one of the MS1200-1.4 coupons. The 𝜖𝑢𝑛𝑖𝑓𝑜𝑟𝑚 and
𝜖𝑙𝑜𝑐𝑎𝑙 parameters are determined based on the method
suggested by Dhalla and Winter [5]. However, because 𝜖𝑓 is
based on 1 inch (25 mm) gauge length instead of 2 in (50 mm) gauge length. The equation proposed by Dhalla and Winter [5] is adjusted so that 1 inch (25 mm) gauge length reading can be used. The true fracture strain 𝜖𝑓𝑟𝑎𝑐 is
calculated from the tensile coupon reduction of area at fracture. Because the tensile coupons reported herein are flat sheet coupons, measurement of thickness reduction was conducted by a microscope with a 20X magnification factor. A similar approach for measuring flat sheet coupon true fracture strain has been taken in the literature [8]. It is
worth noting that 𝜖𝑓𝑟𝑎𝑐 and 𝜎𝑓𝑟𝑎𝑐 are true values instead of
engineering. They are shown in Figure 2 only for demonstrating their magnitudes.
Figure 2: Engineering stress-strain curve of the MS1200-1.4
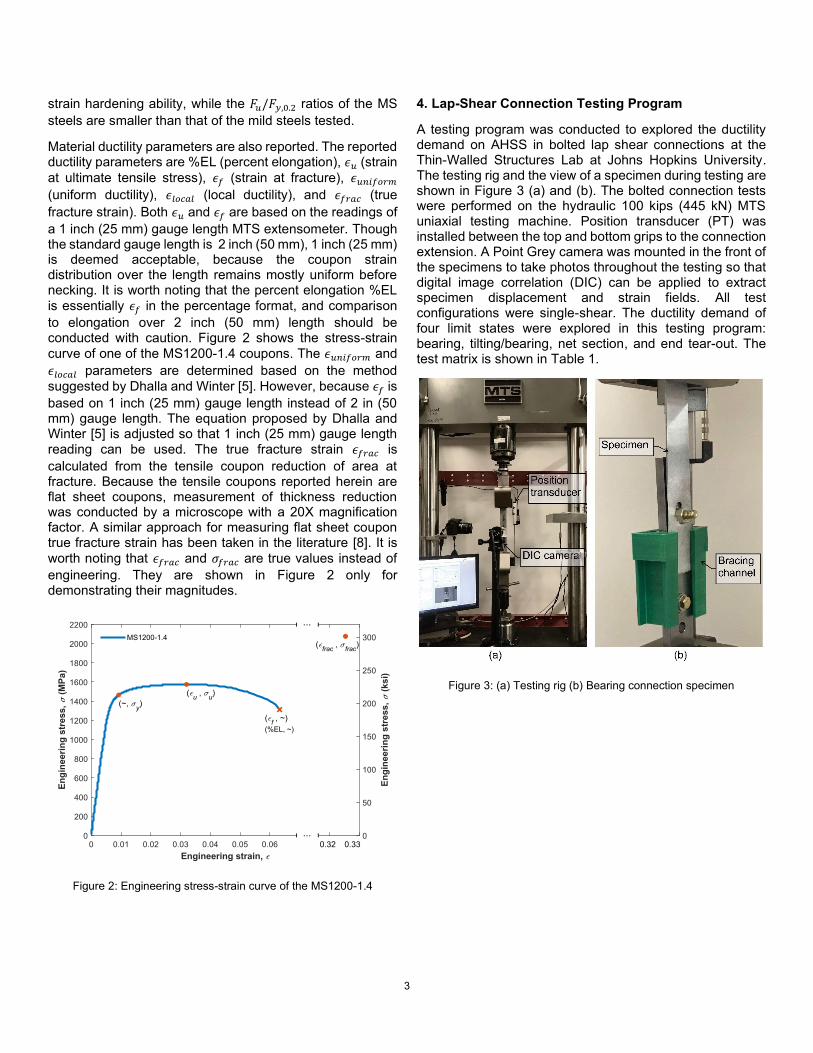
4. Lap-Shear Connection Testing Program
A testing program was conducted to explored the ductility demand on AHSS in bolted lap shear connections at the Thin-Walled Structures Lab at Johns Hopkins University. The testing rig and the view of a specimen during testing are shown in Figure 3 (a) and (b). The bolted connection tests were performed on the hydraulic 100 kips (445 kN) MTS uniaxial testing machine. Position transducer (PT) was installed between the top and bottom grips to the connection extension. A Point Grey camera was mounted in the front of the specimens to take photos throughout the testing so that digital image correlation (DIC) can be applied to extract specimen displacement and strain fields. All test configurations were single-shear. The ductility demand of four limit states were explored in this testing program: bearing, tilting/bearing, net section, and end tear-out. The test matrix is shown in Table 1.
Figure 3: (a) Testing rig (b) Bearing connection specimen
. .
...
...

4
Table 1. Summary of average material properties
Material 𝑡 (mm) 𝐹𝑦,0.2 (MPa) 𝐹𝑢 (MPa) %EL 𝜖𝑢 𝜖𝑓 𝜖𝑢𝑛𝑖𝑓𝑜𝑟𝑚 𝜖𝑙𝑜𝑐𝑎𝑙 𝜖𝑓𝑟𝑎𝑐 𝐹𝑢/𝐹𝑦,0.2
MILD400 1.4 387 483 20% 0.17 0.20 0.17 0.24 / 1.25
DP340 1.4 365 592 17% 0.12 0.17 0.12 0.22 0.90 1.62
DP700 1.4 778 972 13% 0.07 0.13 0.07 0.18 0.84 1.25
MS1200-1.4 1.4 1467 1569 4% 0.03 0.04 0.03 0.06 0.46 1.07
MS1030 1.0 1228 1296 3% 0.02 0.03 0.02 0.04 0.68 1.06
MS1200-1.0 1.0 1342 1496 4% 0.03 0.04 0.03 0.06 0.68 1.11
Table 2: Test matrix
Limit state Bolt nominal dia., d
in (mm) Width, w in (mm)
Length, L in (mm)
Thickness, t in (mm)
End distance, e in (mm) Repetition
MILD400 B 3/8 (9.5) 1.5 (38.1) 9.0 (228.6) 0.054 (1.4) 2.5 (63.5) 3
TB 3/8 (9.5) 1.5 (38.1) 9.0 (228.6) 0.054 (1.4) 2.5 (63.5) 3
SR 3/8 (9.5) 1.5 (38.1) 9.0 (228.6) 0.054 (1.4) 0.5 (12.7) 2
NS 3/4 (19.1) 1.5 (38.1) 9.0 (228.6) 0.054 (1.4) 2.5 (63.5) 3
DP340 B 3/8 (9.5) 1.5 (38.1) 9.0 (228.6) 0.054 (1.4) 2.5 (63.5) 3
TB 3/8 (9.5) 1.5 (38.1) 9.0 (228.6) 0.054 (1.4) 2.5 (63.5) 3
SR 3/8 (9.5) 1.5 (38.1) 9.0 (228.6) 0.054 (1.4) 0.5 (12.7) 2
NS 3/4 (19.1) 1.5 (38.1) 9.0 (228.6) 0.054 (1.4) 2.5 (63.5) 3
DP700 B 3/8 (9.5) 1.5 (38.1) 9.0 (228.6) 0.054 (1.4) 2.5 (63.5) 3
TB 3/8 (9.5) 1.5 (38.1) 9.0 (228.6) 0.054 (1.4) 2.5 (63.5) 3
NS 19.1 (3/4) 1.5 (38.1) 9.0 (228.6) 0.054 (1.4) 2.5 (63.5) 3
MS1200-1.4 B 3/8 (9.5) 1.5 (38.1) 9.0 (228.6) 0.054 (1.4) 2.5 (63.5) 3
TB 3/8 (9.5) 1.5 (38.1) 9.0 (228.6) 0.054 (1.4) 2.5 (63.5) 3
SR 3/8 (9.5) 1.5 (38.1) 9.0 (228.6) 0.054 (1.4) 0.5 (12.7) 2
NS 3/4 (19.1) 1.5 (38.1) 9.0 (228.6) 0.054 (1.4) 2.5 (63.5) 2
MS1030 B 3/8 (9.5) 1.5 (38.1) 9.0 (228.6) 0.039 (1.0) 2.5 (63.5) 3
TB 3/8 (9.5) 1.5 (38.1) 9.0 (228.6) 0.039 (1.0) 2.5 (63.5) 3
NS 3/4 (19.1) 1.5 (38.1) 9.0 (228.6) 0.039 (1.0) 2.5 (63.5) 3
MS1200-1.0 B 3/8 (9.5) 1.5 (38.1) 9.0 (228.6) 0.039 (1.0) 2.5 (63.5) 3
TB 3/8 (9.5) 1.5 (38.1) 9.0 (228.6) 0.039 (1.0) 2.5 (63.5) 3
NS 3/4 (19.1) 1.5 (38.1) 9.0 (228.6) 0.039 (1.0) 2.5 (63.5) 3 Note: B – bearing, TB – tilting/bearing, SR – end tear-out, NS – net section
Figure 4: Schematic view of test configuration (a) configuration for net section and bearing (b) configuration for tilting/bearing
Among the four limit states, the specimens of the tilting/bearing limit state consist of two sheets, while the other three specimen types consist of only one sheet. Figure 4 provides a schematic view of the two types of configurations. For the bearing, net section, and end tear-out specimens, each specimen consists of a thin sheet and a /8” (9.5 mm) thick steel plate (ASTM A109). Packing plates were used for ensuring that the loading is concentric. To prevent curling, the bearing and net sections specimens were enclosed by a 3D-printed PLA channel. The channel was supported by a 1/4" bolt installed on the /8” (9.5 mm) thick plate and greased inside to minimize the friction between the thin sheet and the polylactic acid (PLA) channel. The practice of applying restraints can also be found in [10]. For the end tear-out specimens, the PLA channel was not used because it was deemed by the author that the influence of curling was limited for small end distance specimens. Also, bolt tilting was reduced, specifically: the hole on the /8” thick plate was drilled with an undersized hole for /8” bolt and threaded for /4” bolt.
hinsheet
racingchannel
Packingplate
Packingplate
/8" thickplate
hinsheet
hinsheet
(a) (b)
5
For the titling/bearing tests, the specimens were made of two thin sheets. Neither bracing channel nor bolt restraint was added for the tilting/bearing specimens.
The test specimens were prepared from AHSS sheets supplied by the AISI steel bank. The specimens were sawn-cut from the steel sheets and later drilled with standard holes sizes. hree types of high strength bolts are used, /4” ASTM 350, SAE Grade 8 3/4" and Class 12.9 M10 (ISO 898-1). The Class 12.9 M10 bolts were used for the bearing specimens of DP700, MS1200-1.4, MS1200-1.0, and MS1030 to avoid bolt shear.
5. Connection Testing Results
5.1 Failure modes and load-deformation curves
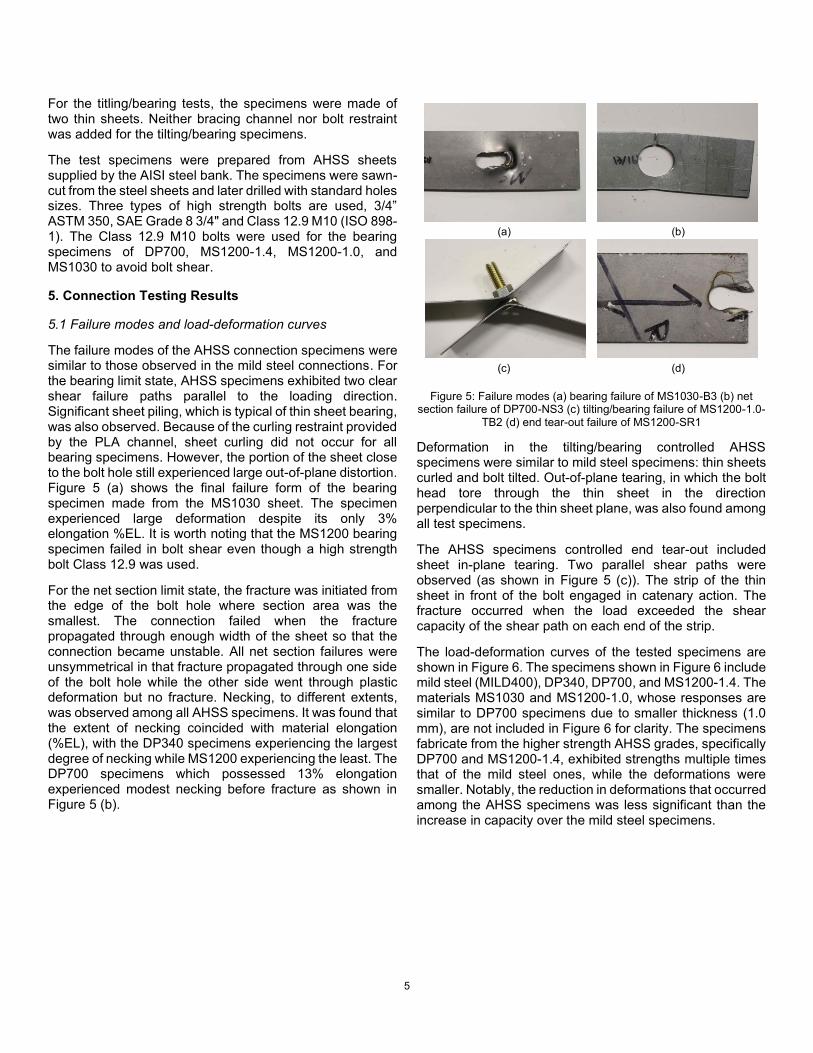
The failure modes of the AHSS connection specimens were similar to those observed in the mild steel connections. For the bearing limit state, AHSS specimens exhibited two clear shear failure paths parallel to the loading direction. Significant sheet piling, which is typical of thin sheet bearing, was also observed. Because of the curling restraint provided by the PLA channel, sheet curling did not occur for all bearing specimens. However, the portion of the sheet close to the bolt hole still experienced large out-of-plane distortion. Figure 5 (a) shows the final failure form of the bearing specimen made from the MS1030 sheet. The specimen experienced large deformation despite its only 3% elongation %EL. It is worth noting that the MS1200 bearing specimen failed in bolt shear even though a high strength bolt Class 12.9 was used.
For the net section limit state, the fracture was initiated from the edge of the bolt hole where section area was the smallest. The connection failed when the fracture propagated through enough width of the sheet so that the connection became unstable. All net section failures were unsymmetrical in that fracture propagated through one side of the bolt hole while the other side went through plastic deformation but no fracture. Necking, to different extents, was observed among all AHSS specimens. It was found that the extent of necking coincided with material elongation (%EL), with the DP340 specimens experiencing the largest degree of necking while MS1200 experiencing the least. The DP700 specimens which possessed 13% elongation experienced modest necking before fracture as shown in Figure 5 (b).
Figure 5: Failure modes (a) bearing failure of MS1030-B3 (b) net section failure of DP700-NS3 (c) tilting/bearing failure of MS1200-1.0-
TB2 (d) end tear-out failure of MS1200-SR1
Deformation in the tilting/bearing controlled AHSS specimens were similar to mild steel specimens: thin sheets curled and bolt tilted. Out-of-plane tearing, in which the bolt head tore through the thin sheet in the direction perpendicular to the thin sheet plane, was also found among all test specimens.
The AHSS specimens controlled end tear-out included sheet in-plane tearing. Two parallel shear paths were observed (as shown in Figure 5 (c)). The strip of the thin sheet in front of the bolt engaged in catenary action. The fracture occurred when the load exceeded the shear capacity of the shear path on each end of the strip.
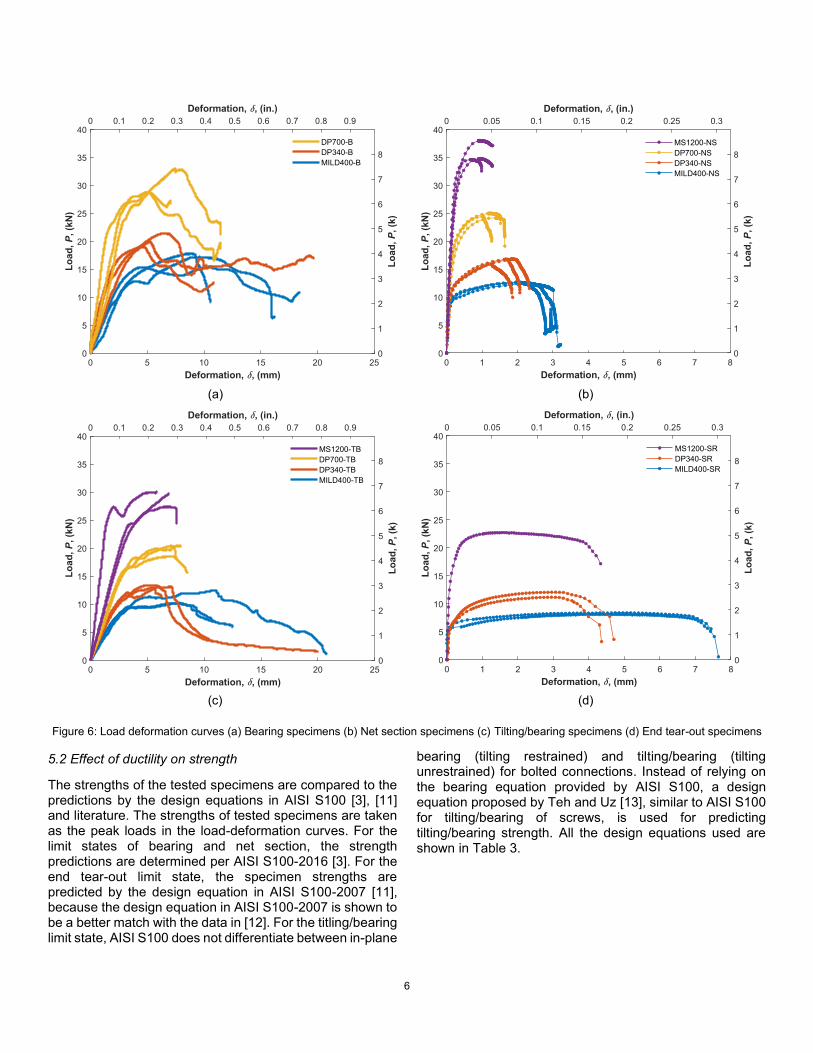
The load-deformation curves of the tested specimens are shown in Figure 6. The specimens shown in Figure 6 include mild steel (MILD400), DP340, DP700, and MS1200-1.4. The materials MS1030 and MS1200-1.0, whose responses are similar to DP700 specimens due to smaller thickness (1.0 mm), are not included in Figure 6 for clarity. The specimens fabricate from the higher strength AHSS grades, specifically DP700 and MS1200-1.4, exhibited strengths multiple times that of the mild steel ones, while the deformations were smaller. Notably, the reduction in deformations that occurred among the AHSS specimens was less significant than the increase in capacity over the mild steel specimens.
(a) (b)
(c) (d)
6
Figure 6: Load deformation curves (a) Bearing specimens (b) Net section specimens (c) Tilting/bearing specimens (d) End tear-out specimens
5.2 Effect of ductility on strength
The strengths of the tested specimens are compared to the predictions by the design equations in AISI S100 [3], [11] and literature. The strengths of tested specimens are taken as the peak loads in the load-deformation curves. For the limit states of bearing and net section, the strength predictions are determined per AISI S100-2016 [3]. For the end tear-out limit state, the specimen strengths are predicted by the design equation in AISI S100-2007 [11], because the design equation in AISI S100-2007 is shown to be a better match with the data in [12]. For the titling/bearing limit state, AISI S100 does not differentiate between in-plane
bearing (tilting restrained) and tilting/bearing (tilting unrestrained) for bolted connections. Instead of relying on the bearing equation provided by AISI S100, a design equation proposed by Teh and Uz [13], similar to AISI S100 for tilting/bearing of screws, is used for predicting tilting/bearing strength. All the design equations used are shown in Table 3.
(a) (b)
(c) (d)
7
Table 3: Summary of design equations for strength predictions
Limit state Format Source
Bearing 𝑃𝑛 = 𝐶𝑚𝑓𝑑𝑡𝐹𝑢 AISI J3.3.1 (2016)
Net section 𝑃𝑛 = 𝑈𝑠𝑙𝐹𝑢𝐴𝑛𝑡 AISI J6.2 (2016)
End tear-out 𝑃𝑛 = 𝑡𝑒𝐹𝑢 AISI E4.3.2 (2007)
Titling/bearing 𝑃𝑛 = 2.65𝑑1/2𝑡4/3𝑤𝑛1/6
𝐹𝑢 Teh and Uz (2017)
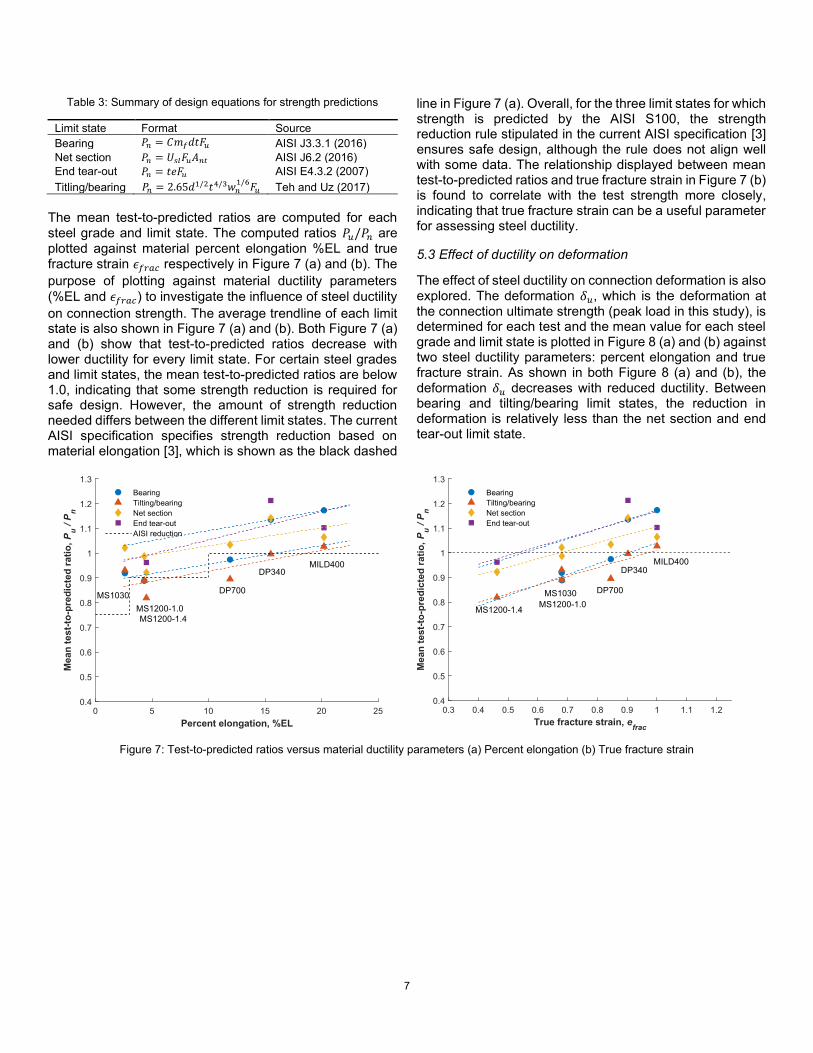
The mean test-to-predicted ratios are computed for each steel grade and limit state. The computed ratios 𝑃𝑢/𝑃𝑛 are plotted against material percent elongation %EL and true fracture strain 𝜖𝑓𝑟𝑎𝑐 respectively in Figure 7 (a) and (b). The
purpose of plotting against material ductility parameters
(%EL and 𝜖𝑓𝑟𝑎𝑐) to investigate the influence of steel ductility
on connection strength. The average trendline of each limit state is also shown in Figure 7 (a) and (b). Both Figure 7 (a) and (b) show that test-to-predicted ratios decrease with lower ductility for every limit state. For certain steel grades and limit states, the mean test-to-predicted ratios are below 1.0, indicating that some strength reduction is required for safe design. However, the amount of strength reduction needed differs between the different limit states. The current AISI specification specifies strength reduction based on material elongation [3], which is shown as the black dashed
line in Figure 7 (a). Overall, for the three limit states for which strength is predicted by the AISI S100, the strength reduction rule stipulated in the current AISI specification [3] ensures safe design, although the rule does not align well with some data. The relationship displayed between mean test-to-predicted ratios and true fracture strain in Figure 7 (b) is found to correlate with the test strength more closely, indicating that true fracture strain can be a useful parameter for assessing steel ductility.
5.3 Effect of ductility on deformation
The effect of steel ductility on connection deformation is also explored. The deformation 𝛿𝑢, which is the deformation at the connection ultimate strength (peak load in this study), is determined for each test and the mean value for each steel grade and limit state is plotted in Figure 8 (a) and (b) against two steel ductility parameters: percent elongation and true fracture strain. As shown in both Figure 8 (a) and (b), the deformation 𝛿𝑢 decreases with reduced ductility. Between bearing and tilting/bearing limit states, the reduction in deformation is relatively less than the net section and end tear-out limit state.
Figure 7: Test-to-predicted ratios versus material ductility parameters (a) Percent elongation (b) True fracture strain

8
Figure 8: Deformation at peak load versus material ductility parameters (a) Percent elongation (b) true fracture strain
6. Numerical Simulation
6.1 General
This section explores the use of numerical simulation to generate an in-depth understanding of how steel ductility affects connection strength and deformation. Two limit states, bearing and net section, are focused on herein because these two limit states represent distinct characteristics in both fracture mechanisms and the common conception of “ductile” and “brittle” failures. Due to high stress concentrations, steel sheet material in these connections experiences plastic strain far beyond the limit of a conventional stress-strain curve, in which strain is typically averaged over 2 in (50 mm) or 1 inch (25 mm) gauge length. Therefore, the true stress-strain curves converted from the tensile coupon test results were extended up to the true fracture strain and stress, so that material response at high localized strain can be realistically modeled. Isotropic plastic
models were used. The Young’s modulus 𝐸 was defined as 29,500 ksi (203,000 MPa) for all the steels.
6.2 Net section limit state
The net section model is shown in Figure 9. The thin sheet is modeled by C3D20 elements in ABAQUS[14]. As shown in Figure 9, the area around the bolt hole is finely meshed to better capture the strain gradient. The bolt is modeled as a rigid body surface. Hard contact is defined between the hole edge and the bolt. The model is simulated by displacement control, with displacement applied at the reference node of the bolt part. The far left side of the thin sheet as shown in Figure 9 is restrained translationally, while the far right side remains free. The two sides of the thin sheet near the far right end are restrained in the vertical translational DOF, which simulates the curling restraint provided by the PLA channel in the tests.
Figure 9: Numerical model for the net section limit state
igid body surface
restrained eachside to prevent curling
ar end pinned ( 1, , restrained)
1
ontact interaction
isplacement applied atthe reference node
ine meshing withmin. element size . mm

9
Figure 10: Load deformation curves of the net section failure numerical models versus test results
Figure 11: Net section model simulation results of load versus maximum von Mises strain
Figure 12: Numerical model for the bearing limit state
The simulated load-deformation curves are compared to the test results in Figure 10. The numerical response matches reasonably well with the test results. The maximum von Mises strain 𝜖𝑚𝑎𝑥 in the model, which is located in the net section with the smallest area, is monitored through the analysis. When the 𝜖𝑚𝑎𝑥 reaches the true fracture strain
𝜖𝑓𝑟𝑎𝑐, fracture or signifcant damage would be predicted.
Figure 10 shows the locations where 𝜖𝑚𝑎𝑥 reaches 𝜖𝑓𝑟𝑎𝑐.
These locations are near where the tests fail or exhibit large strength degradation, indicating that the true fracture strain
𝜖𝑓𝑟𝑎𝑐 can be useful for predicting net section fracture or
damage.
Figure 11 shows the connection load against 𝜖𝑚𝑎𝑥. The simulation results are also compared with test results in which 𝜖𝑚𝑎𝑥 is obtained through DIC analysis of the tests. The comparison shows a reasonable match between the simulation and test results. Beyond that, Figure 11 also
shows that 𝜖𝑚𝑎𝑥 reaches 𝜖𝑓𝑟𝑎𝑐 after the connection reaches
the ultimate strength. This indicates that fracture induced from lower ductility is not limiting the connection net section strength.
6.3 Bearing limit state
The model for the bearing limit state is shown in Figure 12. Unlike the net section model, the bearing model considers the bolt tilting and the local sheet distortion near the bolt hole. This is accomplished by directly modeling the thick plate and allowing bolt tilting in the model. Under displacement control, the displacement is applied at the reference node of the thick plate. The bolt head and nut are also directly incorporated in the model. It is determined through a sensitivity analysis that the restraint provided by the bolt head and nut greatly affects the strength and stiffness of the simulated connections. The perfect-restraint model (no gap between head/nut and sheet/plate) and the no-restraint (no head and nut) respectively set the upper and
igid bodysurface
eference node for thebolt allow bolt tearingand rotation ( allowed at 1 and 5)
urling restraint at eachside ( restrained)
Plate rigid bodypin to referencenode
Apply displacement at thereference node
1
4
5
Sheet left end pinned toreference node ( 1, , restrained)
"Hard" contact defined for hin sheet and thick plate olt and thin sheet olt and thick plate
Gap between sheet/plateand bolt

10
lower bound of the simulation results. A gap equal to 0.06 inch (1.5 mm) is selected for the final mode
For the models of the bearing limit state, the simulation results are compared to test results in Figure 13. Although the simulation slightly overestimates the test elastic stiffness, the difference is asserted to be reasonable. The simulated strengths are within a reasonable match with the test strengths. Similar to the net section model, the maximum von Mises strain is monitored throughout. In opposition to the net section model, with DP700 as one exception, the condition of 𝜖𝑚𝑎𝑥 = 𝜖𝑓𝑟𝑎𝑐 is reached before
connection ultimate strength is obtained, suggesting that some level of material damage has occurred before the connection bearing strength is achieved.
Figure 13: Load deformation curves of the bearing failure numerical models versus test results
7. Conclusions
This paper reports on a series of experiments on single shear bolted connections made of advanced high strength steel (AHSS). These tests represent an initial step towards making AHSS available as the building construction steel. The test ultimate loads are compared to applicable AISI S100 design equations and proposed design equations in the literature. The study finds a positive correlation between the reduction in strength and lower steel ductility and the strength reduction rules in the AISI S100 [3] are found to be generally applicable. The study compares the connection deformation among different grades and discovers that connection deformation decreases with reduced steel ductility, though the extent of reduction varies among the limit states studied. By a series of numerical simulations, this paper also provides an examination of the influence of steel
ductility on connection strength and deformation through the perspective of fracture and material damage.
8. Acknowledgments
This paper is based in part upon work supported by the U.S. National Science Foundation under Grant No. 1760953. Any opinions, findings, and conclusions or recommendations expressed in this material are those of the author(s) and do not necessarily reflect the views of the National Science Foundation.
References
[1] . W. Schafer, “High Strength Steel eport,” Ad Hoc Task Group on High Strength Steels, Chicago, Illinois, 2019.
[2] S. Keeler, M. Kimchi, and P. Mooney, “Advanced High-Strength Steels Application Guidelines Version . ,” WorldAutoSteel, Apr. 2017.
[3] AISI S1 , “North American Specification for the esign of Cold- ormed Steel Structural Members,” American Iron and Steel Institute, Washington, DC, 2016.
[4] A. K. halla and G. Winter, “Suggested Steel uctility equirements,” J. Struct. Div., vol. 100, no. 2, pp. 445–462, 1974.
[5] A. K. halla and G. Winter, “Steel uctility Measurements,” J. Struct. Div., vol. 100, no. ST2, 1974.
[6] AISI S9 , “ est Standard for etermining the Uniform and Local Ductility of Carbon and Low-Alloy Steels,” American Iron and Steel Institute, Washington, DC, 2017.
[7] . A. ogers and G. J. Hancock, “ uctility of G55 Sheet Steels in Tension,” J. Struct. Eng., vol. 123, no. 12, pp. 1586–1594, Dec. 1997, doi: 10.1061/(ASCE)0733-9445(1997)123:12(1586).
[8] . Hance, “Advanced High-Strength Steel (AHSS) Performance Level efinitions and argets,” SAE Int. J. Mater. Manuf., vol. 11, no. 4, pp. 505–516, Apr. 2018, doi: 10.4271/2018-01-0629.
[9] AS M E8/E8M, “ est Methods for ension esting of Metallic Materials,” AS M International, 1 . doi: 10.1520/E0008_E0008M-16A.
[10] . A. ogers and G. J. Hancock, “ olted connection tests of thin G550 and G sheet steels,” J. Struct. Eng., vol. 124, no. 7, pp. 798–808, Jul. 1998, doi: 10.1061/(ASCE)0733-9445(1998)124:7(798).
[11] AISI S1 , “North American Specification for the esign of Cold- ormed Steel Structural Members,” American Iron and Steel Institute, Washington, DC, 2007.
[12] . ing, S. orabian, and . W. Schafer, “Strength of Bolted Lap Joints in Steel Sheets with Small End istance,” J. Struct. Eng., doi: 10.1061/(ASCE)ST.1943-541X.0002847.
[13] L. H. eh and M. E. Uz, “Ultimate ilt-Bearing Capacity of Bolted Connections in Cold- educed Steel Sheets,”

11
J. Struct. Eng., vol. 143, no. 4, p. 04016206, Apr. 2017, doi: 10.1061/(ASCE)ST.1943-541X.0001702.
[14] ABAQUS 6.14. RI, USA: Dassault Systemes Simulia Corp Providence, 2014.