ductless mini-split heat pump comfort...
TRANSCRIPT
Ductless Mini-Split Heat Pump Comfort Evaluation K. Roth, N. Sehgal, and C. Akers Fraunhofer Center for Sustainable Energy Systems
March 2013
NOTICE
This report was prepared as an account of work sponsored by an agency of the United States government. Neither the United States government nor any agency thereof, nor any of their employees, subcontractors, or affiliated partners makes any warranty, express or implied, or assumes any legal liability or responsibility for the accuracy, completeness, or usefulness of any information, apparatus, product, or process disclosed, or represents that its use would not infringe privately owned rights. Reference herein to any specific commercial product, process, or service by trade name, trademark, manufacturer, or otherwise does not necessarily constitute or imply its endorsement, recommendation, or favoring by the United States government or any agency thereof. The views and opinions of authors expressed herein do not necessarily state or reflect those of the United States government or any agency thereof.
Available electronically at http://www.osti.gov/bridge
Available for a processing fee to U.S. Department of Energy and its contractors, in paper, from:
U.S. Department of Energy Office of Scientific and Technical Information
P.O. Box 62 Oak Ridge, TN 37831-0062
phone: 865.576.8401 fax: 865.576.5728
email:mailto:[email protected]
Available for sale to the public, in paper, from: U.S. Department of Commerce
National Technical Information Service 5285 Port Royal Road Springfield, VA 22161 phone: 800.553.6847
fax: 703.605.6900 email: [email protected]
online ordering:http://www.ntis.gov/ordering.htm
Printed on paper containing at least 50% wastepaper, including 20% postconsumer waste
iii
Ductless Mini-Split Heat Pump Comfort Evaluation
Prepared for:
The National Renewable Energy Laboratory
On behalf of the U.S. Department of Energy’s Building America Program
Office of Energy Efficiency and Renewable Energy
15013 Denver West Parkway
Golden, CO 80401
NREL Contract No. DE-AC36-08GO28308
Prepared by:
K. Roth, N. Sehgal, and C. Akers
Fraunhofer Center for Sustainable Energy Systems
25 First Street, Suite 102
Cambridge, MA 02141
NREL Technical Monitor: Chuck Booten
Prepared under Subcontract No. KNDJ-0-40345-00
March 2013

iv
[This page left blank]

v
Contents List of Figures ............................................................................................................................................ vi List of Tables ............................................................................................................................................. vii Definitions ................................................................................................................................................. viii Executive Summary ................................................................................................................................... ix 1 Introduction and Field Deployments .................................................................................................. 1
1.1 Introduction ...................................................................................................................................... 1 1.2 Research Questions .......................................................................................................................... 2 1.3 Experimental Design and Field Deployments ................................................................................. 2
1.3.1 Field Deployment: Austin, Texas ....................................................................................... 2 2 Thermal Comfort Analysis ................................................................................................................... 4
2.1 Procedures ........................................................................................................................................ 4 2.1.1 Hourly Comfort Analysis .................................................................................................... 4
2.2 Daily Mean Temperature Analysis .................................................................................................. 5 2.2.1 Assumptions........................................................................................................................ 5
2.3 Thermal Comfort Based on ASHRAE Standard 55 (2004) ............................................................. 6 2.3.1 Thermal Comfort Based on Either Cooling or Heating Operation ..................................... 6 2.3.2 Thermal Comfort Performance in Cooling and Heating Modes ......................................... 8
3 System Costs ...................................................................................................................................... 13 4 Conclusions and Recommendations ............................................................................................... 14 References ................................................................................................................................................. 15 Appendix A: Thermal Comfort Performance Graphs for ASHRAE Standard 55, for Household1 .... 16
vi
List of Figures Figure 1.Austin duplex DMSHP deployment site ..................................................................................... 2 Figure 2.Floor plan of Austin duplex DMSHP deployment site (second unit is mirror image, along
garage-kitchen-dining room wall) ....................................................................................................... 3 Figure 3.Thermal comfort performance of CAC for either cooling or heating operation for Living 1;
hourly analysis...................................................................................................................................... 7 Figure 4.Thermal comfort performance of DMSHP for either cooling or heating operation for
Living 1; hourly analysis ...................................................................................................................... 7 Figure 5.Thermal comfort performance of CAC for Bed1a in cooling mode for clo 0.5 or clo 1.0;
hourly analysis...................................................................................................................................... 9 Figure 6.Thermal comfort performance of DMSHP for Bed1a in cooling mode for clo 0.5 or clo 1.0;
hourly analysis...................................................................................................................................... 9 Figure 7.Thermal comfort performance of DMSHP for Bed1a for 11:00 p.m. to 7:00 a.m.; hourly
analysis ................................................................................................................................................ 10 Figure 8. Thermal comfort performance of DMSHP for Bath 1 for either cooling or heating; hourly
analysis ................................................................................................................................................ 10 Figure 9. Temperature distribution with DMSHP in different rooms, household 1 ............................ 12 Figure 10. Temperature distribution with DMSHP in different rooms, household 2 .......................... 12 Figure 11. Thermal comfort performance of CAC for Bed1a for either cooling or heating; hourly . 16 Figure 12.Thermal comfort performance of DMSHP for Bed1a for either cooling or heating;
hourly ................................................................................................................................................... 16 Figure 13. Thermal comfort performance of CAC for Bed 2a for either cooling or heating;
hourly ................................................................................................................................................... 17 Figure 14.Thermal comfort performance of DMSHP for Bed 2a for either cooling or heating;
hourly ................................................................................................................................................... 17 Figure 15.Thermal comfort performance of CAC for Bath 1 for either cooling or heating; hourly .. 17 Figure 16.Thermal comfort performance of DMSHP for Bath 1 for either cooling or heating;
hourly ................................................................................................................................................... 18 Figure 17.Thermal comfort performance of CAC for Living 1 for cooling; hourly ............................. 18 Figure 18.Thermal comfort performance of DMSHP for Living 1 for cooling; hourly ........................ 19 Figure 19.Thermal comfort performance of CAC for Bed2a for cooling; hourly ................................ 19 Figure 20.Thermal comfort performance of DMSHP for Bed2a for cooling; hourly ........................... 19 Figure 21.Thermal comfort performance of CAC for bath 1 for cooling; hourly ................................ 20 Figure 22.Thermal comfort performance of DMSHP for bath 1 for cooling; hourly ........................... 20 Figure 23.Thermal comfort performance of CAC for Living 1 for heating; hourly ............................. 20 Figure 24. Thermal comfort performance of DMSHP for Living 1 for heating; hourly ....................... 21 Figure 25. Thermal comfort performance of CAC for Living 1 for heating; hourly ............................ 21 Figure 26.Thermal comfort performance of DMSHP for Bed2 for heating; hourly ............................. 21 Unless otherwise indicated, all figures were created by Fraunhofer.
vii
List of Tables Table 1. Austin DMSHPs Deployed ........................................................................................................... 3 Table 2. Thermal Comfort Performance for CAC and DMSHP for Either Cooling or Heating—Hourly
Comfort Analysis .................................................................................................................................. 6 Table 3. Thermal Comfort Performance CAC and DMSHP for Either Cooling or Heating—Daily
Mean Temperature Analysis ................................................................................................................ 6 Table 4. Thermal Comfort Performance for DMSHP and CAC in Cooling Mode Hourly Comfort
Analysis ................................................................................................................................................. 8 Table 5. Thermal Comfort Performance for DMSHP and CAC in Cooling Mode Daily Mean
Temperature Analysis .......................................................................................................................... 8 Table 6. Thermal Comfort Performance for DMSHP and CAC Heating Mode; Hourly Analysis ...... 11 Table 7. Thermal Comfort Performance for DMSHP and CAC Heating Mode; Daily Mean
Temperature Analysis ........................................................................................................................ 11 Table 8. Summary of Economics of a DMSHP Retrofit ......................................................................... 13 Table 9. Summary of Economics of a CAC Retrofit .............................................................................. 13 Unless otherwise indicated, all tables were created by Fraunhofer.
viii
Definitions
COP Coefficient of performance
CAC Central air conditioning system
DBT Dry bulb temperature
DMSHP Ductless mini-split heat pump

ix
Executive Summary
Ductless mini-split heat pumps (DMSHPs) offer several advantages over conventional ducted heating, ventilation, and air conditioning systems. They save energy, eliminate the potential for in-duct mold growth, eliminate the space consumed for duct runs, and are easy to install in retrofits, as they do not need ducts. The Fraunhofer team conducted field tests in two homes in Austin, Texas, from October 2011 to June 2012 to evaluate the comfort performance of DMSHPs. Specifically, we evaluated temperature and relative humidity (RH) measurements in four rooms in each home, both before and after retrofitting each home’s central heating and cooling system (CAC) with a DMSHP. Our analysis of the field measurements yielded several comfort-related observations. This small sample relies strongly on residents’ preferences, so the findings should be used as a case study evaluation rather than as a general finding.
1. ASHRAE Standard 55 Evaluation. a. Living room. The percentage of time within the comfort zone, for either heating
or cooling operation, was similar for the CAC and DMSHP, suggesting that the DMSHP indoor unit in the living room operates much like a CAC type system. Periods when the DMSHPs did not stay within the ASHRAE comfort zone were primarily when the RH was higher.
b. Bedroom. A large portion of the measurements do not lie within the comfort zone for 0.5 clo, but do fall within the comfort zone for 1.0 clo. Thus, we conclude that residents preferred lower temperatures during the cooling season than those indicated by ASHRAE standard 55 (assuming 0.5 clo).
c. Bathroom. The DMSHP had an appreciably higher portion of time when conditions lay outside the 0.5 and 1.0 clo comfort zones, primarily because of higher RH levels. This probably reflects the lack of DMSHP indoor units in the bathrooms; vent fan use was not, however, monitored.
d. In general, the RH levels were quite high for the DMSHP cases, which the occupants also noted. This suggests that the occupants did not run the DMSHP in its dehumidification mode, but instead tried to achieve lower RH by cooling the indoor spaces.
2. Homogeneity of indoor temperatures, cooling season. The maximum average hourly temperature difference among rooms on days where the outdoor temperature was 85°F or higher was around 3°F.
1
1 Introduction and Field Deployments
1.1 Introduction Ductless mini-split heat pumps (DMSHPs) offer several advantages over conventional ducted heating, ventilation, and air conditioning (HVAC) systems. They may save energy, eliminate the potential for in-duct mold growth, eliminate the space consumed for duct runs, and are easy to install in retrofits, as they do not need ducts. Although DMSHPs are popular in Asia, they account for only 1% of residential HVAC systems installed in the United States (Baylon et al. 2010).Most U.S. consumers, architects, and HVAC installers are wary of DMSHPs, because they have limited or no familiarity with these systems and how they perform in the field. Also, DMSHPs have the potential to achieve significant energy savings in at least three ways:
• They eliminate duct losses from leakage and conduction that lose an average of 20% of thermal energy delivered to the ducts by HVAC systems (Roth et al. 2006, based on Jump et al. 1996). In homes where ducts are primarily located in unconditioned spaces, such as attics in southern locations, the energy penalty will tend to be greater, ranging from 25% to 40% (NREL 2004).
• DMSHPs with multiple indoor units inherently provide zoned space conditioning. Occupants can use these to achieve further energy savings by allowing temperatures to float during unoccupied periods. This capability is enhanced in units integrated with an occupancy sensor, which are primarily available outside the United States(Moore 2011).
• They typically have variable-capacity compressors (inverter-driven for continuous capacity modulation) and variable-speed fans (Roth et al. 2006).Relative to conventional systems with fixed cooling and heating capacities and single-speed blowers, this results in annual energy savings of about 35% (ADL 1999). Moreover, these variable capacity and volume capabilities greatly enhance their ability to efficiently dehumidify at low sensible heat ratios, so occupants are less inclined to select lower cooling set points solely to run the air conditioning for dehumidification (for example, periods of moderate outdoor air temperatures and higher wet bulb temperatures, such as Florida in winter).Such conditions are also more common in low-energy homes, where sensible cooling loads through the building enclosure are greatly decreased, but indoor moisture loads do not change (Dieckmann 2008).
The space heating capacity and efficiency of conventional air source heat pumps diminish as outdoor air temperatures decrease. They thus require supplementary electric resistance space heating during colder periods (typically when outdoor temperatures approach freezing) that compromises their primary energy savings potential and operational cost. Over the last few years, “cold climate” air source heat pumps (units optimized to meet space heating loads instead of space cooling loads) have come to market (Roth et al. 2006).Very recently, DMSHP manufacturers have also begun to offer cold-climate units. For example, the Mitsubishi HyperHeat produces its full heating capacity at 5oF, with a coefficient of performance (COP) of 1.5–1.8 (Mitsubishi 2010).These units demonstrate superior performance at cold outdoor conditions, efficiently modulate capacity over a wide range of conditions, eliminate duct losses,
2
and are operated in zones. They may thus achieve significant primary energy savings relative to conventional space heating options in colder climates. 1.2 Research Questions To address the issues noted in Section 1.1, we designed this research project to answer the following research question:
• What is the distribution of indoor temperature and relative humidity (RH) in different rooms during the cooling and heating seasons, and how do they compare to ASHRAE comfort criteria?
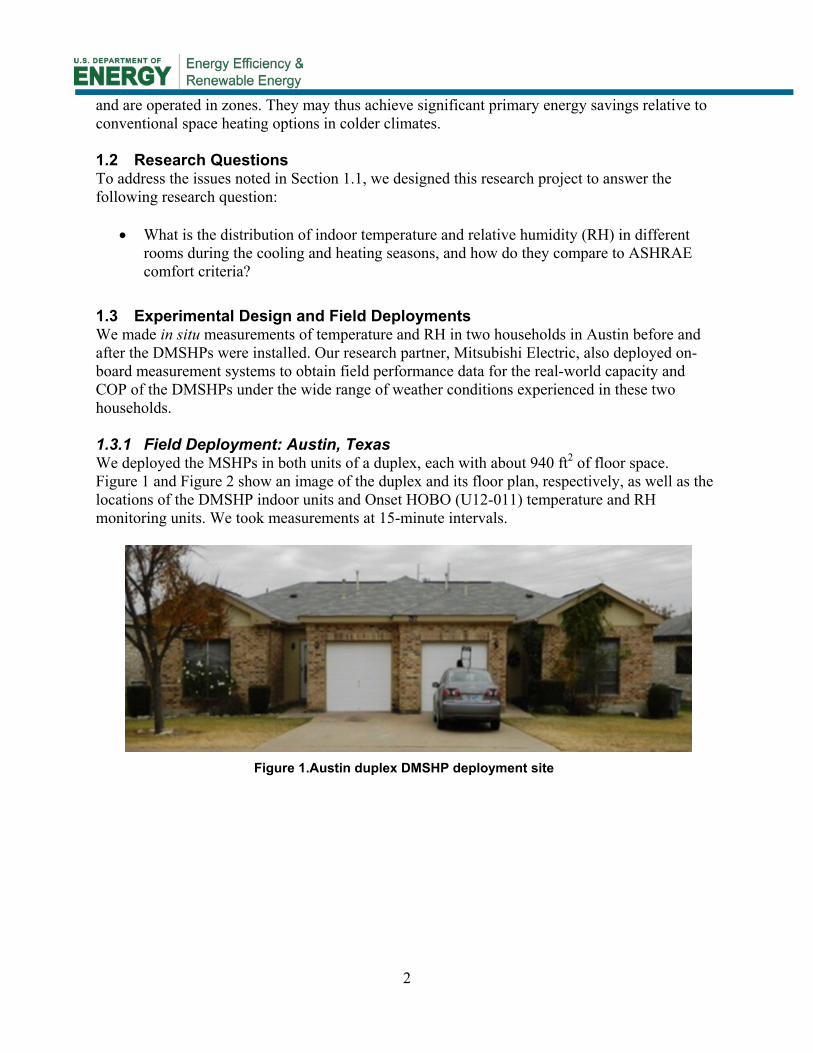
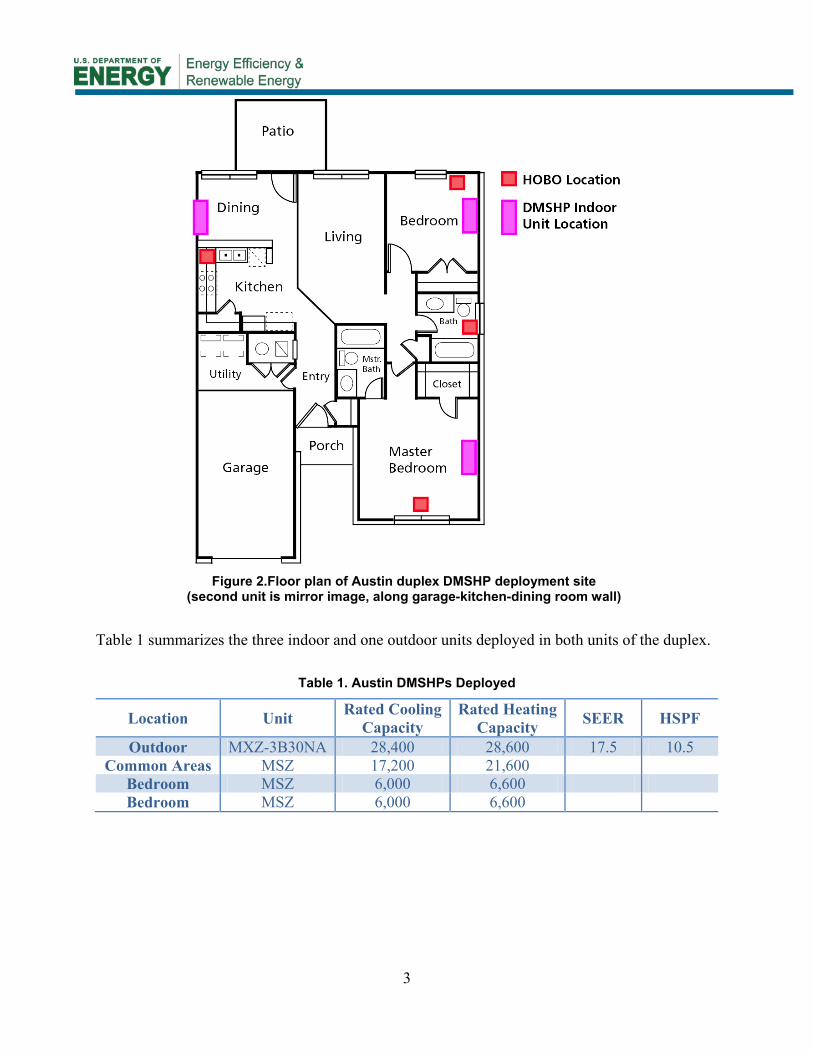
1.3 Experimental Design and Field Deployments We made in situ measurements of temperature and RH in two households in Austin before and after the DMSHPs were installed. Our research partner, Mitsubishi Electric, also deployed on-board measurement systems to obtain field performance data for the real-world capacity and COP of the DMSHPs under the wide range of weather conditions experienced in these two households. 1.3.1 Field Deployment: Austin, Texas We deployed the MSHPs in both units of a duplex, each with about 940 ft2 of floor space. Figure 1 and Figure 2 show an image of the duplex and its floor plan, respectively, as well as the locations of the DMSHP indoor units and Onset HOBO (U12-011) temperature and RH monitoring units. We took measurements at 15-minute intervals.
Figure 1.Austin duplex DMSHP deployment site
3
Figure 2.Floor plan of Austin duplex DMSHP deployment site
(second unit is mirror image, along garage-kitchen-dining room wall)
Table 1 summarizes the three indoor and one outdoor units deployed in both units of the duplex.
Table 1. Austin DMSHPs Deployed
Location Unit Rated Cooling Capacity
Rated Heating Capacity SEER HSPF
Outdoor MXZ-3B30NA 28,400 28,600 17.5 10.5 Common Areas MSZ 17,200 21,600
Bedroom MSZ 6,000 6,600 Bedroom MSZ 6,000 6,600
4
2 Thermal Comfort Analysis
An important point of comparison between CACs and DMSHPs is their ability to maintain thermal comfort in the conditioned space. CACs recirculate conditioned air to a common temperature, but often have only a single point for temperature control that does not necessarily reflect temperatures in spaces with significantly different internal loads, e.g., insolation levels or internal heat gains and loads. The multiple indoor units of distributed cooling and heating sources, such as DMSHPs, can respond to in-home variations of thermal loads using the in-room controls, but usually do not have indoor units in all rooms. We used HOBO data collected from the two deployments at Austin to evaluate the thermal comfort in the conditioned space. Our evaluation includes data from the two housing units, both for the CACs (pre-retrofit) and for the DMSHPs (post-retrofit). In this report, the CAC system includes a ducted system with a CAC unit and furnace. We assessed thermal comfort based on ASHRAE Standard 55 (2004). 2.1 Procedures We evaluated comfort based on hourly and daily mean outdoor temperatures, using indoor air DBT (dry bulb temperature) and RH that were measured every 15 minutes. We applied two procedures to analyze the real-time data (indoor temperature and RH) for thermal comfort performance.
2.1.1 Hourly Comfort Analysis 1. The data for indoor DBT and indoor RH for the living room, master bedroom, and
bathroom were acquired through real-time monitoring at the site.
2. Assumption 1 (described in Section 2.2.1) was used to determine those readings when the system (either CAC or DMSHP) was considered “in operation.” A system is considered in operation when the building is expected to have either heating or cooling loads.
3. Assumption 2 was used to select those readings when the system was considered to be in heating or cooling mode.
4. For ASHRAE Standard 55:
a. Two areas were plotted in a temperature versus RH graph. These areas correspond to two levels of clothing: 1.0 clo and 0.5 clo. These areas together define the comfort zone for the ASHRAE Standard 55. (A “clo” is a unit used to quantify the thermal insulation provided by garments and clothing ensembles, where 1 clo = 0.155 m2 °C/W.) Put in more intuitive terms (ASHRAE 2009):
i. Clo 1.01 corresponds to trousers, long-sleeved shirt, long-sleeved sweater, T-shirt.
ii. Clo 0.57 corresponds to trousers, short-sleeved shirt.
iii. Clo 0.36 corresponds to walking shorts, short-sleeved shirt.
b. We used the indoor temperature and RH measures to determine if the given condition lay within the comfort zone.
5
c. The indoor conditions (temperature and RH at a given time) were plotted on this graph for a visual estimate of how many points lay within the comfort zone.
d. We performed a similar analysis by plotting the points for cooling mode only (comfort zone corresponding to 0.5 clo) and heating mode only (comfort zone corresponding to 1.0 clo).We applied the above procedure for all the conditioned spaces.
2.2 Daily Mean Temperature Analysis We applied this method while evaluating thermal comfort performance based on ASHRAE Standard 55 only. All the steps under hourly comfort analysis, for ASHRAE Standard 55, are followed in this procedure except for one difference. For this procedure, the analysis used the outdoor daily mean DBT instead of hourly outdoor temperatures (as used in Hourly Comfort Analysis). Assumptions 3 and 4 (see Section 2.2.1) hold true for this case.
The rationale for this approach is that the mean outdoor temperature over a 24-hour period takes into account how building thermal mass may impact indoor comfort conditions.
2.2.1 Assumptions We did not measure occupancy patterns nor occupants’ preferences, so we made the following assumptions for hourly comfort analysis and daily mean temperature analysis to predict the outdoor conditions when the systems would most likely operate in either heating or cooling mode.
For the hourly comfort analysis, the CAC and DMSHP most likely provided heating or cooling when the hourly outside DBT was either ≤60°F or ≥77 °F. Between these two temperatures, we assumed that both systems did not operate to meet the set points in the conditioned space.
The system was in heating mode when the outdoor DBT was ≤60°F and in cooling mode when the outdoor DBT was ≥77°F.
For the daily mean temperature analysis, the systems (CAC and DMSHP may have operated in either heating or cooling mode when the outside mean DBT was either ≤60°F or ≥70°F. Between these two temperatures, both systems did not operate to meet the set points in the conditioned space.
The system was in heating mode when the outdoor DBT was ≤60°F and in cooling mode when the outdoor DBT was ≥70°F.
Residents in the conditioned space were dressed per typical ASHRAE summer clothing assumption of 0.5 clo when the systems were in cooling mode and the winter clothing assumption of 1.0 clo when the systems were in heating mode.
The data for CACs are primarily for the month of October 2011.1
The data acquisition period for DMSHPs was November 2011 to June 2012.
1 The average high and low temperatures for Austin in October are 82oF and 61oF, respectively. Thus, significant space cooling typically occurs during this period (Weather Underground 2012).
6
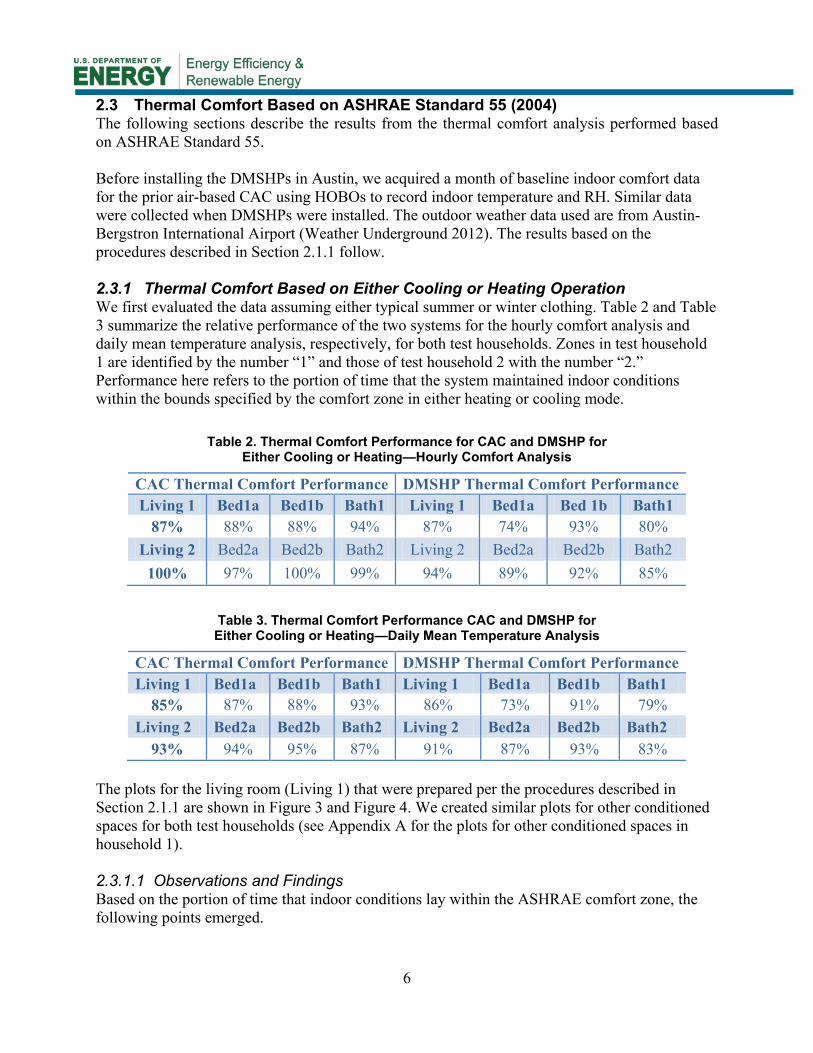
2.3 Thermal Comfort Based on ASHRAE Standard 55 (2004) The following sections describe the results from the thermal comfort analysis performed based on ASHRAE Standard 55. Before installing the DMSHPs in Austin, we acquired a month of baseline indoor comfort data for the prior air-based CAC using HOBOs to record indoor temperature and RH. Similar data were collected when DMSHPs were installed. The outdoor weather data used are from Austin-Bergstron International Airport (Weather Underground 2012). The results based on the procedures described in Section 2.1.1 follow. 2.3.1 Thermal Comfort Based on Either Cooling or Heating Operation We first evaluated the data assuming either typical summer or winter clothing. Table 2 and Table 3 summarize the relative performance of the two systems for the hourly comfort analysis and daily mean temperature analysis, respectively, for both test households. Zones in test household 1 are identified by the number “1” and those of test household 2 with the number “2.” Performance here refers to the portion of time that the system maintained indoor conditions within the bounds specified by the comfort zone in either heating or cooling mode.
Table 2. Thermal Comfort Performance for CAC and DMSHP for Either Cooling or Heating—Hourly Comfort Analysis
CAC Thermal Comfort Performance DMSHP Thermal Comfort Performance Living 1 Bed1a Bed1b Bath1 Living 1 Bed1a Bed 1b Bath1
87% 88% 88% 94% 87% 74% 93% 80% Living 2 Bed2a Bed2b Bath2 Living 2 Bed2a Bed2b Bath2
100% 97% 100% 99% 94% 89% 92% 85%
Table 3. Thermal Comfort Performance CAC and DMSHP for Either Cooling or Heating—Daily Mean Temperature Analysis
CAC Thermal Comfort Performance DMSHP Thermal Comfort Performance Living 1 Bed1a Bed1b Bath1 Living 1 Bed1a Bed1b Bath1
85% 87% 88% 93% 86% 73% 91% 79% Living 2 Bed2a Bed2b Bath2 Living 2 Bed2a Bed2b Bath2
93% 94% 95% 87% 91% 87% 93% 83% The plots for the living room (Living 1) that were prepared per the procedures described in Section 2.1.1 are shown in Figure 3 and Figure 4. We created similar plots for other conditioned spaces for both test households (see Appendix A for the plots for other conditioned spaces in household 1). 2.3.1.1 Observations and Findings Based on the portion of time that indoor conditions lay within the ASHRAE comfort zone, the following points emerged.
7
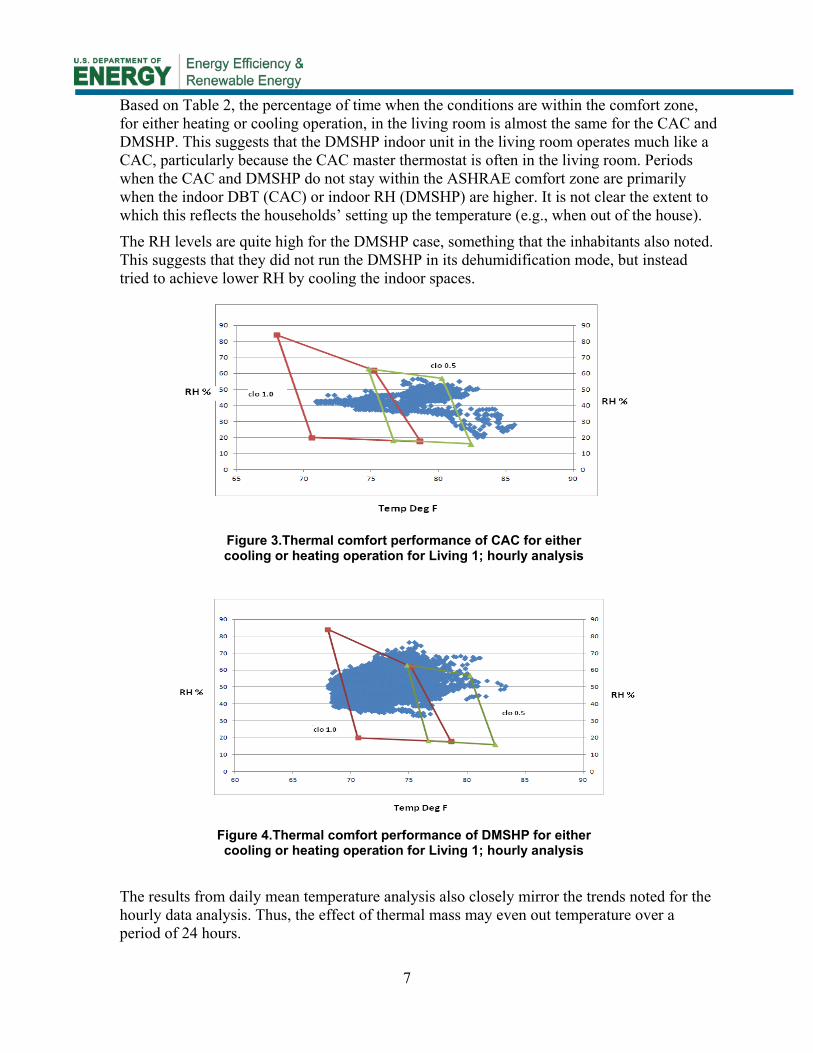
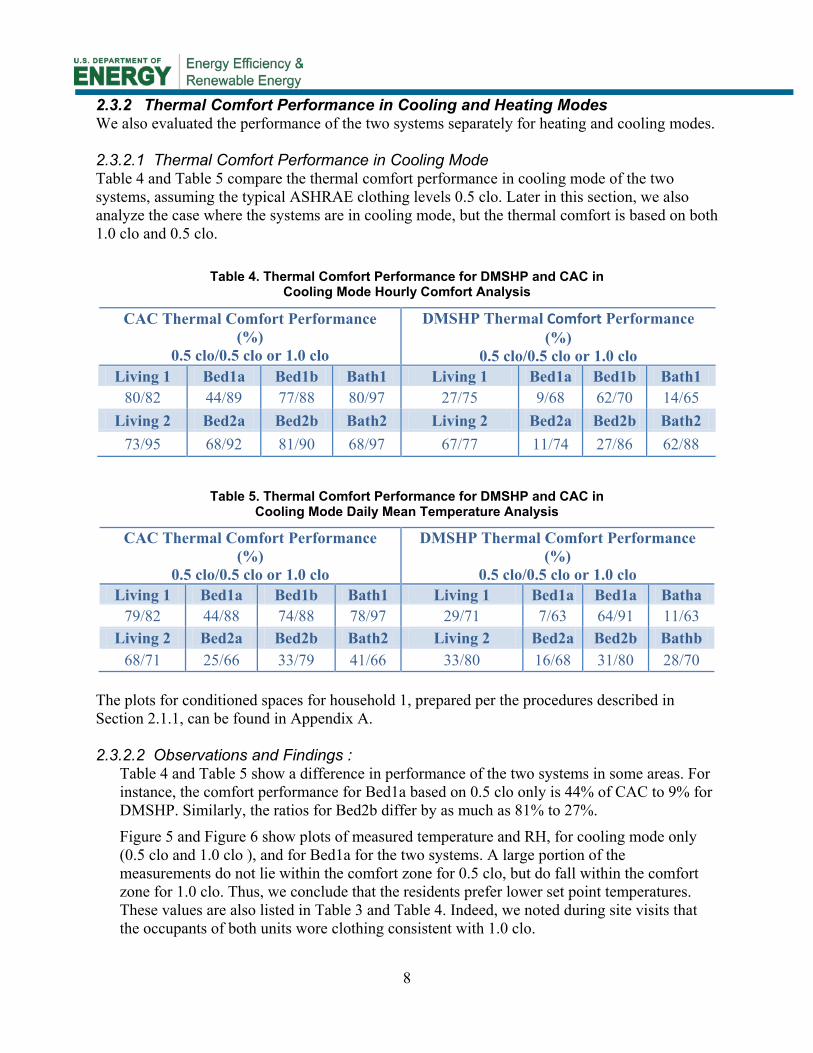
Based on Table 2, the percentage of time when the conditions are within the comfort zone, for either heating or cooling operation, in the living room is almost the same for the CAC and DMSHP. This suggests that the DMSHP indoor unit in the living room operates much like a CAC, particularly because the CAC master thermostat is often in the living room. Periods when the CAC and DMSHP do not stay within the ASHRAE comfort zone are primarily when the indoor DBT (CAC) or indoor RH (DMSHP) are higher. It is not clear the extent to which this reflects the households’ setting up the temperature (e.g., when out of the house).
The RH levels are quite high for the DMSHP case, something that the inhabitants also noted. This suggests that they did not run the DMSHP in its dehumidification mode, but instead tried to achieve lower RH by cooling the indoor spaces.
Figure 3.Thermal comfort performance of CAC for either cooling or heating operation for Living 1; hourly analysis
Figure 4.Thermal comfort performance of DMSHP for either cooling or heating operation for Living 1; hourly analysis
The results from daily mean temperature analysis also closely mirror the trends noted for the hourly data analysis. Thus, the effect of thermal mass may even out temperature over a period of 24 hours.
8
2.3.2 Thermal Comfort Performance in Cooling and Heating Modes We also evaluated the performance of the two systems separately for heating and cooling modes. 2.3.2.1 Thermal Comfort Performance in Cooling Mode Table 4 and Table 5 compare the thermal comfort performance in cooling mode of the two systems, assuming the typical ASHRAE clothing levels 0.5 clo. Later in this section, we also analyze the case where the systems are in cooling mode, but the thermal comfort is based on both 1.0 clo and 0.5 clo.
Table 4. Thermal Comfort Performance for DMSHP and CAC in Cooling Mode Hourly Comfort Analysis
CAC Thermal Comfort Performance (%)
0.5 clo/0.5 clo or 1.0 clo
DMSHP Thermal Comfort Performance (%)
0.5 clo/0.5 clo or 1.0 clo Living 1 Bed1a Bed1b Bath1 Living 1 Bed1a Bed1b Bath1
80/82 44/89 77/88 80/97 27/75 9/68 62/70 14/65 Living 2 Bed2a Bed2b Bath2 Living 2 Bed2a Bed2b Bath2
73/95 68/92 81/90 68/97 67/77 11/74 27/86 62/88
Table 5. Thermal Comfort Performance for DMSHP and CAC in Cooling Mode Daily Mean Temperature Analysis
CAC Thermal Comfort Performance (%)
0.5 clo/0.5 clo or 1.0 clo
DMSHP Thermal Comfort Performance (%)
0.5 clo/0.5 clo or 1.0 clo Living 1 Bed1a Bed1b Bath1 Living 1 Bed1a Bed1a Batha
79/82 44/88 74/88 78/97 29/71 7/63 64/91 11/63 Living 2 Bed2a Bed2b Bath2 Living 2 Bed2a Bed2b Bathb
68/71 25/66 33/79 41/66 33/80 16/68 31/80 28/70 The plots for conditioned spaces for household 1, prepared per the procedures described in Section 2.1.1, can be found in Appendix A.
2.3.2.2 Observations and Findings :
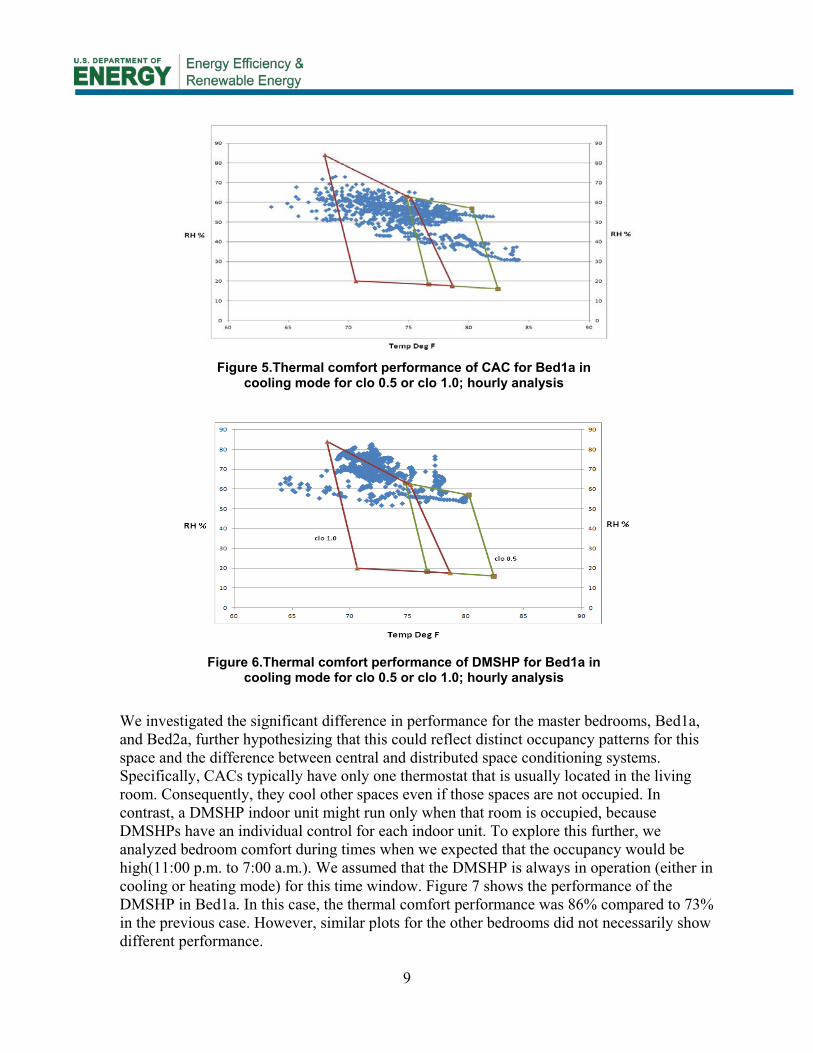
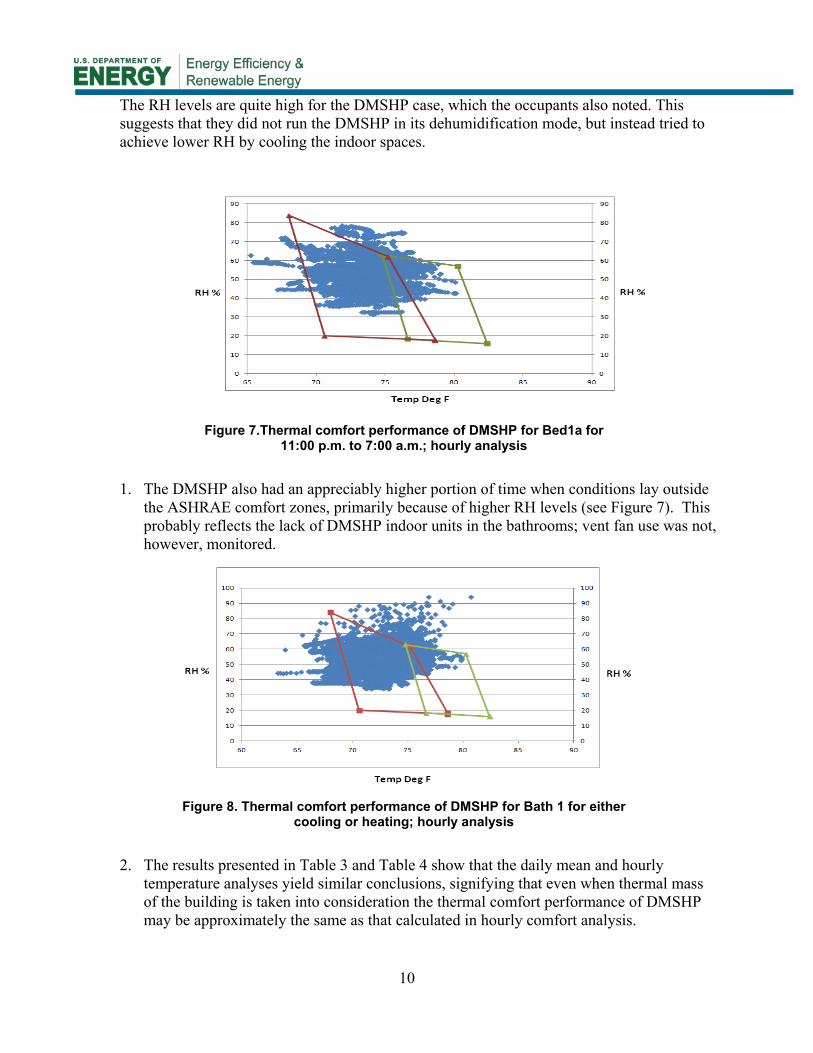
Table 4 and Table 5 show a difference in performance of the two systems in some areas. For instance, the comfort performance for Bed1a based on 0.5 clo only is 44% of CAC to 9% for DMSHP. Similarly, the ratios for Bed2b differ by as much as 81% to 27%.
Figure 5 and Figure 6 show plots of measured temperature and RH, for cooling mode only (0.5 clo and 1.0 clo ), and for Bed1a for the two systems. A large portion of the measurements do not lie within the comfort zone for 0.5 clo, but do fall within the comfort zone for 1.0 clo. Thus, we conclude that the residents prefer lower set point temperatures. These values are also listed in Table 3 and Table 4. Indeed, we noted during site visits that the occupants of both units wore clothing consistent with 1.0 clo.
9
Figure 5.Thermal comfort performance of CAC for Bed1a in
cooling mode for clo 0.5 or clo 1.0; hourly analysis
Figure 6.Thermal comfort performance of DMSHP for Bed1a in
cooling mode for clo 0.5 or clo 1.0; hourly analysis
We investigated the significant difference in performance for the master bedrooms, Bed1a, and Bed2a, further hypothesizing that this could reflect distinct occupancy patterns for this space and the difference between central and distributed space conditioning systems. Specifically, CACs typically have only one thermostat that is usually located in the living room. Consequently, they cool other spaces even if those spaces are not occupied. In contrast, a DMSHP indoor unit might run only when that room is occupied, because DMSHPs have an individual control for each indoor unit. To explore this further, we analyzed bedroom comfort during times when we expected that the occupancy would be high(11:00 p.m. to 7:00 a.m.). We assumed that the DMSHP is always in operation (either in cooling or heating mode) for this time window. Figure 7 shows the performance of the DMSHP in Bed1a. In this case, the thermal comfort performance was 86% compared to 73% in the previous case. However, similar plots for the other bedrooms did not necessarily show different performance.
10
The RH levels are quite high for the DMSHP case, which the occupants also noted. This suggests that they did not run the DMSHP in its dehumidification mode, but instead tried to achieve lower RH by cooling the indoor spaces.
Figure 7.Thermal comfort performance of DMSHP for Bed1a for
11:00 p.m. to 7:00 a.m.; hourly analysis
1. The DMSHP also had an appreciably higher portion of time when conditions lay outside
the ASHRAE comfort zones, primarily because of higher RH levels (see Figure 7). This probably reflects the lack of DMSHP indoor units in the bathrooms; vent fan use was not, however, monitored.
Figure 8. Thermal comfort performance of DMSHP for Bath 1 for either
cooling or heating; hourly analysis
2. The results presented in Table 3 and Table 4 show that the daily mean and hourly
temperature analyses yield similar conclusions, signifying that even when thermal mass of the building is taken into consideration the thermal comfort performance of DMSHP may be approximately the same as that calculated in hourly comfort analysis.
11
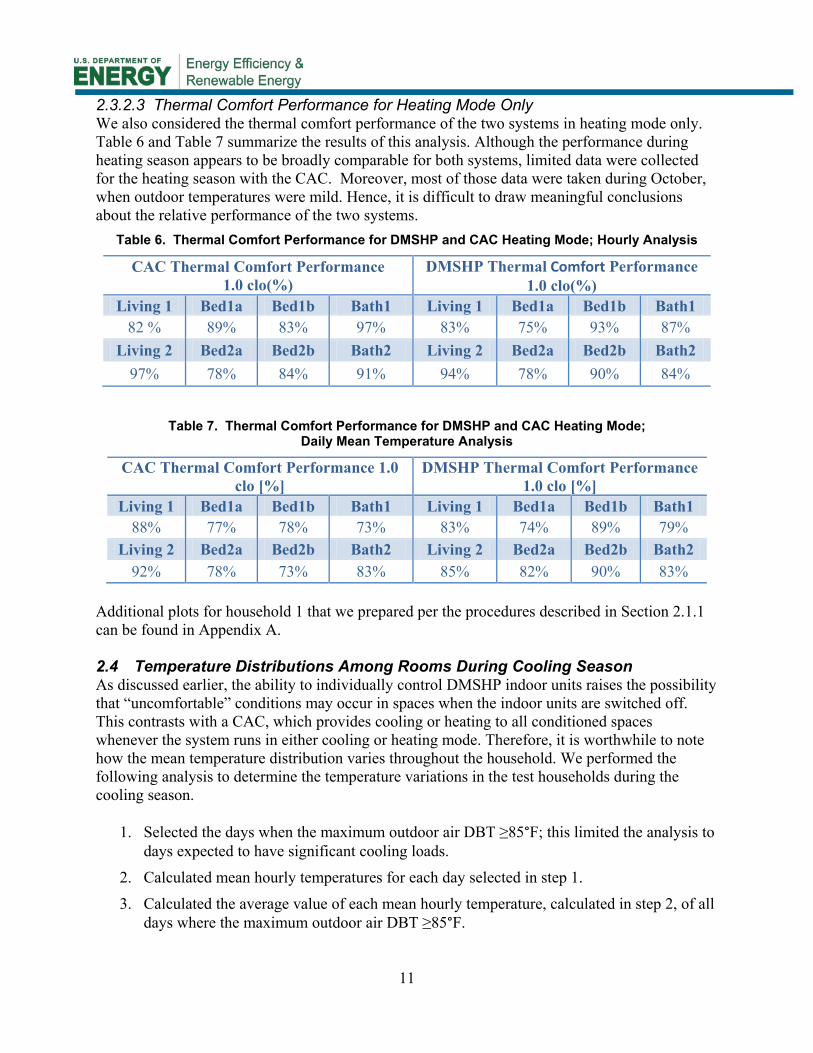
2.3.2.3 Thermal Comfort Performance for Heating Mode Only We also considered the thermal comfort performance of the two systems in heating mode only. Table 6 and Table 7 summarize the results of this analysis. Although the performance during heating season appears to be broadly comparable for both systems, limited data were collected for the heating season with the CAC. Moreover, most of those data were taken during October, when outdoor temperatures were mild. Hence, it is difficult to draw meaningful conclusions about the relative performance of the two systems.
Table 6. Thermal Comfort Performance for DMSHP and CAC Heating Mode; Hourly Analysis
CAC Thermal Comfort Performance 1.0 clo(%)
DMSHP Thermal Comfort Performance 1.0 clo(%)
Living 1 Bed1a Bed1b Bath1 Living 1 Bed1a Bed1b Bath1 82 % 89% 83% 97% 83% 75% 93% 87%
Living 2 Bed2a Bed2b Bath2 Living 2 Bed2a Bed2b Bath2 97% 78% 84% 91% 94% 78% 90% 84%
Table 7. Thermal Comfort Performance for DMSHP and CAC Heating Mode; Daily Mean Temperature Analysis
CAC Thermal Comfort Performance 1.0 clo [%]
DMSHP Thermal Comfort Performance 1.0 clo [%]
Living 1 Bed1a Bed1b Bath1 Living 1 Bed1a Bed1b Bath1 88% 77% 78% 73% 83% 74% 89% 79%
Living 2 Bed2a Bed2b Bath2 Living 2 Bed2a Bed2b Bath2 92% 78% 73% 83% 85% 82% 90% 83%
Additional plots for household 1 that we prepared per the procedures described in Section 2.1.1 can be found in Appendix A. 2.4 Temperature Distributions Among Rooms During Cooling Season As discussed earlier, the ability to individually control DMSHP indoor units raises the possibility that “uncomfortable” conditions may occur in spaces when the indoor units are switched off. This contrasts with a CAC, which provides cooling or heating to all conditioned spaces whenever the system runs in either cooling or heating mode. Therefore, it is worthwhile to note how the mean temperature distribution varies throughout the household. We performed the following analysis to determine the temperature variations in the test households during the cooling season.
1. Selected the days when the maximum outdoor air DBT ≥85°F; this limited the analysis to days expected to have significant cooling loads.
2. Calculated mean hourly temperatures for each day selected in step 1.
3. Calculated the average value of each mean hourly temperature, calculated in step 2, of all days where the maximum outdoor air DBT ≥85°F.

12
4. Plotted these averages to observe the variations over 24 hours (see Figure 9 and Figure 10).
Figure 9. Temperature distribution with DMSHP in different rooms, household 1
Figure 10. Temperature distribution with DMSHP in different rooms, household 2
2.4.1.1 Observations and Findings The maximum average temperature difference among rooms is around 3°F.
65
68
71
74
77
80
12:00 PM 3:00 AM 6:00 AM 9:00 AM 12:00 PM 3:00 PM 6:00 PM 9:00 PM
Aver
age
Indo
or Te
mpe
ratu
re [o F
]
Time of Day
Bath1
Small Bed1
Master Bed1
Living1
65
68
71
74
77
80
12:00 PM 3:00 AM 6:00 AM 9:00 AM 12:00 PM 3:00 PM 6:00 PM 9:00 PM
Aver
age
Indo
or Te
mpe
ratu
re [o F
]
Time of Day
Living2
Master Bed2
Small Bed2
Bath2
13
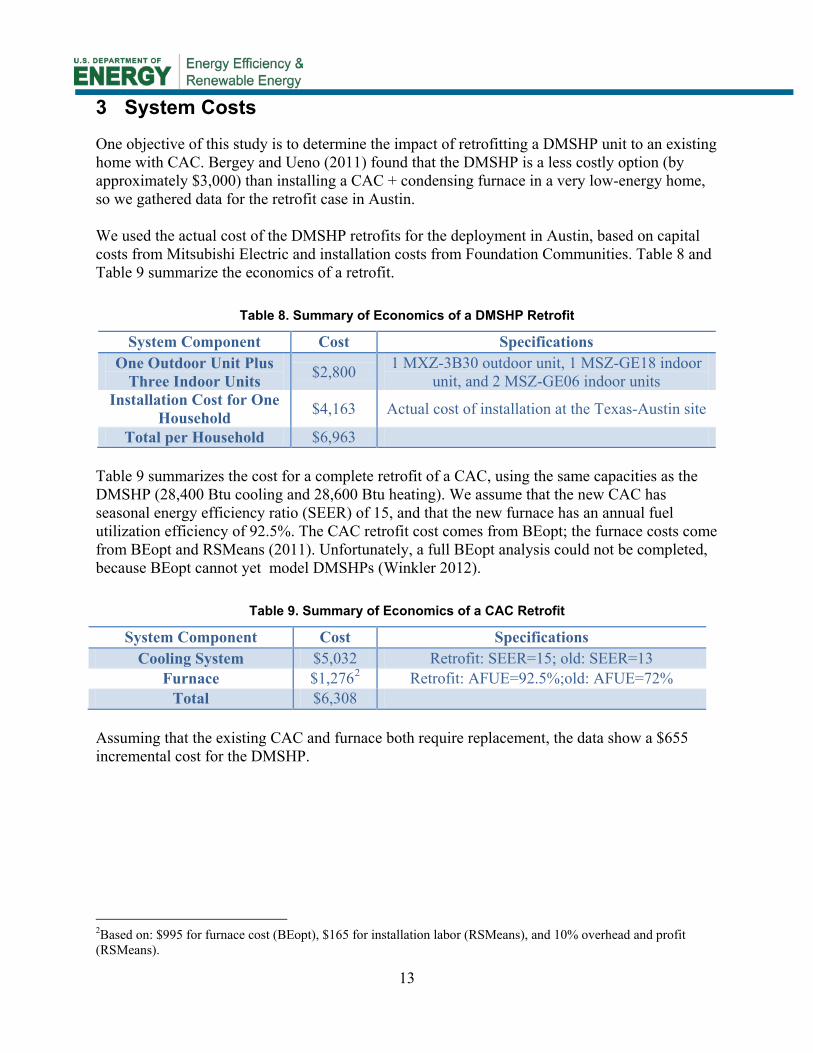
3 System Costs
One objective of this study is to determine the impact of retrofitting a DMSHP unit to an existing home with CAC. Bergey and Ueno (2011) found that the DMSHP is a less costly option (by approximately $3,000) than installing a CAC + condensing furnace in a very low-energy home, so we gathered data for the retrofit case in Austin. We used the actual cost of the DMSHP retrofits for the deployment in Austin, based on capital costs from Mitsubishi Electric and installation costs from Foundation Communities. Table 8 and Table 9 summarize the economics of a retrofit.
Table 8. Summary of Economics of a DMSHP Retrofit
System Component Cost Specifications One Outdoor Unit Plus
Three Indoor Units $2,800 1 MXZ-3B30 outdoor unit, 1 MSZ-GE18 indoor unit, and 2 MSZ-GE06 indoor units
Installation Cost for One Household $4,163 Actual cost of installation at the Texas-Austin site
Total per Household $6,963 Table 9 summarizes the cost for a complete retrofit of a CAC, using the same capacities as the DMSHP (28,400 Btu cooling and 28,600 Btu heating). We assume that the new CAC has seasonal energy efficiency ratio (SEER) of 15, and that the new furnace has an annual fuel utilization efficiency of 92.5%. The CAC retrofit cost comes from BEopt; the furnace costs come from BEopt and RSMeans (2011). Unfortunately, a full BEopt analysis could not be completed, because BEopt cannot yet model DMSHPs (Winkler 2012).
Table 9. Summary of Economics of a CAC Retrofit
System Component Cost Specifications Cooling System $5,032 Retrofit: SEER=15; old: SEER=13
Furnace $1,2762 Retrofit: AFUE=92.5%;old: AFUE=72% Total $6,308
Assuming that the existing CAC and furnace both require replacement, the data show a $655 incremental cost for the DMSHP.
2Based on: $995 for furnace cost (BEopt), $165 for installation labor (RSMeans), and 10% overhead and profit (RSMeans).
14
4 Conclusions and Recommendations
The Fraunhofer team conducted field tests in two homes in Austin, Texas, from October 2011 to June 2012 to evaluate the comfort performance of DMSHPs. Specifically, we measured temperature and RH in four rooms in each home, both before and after retrofitting each home’s CAC with a DMSHP. Our analysis of the field measurements yielded several comfort-related observations. This small sample relies strongly on residents’ preferences, so the findings should be used as a case study evaluation rather than as a general finding.
3. ASHRAE Standard 55 Evaluation. a. Living room. The percentage of time within the comfort zone, for either heating
or cooling operation, was similar for the CAC and DMSHP, suggesting that the DMSHP indoor unit in the living room operated much like a CAC. Periods when the DMSHPs did not stay within the ASHRAE comfort zone were primarily when the RH was higher.
b. Bedroom. A large portion of the measurements did not lie within the comfort zone for 0.5 clo, but did fall within the comfort zone for 1.0 clo. Thus, we conclude that residents preferred lower temperatures during the cooling season than those indicated by ASHRAE standard 55 (assuming 0.5 clo).
c. Bathroom. The DMSHP had an appreciably higher portion of time when conditions lay outside the 0.5 and 1.0 clo comfort zones, primarily because of higher RH levels. This probably reflects the lack of DMSHP indoor units in the bathrooms; vent fan use was not, however, monitored.
d. In general, the RH levels were quite high for the DMSHP cases, which the occupants also noted. This suggests that the occupants did not run the DMSHP in its dehumidification mode, but instead tried to achieve lower RH by cooling the indoor spaces.
4. Homogeneity of indoor temperatures, cooling season. The maximum average hourly temperature difference among rooms on days when the outdoor temperature was 85°F or higher was around 3°F.
A key recommendation from our study is to obtain detailed field performance data, i.e., unit power draw and heating and cooling capacity as functions of indoor and outdoor temperatures for the DMSHP units. These data are crucial for further validating and enhance EnergyPlus models for DMSHPs (see, for example, FSCE 2012).Similarly, it is crucial to obtain the same data for DMSHPs optimized for cold-climate performance to develop adequate models for these products as they become more prominent in the residential HVAC market. We continue to work with our field test partners to generate these data, that we hope to obtain and publish as part of a future study.
15
References
ADL. 1999. “Opportunities for Energy Savings in the Residential and Commercial Sectorswith High-EfficiencyElectric Motors.” Final Report by Arthur D. Little (ADL) to the U.S. Department of Energy. October.
ANSI/ASHRAE Standard 90.2. 2007. “Energy Efficient Design for Low Rise Residential Buildings.” ASHRAE: Atlanta, GA.
ASHRAE. 2009. ASHRAE Handbook: 2009 Fundamentals. ASHRAE: Atlanta, GA.
Baylon, D. 2010. “Performance of Ductless Heat Pumps in the Pacific Northwest”. Proc. 2010 ACEEE Summer Study on Energy Efficiency in Buildings, Pacific Grove, CA: August.
Bergey, D. and K. Ueno. 2011. “New England Net Zero Production Houses”. Proc. ASHARE Annual Conference, Montreal, Canada. 25–29 June.
Dieckmann, J. 2008. “Improving Humidity Control with Energy Recovery Ventilation” ASHRAE Journal, August.
Jump, D.A., I.S. Walker, and M.P. Modera. 1996. “Field measurements of efficiency and duct retrofit effectiveness in residential forced air distribution systems.” Proc. ACEEE Summer Study, Pacific Grove, CA.
Mitsubishi. 2008. Mitsubishi Electric Hyper-Heating INVERTER Product Manual. Form No. H2iBR0M-11-08-00MDigOn.
Moore, A. 2011. Personal Communication. Mitsubishi Electric. January.
NREL. 2004. “Better Duct Systems for Home Heating and Cooling”. Produced for the U.S. Department of Energy (DOE) by the National Renewable Energy Laboratory (NREL).November. Available at: http://www.nrel.gov/docs/fy05osti/30506.pdf.
Roth, K., D. Westphalen, and J. Brodrick. 2006. “Ductless Split Systems”. ASHRAE Journal. July, pp. 115,117.
Weather Underground. 2012. Data from Austin, TX Airport Weather Station (KATT). Accessed on from: www.wunderground.com/history/airport/KATT/2011/10/31/DailyHistory.html.
Winkler, J. 2012. Personal Communication, National Renewable Energy Laboratory (NREL).
16
Appendix A: Thermal Comfort Performance Graphs for ASHRAE Standard 55, for Household1
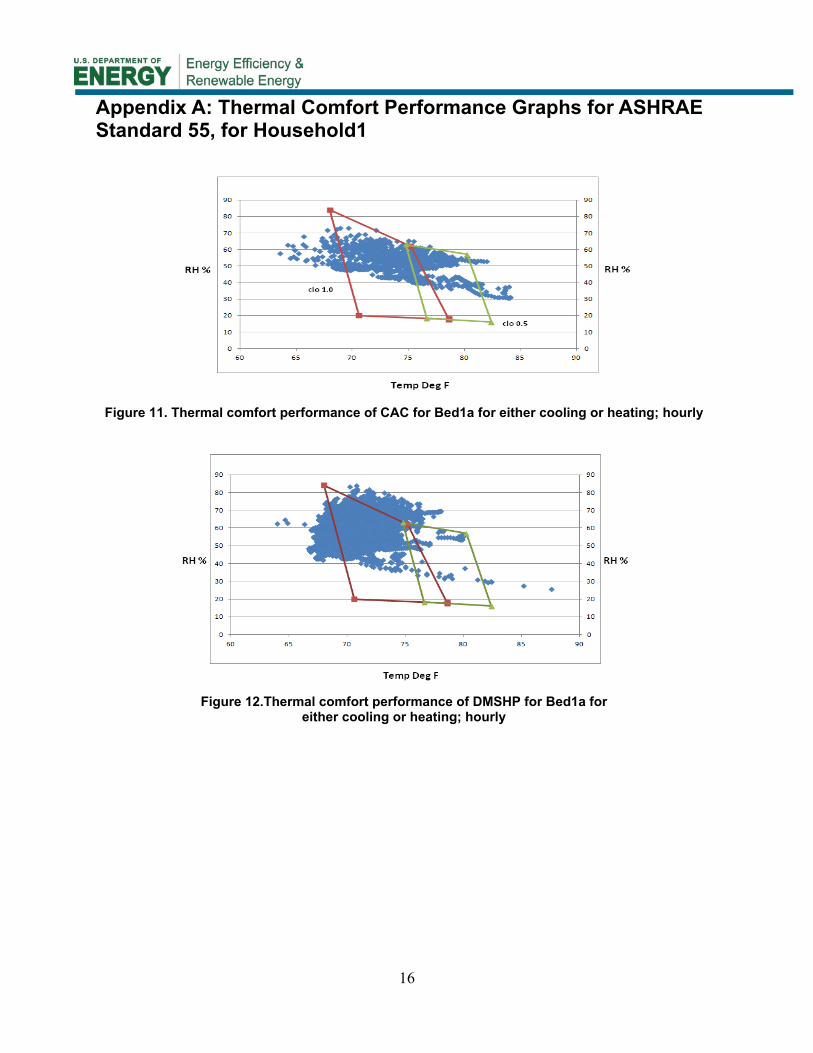
Figure 11. Thermal comfort performance of CAC for Bed1a for either cooling or heating; hourly
Figure 12.Thermal comfort performance of DMSHP for Bed1a for
either cooling or heating; hourly

17
Figure 13. Thermal comfort performance of CAC for Bed 2a for either cooling or heating; hourly
Figure 14.Thermal comfort performance of DMSHP for Bed 2a for either cooling or heating; hourly
Figure 15.Thermal comfort performance of CAC for Bath 1 for either cooling or heating; hourly
18
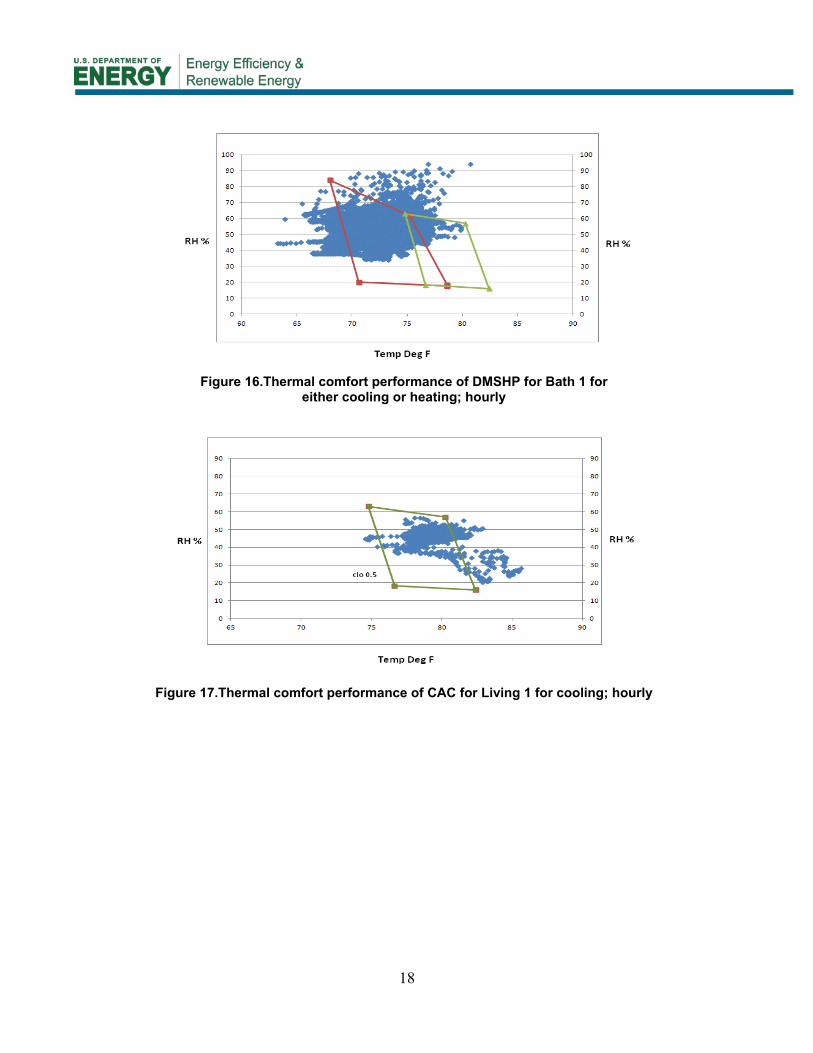
Figure 16.Thermal comfort performance of DMSHP for Bath 1 for
either cooling or heating; hourly
Figure 17.Thermal comfort performance of CAC for Living 1 for cooling; hourly

19
Figure 18.Thermal comfort performance of DMSHP for Living 1 for cooling; hourly
Figure 19.Thermal comfort performance of CAC for Bed2a for cooling; hourly
Figure 20.Thermal comfort performance of DMSHP for Bed2a for cooling; hourly

20
Figure 21.Thermal comfort performance of CAC for bath 1 for cooling; hourly
Figure 22.Thermal comfort performance of DMSHP for bath 1 for cooling; hourly
Figure 23.Thermal comfort performance of CAC for Living 1 for heating; hourly

21
Figure 24. Thermal comfort performance of DMSHP for Living 1 for heating; hourly
Figure 25. Thermal comfort performance of CAC for Living 1 for heating; hourly
Figure 26.Thermal comfort performance of DMSHP for Bed2 for heating; hourly

DOE/GO-102013-3814 ▪March 2013
Printed with a renewable-source ink on paper containing at least 50% wastepaper, including 10% post-consumer waste.