dunkin' brands group, inc. -...
TRANSCRIPT

DUNKIN' BRANDS GROUP, INC.
FORM 8-K(Current report filing)
Filed 05/08/12 for the Period Ending 05/08/12
Address 130 ROYALL STREET
CANTON, MA 02021Telephone 7817374516
CIK 0001357204Symbol DNKN
SIC Code 5810 - Eating And Drinking PlacesIndustry Recreational Products
Sector Consumer Cyclical
http://www.edgar-online.com© Copyright 2012, EDGAR Online, Inc. All Rights Reserved.
Distribution and use of this document restricted under EDGAR Online, Inc. Terms of Use.

UNITED STATES
SECURITIES AND EXCHANGE COMMISSION
Washington, D.C. 20549
FORM 8-K
CURRENT REPORT
Pursuant to Section 13 or 15(d) of The Securities Exchange Act of 1934
Date of Report (Date of earliest event reported): May 8, 2012
DUNKIN’ BRANDS GROUP, INC.
(Exact name of registrant as specified in its charter)
Delaware (State or Other Jurisdiction of Incorporation)
130 Royall Street Canton, Massachusetts 02021
(Address of registrant’s principal executive office)
(781) 737-3000 (Registrant’s telephone number)
Check the appropriate box below if the Form 8-K filing is intended to simultaneously satisfy the filing obligation of the registrant under any of the following provisions:
001-35258 20-4145825 (Commission File Number)
(IRS Employer Identification Number)
� Written communications pursuant to Rule 425 under the Securities Act (17 CFR 230.425)
� Soliciting material pursuant to Rule 14a-12 under the Exchange Act (17 CFR 240.14a-12)
� Pre-commencement communications pursuant to Rule 14d-2(b) under the Exchange Act (17 CFR 240.14d-2(b))
� Pre-commencement communications pursuant to Rule 13e-4(c) under the Exchange Act (17 CFR 240.13e-4(c))

Item 7.01 Regulation FD Disclosure.
Dunkin’ Brands Group, Inc. (the “Company”) will host its annual Investor & Analyst Day on Tuesday, May 8, 2012. At the event, members of the Company’s senior management will meet with investors and investment professionals and make a presentation regarding the Company. Certain of the slides included in the presentation are attached as Exhibit 99.1 and are incorporated herein by reference. A copy of the slides will also be available online at www.dunkinbrands.com .
The information contained in this report, including the exhibit attached hereto, is being furnished and shall not be deemed “filed” for any purpose, and shall not be deemed incorporated by reference in any filing under the Securities Act of 1933, as amended, or the Securities Exchange Act of 1934, as amended, regardless of any general incorporation language in any such filing.
Item 9.01 Financial Statements and Exhibits.
(d) Exhibits 99.1 Investor & Analyst Day Slides.

SIGNATURES
Pursuant to the requirements of the Securities Exchange Act of 1934, the registrant has duly caused this report to be signed on its behalf by the undersigned hereunto duly authorized.
Date: May 8, 2012
DUNKIN ’ BRANDS GROUP, INC.
By: /s/ Nigel Travis Nigel Travis Chief Executive Officer

Index to Exhibits Exhibit
No. Description
99.1 Investor & Analyst Day Slides.

2012 Investor & Analyst Day
Dunkin ’ Brands Group, Inc.
May 8, 2012
Exhibit 99.1

Forward -looking statements
o Certain information contained in this presentation, particularly information regarding future economic performance, finances, and expectations and objectives of management constitutes forward-looking statements. Forward-looking statements can be identified by the fact that they do not relate strictly to historical or current facts and are generally contain words such as “believes,” “expects,” “may,” “will,” “should,” “seeks,” “approximately,”“intends,” “plans,” “estimates” or “anticipates” or similar expressions. Our forward-looking statements are subject to risks and uncertainties, which may cause actual results to differ materially from those projected or implied by the forward-looking statement.
o Forward-looking statements are based on current expectations and assumptions and currently available data and are neither predictions nor guarantees of future events or performance. You should not place undue reliance on forward-looking statements, which speak only as of the date hereof. We do not undertake to update or revise any forward-looking statements after they are made, whether as a result of new information, future events, or otherwise, except as required by applicable law.
o Regulation G • This presentation contains certain non-GAAP measures which are provided to assist in an
understanding of the Dunkin’ Brands Group, Inc. business and its performance. These measure should always be considered in conjunction with the appropriate GAAP measure. Reconciliations of non-GAAP amounts to the relevant GAAP amount are provided on our website.
2 Confidential information: Copying, dissemination or distribution of this information is strictly prohibited.

A strong platform for continued growth
2012 DNKN Investor & Analyst Day
Nigel Travis CEO, Dunkin’Brands & President,
Dunkin’Donuts

Highly experienced, aligned management team
Name Title Past experience
Nigel Travis Chief Executive Officer, Dunkin’Brands and President, Dunkin’Donuts U.S.
President & Chief Executive Officer of Papa John’s, President & Chief Operating Officer of Blockbuster and SVP Burger King
Neil Moses Chief Financial Officer Executive Vice President / Chief Financial Officer of Parametric Technology Corporation
John Costello Chief Global Marketing & Innovation Officer Executive Vice President of Merchandising and Marketing at Home Depot, Senior Executive Vice President of Sears, Senior Vice President of Marketing & Sales at Pepsi-Cola USA and Chief Global Marketing Officer of Yahoo!
Paul Twohig Chief Operating Officer, Dunkin’Donuts U.S. & Canada
Senior Vice President of Starbucks; Executive Vice President and Chief Operating Officer of Panera Bread Company
John Dawson Global Development Officer Vice President of Worldwide Restaurant Development for McDonald’s Corporation
Giorgio Minardi President, International
Managing Director, Europe and the Middle East, for Autogrill; vice President of Asia Pacific, Burger King; and Vice President and Chief Marketing Officer for Greater China for McDonald’s Corporation
Bill Mitchell Senior Vice President & Brand Officer, Baskin-Robbins U.S. & Canada
President of Global Operations for Papa John’s
Richard Emmett Senior Vice President & General Counsel Former Executive Vice President and Chief Legal Officer of Quiznos, Senior Vice President and General Counsel of Papa John’s
Ginger Gregory Senior Vice President, Chief Human Resources Officer
Global Head of HR for consumer business arm of Novartis AG
Karen Raskopf Senior Vice President, Chief Communications Officer
Senior Vice President of Corporate Communications for 7 – Eleven and Blockbuster
Paul Carbone Vice President, Strategy & Finance Senior Vice President / Chief Financial Officer for Tween Brands

Focused growth strategies across each segment
1 Represents percentage of LTM reportable segment revenues through 3/31/2012
74% of LTM revenue ¹
7% of LTM revenue ¹ 19% of LTM revenue ¹
Increase comparable store sales and profitability
in DD U.S.
Continue DD U.S. contiguous store
expansion
Increase comparable store sales growth
of BR U.S.
Drive accelerated international growth across both brands

Three Pillars
Franchisee Relationships
Operations Focus Franchisee Profitability

Franchising Relationships
o It’s all about making our franchisees profitable
o “Pluralistic frame of reference”
o Requires great communication and listening skills
o A positive approach to every problem
o Willingness to be flexible while maintaining the course
o Collaborative approach

Operations Focus
o Develop people and guest-first culture
o Instill retail mindset across Dunkin’ Brands system
o Select the right franchisees; offer the best training and support
o Intensely focus on unit economics
o Enhance guest experience by focusing on satisfaction

Franchise Profitability –a cross -functional approach
MAXIMIZE profitability for All
Stakeholders
INCREASED franchisee profitability
enables increased new store development
INCREASED store penetration
enables increased sales, customer convenience
and frequency (ad fund)
INCREASED beverage sales enables
increased franchisee profitability
INCREASED customer convenience and frequency enable
increased beverage sales

Public Company Transformation
• Continued focus on corporate governance
• Shareholder outreach
• Succession planning
Pre-IPO
o 94% Private Equity Owned
Post -IPO
o 75% Private Equity Owned
Post -Nov. ‘11 Follow -on Offering
o 55% Private Equity Owned
Post -March ‘12 Follow -on Offering
o 30% Private Equity Owned
Building brand awareness & driving new restaurant sales
Marketing & Product Innovation
John Costello Chief Global Marketing
& Innovation Officer

o Relevant Strategic Priorities: Designed to drive growth in all parts of the system; particularly effective in new markets
o Efficient National Marketing : National media buys put the right level of advertising into a market at the right time
o Effective Local Marketing : Local markets retain flexibility to personalize marketing and messaging to reach our key customers
o Franchisee Profitability : Marketing focus on product innovation and accelerating beverage growth early in a restaurant’s life cycle
US Marketing and Product Innovation efforts support US store development goals by focusing on four key pri orities

Relevant Strategic Priorities: Designed to maximiz e growth and drive new US market expansion
1) Drive comp sales and brand differentiation
2) Increased focus on growing our beverage and total coffee business
3) Protect and grow our critical AM day-part
4) Grow the PM day-part
5) Maintain our strong value position
How does strategy drive expansion?
o Differentiated food and beverage products help introduce the brand in new markets
o High margin beverages build ritual and maximize franchisee profitability
o Builds ritual and brand loyalty and drives franchisee profitability
o Broadens customer appeal and drives incremental sales and profit for franchisee
o Reinforces brand positioning of offering customers great products at a great value

Efficient National Marketing: Builds brand awarene ss and drives sales early in market entry period
Leading Programs Customized Sponsorships Times Square
National advertising builds brand awareness even in markets with few restaurants

Efficient National Marketing: Traditional media supplemented with targeted digital and social effor ts
Relevant digital partnerships Social: Facebook & Twitter Gaming
Media vehicles and sponsorships are selectively cho sen to connect with customers, reinforce the brand and dri ve sales

Efficient National Marketing: Our mobile solution has a multi -faceted approach with very focused objectives
• Drive Comps
• Improve Speed of Service
• Improve Profitability
• Drive DD Card Sales
• Enhance Loyalty Efforts

Effective Local Marketing: Builds the brand, connec ts with local customers and drives sales
We use relationships with targeted major partners t o provide differentiated messages in select markets

Effective Local Marketing: Builds the brand, connec ts with local customers and drives sales
All markets have access to tools and templates that can be applied locally

Franchisee Profitability: Strong menu of differenti ated national products, supplemented regionally as appro priate
National menu drives brand differentiation, customer loyalty, franchisee sales and profitabilit y
Selectively supplemented with regional products where needed

Drive beverage growth at the local level through localization of WAYD and in -store tactics
Campaign drives beverage awareness in all markets, targets key demographics and helps differentiate
our beverage lineup
Franchisee Profitability: Focus on growing beverages early in restaurant life -cycle enhances franchisee profitability
“ What are you drinkin ’?” advertising is effective and flexible

Franchisee Profitability: Focus on growing beverag es early in restaurant life -cycle enhances franchisee profitability
“ What are you drinkin ’?” advertising is effective and flexible
o Coffee Leadership – Taste Passion
o Coffee Leadership – Iced Coffee Customization
o Iced Coffee – Boston Sports Pride
o Hispanic – America ’s Favorite

Franchisee Profitability: K - Cups continue to build the brand, accelerate beverage growth, and drive profit ability
We are leveraging K -Cups to build the brand and accelerate beverage rituals
o K-Cups have been a key driver of both sales and profitability and we are pleased with the launch of the category
o Brewer and K-Cup sales are solid and in line with our projections, with penetration increasing
o We have a solid plan in place for the rest of the year with advertising, merchandising and LTOs.
o K-Cups are particularly important in new and emerging markets where they have provided even greater incremental sales and profit for franchisees

Summary: Marketing and Innovation efforts support U S store development goals by focusing on 4 key priori ties
15,000 Restaurants
7,000 Restaurants
Relevant Strategic Priorities
Effective Local Marketing
Efficient National Marketing
Driving Franchisee Profitability

Supporting new and existing franchisees
Enabling Successful New Restaurants
Paul Twohig Chief Operating Officer,
Dunkin’Donuts U.S. & Canada

Team Priorities
Consistent, focused, and execution driven
PEOPLE GUEST EXPERIENCE PROFITABLE TOPLINE SALES

Support Structure
o FIELD OPERATIONS is led by 4 Regional Vice Presidents (RVP) and 25 Operations Directors (OD) that act as the maître d’ for their areas
o OPERATIONS SERVICES TEAM supports development of systems and processes to enable restaurant operations
o LEARNING TEAM focused on training franchisees and Restaurant Managers and field support team
Core connections with marketing, development, construction, franchising and financial planning

People
Teaching and coaching is the foundation: o Operations Team Development
o Franchisees and Restaurant Managers
Ratio of Field Support to restaurants is critical t o success
Enabling Successful New Restaurants: o Improved focus on selecting the best franchisees –
cross functional vetting process
o New Franchisee Learning Path
o Developing a support system – franchisee mentorship

Guest Experience
Focus on Restaurant Operations o RORs and Restaurant Visitation Process (at least 4 visits per year)
o Upcoming Franchisee Rating & Reward System
o Action Planning is critical
Guest Focused Operating Systems o LEAN Diagnostics
o Simple and clear processes
Enabling Successful New Restaurants: o Grand Openings – Community Connection – Loud and Proud o Ensuring regional relevance

Guest Experience
Guest Satisfaction Survey (GSS): o Focus of understanding the guest experience
o National overall satisfaction scores have continuously improved
o 20% improvement in overall satisfaction scores over past two years

Profitable Topline Sales
o Remodels and relocations
o Average age of restaurants is less than 5 years
o Guest Service Diagnostic Tool
o Sandwich Station enhancements
o POS
o Back-Office Systems: inventory, food cost, labor and cash management
o Loss Prevention systems and education
o Mobile/Loyalty program
UPDATED Retail Technology
LEAN Solutions
Asset TRANSFORMATIONS

Team Priorities
Consistent, focused, and execution driven
PEOPLE GUEST EXPERIENCE PROFITABLE TOPLINE SALES
Significant opportunity for profitable growth
Doubling the Footprint of Dunkin ’ Donuts U.S.
John Dawson Global Development Officer,
Dunkin’Brands

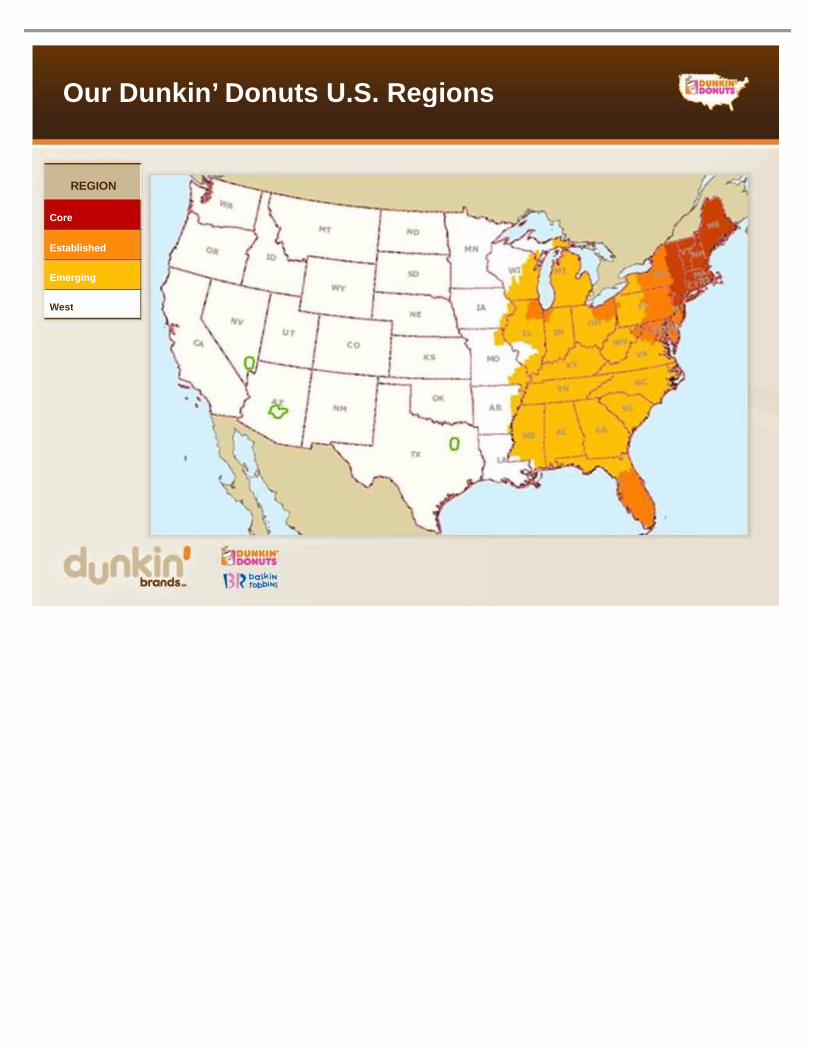
Significant Opportunity for Profitable Growth
1. As of 3/31/2012
REGION POPULATION (MM) STORES
(1) PENETRATION
Core 36.0 3,775 1:9,540
Established 53.8 2,245 1:23,950
Emerging 88.7 910 1:97,500
West 130.0 130 1:1,000,300

Strong unit economics maximize profitability for al l stakeholders and drive Dunkin ’ Donuts U.S. development
MAXIMIZE profitability for All
Stakeholders
INCREASED franchisee profitability
enables increased new store development
INCREASED store penetration
enables increased sales, customer convenience
and frequency (ad fund)
INCREASED beverage sales enables
increased franchisee profitability
INCREASED customer convenience and frequency enable
increased beverage sales

Development Strategy is Delivering Positive Results
NET NEW STORES 2009 – 2011
RESTAURANT BASE DIVERSITY
SDA SALES
KEEPING RESTAURANT BASE CONTEMPORARY
STRENGTHENING UNIT ECONOMICS
o 640 Net Openings o Emerging markets grew 49%; West region grew 27%
o 85% Traditional locations; 15% Gas & Convenience and Alternative Points of Distribution
o Nearly 50% of restaurants include a drive-thru
o 25% increase in SDA sales from 2010 to 2011 o Majority of 2012 SDA sales West of Mississippi River
o 636 remodels in 2011; guidance of 600 – 650 in 2012 o 60% of asset base will be newest restaurant image by end of 2012
o Average age of restaurant base is less than 5 years
o 2010 Cohort of Traditional Openings: $855,000 AUVs ; $474,000 average capex o 2011 Cohort of Traditional Openings: $858,000 AUVs ; $461,000 average capex

o Phase 1: Deliberate spacing - focus on traditional formats
o Phase 2: Coffee convenience
o Phase 3: Driving deep penetration through in -fill locations
o Sophisticated sales forecasting model
o Continuous focus on driving down capex investments
o Primary focus on driving high margin beverage sales
o Supply chain efficiencies -reduced COGs
o Rigorous franchisee selection
o Operational experience and financial stability
o Customized SDA sales models & incentives
o Developing national and regional lender relationships
o Cross-functional approach to market plans
o Identify top tier trade areas
o Continuous assessment of market potential
o High internal hurdles for site approvals
Accelerating Growth with Cross -Functional Approach
RIGOROUS Market Planning
QUALITY Franchisees
Phased Market DEVELOPMENT
FOCUS on Unit Economics

Franchisee Base is a Major Asset
Background of Dunkin ’ Donuts U.S. 2011 SDA Purchasers
Existing 69%
New 31%
G&C Retail - QSR 28%
Restaurant - QSR 48%
Other 24%

2011 SDA Commitments Sold by Market Type
Dunkin ’ Donuts SDA sales in 33 DMAs in 2011
o Reaching sell-out levels in Established markets:
• Washington , DC • Chicago • Baltimore • Tampa
o Strong early recruitment success in New Markets released in 2010 & 2011:
• Arkansas • Louisiana • Iowa • Denver
Emerging 28%
Established 33%
West 39%

2012 Development Production: Forecasted SDA Sales a nd Openings by Market Type
Forecasted 2012 Net Openings by Market Type
Forecasted 2012 SDA Sales by Market Type
Emerging 19%
Established 38%
West 12%
Core 31%
Emerging 40%
Established 2%
West 58%
Continuing to penetrate Core and Established market s while selling SDAs for future growth

Contiguous, Strategic Growth Westward
Selling in -fill locations & SDAs to existing franchisees
Selling SDAs to new and existing franchisees
Future markets

Accelerating Dunkin ’ Donuts U.S. Growth
o SIGNIFICANT opportunity for profitable growth
o COMPELLING , articulated philosophy on franchising
o ENHANCED development strategy that is demonstrating strong results
o ATTRACTIVE unit economic model generating quality demand from new and existing franchisees
o DISCIPLINED contiguous approach to doubling footprint in U.S.

Enhancing unit economics to drive accelerated growth
Dunkin ’ Donuts New Store Economics
Neil Moses Chief Financial Officer,
Dunkin’Brands

Focus on Store -Level Unit Economics to Drive Accelerated growth
o Significantly increased national media driving brand awareness and high-margin beverage sales
o Intense focus on accelerating new market beverage sales
o K-Cups boosting franchisee profitability
o Agreement with franchisee-owned supply chain cooperative to provide flat cost of goods to back door of the restaurant across system by 2015
o $245 million reduction in franchisee costs since 2008 from strategic sourcing and operational efficiencies
o 24% reduction in upfront capex for new end-cap, drive-thru restaurants since 2008
90% of 2011 new store development with existing fra nchisees; 69% of 2011 SDA sales with existing franchisees
Our Dunkin ’ Donuts U.S. Regions
REGION
Core
Established
Emerging
West

New Restaurant Sales & Profitability Strong & Consistent Across Regions
1. As of 4/11/2012 2. Standalone Traditional Dunkin’ Donuts Restaurants only 3. 2011 data is projected based upon partial year results 4. 2011 COGs and EBITDA impacted by commodity inflation
o First year sales and first year EBITDA % improving in all regions
o West & Emerging first year sales surpassed Core & Established past two years o Core & Established first year sales up from $14,000 to 16,400 or 17% growth from 2008 to
2011; West & Emerging first year sales up from $13,400 to $17,500 or 30% growth from 2008 to 2011
o West & Emerging first year EBITDA % grew from 4% to 13% from 2008 to 2011; now consistent with Core & Established
First Year EBITDA % First Year Sales

Consistent Improvement in First Year in West & Emer ging Markets
8.5% CAGR
1. As of 4/11/2012 2. Standalone Traditional Dunkin’ Donuts Restaurants only 3. 2011 data is projected based upon partial year results 4. 2011 COGs and EBITDA impacted by commodity inflation
o West & Emerging first year sales up from $13,400 to $17,500 or 30% growth from 2008 to 2011; West & Emerging first year EBITDA % grew from 4% to 13% from 2008 to 2011
o Enhanced site selection improving first year sales
o Increased beverage dollars helping to drive improved EBITDA %
o Maintained EBITDA margin in 2011 despite commodity pressure
$-
$2,000 $4,000
$6,000 $8,000
$10,000 $12,000
$14,000 $16,000
$18,000 $20,000
2008 (76 Sites) (38 Sites)
2010 (42 Sites)
2011 (49 Sites)
West & Emerging First Year Sales
0.0%
2.0%
4.0%
6.0%
8.0%
10.0%
12.0%
14.0%
16.0%
2008 (76 Sites) (38 Sites)
2010 (42 Sites)
2011 (49 Sites)
West & Emerging First Year EBITDA %
2009 2009

Growing First Year Beverage Dollars & Lower Build C osts Driving Improved EBITDA & Cash -on-Cash Returns
1. As of 4/11/2012 2. Standalone Traditional Dunkin’ Donuts Restaurants only 3. 2011 beverage dollars projected based upon partial year results
o West & Emerging first year beverage dollars up from $4,950 to $6,250 or 26% percent growth from 2008 to 2011
o West & Emerging average restaurant build cost down nearly $60,000 or 12% from 2008 to 2011
$-
$1,000
$2,000
$3,000
$4,000
$5,000
$6,000
$7,000
$8,000
2008 (76 Sites) (38 Sites)
2010 (42 Sites) (49 Sites)
West & Emerging First Year Beverage Dollars
$-
$100,000
$200,000
$300,000
$400,000
$500,000
$600,000
2008 (76 Sites) (38 Sites)
2010 (42 Sites) (49 Sites)
West & Emerging Average Restaurant Build Cost by Open Year
2009 2009 2011 2011

Strengthening New Market Cash -on-Cash Returns
1. As of 4/11/2012 2. Standalone Traditional Dunkin’ Donuts Restaurants only 3. 2011 projected based upon partial year results 4. Profitability Numbers are franchisee reported and do not include G&A
o West & Emerging first year cash-on-cash returns up from 5% in 2008 to 27% in 2011
o West & Emerging first year cash-on-cash returns cleared 25% target in 2010 and remained above 25% despite commodity pressures in 2011
0.0%
5.0%
10.0%
15.0%
20.0%
25.0%
30.0%
35.0%
40.0%
2008 (76 Sites)
2009 (38 Sites)
2010 (42 Sites)
2011 (49 Sites)
West & Emerging First Year Cash-on-Cash Returns

Year-Over -Year Improvement in Beverage Dollars and Cash -on-Cash Returns in New Markets
1. As of 4/11/2012 2. Standalone Traditional Dunkin’ Donuts Restaurants only 3. 2011 projected based upon partial year results
o Restaurants opened in 2010 & 2011 have much stronger first year beverage dollars and cash-on-cash returns than restaurants opened in 2008 and 2009
o Restaurants opened in 2008 and 2009 showing steady year-over-year progress
$-
$1,000
$2,000
$3,000
$4,000
$5,000
$6,000
$7,000
$8,000
2008 (76 Sites)
2009 (38 Sites)
2010 (42 Sites)
2011 (49 Sites)
West & Emerging - Beverage Dollars Progression by Open Year
Year 1 Year 2 Year 3 Year 4
0.0%
5.0%
10.0%
15.0%
20.0%
25.0%
30.0%
35.0%
40.0%
2008 (76 Sites)
2009 (38 Sites)
2010 (42 Sites)
2011 (49 Sites)
West & Emerging – Cash-on-Cash % Progression by Open Year
Year 1 Year 2 Year 3 Year 4

Supporting contiguous expansion
Dunkin ’ Donuts U.S. Supply Chain

Dunkin ’ Donuts U.S. Supply Chain Footprint
Central Manufacturing Locations (CMLs)
National DCP (NDCP)
DD Approved Suppliers
o 100+ franchisee-owned bakeries
o Make donuts, baked goods o Receives supplies from NDCP o Supply 4,500 restaurants o Daily delivery to restaurants o Consolidation opportunities
being investigated
o Franchisee owned purchasing & distribution co-op, non-profit
o Competitively bid products
o Overseen by franchisees & DNKN
o Ships 50mm cases/year to stores
o Weekly deliveries to restaurants
o 450 QA approved suppliers o $1.3B in annual shipments o DNKN approves suppliers,
products and owns specs; NDCP negotiates price with approved suppliers
U.S. Dunkin ’ Donuts Restaurants
o 99% of needs supplied by NDCP
o Donuts from CMLs, Full Producers, or Just Baked on Demand

NDCP Distribution Footprint
WA
Phoenix, AZ (Oct 2012)
Mokena, IL Colonie, NY
Bellingham, MA
Westampton, NJ
Greensboro, NC
Groveland, FL

Enabling Contiguous Expansion
1. Merging regional co-ops into national distribution and procurement cooperative (NDCP)
2. Implementing “flat pricing” across U.S. in three years
3. Reducing franchisee COGs through sourcing & operational efficiencies
OUR MISSION : Ensure continuity of supply of high quality food, beverage & equipment, while improving franchisee profitability to enable Westward expansion

Recently Merged 4 Regional Co -ops into Single NDCP Entity
o Signed long -term, performance agreement with NDCP for procurement and distribution in U.S.
o Merged 4 regional cooperatives into single entity • Eliminating redundant jobs
• Consolidating duplicate functions: IT, Finance, Call Centers • Standardizing service levels and processes across system
o Approaching vendors with “ one voice ” as a unified $1.3B purchasing and distribution entity
o Installing new NDCP Board with improved governance
• “1 Member, 1 Vote” principle ensures new markets are represented
6 distribution centers located in 4 formerly autono mous regions now financially merged and centrally contro lled

Both Parties Benefit in New Agreement
FRANCHISEE BENEFITS DNKN BENEFITS
o Improved NDCP Board Governance
o Guaranteed flat pricing by year 3
o Performance-based contract, requiring top-quartile results
o Dedicated, franchisee-owned supply chain requiring no capital investment from DNKN
o Long-term role in supply chain
o Early inclusion in R&D
o Access to multiple suppliers to improve RFP results
o Ability to consolidate regions
Both sides will benefit from enhanced franchisee profitability that will enable Westward expansion

Implementing “ Flat Pricing ” Across U.S.
New DNKN / NDCP Contract Requires
“Flat Pricing”
Sourcing and Operations Savings Will Enable
Flat Pricing
Supports Westward Expansion
o New markets will have same product costs as Core markets
o Eliminates need for DNKN supply chain subsidies in new markets
o All members should see reduction over time
o No region (including Core) should see an increase
o Significant (2-3%) reductions in food cost for Western markets
o All members across U.S. will pay same price for goods
o Will be phased in over 3 years, with 6-month increments
o Potential to accelerate if additional savings are uncovered
Flat pricing for product costs is key enabler of contiguous growth strategy

Reducing Costs Franchisee COGs
Plan to capture another $100M over next 3 years
o RFPs
o 2nd suppliers
o Specification optimization
o Operational efficiencies
o Lightweight packaging
o Backhauls
Key Levers:
$115
$47
$41
$42
$245 mm
$0
$50
$100
$150
$200
$250
$300
2008 2009 2010 2011 4 Year Total
4 Year Cost Reduction Results

Additional $100M to Enable Flat Pricing By End of Year 3
o All regions will see a reduction
o Higher cost regions will see the most benefit
o Assumes successful capture of $100M+ in additional savings across system
FLAT PRICING MECHANICS
New England
Chicago Mid-Atlantic
Southeast Southwest
2012 Savings as a % of Sales 0.1% 0.1% 0.4% 1.1% 2.0%
2013 Savings as a % of Sales 0.2% 0.2% 0.6% 0.8% 3.4%
2014 Savings as a % of Sales 0.3% 0.4% 0.7% 0.9% 3.7%
Projected 3 -year Average Food Cost Savings 0.2% 0.2% 0.6% 0.9% 3.1%

Significant long-term growth opportunities outside U.S.
Growing Our Brands Globally
Giorgio Minardi President, International,
Dunkin’ Brands

o 24 cities in 60 days o 90% of partner organizations o 2 global summits
First 90 Days in Office
STRONG, ENGAGED partners to grow with the brands

Note: Unit count as of 3/31/12
Both brands have strong international presence …Store count:
BR International was 11% of FY11 segment profit; DD International was 3% of FY11 segment profit
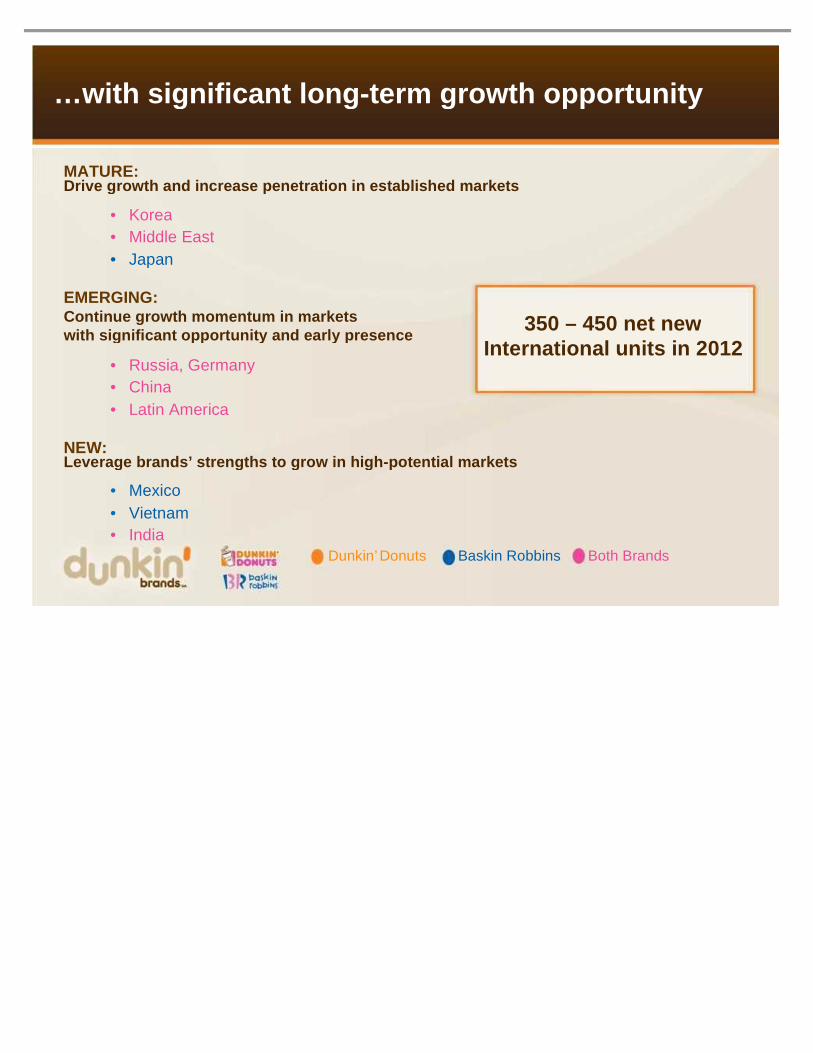
…with significant long -term growth opportunity
MATURE: Drive growth and increase penetration in establishe d markets
• Korea • Middle East • Japan
EMERGING: Continue growth momentum in markets with significant opportunity and early presence
• Russia, Germany • China • Latin America
NEW: Leverage brands ’ strengths to grow in high -potential markets
• Mexico • Vietnam • India
Dunkin’Donuts Baskin Robbins Both Brands
350 – 450 net new International units in 2012

State of the business
• Comps in Q1 2012 were 7.6% in Baskin-Robbins International and 2.3% in Dunkin’Donuts International
• DB International had over $1.9B franchisee reported sales in 2011. The segment grew by approx 9% to $424M in Q1 2012
• Q1 2012 profits were over $10M. Investment in the brands to continue with additional resources being added to accelerate growth
Points of Distribution Franchisee Reported Sales

My initial observations
o Reinforce and integrate international team
o Become more operations focused
o Strengthen infrastructure with development, operations, marketing and supply chain resources
o Leverage domestic strengths to grow awareness globally and ensure local relevance to optimize impact
o Baskin-Robbins has universal appeal
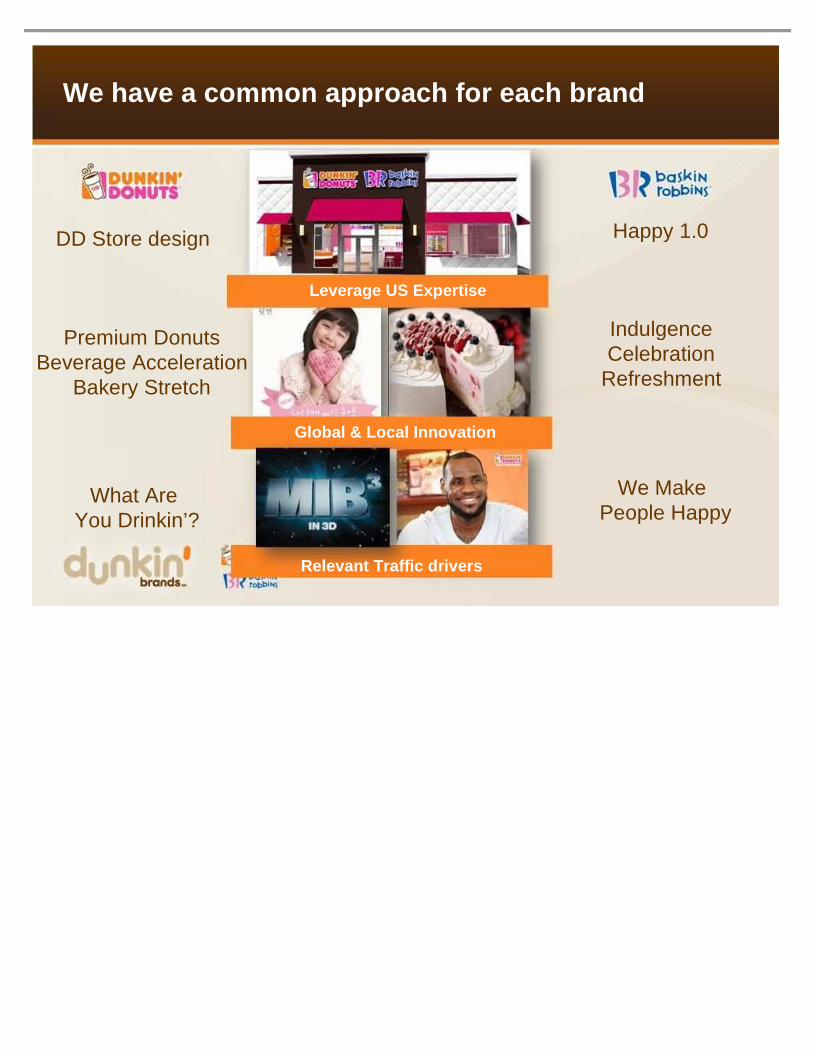
We have a common approach for each brand
Happy 1.0
Indulgence Celebration
Refreshment
We Make People Happy
DD Store design
Premium Donuts Beverage Acceleration
Bakery Stretch
What Are You Drinkin’?
Leverage US Expertise
Global & Local Innovation
Relevant Traffic drivers

Baskin -Robbins International Continues to Perform Well, Driven by Innovative, Differentiated Guest Experien ce
S. Korea Russia
Saudi Arabia United Arab
Emirates Oman
Bahrain
Vietnam
400 Happy 1.0 Design Locations
Singapore Malaysia Australia Mexico Canada China United
Kingdom
Ecuador Puerto Rico Indonesia
NEXT

World -class design that makes product the star, celebrate s brand heritage and is a happy, social gathering pla ce
• Partners actively remodeling existing restaurant base
• AWS lift from remodels and new stores in Happy 1.0 design
• Reduced build -out costs in certain markets
• Expect more than 600 Happy 1.0 restaurants by end of 2012
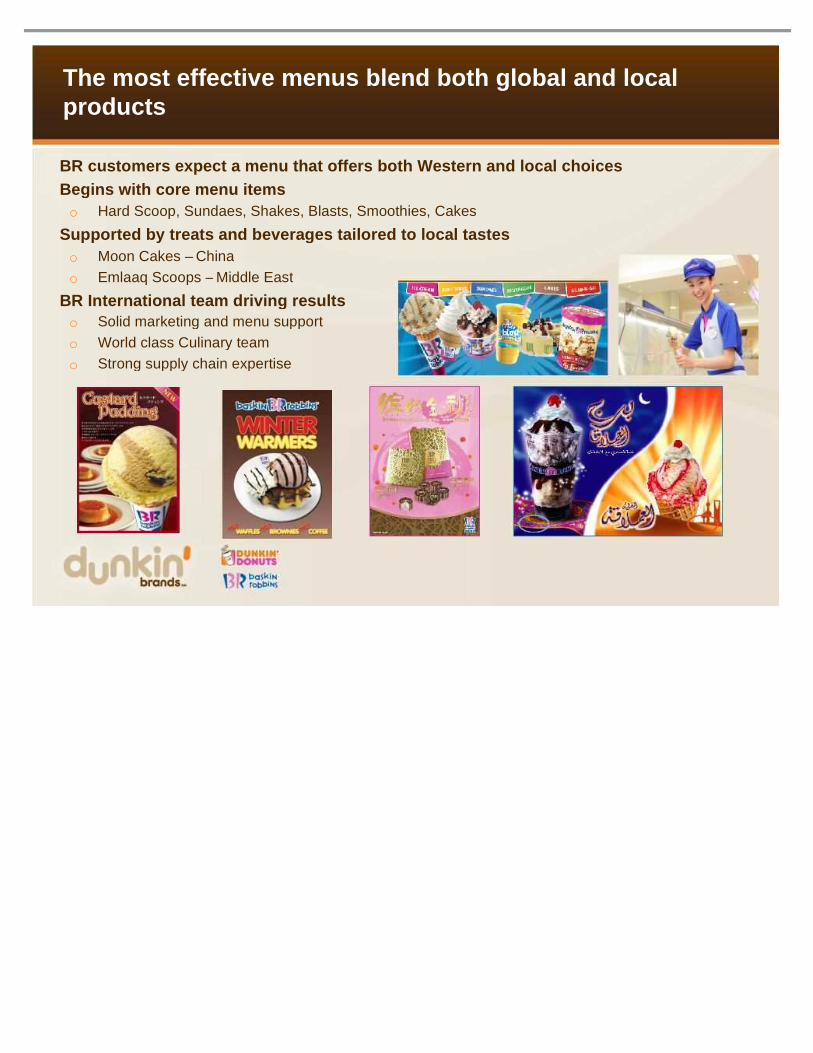
The most effective menus blend both global and loca l products
BR customers expect a menu that offers both Western and local choices Begins with core menu items o Hard Scoop, Sundaes, Shakes, Blasts, Smoothies, Cakes
Supported by treats and beverages tailored to local tastes o Moon Cakes – China
o Emlaaq Scoops – Middle East
BR International team driving results o Solid marketing and menu support
o World class Culinary team
o Strong supply chain expertise

For Dunkin ’ Donuts, a flexible format enables a relevant customer experience for different markets

Dunkin Donuts International - Store Design
Global (Freestanding)
Regional (Self Serve Donuts)
Local (Kiosk)
• New store design to be released in Q3. • Universal signage and in store design elements, flexibility on format and profile • Self serve donut case proving very successful

Customer Appreciation
Coffee and Tea Time Afternoon Break Thai Flower Festival
Fruit Chewy
Relevant local marketing and local products to appe al to the local consumers and effectively drive sales

• Dunkin Donuts and Baskin-Robbins possess a strong international presence with a proven ability to grow in new markets
• Brands have ability to leverage domestic strengths to grow awareness globally and ensure local relevance to optimize impact
• Leveraging key elements of our international development strategy • Growing in existing core markets • Capitalizing on markets with major growth potential • Further developing our franchisee support structure
Significant International growth opportunities
International business poised for significant, long -term growth opportunities

Rejuvenating a Beloved Brand
Bill Mitchell Senior Vice President & Brand Officer,
Baskin-Robbins U.S. & Canada
“Back to basics” to drive BR U.S. comp store sales growth

Rejuvenating a beloved 65 -year old brand
(5.2%)
0.5%
(2.8%)
1.7%
5.8%
0.5%
9.4%
(6.0%)
(4.0%)
(2.0%)
0.0%
2.0%
4.0%
6.0%
8.0%
10.0%
12.0%
FY'10 Q1'11 Q2'11 Q3'11 Q4'11 FY'11 Q1'12
o Steadily increasing comp store sales growth
o Q1 2012 -- highest quarterly increase since Q4 2001
o 2012 Guidance : 2 –4% comp store sales growth
o Optimizing store base
Comp Store Sales Momentum Turning around Baskin -Robbins U.S. despite challenging U.S. ice cream market

Increasing comp store sales growth for BR U.S.
PINK SPOON DRIVEN
PROFITABLE TOPLINE SALES
RETURN TO GROWTH

Pink Spoon Driven
“ Pink Spoon ” plan is all about Operational Execution
o Focusing on the basics • Setting stores to brand standards
o Measuring what matters • Guest Satisfaction Survey
o Standardizing the POS in all BR U.S. restaurants
o Engaging crew with rallies and incentives
o Strengthening franchisee partnerships with hands on approach
Steadily increasing guest satisfaction scores

Profitable Topline Sales: Core Marketing Priorities
DRIVE profitable traffic through strong value proposition and differentiated products
INCREASE ticket inside the four walls to build profits
GET ‘EM IN
IMPROVE relevance, differentiation and consistency
BUILD THE AND

Profitable Topline Sales: Strong value proposition and differentiated products

Return to Growth: Optimizing restaurant base Case Study: Burbank, CA

Return to Growth: New Store Design

Strong Platform for Continued Growth
• Brands have unique mix of heritage and consumer buzz
• Track record of driving strong comps
• Both domestic and international white space growth opportunities
• Experienced management team focused on disciplined and profitable growth by franchisees
• Committed to strong long-term earnings growth and cash flow generation with an asset-light business model
