duration of fishing rights and investment: an … · duration of fishing rights and investment: an...
TRANSCRIPT

PO Box 1390, Skulagata 4 120 Reykjavik, Iceland Final Project 2004
DURATION OF FISHING RIGHTS AND INVESTMENT: AN EMPIRICAL STUDY OF INVESTMENT IN NAMIBIAN
FISHERIES
Panduleni Ndinelago Elago Ministry of Fisheries and Marine Resources (MFMR)
Directorate of Policy, Planning and Economics, P/Bag 13355 Windhoek, Namibia
[email protected] or [email protected]
Supervisors Dr. Eyjolfur Gudmundsson. [email protected] and
Mr. Thorir Sigurdsson, [email protected] of Natural Resource Sciences, University of Akureyri, Iceland
ABSTRACT
In June 1993 the Namibian government announced the expiration of existing fishing rights and the application of a new fishing rights system starting in January 1994. Rights are now granted for seven, 10, 15 and 20 years on the basis of investment, Namibian participation and other requirements. Data are gathered by surveys on income and expenditure to fulfil the policy conditions. In this study, part of the data are used to test if there are any statistical relationships between various factors such as levels of investment, interest rates, fishing income and quota, and the length of fishing rights. A log-linear model is derived to analyse elements that influence investment. In addition, the relationship between social contribution and length of fishing rights is explored. The results indicate that the interest rate is insignificant, while quota and fishing income influence investment. In particular, short term right holders invest almost twice as much as long term right holders. The model indicated positive net (but declining gross) investment for long term right holders. Long term rights holders also contribute more in terms of social activities than short term rights holders. Incentives for investment decisions can only be maximised if fishing company managers identify the desired expansion of investment in the sector. The government needs to revise its policy statement on investment in the Namibian fishing sector and optimal efficiency needs to be better interpreted. Keywords: Namibia, fishing rights, long term rights, short term rights, investment and decision, social contribution, quota.

Elago
TABLE OF CONTENTS 1 INTRODUCTION.........................................................................................................................4
1.1 OBJECTIVE OF THE STUDY ......................................................................................................5 1.2 WORKING HYPOTHESIS...........................................................................................................5 1.3 MATERIALS AND METHODS ....................................................................................................5
2 DEVELOPMENT OF THE NAMIBIAN FISHING RIGHTS REGIME................................7 2.1 FISHING RIGHTS BEFORE INDEPENDENCE................................................................................7 2.2 ESTABLISHMENT OF THE FISHING RIGHTS SYSTEM AFTER INDEPENDENCE..............................7
2.2.1 In addition: .......................................................................................................................9 2.3 THE CURRENT SITUATION OF FISHING RIGHTS AND ITS INVESTMENT COMPONENTS................9
2.3.1 New entrants, historical user groups, foreign ownership, and joint ventures ................11 2.4 THE ROLE OF MFMR IN FISHING RIGHTS ALLOCATION AND INVESTMENT TRACKING...........12
2.4.1 The granting of fishing rights and evaluation by the Ministry of Fisheries....................13 2.5 GOVERNMENT POLICY AND DEVELOPMENT OF INVESTMENT IN FISHERIES IN NAMIBIA........14
3 DESCRIPTION OF THE FISHERIES.....................................................................................16 3.1 HAKE FISHERY .....................................................................................................................16 3.2 HORSE MACKEREL FISHERY..................................................................................................18 3.3 SMALL PELAGIC (SARDINE/PILCHARD) FISHERY ...................................................................19 3.4 ORANGE ROUGHY FISHERY...................................................................................................20 3.5 MONKFISH FISHERY .............................................................................................................21 3.6 ROCK LOBSTER FISHERY.......................................................................................................21
4 THEORETICAL FRAMEWORK OF INVESTMENT ..........................................................23 4.1 BASIC INVESTMENT THEORY ................................................................................................23 4.2 NEO-CLASSICAL MODEL OF INVESTMENT .............................................................................23 4.3 IRREVERSIBLE INVESTMENT THEORY MODEL .......................................................................25 4.4 FORMULATION OF THE MODEL (SPECIFICATION OF THE INVESTMENT FUNCTION).................30
4.4.1 Investment functions methodology..................................................................................30 4.4.2 Measuring differences in the length of fishing rights .....................................................32
5 THE DATA SET .........................................................................................................................33 5.1 EVALUATION OF THE FISHERIES ...........................................................................................34 5.2 SAMPLE OF ACQUISITIONS....................................................................................................35
6 EMPIRICAL RESULTS ............................................................................................................36 6.1 MEASURING INVESTMENT USING A LOG-LINEAR REGRESSION FORM ....................................36 6.2 SOCIAL CONTRIBUTION ESTIMATION ....................................................................................39
7 SUMMARY AND CONCLUSIONS .........................................................................................40 ACKNOWLEDGEMENTS .................................................................................................................43 LIST OF REFERENCES.....................................................................................................................44 APPENDIX 1: NAMIBIAN FISHING RIGHT HOLDERS.............................................................47 APPENDIX 2: INCOME AND EXPENDITURE SURVEY QUESTIONNAIRE..........................51
UNU-Fisheries Training Programme 2

Elago
LIST OF FIGURES
Figure 1: Annual TAC and total catch of the hake fishery, 1994-2003 (Manning 2000 and MFMR 2003). .......................................................................................................17 Figure 2: Annual TAC and total catches of the horse mackerel fishery, 1994-2003 (Manning 2000 and MFMR 2003)...............................................................................18 Figure 3: Annual TAC and total catches of the pilchard fishery, 1994-2003 ................ (Manning 2000 and MFMR 2003)...............................................................................19 Figure 4: Annual TAC and total catches of the monkfish fishery, 1994-2003 .............. (Manning 2000 and MFMR 2003)...............................................................................21 Figure 5: Annual TAC and total catches of the rock lobster fishery, 1994-2003 .......... (Manning 2000 and MFMR 2003)...............................................................................22
LIST OF TABLES Table 1: Terms and conditions of fishing rights (Armstrong et al. 2004). ...................9 Table 2: Number and duration of existing harvesting rights as of December 2003 (MFMR 2003). .............................................................................................................10 Table 3: Results of fishing rights evaluation in Namibia, 2001 (MFMR 2001).........13 Table 4: Results of the fishing rights evaluation in Namibia, 2003 (MFMR 2003). ..14 Table 5: Indicative investment and socio-economic contributions made by rights holders since independence* (Nichols 2004). .............................................................15 Table 6: Descriptive statistics. ....................................................................................35 Table 7: Investment by log-linear form (Model 1). ....................................................36 Table 8: Investment by log-linear form (Model 2). ....................................................37 Table 9: Social contribution log-linear form. .............................................................40
UNU-Fisheries Training Programme 3

Elago
1 INTRODUCTION Some of the main questions debated by Namibian policy makers and researchers are whether investment stimulates private sector productivity, thereby increasing economic growth and whether private investors provide for training, transfer of knowledge and create employment opportunities for Namibians to the fullest extent possible. According to the Minister for Fisheries and Marine Resources (Iyambo 2003), the private sector in the Namibian fishing industry has made a commitment to considerable long-term investment in the sector. The theory of investment is that the stock market is a passive predictor of future investment activity. However, investment decision cannot rely only on that. If an investor is pessimistic about a company’s profitability, the management may be deterred from investing further. A neo-classical growth model assumes that once the economy has converged to its steady state, the growth rates of investment and capital stocks are equal to the exogenous rate of technological progress. Theoretical literature is reasonably clear about the relationship. Empirical literature, however, is still ambiguous about the direction and the strength of the long-term relationship between investment and rights in the fishing sector. Boyce (1993) stated that the problem of capital accumulation in a fishery lies in the interdependence of the biological and physical capital stock. Investment decision is easily reversed if physical capital stock is not increased or decreased without cost. On the other hand, Clark et al. (1979) presented a theory that investment controls depend entirely upon the state of the system. At the same time, Clark et al. (1979) provide a theory on investment that once a fishing firm or authority invests in a fleet or vessel, it has to keep it until the fleet has depreciated or the vessels can only be disposed of at considerable economic loss. But how far is investment practised as required by authorities of all right holders in the Namibian fisheries sector? There are different scenarios attached to the way investors make decisions to invest and when to do so. Since the independence struggle, the Namibian fishing and fish processing industries have substantially matured from a relatively new industry, which needed large volumes of new capital and new skills, to a relatively well developed industry which is substantially capitalised (Anon 1998). Ever since Namibia gained independence in 1990, its fisheries management has been guided by a white paper policy entitled: Towards Responsible Development of the Fisheries Sector. The policy was later translated into a comprehensive legislative framework called the Sea Fisheries Act (Act 29 of 1992) (MFMR 1991). At the time, Namibia was adopting modern fisheries management based on a system of allocating rights. The Act then introduced a new approach to the management of the fisheries stating that “any person wishing to exploit the resources must first be granted a right to harvest”. It was stated then that rights granted prior to independence would expire at the end of December 1993 and that all existing1 rights holders would need to apply for new rights of exploitation together with new entrants. The 1992 Act was replaced in 2001 by the Marine Resources Act (Act 27 of 2000). In August 2004, the 1991 white paper was revised and is now entitled: Towards Responsible Development and Management of the Marine Resources Sector (MFMR 2004). When considering applications for granting fishing rights, the government:
1 Existing rights holders (historical user groups) were those who had been granted rights in 1987 plus newcomers to the industry who had been granted rights since independence.
UNU-Fisheries Training Programme 4
Elago
takes into consideration the applicants competence in fishing and operating the vessel, extent to which Namibians are or will be involved, and investment in the sector as well as required development (MFMR 2004, pg.13).
In June 2001 the Minister of Fisheries announced the change in fishing rights from the former period of four, seven and 10 years to seven, 10, and 15 years respectively. In addition, 20 year rights were introduced. The adjustments made in 2001 were due to the fact that Namibia’s fisheries sector has grown since independence and investment has increased more substantially than was expected when the rights were first introduced in 1994 (Iyambo 2003). Iyambo (2003) further mentions that investors need stability and a reasonable planning period in order to plan their operation and investment. On the other hand, short term rights were affecting mainly new entrants, companies that needed to invest in vessels within the first three years of operation. This condition has proved to be a considerable hurdle and brought about major burdens. According to the Act, except in specified fisheries, every applicant for a right of exploitation is required to show how there will be investment in vessels within three years of the date from which the right becomes valid. Exempted from this are fisheries where the economic viability of fishing operations is such that some level of charter arrangement may be necessary in the medium term. Even in these cases, priority is given to applicants prepared to make an investment in vessels and/or onshore processing facilities. Fisheries in Namibia have become an important pillar of the economy. The fishing sector has increased from N$288 million (4% of the GDP) in 1991 to N$1 929 million (7%) in 2001 and finally a total contribution of N$2 311 million (7.3%) in 2002, making it the second largest contributor to the GDP in the country, after the mining sector (MFMR 2003, Nichols 2004). 1.1 Objective of the study The objective of this study is to study empirically the level of investment based on the fishing rights system in Namibia. The goal is to analyse elements that influence investment as a dependent variable in the fishing sector. 1.2 Working hypothesis Ho: The longer the fishing rights, the greater the investment. H1: The null hypothesis does not hold. 1.3 Materials and methods The theoretical framework that covers the basic theories of investment is supported by papers from Clark et al. (1979) based on the effects of irreversible investment upon optimal exploitation policies for renewable resources; a non-linear irreversible investment and harvest capacity constraints model (Boyce 1993); and the neo-classical model approach as presented by Byrne and Davis (2003). An econometric software package, EVIEW, was used. By empirical use of this statistical software, one is able to interpret the different compositions of investment in
UNU-Fisheries Training Programme 5

Elago
relation to the duration of rights attached to the individual or companies in monetary terms. A mathematical functional form and variables are identified to simplify and run the investment function model that will give supporting results to the study objective and oversee whether the working hypothesis holds. Limitation of the study lies in the available data sets. Published and internal documents on fishing rights and investment from the Ministry of Fisheries and Marine Resources (MFMR) were the main data source of the study. The data was based on the annual Income and Expenditure Survey carried out by the Ministry’s Economics division with information on the value of assets from the individual fishing companies being part of the model data fit to test the working hypothesis (a copy of the survey questionnaire is included in Appendix 2). Social contribution data collected and compiled by the Ministry was also part of the data set. The paper is organised as follows. The following section outlines the Namibian fishing sector, particularly the development of the fishing rights system. In short, the section gives insight into what brought about the establishment of fishing rights in Namibia. The third section details the six fisheries that have been selected for the study. Section four provides a theoretical overview of investment followed by investment models developed by Clark et al. (1979) and Boyce (1993) respectively. Using these models as an analytical foundation, together with a neo-classical approach, parameters are examined that influence investment decision in the fishing sector. The fifth section discusses data issues and section six presents the empirical results. Section seven concludes the paper.
UNU-Fisheries Training Programme 6

Elago
2 DEVELOPMENT OF THE NAMIBIAN FISHING RIGHTS REGIME 2.1 Fishing rights before independence The management of the Namibian nation and its water bodies was the responsibility of the South African Administration (SAA hereafter) before independence. Its waters were partly regulated and controlled by the International Commission for the South East Atlantic Fisheries (ICSEAF). The SAA and the ICSEAF were supposed to be responsible for the well-being of the Namibian natural resources and inhabitants. However, power was never exercised to limit the exploitation of the marine resources from those who were illegally fishing (the foreigners), taping down the living marine resources of Namibia and investing in their own countries (Anon 1998). In 1987 the first fishing companies were granted rights for a seven year period2 under SAA control. No Namibian benefited from the rights granted during that time. There was no quota control since fish was harvested and transported immediately to other countries for processing. The number of fishing vessels did not decrease even after the granting of rights in 1987. This remained the same until the new government stepped in with its new management system. After Namibia became independent, fishing rights were introduced where historical performance carried little weight (FAO 2000). At the time, there was a high degree of interest from the South Africans, who had been active in the Namibian waters before independence. This group had to acquire rights through Namibian holding companies or other restructured companies 2.2 Establishment of the fishing rights system after independence After a long struggle Namibia became independent in 1990. The country underwent a political transition from a minority-controlled state to a new democracy that effectively empowered many Namibians. This is supported by a quote by the former Permanent Secretary for Fisheries in Namibia, Mr Kankondi, in 1994 (Manning 2000) following the granting of new rights of exploitation: “from a position where the industry was almost completely foreign-owned, nearly 70% of the rights holders are effectively wholly-owned Namibian businesses and another 23% are majority Namibian owned”. In total, of the rights of exploitation granted at that time, 93% were either wholly or majority owned by Namibians3. The former uncontrolled fishing by European and South African fleets that led to the depletion of the main commercial species found in Namibian waters came to an end
2 These rights came to an end in December 1993. Before the granting, Namibian marine resources were heavily depleted by foreign vessels and the South African Administration saw a need to start limiting access to harvesting, but this was perhaps already too late as major exploitation has already occurred. Still, the power they had at the time was not taken seriously. Foreign fleets carried on over fishing with the weak or non-existent management, until the time of independence in 1990. At that time, rather immediate action was taken that forced unlicensed foreign vessels that were fishing within 200 nautical miles to leave the Namibian fishing grounds. 3 In addition, when Namibia first became independent, Namibians controlled only 17% of the hake quota. – Today, Namibian control is around 96%. In horse mackerel the story is similar, rising from less than 14% to around 92%. In some fisheries, such as the small pelagic fishery and rock lobster, all quotas are now Namibian owned. At the same time, the sector continues to attract foreign capital, skills and market access necessary for further development (Nichols 2004).
UNU-Fisheries Training Programme 7

Elago
with the new government. At the time, Namibia recognised the urgent need to set up a management regime to rebuild its fish stocks, prevent over-exploitation of the available resources, make them available to people who had previously been excluded by the apartheid regime, and promote economic viability of the fishing industry. The Ministry of Fisheries and Marine Resources was established to oversee the transaction of the Namibian marine living resources and draft fisheries policies and legislation in a rather short period of time. As mentioned in the introductory part of this paper, Namibia then worked successfully towards adopting a system of fishing rights and setting a total allowable catch based on scientific information. The right of exploitation is required in order to harvest any commercial species of fish or other living marine resource. Under the Marine Resources Act of 2000, it is stated that:
No person shall in Namibia or in Namibian waters harvest any marine resource for commercial purposes, except under a right, an exploratory right or a fisheries agreement (MFMR 2000, pg. 18).
The first fishing rights under the new government were introduced in 1994 for a period of four, seven and 10 years. Five year rights were granted later for mullets in 1998. The reason for granting rights is that it brings about better management and ensures a fishing capacity correspondent to the size and sustainability of the resources. Allocation and requirements of different fishing terms is based on specific criteria or conditions, as set in the Ministry’s document entitled Policy Statement on the Granting of Rights of Exploitation of Fishing Quotas (MFMR 1993). Reallocation of access rights was and still is highly promoted in order to allow new entrants from the formerly disadvantaged Namibian citizens. This promotion is part of the Namibianisation and empowerment policies currently being exercised. Apart from the criteria for granting rights and setting quotas, allocation also depends on the investment effort of companies and/or individuals, and the degree of Namibian ownership in the marine industry to bring about more stability in the sector. Under section 14(6) of the Sea Fisheries Act (MFMR 1992), and article 33 of the Marine Resource Act (MFMR 2000), the Minister of Fisheries may from time to time, by notice in the Gazette, announce a period during which applications may be made for rights to harvest marine resources for commercial purposes. When considering an application the Minister may consider the following:
• whether or not the applicant is a Namibian citizen; • whether the application is a company and the extent to which the control of the
company is vested in Namibian citizens; • the beneficial ownership of any vessel which will be used by the applicant; • the ability of the applicant to exercise the right in a satisfactory manner; • the advancement of persons in Namibia who have been socially, economically
or educationally disadvantaged by discriminatory laws or practices, which were enacted or practised before the independence of Namibia;
• regional development within Namibia; • Socio-economic concerns.
UNU-Fisheries Training Programme 8

Elago
2.2.1 In addition:
• fishing rights are valid for the period that is prescribed or if no period is prescribed, for a period that the Minister may specify;
• fishing rights are valid for harvesting the marine resources for which they are granted and for such by-catch as may be prescribed or specified;
• the application is required to show how there will be investment in vessels within three years of the date from which the right is valid.
Oelofsen (1999) regarded these criteria as aiming to ensure that Namibians got a favourable chance (stake) to enter the industry and facilitate the empowerment of previously disadvantaged groups. This policy allowed an increase in Namibian ownership in the industry and encouraged investment. When the first call for applications was made by the Minister of Fisheries, the Ministry received 565 applications from 316 applicants. One hundred fifty-nine fishing rights were granted to 120 companies and individuals (Manning 2000).4 Most of these applicants were Namibian citizens who had an interest in entering the fishing industry for the first time and had previous knowledge of the industry. A few foreigners also applied and some of them were granted fishing rights. Some of these rights have now expired with no possibility of renewal, others have been extended to longer fishing terms and newcomers have entered the industry. Companies that had fishing licences before independence were required to reapply in 1994 together with many newcomers in the industry. An exemption was made for nine rights holders who had been granted hake wet and horse mackerel rights two months earlier in May 1993. 2.3 The current situation of fishing rights and its investment components Fishing rights are currently subject to the seven, 10, 15 and 20 year conditions. However, there are still a few fishing companies operating with four year rights since they were granted rights before the new rules came into effect. During the applications of 2002, the Ministry noticed that the fishing industry was contributing to social welfare and to the economic growth of the country. In a speech by the Minister for Fisheries (Iyambo 2000), he said that he was pleased that participants in the sector generally did not entertain greed and selfishness, but accommodated each other. It was a positive sign that people did not only enter the fishing industry for the sake of a business venture, but also to contribute to the economy and development of the country. This is done through investment in infrastructure and human development, vessel upgrading and social contributions. However, at the same time the Minister noted that some fishing rights holders had failed to keep the promises made in their initial application and seemed interested only in short-term financial returns by ‘selling out’ their quota to others and not creating new jobs. The conditions related to the different terms of the Namibian fishing rights are tabulated below.
Table 1: Terms and conditions of fishing rights (Armstrong et al. 2004).
Duration Conditions granted to: Seven year rights
i) applicants with less than 50% Namibian ownership of vessels or onshore
4 Excluding the five year rights granted for mullets in 1998 to 17 companies and/or individuals.
UNU-Fisheries Training Programme 9
Elago
processing plants in the fishery where rights are granted, ii) applicants with less than 51% Namibian ownership in the venture without significant onshore investments in the fishery where rights are granted.
10 year rights
i) applicants with at least 50% Namibian ownership of vessels or onshore processing plants in the fishery where rights are granted, ii) applicants with less than 51% Namibian ownership in onshore investments in the fishery where rights are granted.
15 year rights
i) ventures that are at least 90% Namibian owned with significant investment in vessels or onshore processing plants (50% ownership in facilities in the fishery where rights are granted, is seen to be significant), ii) Namibian rights holders with small shares in larger ventures, iii) majority foreign owned ventures with the capacity to make a major contribution to economic and overall development in Namibia (onshore employment of 500 Namibians is seen as a major contribution), and iv) smaller joint or wholly foreign-owned ventures, which can make innovative contributions to the development of the fishing industry in Namibia, such as developing new products or export markets, and where a long-term right is necessary to secure the investment involved.
20 year rights
ventures that fulfil the 15 year terms and employ at least 5000 permanent employees in onshore processing facilities.
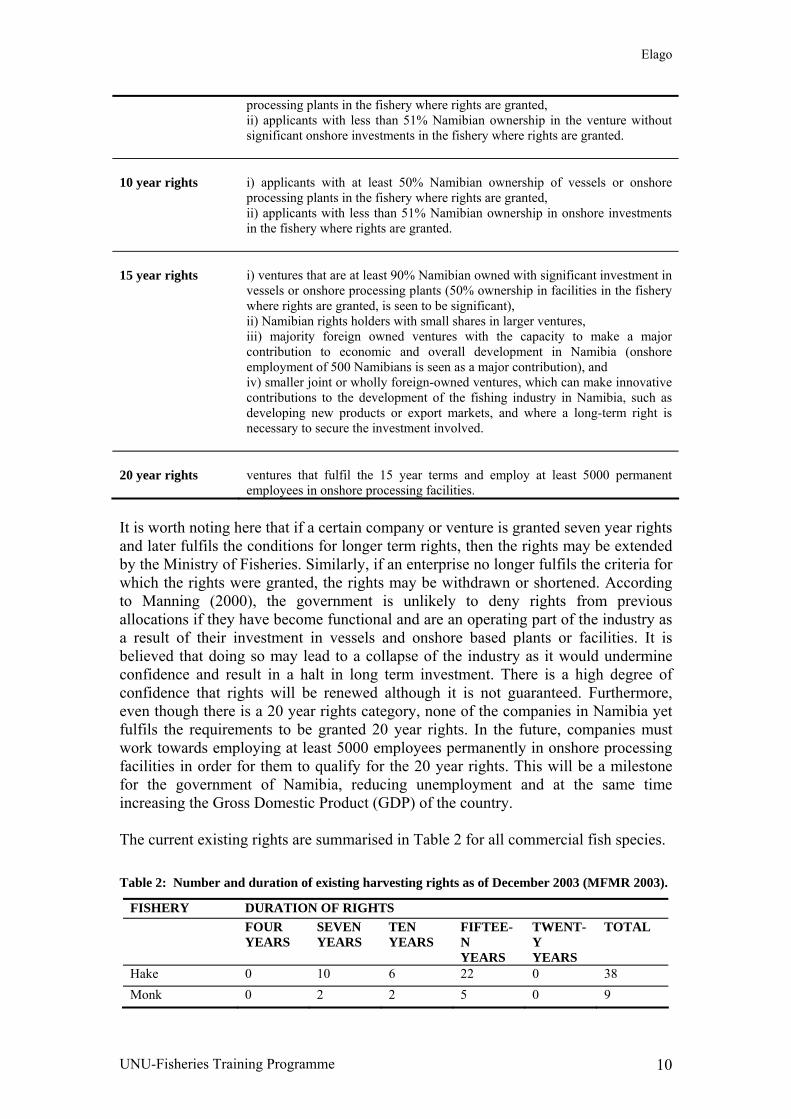
It is worth noting here that if a certain company or venture is granted seven year rights and later fulfils the conditions for longer term rights, then the rights may be extended by the Ministry of Fisheries. Similarly, if an enterprise no longer fulfils the criteria for which the rights were granted, the rights may be withdrawn or shortened. According to Manning (2000), the government is unlikely to deny rights from previous allocations if they have become functional and are an operating part of the industry as a result of their investment in vessels and onshore based plants or facilities. It is believed that doing so may lead to a collapse of the industry as it would undermine confidence and result in a halt in long term investment. There is a high degree of confidence that rights will be renewed although it is not guaranteed. Furthermore, even though there is a 20 year rights category, none of the companies in Namibia yet fulfils the requirements to be granted 20 year rights. In the future, companies must work towards employing at least 5000 employees permanently in onshore processing facilities in order for them to qualify for the 20 year rights. This will be a milestone for the government of Namibia, reducing unemployment and at the same time increasing the Gross Domestic Product (GDP) of the country. The current existing rights are summarised in Table 2 for all commercial fish species. Table 2: Number and duration of existing harvesting rights as of December 2003 (MFMR 2003).
FISHERY DURATION OF RIGHTS FOUR
YEARS SEVEN YEARS
TEN YEARS
FIFTEE-N YEARS
TWENT-Y YEARS
TOTAL
Hake 0 10 6 22 0 38 Monk 0 2 2 5 0 9
UNU-Fisheries Training Programme 10
Elago
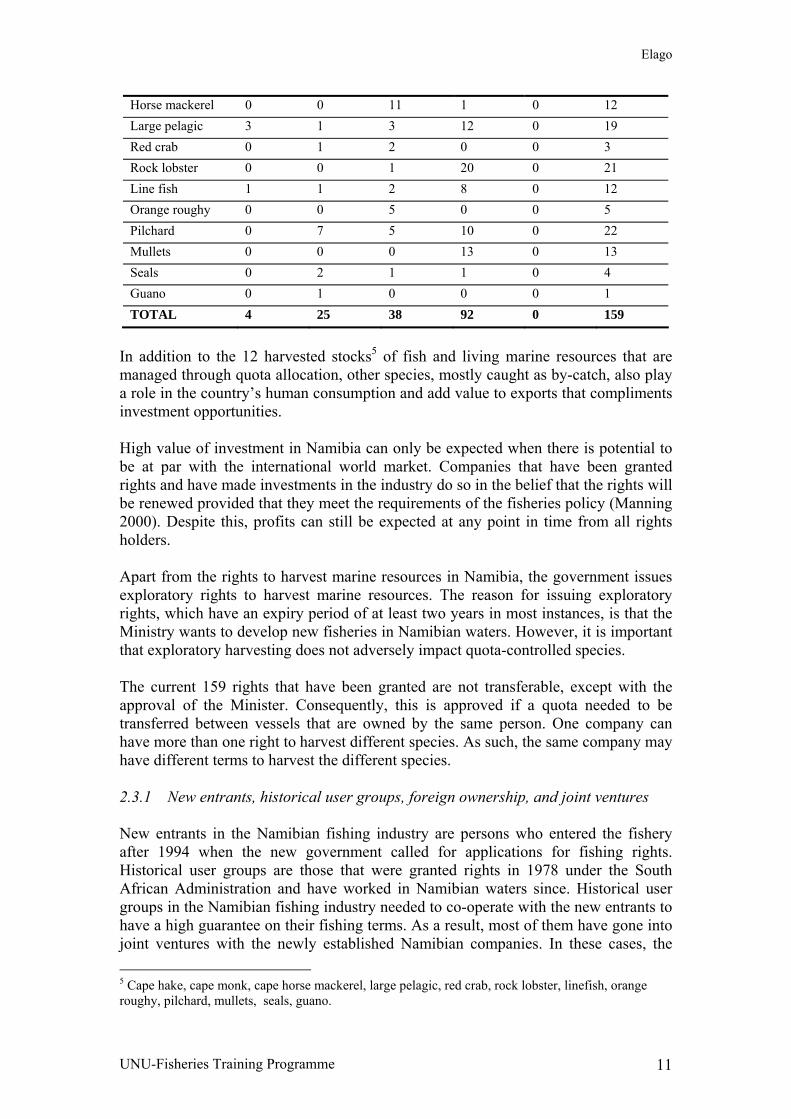
Horse mackerel 0 0 11 1 0 12 Large pelagic 3 1 3 12 0 19 Red crab 0 1 2 0 0 3 Rock lobster 0 0 1 20 0 21 Line fish 1 1 2 8 0 12 Orange roughy 0 0 5 0 0 5 Pilchard 0 7 5 10 0 22 Mullets 0 0 0 13 0 13 Seals 0 2 1 1 0 4 Guano 0 1 0 0 0 1 TOTAL 4 25 38 92 0 159
In addition to the 12 harvested stocks5 of fish and living marine resources that are managed through quota allocation, other species, mostly caught as by-catch, also play a role in the country’s human consumption and add value to exports that compliments investment opportunities. High value of investment in Namibia can only be expected when there is potential to be at par with the international world market. Companies that have been granted rights and have made investments in the industry do so in the belief that the rights will be renewed provided that they meet the requirements of the fisheries policy (Manning 2000). Despite this, profits can still be expected at any point in time from all rights holders. Apart from the rights to harvest marine resources in Namibia, the government issues exploratory rights to harvest marine resources. The reason for issuing exploratory rights, which have an expiry period of at least two years in most instances, is that the Ministry wants to develop new fisheries in Namibian waters. However, it is important that exploratory harvesting does not adversely impact quota-controlled species. The current 159 rights that have been granted are not transferable, except with the approval of the Minister. Consequently, this is approved if a quota needed to be transferred between vessels that are owned by the same person. One company can have more than one right to harvest different species. As such, the same company may have different terms to harvest the different species. 2.3.1 New entrants, historical user groups, foreign ownership, and joint ventures New entrants in the Namibian fishing industry are persons who entered the fishery after 1994 when the new government called for applications for fishing rights. Historical user groups are those that were granted rights in 1978 under the South African Administration and have worked in Namibian waters since. Historical user groups in the Namibian fishing industry needed to co-operate with the new entrants to have a high guarantee on their fishing terms. As a result, most of them have gone into joint ventures with the newly established Namibian companies. In these cases, the 5 Cape hake, cape monk, cape horse mackerel, large pelagic, red crab, rock lobster, linefish, orange roughy, pilchard, mullets, seals, guano.
UNU-Fisheries Training Programme 11

Elago
Namibian companies guarantee fishing rights, while the historical user groups secure the financial ground and expertise to operate the company. In accordance with Namibia’s Marine Resources Policy, a joint venture is a partnership between foreign and Namibian “participants” which presents opportunities such as financing, capital investment and transfer of knowledge to the Namibian counterpart whilst it provides the foreign counterpart with access to the Namibian fish resources (MFMR 2004). The fisheries policy of Namibia is aimed at increasing benefits for Namibia, especially through onshore development (MFMR 1993). This is an approach that aims to provide increased opportunities for Namibians to participate in fishing and related businesses and also to provide scope for foreign investment through joint ventures or wholly owned foreign ventures in onshore processing. Namibians are now the majority holders of fishing rights in the entire fishing sector. The majority benefiting through the Namibianisation and empowerment policies in the fisheries sector. Others acquired shares in older companies’ directly by individual shareholders and/or indirectly through investment representing Namibian majority-owned trusts/community projects. Some of the Namibian companies lease out their quota to older bigger companies which are already well established. In other words, there are a number of rights holders in the Namibian fisheries who do not operate independently. This is commonly known in the Namibian fishing industry as “joint ventures” or “operation agreements” between new entrants and the historical groups who have the knowledge and skills. However, such arrangements usually lead to some stakeholders not being engaged in the actual harvesting operations. In the absence of financing options, companies may have leased their quotas in order to build up capital for investment in their own harvesting potential (Erastus 2002). This shows that some earnings from the industry go to smaller companies and other shareholders, who by and large have no active involvement in the industry. Many foreign investors continue to find valuable opportunities for investment in the sector through partnership with Namibian companies in joint ventures. Government policy on investment, particularly foreign direct investment, remains of great importance. 2.4 The role of MFMR in fishing rights allocation and investment tracking The Ministry’s main aim and role is to encourage further development in the fisheries sector. Its role is also to introduce new measures to encourage further investment in land-based fish processing in order to increase employment and the overall earnings of Namibia (MFMR 2004). With the powers given to the Minister for Fisheries and Marine Resources, according to the Sea Fisheries Act of 1992 and the Marine Resources Act of 2000, the Minister may decide not to renew fishing rights, terminate them or suspend them at the expiry date or anytime he sees fit. This seems to motivate less confidence in investing in the sector, especially if you have been granted short term rights. On the other hand, this can be an influential way to counteract those who join the industry and do not work hard towards investing in the sector. It can be argued that once an individual is granted short term rights, investing more rather than less in a relatively short period is only possible depending on the kind of motive (s)he will has. For one, (s) he may decide to invest with the confidence that his/her rights will be renewed after its first expiry. Conversely, (s)he may think of earning only enough for that short period without caring what is likely to happen when his/her
UNU-Fisheries Training Programme 12

Elago
rights are due to expire. Investment and any allocation of fishing rights are highly dependent on the type of system used to control such arrangements. 2.4.1 The granting of fishing rights and evaluation by the Ministry of Fisheries From the conditions of granting fishing rights, as tabulated in Table 1, the Ministry looks at investment in onshore processing plants and vessels. The rights are also granted in accordance with the Namibian citizens’ shareholding (by percentage) in large venture companies. When the percentage of Namibian citizens is great, there is a better chance that longer term rights will be granted. Erastus (2002) maintains that lack of capital and collateral to buy vessels or processing machinery to be granted a longer term rights is a problem in the Namibian fishing industry. Even if capital markets were perfect and loans were granted on equal terms, operation costs would be higher as a result of a lack of experience among the Namibians. Examples are presented in this subsection to illustrate how the Ministry of Fisheries evaluates rights that are due to expire, as shown in the Ministry’s annual reports from 2001, 2002 and 2003. In 2001, the Minister of Fisheries extended the terms of five horse mackerel rights holders from the four year term granted in 1998 to seven year terms. At the same time, an evaluation was conducted for the 10 year rights granted in 1994 which were due to expire in 2003. Rights holders were invited by the Minister to submit motivations for extensions of their rights. This only applied to those who wanted to remain in the fishing industry after their rights expired. Simultaneously, those who made investments and had delivered the promises made in their initial applications were afforded longer term rights. This was done to provide a stable environment for future investment in the industry in terms of on-land processing plants, high-capacity vessels and other contributions to the economy. The outcome of the 2001 evaluation for renewal of rights is summarised in Table 3. Table 3: Results of fishing rights evaluation in Namibia, 2001 (MFMR 2001).
Extension of rights granted Fishery Motivations received
7 yr 10 yr 15 yr
Hake 21 1 2 18 Monkfish 5 0 0 5 Horse mackerel 3 0 2 1 Large pelagic 11 0 0 11 Red crab 1 0 1 0 Rock lobster 15 0 0 15 Total 56 1 5 50
After the 2001 evaluation, there were rights that were due to expire at the end of 2003. The outcome of that evaluation is summarised in Table 4.
UNU-Fisheries Training Programme 13

Elago
Table 4: Results of the fishing rights evaluation in Namibia, 2003 (MFMR 2003).
Extension of rights granted Fishery Motivations received
7 yr 10 yr 15 yr
Hake 4 1 3 Line fish 1 0 0 1 Small pelagic 15 2 4 9 Monk 2 0 2 0 Large pelagic* 1 0 0 1 Rock lobster 6 1 5 Orange roughy 3 0 3 0 Seal 1 0 0 1 Total 33 2 11 17
Note*: Three large pelagic rights are currently under review for possible extension. More or less 18 fishing rights are due to expire in 2007. The Minister will be calling for motivations for renewal of rights by 2006. Most importantly, new applications for fishing rights may also be requested for the season starting in 2008.Currently, no information is available as to which fishery sectors the new applicants will be asked to apply for. If investment data was clearly available and distinguished yearly, it would have been possible to evaluate and observe how companies (whose rights will be expiring in 2007) are currently behaving towards the investment effort. In other words, perhaps there are some who have been investing less in the process, but due to approaching evaluation by the government, they are likely to revise their investments. This is normal behaviour for any company that operates where there is government control. The current status of fishing rights (excluding fisheries that are not sampled in this study) are presented in Appendix 1 of this paper with detailed information since they were first granted fishing rights and extensions there after. 2.5 Government policy and development of investment in fisheries in Namibia The government of Namibia has encouraged investment in Namibia and has particularly attempted to attract a greater flow of “foreign direct investment” (Manning 2000). Incentives were created to encourage manufacturing and exporting. For example, a factory engaged in fish processing receives an abatement of 50% of corporate tax for the first five years of operations, followed by a period of 10 years during which time the abatement is phased out on a straight line basis (MTI 1993). Further tax deductions may be made for a wide range of export promoting activities, as an encouragement to use labour intensive manufacturing processes and to promote training of technical personnel. After the Foreign Investment Act was passed in 1990, a range of exemptions to enable repatriation of profits and capital and availability of foreign currency were provided for. The government’s policy on trade and investment promotion aims at improving domestic markets for foreign companies to invest, while at the same time facilitating export for local producers. Overall, the Ministry of Trade is responsible for industrial development and investment promotion in the country. The government policy on investment in the fishing sector is shown in Table 1 of this paper. In addition, investment development can be quoted from the strategies for the marine resources
UNU-Fisheries Training Programme 14

Elago
sector in the Ministry’s Marine Resources Policy (MFMR 2004, pg. 19-23). These includes promoting investment in vessels, on-shore processing plants, human resources development, food security, Namibianisation, foreign interest and economic and overall development in the country. An increase in investment by onshore fish processing plants was recorded in the Ministry’s annual report of 2003. The fish production itself has increased from N$2.5 billion in 2002 to N$3.3 billion in 2003. The production was said to be a relatively small increase and more can still be done, as this is mainly due to the effects of the strengthening of the Namibian dollar against the US dollar, which has resulted in a decline in export prices. In Nichols (2004), on-shore processing has seen the number of whitefish processing plants increase from zero in 1991 to around 20 in 2003. Contribution of income from marine resources to the Gross Domestic Product has fluctuated over the years due to the unpredictable nature of the resources. Investment since independence in the fishing industry is presented in Table 5 below, presenting the total sum only. However, if measured from year to year, there has been an increase. As investment increases over the years, the value of fisheries production has also been increasing. Landed value has increased from N$520 million in 1991 to N$2 637 million in 2003. Final value has increased from N$644 million in 1991 to N$3 668 million in 2003. The value of exports (noting that 97% of the fish landed in Namibia is exported) has also increased from N$631 million in 1991 to N$3 506 in 2003 (MFMR 2003).
Table 5: Indicative investment and socio-economic contributions made by rights holders since independence*6 (Nichols 2004).
Sub-sector Investment (N$) Socio-economic contributions (N$)
Total (N$)
Demersal 1 203 153 010 16 472 599 1 219 625 608 Monk 296 165 000 2 066 241 304 631 241 Midwater 141 700 000 6 264 000 142 164 000 Small pelagic 262 480 000 6 769 000 269 249 000 Large pelagic 146 000 000 1 196 000 147 196 000 Linefish 12 023 000 65 000 12 088 000 Crab 14 400 000 N/a N/a Rock lobster 6 395 772 828 862 7 224 634 Total 2 082 316 782 33 661 702 2 115 978 484 According to Mr. Nichols (2004), the FAO special adviser to the Minister for Fisheries and Marine Resources in Namibia, there will continue to be room for new investment by both foreign and domestic investors in Namibia. However, competition is fierce from those already in the industry, including the many companies that have entered the sector since independence. Yet, investors who are interested in Namibia’s fishing and processing industries need to be well prepared and highly capable if they hope to secure successful trade and investment opportunities. Apart from the three major categories of investment, the fishing industry has made a great social contribution to the Namibian nation. Many believe, this contribution was made because fishing rights holders expect top officials in the government to recognise their efforts and increase their quotas. While this is the view of most of the 6 The figures in this table indicate the minimum level of investment and social contribution.
UNU-Fisheries Training Programme 15

Elago
Namibians, Nichols (2004) states that a worthy achievement of the sector is largely unnoticed and that the fishing companies are and has been making continuous contributions7 to social development throughout the country. It is worth stating here that social contribution in the fishing sector of Namibia has not come as part of a policy set by the government, neither is it a requirement from the government that the fishing rights holders need to fulfil. In fact, social contribution has now been made a sub-section under the Annual Income and Expenditure Survey report, where rights holders can inform the government of any social activities they have performed. To date, the social contribution is over N$33 million since 1994. For interest, this study will statistically test whether those who have made a huge contribution in terms of social affairs, are the same companies that are allocated more quota and long term rights. 3 DESCRIPTION OF THE FISHERIES 3.1 Hake fishery The Benguela upwelling current off the Namibian coast creates favourable conditions for marine life in Namibian waters. Before independence and the declaration of an EEZ of 200 nautical miles, the hake fishery was managed by ICSEAF and stock assessment was undertaken by various outside countries. Exploitation of this resource began in early 1950s by distant water trawlers. The industry developed into a multinational fishery which attracted increasing interest from foreigners (modern stern-trawlers) to migrate and start fishing heavily in the Namibian waters. This caused increasing pressure on the fish stock and a subsequent reduced catch rate in the North Atlantic demersal fisheries. With the history of the Namibian fisheries dating back to the early 1950s, fishing zones were declared in the mid 1970s. During the time, there was a rapid build-up of fishing effort on the hake (Merluccius paradoxus and Merluccius capensis) stock. Hake catches reached a maximum of more than 800,000 tonnes in 1972, averaging some 600,000 tonnes annually from the late 1960s to the mid 1970s. With a rather unexpected boom in hake catches, a high level of exploitation continued but catches and catch rates declined (Anon 1998). The following years brought about a low biomass level of 200,000 tonnes from the mid 1970s to 1980s8. When Namibia became independent, the TAC for hake was set at a low level of about 50,000 tonnes to help rebuild the stock that was then heavily depleted. Since then, the TAC allocation has been increasing gradually as presented in Figure 1 below.
7 Social contribution comes in the form of hard cash, construction of schools, clinics, churches, and all other needed civic facilities. 8 No sufficient time series data on the biomass of the stock was available to show the trend in figure form.
UNU-Fisheries Training Programme 16

Elago
0
50
100
150
200
250
300
1994 1995 1996 1997 1998 1999 2000 2001 2002 2003
Years
TAC
and
cat
ches
('00
0 to
nnes
)
Catch
TAC
Figure 1: Annual TAC and total catch of the hake fishery, 1994-2003 (Manning 2000 and MFMR 2003).
It is evident from the figure that for almost 10 years, the industry was not able to catch its total quota. This may have been due to a variety of factors such as environmental conditions or many new entrants in the fishing industry with limited knowledge of fishing or the hake stock is one of the three most important fish species in the Namibian EEZ. The other two are horse mackerel and pilchard. Overall, hake is the most valuable in terms of export revenues and employment contributing more than half of the final value of all fish products (MFMR 2002). The hake industry is also the largest industry with 38 fishing rights from a total of 159 allocated in Namibian waters. Management measures for the hake fishery include harvesting rights, TAC allocation (through the individual quota property rights system), area and by-catch restrictions, mesh size regulations and the implementation of selectivity devices. Others include a system of fees, monitoring, control and a surveillance system. The government seeks to manage the hake stock for the benefit of Namibia as a whole, by obtaining the maximum economic benefits from the resource without destroying its base. From the 12 TAC controlled fisheries in Namibia, the hake industry proved different to all the others. The hake industry has proved that the Namibianisation policy 9can work to a certain degree (MFMR 1993 and 2004). In the 2000/2001 fishing season, the biggest group of new entrants joined the hake industry in order to promote the policy and the fishing sector. This system was exercised mostly through joint venturing into already existing big companies.
9 The main strategies for the Namibianisation policy is to provide guidance to new entrants on accessing advice in regard to fishing, processing and marketing. Constantly assess progress in Namibianisation of the sector through Namibians share-ownership in companies and capital assets, employment at all levels, managerial control of companies, and involvement in fishing, processing & marketing operations. The others include Promoting income generation opportunities for Namibians, and most importantly ensure socio-economic benefits accruing through marine resources utilisation are widely distributed to the people of Namibia though a system of levies and fees to the state by right holders (MFMR, 2004).
UNU-Fisheries Training Programme 17
Elago
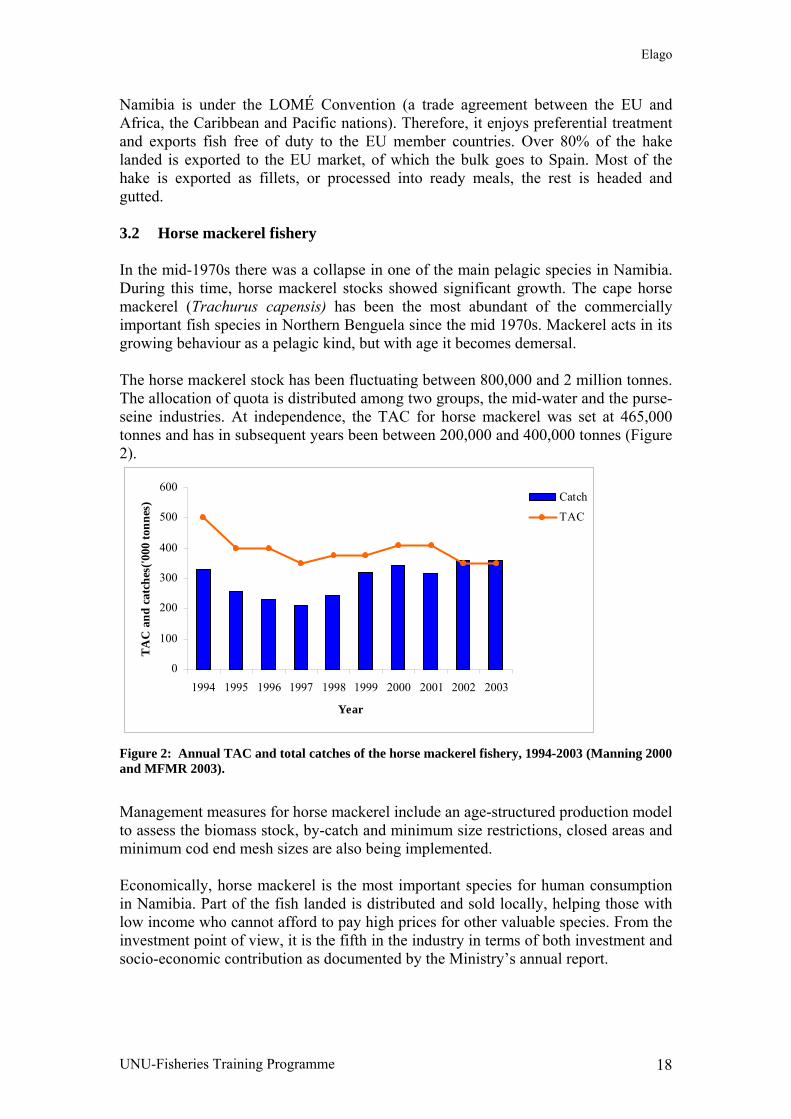
Namibia is under the LOMÉ Convention (a trade agreement between the EU and Africa, the Caribbean and Pacific nations). Therefore, it enjoys preferential treatment and exports fish free of duty to the EU member countries. Over 80% of the hake landed is exported to the EU market, of which the bulk goes to Spain. Most of the hake is exported as fillets, or processed into ready meals, the rest is headed and gutted. 3.2 Horse mackerel fishery In the mid-1970s there was a collapse in one of the main pelagic species in Namibia. During this time, horse mackerel stocks showed significant growth. The cape horse mackerel (Trachurus capensis) has been the most abundant of the commercially important fish species in Northern Benguela since the mid 1970s. Mackerel acts in its growing behaviour as a pelagic kind, but with age it becomes demersal. The horse mackerel stock has been fluctuating between 800,000 and 2 million tonnes. The allocation of quota is distributed among two groups, the mid-water and the purse-seine industries. At independence, the TAC for horse mackerel was set at 465,000 tonnes and has in subsequent years been between 200,000 and 400,000 tonnes (Figure 2).
0
100
200
300
400
500
600
1994 1995 1996 1997 1998 1999 2000 2001 2002 2003
Year
TA
C a
nd c
atch
es('0
00 to
nnes
) Catch
TAC
Figure 2: Annual TAC and total catches of the horse mackerel fishery, 1994-2003 (Manning 2000 and MFMR 2003).
Management measures for horse mackerel include an age-structured production model to assess the biomass stock, by-catch and minimum size restrictions, closed areas and minimum cod end mesh sizes are also being implemented. Economically, horse mackerel is the most important species for human consumption in Namibia. Part of the fish landed is distributed and sold locally, helping those with low income who cannot afford to pay high prices for other valuable species. From the investment point of view, it is the fifth in the industry in terms of both investment and socio-economic contribution as documented by the Ministry’s annual report.
UNU-Fisheries Training Programme 18

Elago
3.3 Small pelagic (sardine/pilchard) fishery The small pelagic fishery, well known as the “pilchard” (sardine) is a pelagic schooling species that is caught mainly by purse seiners. This fishery has been one of the most important commercial fisheries in Namibia, together with hake and horse mackerel. For Namibia, the pilchard fishery has been developing into a large-scale fishery for many years. “The Namibian sardine was an unexploited stock until 1947 when the Walvis Bay Canning Company (Ovenstone family from Cape Town, South Africa) started experimenting with Namibian pilchard” (Jurgen 1998, Sumaila and Steinshamn 2004). Pilchard was first developed in the canning industry for fishmeal and fish oil. Within six years, five other companies joined the exploitation of this fishery and the total catch of 1,000 tonnes in 1948 suddenly reached 262,000 tonnes in 1953 (Jurgen 1998). The policy of regulation of both the landing quotas and the processing capacity was abandoned. This is one fishery with a long history in global development. The stock is regarded to be the same as the sardine stock that collapsed off Californian fishing grounds, causing great tension in the sardine fishing network. It has made the scientists and managers in the sector more cautious. In 1968 the total landings for sardine were recorded to reach 1.4 million tonnes, dropping steadily to a modest 100,000 tonnes in the following decade. As can clearly be observed in Figure 3, the pilchard stock needs serious management to survive. The Namibian government has yet to revise its stock assessment on pilchard.
0
20
40
60
80
100
120
140
1994 1995 1996 1997 1998 1999 2000 2001 2002 2003
Year
TA
C a
nd c
atch
es ('
000
tonn
es) Catch
TAC
Figure 3: Annual TAC and total catches of the pilchard fishery, 1994-2003 (Manning 2000 and MFMR 2003).
When the new government started to manage the pilchard stock, after it had collapsed in the1970s, the stock was observed to be below the critical minimum spawning biomass. This became clear only later. While the stock size was below 100,000 tonnes in the 1980s it showed some recovery in the early 1990s. Fluctuations of the stock biomass started to make officials wonder and in 2002, after an erratic fluctuation in the total biomass of the stock, the Minister for Fisheries announced a TAC of zero for the first time. In Figure 3, the landings in 2002 were by-catch landings mostly by the horse mackerel fleets. Could this be another lesson similar to the collapse of the Californian sardine? Will the Namibian sardine ever fully recover? The industry was somewhat relieved with the announcement of a TAC of 20,000 tonnes in 2003. Still
UNU-Fisheries Training Programme 19

Elago
there is much need for research on this stock that seems to be fragile enough to collapse if not managed well. It is worth nothing that the pilchard stock is not only harvested by Namibian licensed vessels, but is shared with Angolans in their waters (the neighbouring country to the north of Namibia). This sharing is not well managed for the reason that the manner in which the Angolans manage their fisheries is different from fisheries management of Namibia. The setting and monitoring of TAC is by far the most important pilchard management measure in Namibia. Closed seasons and by-catch restrictions are implemented as additional management measures to control pilchard directed catches by the purse seine fleet. This is one industry which has left many seasonal workers in the canning industry jobless, which has had a devastating effect on the industry. Most of the canning factories were virtually idle, when the total catch was only 1,700 tonnes landed in 1996. Factory managers have pooled their resources and only one cannery has been opening each year since then. 3.4 Orange roughy fishery Orange roughy (Hoplostetus atlanticus) is a deep water species. Because it lives in such great depths (ranging from 500 meters to more than 1200 meters), relatively little is known about it. Stock assessment and management of this fishery remains exceedingly difficult in the Namibian fishing area. The fishery started off as an exploratory fishery in the mid- 1990s. By the end of 1995, catches were around 6,300 tonnes (MFMR 2004). It was only after 1997 that orange roughy became a quota managed fishery, through quota management areas (QMA). The first TAC allocation was set at 12,000 tonnes. At the time of the first application of rights to harvest the stock, the Ministry received 39 applications and only five were granted for orange roughy. Before then, the orange roughy fishery consisted of a single company. From the five companies granted harvesting rights, only three of them were granted a quota. Management of orange roughy is arranged in the manner of allowing rights holders to fish the allocated quota in quota management areas. Worldwide, orange roughy is ranked third amongst the top five selling seafood products after shrimp and salmon (Anon 1998). With the low TAC allocation, the industry is relatively small. Indeed a recent paper that was written by Boyer and Oelofsen (2004) concluded that there is room and a need for greater involvement of both sectors (state and private sector) in the management process for the development of this fishery. They have tried to write a case study of whether co-management could work for this fishery. Perhaps this could lead to a better outcome for the fishery and lessen conflict that has arisen between the industry and the state scientists. After all, all parties want to see the stock develop, for many to have a clear understanding of the biological concepts, research methods and management strategies. In this way, export income can increase.
UNU-Fisheries Training Programme 20
Elago
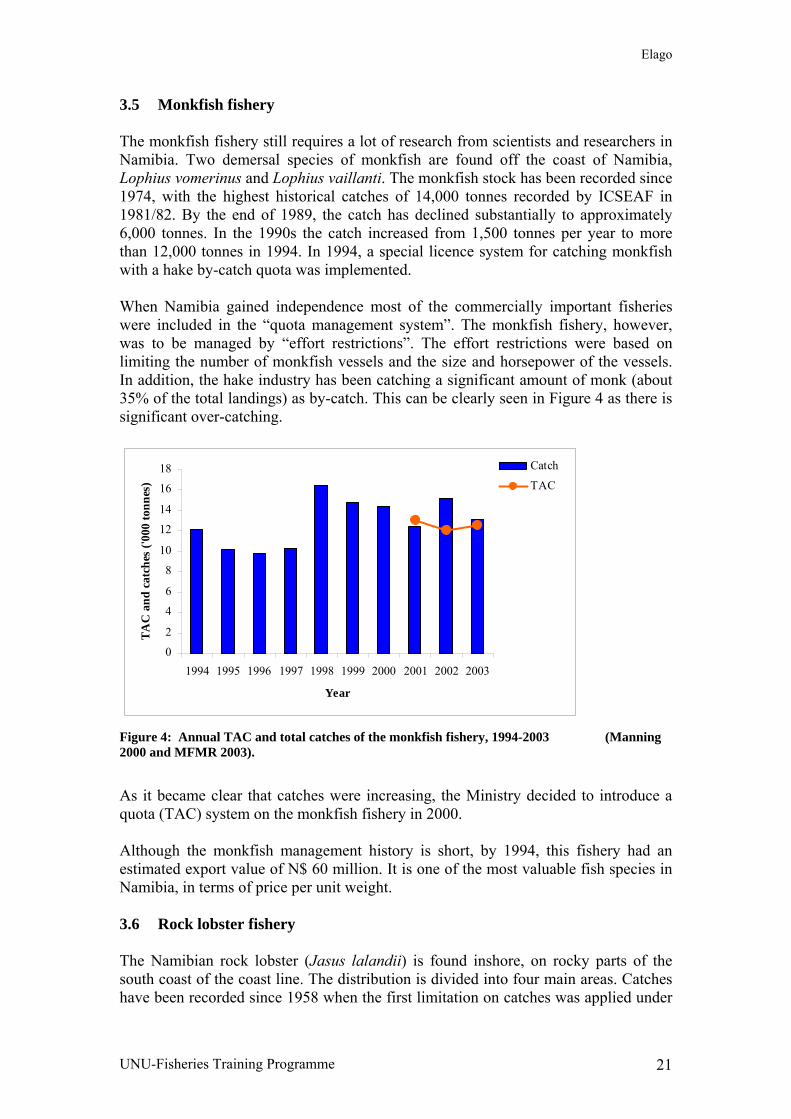
3.5 Monkfish fishery The monkfish fishery still requires a lot of research from scientists and researchers in Namibia. Two demersal species of monkfish are found off the coast of Namibia, Lophius vomerinus and Lophius vaillanti. The monkfish stock has been recorded since 1974, with the highest historical catches of 14,000 tonnes recorded by ICSEAF in 1981/82. By the end of 1989, the catch has declined substantially to approximately 6,000 tonnes. In the 1990s the catch increased from 1,500 tonnes per year to more than 12,000 tonnes in 1994. In 1994, a special licence system for catching monkfish with a hake by-catch quota was implemented. When Namibia gained independence most of the commercially important fisheries were included in the “quota management system”. The monkfish fishery, however, was to be managed by “effort restrictions”. The effort restrictions were based on limiting the number of monkfish vessels and the size and horsepower of the vessels. In addition, the hake industry has been catching a significant amount of monk (about 35% of the total landings) as by-catch. This can be clearly seen in Figure 4 as there is significant over-catching.
0
2
4
6
8
10
12
14
16
18
1994 1995 1996 1997 1998 1999 2000 2001 2002 2003
Year
TA
C a
nd c
atch
es ('
000
tonn
es)
Catch
TAC
Figure 4: Annual TAC and total catches of the monkfish fishery, 1994-2003 (Manning 2000 and MFMR 2003).
As it became clear that catches were increasing, the Ministry decided to introduce a quota (TAC) system on the monkfish fishery in 2000. Although the monkfish management history is short, by 1994, this fishery had an estimated export value of N$ 60 million. It is one of the most valuable fish species in Namibia, in terms of price per unit weight. 3.6 Rock lobster fishery The Namibian rock lobster (Jasus lalandii) is found inshore, on rocky parts of the south coast of the coast line. The distribution is divided into four main areas. Catches have been recorded since 1958 when the first limitation on catches was applied under
UNU-Fisheries Training Programme 21

Elago
ICSEAF management. A TAC was set of only 100 tonnes in 1992 (after independence) and since then catches and TAC have increased (Figure 5).
0
0,05
0,1
0,15
0,2
0,25
0,3
0,35
0,4
0,45
1994 1995 1996 1997 1998 1999 2000 2001 2002 2003
Year
TA
C a
nd c
atch
es ('
000
tonn
es)
catch
TAC
Figure 5: Annual TAC and total catches of the rock lobster fishery, 1994-2003 (Manning 2000 and MFMR 2003).
The stock was over-exploited in the late 1960s with a further decline in the mid 1970s alleged to be a result of adverse environmental conditions (MFMR 2004). After 20 years the rock lobster stock became a quota species with a drastic reduction in TAC levels which was due to a decline in the stock. In the White Paper of 1991 the Ministry aimed for the stock to reach an annual TAC of 500 tonnes over a period of five years and 2000 to 3000 annually in the long term. Considering the stock conditions, this aim was never reached and will not be reached in the next few years. At present, the rock lobster industry is in a dilemma due to environmental conditions, with a TAC of only 400tonnes. Most companies are still unable to catch their total allocated quota and it has become very difficult to get to the points were the lobsters are resting. It can be seen from Figure 5 that landings over recent years have been below the allocated quota. Apart from the TAC allocations, other management measures include effort restrictions, closed areas and closed seasons. The rock lobster industry has the lowest indicative investment and socio-economic contribution in the fishing industry.
UNU-Fisheries Training Programme 22

Elago
4 THEORETICAL FRAMEWORK OF INVESTMENT This chapter provides a brief overview of the theory of investment, as modelled and documented by Clark, Clarke and Munro (Clark et al. 1979 hereafter), as well as Boyce (1993), that deals with the optimal exploitation of renewable resources, specifically the problem of linear and non-linear irreversible investment. A simple model function of investment will be formulated at last. 4.1 Basic investment theory By simple definition, investment is regarded as an act of investing, laying out money or capital in an enterprise with the expectation of profit. Investment is a crucial component for economic development and performance in developing countries. According to Kolstad and Villanger (2004), it is important to emphasise that investment is one important source of economic growth, as shown by both theoretical growth models and empirical testing of the models. The question is whether the economic environment stimulates private investment and growth in a country. The basic investment theory is that, any company investing in a particular industry will remain investing when the expected profits of investing are greater than zero (positive value). In other words, investment is unlikely to happen when it is seen to be unprofitable to invest in the long run. Two effects can be decided upon, the time to invest and the level of investment. This assumption tends to affect decisions that are made by investors in the present situation. For Fuss and Vermeulen (2004) companies that make use of irreversible capital and have some flexibility in the timing of their investment, prefer to adopt a “wait and see” approach and delay investment when uncertainty increases. It is tested and proved that companies revise their investment decisions when they acquire new information (Fuss and Vermeulen 2004). In the case of the fishing industry, uncertainty always arises either due to many factors such as natural fluctuations, lack of knowledge of the fish biology, market price fluctuations (international market prices in the case of Namibia which is too dependent on export trade), changes in exchange rates and tight market competition. Fuss and Vermeulen (2004) state that companies revise their investment plans very little, and indeed they do not revise at all as a result of reduced uncertainty. However, they may do so in response to new information on sales growth. When referring to investment, it is important that there is a different interpretation from both the foreign direct investment and gross domestic investment in the particular sector. The latter may also define whether the study is looking at an industry which is competitive (increases in prices and demand would raise the level of investment). Higher uncertainty commonly leads to lower investment. 4.2 Neo-classical model of investment The neoclassical model of investment is well known. One of the early neoclassical models is the theory of investment and uncertainty. It is still debated whether uncertainty has a positive or negative impact on investment. Later work by a number of authors, suggests that uncertainty has a significant negative effect on investment. This is opposite to the conclusion of the neoclassical model, which states that uncertainty has a positive effect on investment. Considering the theoretical effects of
UNU-Fisheries Training Programme 23

Elago
uncertainty on investment in a perfect competition state increases in uncertainty raise the marginal unit of capital and hence the incentive to invest. In the neoclassical approach, emphasis is placed on the relative price of capital and labour as a determining variable. Having said that, capital stock is determined by the user cost of capital. Mathematically, this can be expressed as:
k
YKC σ
α∗ = (E.1)
where K* is the desired capital stock, α is a constant , Y is the level of output, Ck is the user cost of capital and σ is the elasticity of substituting investment for capital stock (Byrne and Davis 2003). By substituting investment for capital stock, the following long-run relationship is obtained: 0 1 2ln( ) ln( ) ln( )t t tI Y Cθ θ θ= + + (E.2) The basic approach to model investment is presented in equation (E.2). According to this equation the long run determination of investment is based on a simple accelerator model and presumes that the costs of adjustment apply to this long run equilibrium (Byrne and Davis 2003). Parameters I represent investment, Y is an output function and C is the cost. The neoclassical theory stems from the argument that capital can be related to investment. However, it should not be considered a straight direct variable that relates to investment demand. The reason behind this is that there are difficulties in most cases in obtaining a proper cost of capital variable. As noted in the Frain et al. (1996) paper, results of estimating some of the neoclassical models are considered to be of concern because strong price effects are not typically found to test the model. Secondly, variables such as interest rate and cost are also examined in literature but found to be of no significance to the model. Assuming a case of exchange rate, since this particular variable matters in the Namibian fishing industry as companies are highly dependent on export markets. In the long run, investment can be negatively affected by exchange rate uncertainty. It has been found that “real exchange rate uncertainty has a highly significant impact on investment using evidence from developing countries” (Byrne and Davis 2003). Higher openness and weaker financial systems are associated with more significantly negative uncertainty. Many of these variables such as exchange rate, inflation rate, price, output growth, are all “macroeconomic variables”. However, not all of these variables will be dealt with in depth here. Uncertainty also depends on whether the effects are measured in the long term or in the short term. An alternative means of expressing the neoclassical model of investment and its behaviour is “Tobin’s Q”, which links investment to the stock market. This relation is strongly supported by many authors. The idea behind Tobin’s Q theory is that stock prices reflect the incentives to invest and the q equation reflects the current and
UNU-Fisheries Training Programme 24
Elago
expected future profitability. The “q” equals the market value of installed capital over the replacement cost of installed capital. If q > 1, it means that capital is valued more than its cost, and therefore there is reason to invest. The Tobin’s Q model argues that investment should be increasing in a ratio of the equity value of the firm to the replacement cost of capital stock. It is worth pointing out some of the problems associated with the neoclassical model when referring to fixed investments. The first is that it does not incorporate the notion of financing constraints, but rather assumes that firms are free to borrow as much as they please. If they are unable to borrow over a certain amount, this can restrict the amount of investment, making it more sensitive to economic fluctuations. An example of this in the fishing industry can be where there are financial constraints and low market prices that may necessitate retrenching workers, due to lower profits etc. If firms think that the low market prices are short-lived, they will borrow to continue their investment. Still, financing constraints limit their ability to do this and make the rate of investment much more volatile. A second issue not dealt with by the neoclassical model is the notion of adjustment costs. The implementation of a sudden increase in capital goods will usually incur certain costs, such as the re-training of staff, installation of machinery and so forth. S, Nickell 1978. States that “costs rise at an increasing rate as investment or disinvestment increases”10.should be an in text citation Because of these parabolic adjustment costs, it is more profitable to invest gradually than all at once. 4.3 Irreversible investment theory model “Irreversibility11 in the investment decision is introduced by the harvest capital constraint when the physical capital stock does not increase or decrease without cost” (Boyce 1993). The investment theory deals with the problem of capital and the implications thereof. Clark et al. (1979) study the effects of “non-malleability” capital investment upon optimal exploitation of the renewable resources in a linear form using a consistent optimisation-based approach over a period of time. Boyce’s (1993) theory, which seems to have something in common with Clark et al. (1979), studies the concept of a non-linear two-controlled variable12 model of a fishery with irreversible investment and harvest capacity constraints. In general, both authors study a broader picture of how an industry such as that of renewable resources can achieve optimal capital accumulation paths in a fishery that is characterised by a period in which the physical capital stock level exceeds its long-run sustainable equilibrium. Whereas Clark et al. (1979) predict that the rate of capital accumulation is due to the assumption of linearity in the investment cost and variable profit functions, Boyce (1993) attempts to use a non-linear characterisation of the entire optimal path from arbitrary beginning to the steady state. Assumptions thus differ in the linear and non-linear form of investment costs and variable harvest profits.
10 Nickell, S 1978. – The Investment Decisions of Firms – p26 11 Irreversibility refers to the situation when capital either cannot be resold or can only be resold at a lower price than the purchase price. This is a sign that investment may turn negative. 12 The two controlled variables are the irreversible investment (where physical capital stock is increased or decreased) and the harvest capacity constraints (the contraints as created by the capital stock).
UNU-Fisheries Training Programme 25

Elago
Clark et al. (1979) introduced an assumption of non-malleability13 of capital where physical capital stock is expected to decline over time due to depreciation and the biological or resource stock will decline over time due to the fact that the harvest rate exceeds biological growth14. Clark et al. (1979) further assume that “the marginal cost of investment is independent of the rate of investment and that the marginal harvest profits are independent of the harvest rate”15. Clark et al. (1979) proved from a model study that it is optimal to make an immediate “one-time investment” in the physical capital stock, followed by a period in which gross investment is turned off but existing physical capital stock remains fully utilised. It will not be expected in an industry where there is an output control such as a quota and an expiring right to have the same effect as that of the Clark et al. (1979) assumption. The reason is that it is likely that the investment behaviour of those with short term rights differs from the behaviour of those granted long term rights. According to McKelvey (Boyce 1993), assumptions such as those made in the Clark et al. (1979) study can only hold for an open access fishery or for a fishery with imperfect competition but not necessarily for a controlled managed fishery system like that of Namibia. When times are hard to maintain in the industry, especially with the effect of market prices and depreciation of the US dollar, controlled fishing companies are likely to run into financial problems which has strong effects on the harvesting of the stock, and in most cases, factories are likely to close down their operations in such circumstances. According to Ranganatham and Madhumathi (1996), when the market gives high prices in return (in this case by exporting fish to other markets), companies are viewed to be good. On the other hand, when there is a decreasing trend in market prices, companies that decide to investment further would not be viewed favourably by the investing public. The model from Clark et al. (1979) can be expressed in simple mathematical form as:
(E.3) {0
( ) ( ) ( )tJ e ph t cE t I t dtδ π∞
−= − −∫ }
where J is the resource rent, δ is the instantaneous rate of discount (constant); p is the price of landed fish (constant); c is the operating cost per unit effort (constant); E(t) is the effort capacity in the fishery, which can be measured by the amount of capital invested in the fishery at the time; π is the price (purchase or replacement) of capital (constant); and I(t) is the gross investment rate at time t. In the case of , the assumption allows for an instantaneous increase in the level of capital.
( )I t = +∞
13 Non-malleability refers to the property of something that is not influenced by anything else. While most literature agrees that capital stocks are perfectly malleable, in the case of Clark et al. (1979), capital doesnot have an influence on investment and other variables, especially in the long-run. Starting up capital can be imporant but after some time investment decisions are not made from capital input. 14 The rate of harvest is limited by the available physical capital stock, whereas for this study the rate of harvest will be limited by the qouta allocated to individual rightholders. We will not expect the biological stock to decline over time because the rate of harvest in the Namibian case is controlled by the TAC and it is assumed that the companies will harvest only what they are allocated, maintaining the biomass stock at its optimal level. 15 Such assumptions may not hold for fishing industries where input demand affects costs of input because large increases in the capital stock are assummed to be proportionally no more costly than small increases.
UNU-Fisheries Training Programme 26

Elago
From equation (E.3), Clark et al. (1979) try to maximise their objective of optimal capital accumulation by adjusting the optimal effort E(t) and investment I(t) policies accordingly. They assume that profits are given by Ph – wE, where P is the output price and w is the marginal cost of effort E. From equation (E.3), when disinvestment is unconstrained and gross investment is unrestricted, the following formula can be used:
(E.4) {0
( ) ( ) ( ( ))tJ e ph t cE t I t dδ φ∞
−= − −∫ } t
where 0( )0s
I II ifI I
πφπ⎧ ⎫ >
= ⎨ ⎬ <⎩ ⎭
π is the real capital and πs is the scrap capital. Clark et al. (1979) also looked into the case when capital is perfectly malleable. In this case, we assume that capital can easily be influenced by other factors for the optimality of the policy objective. Clark et al. (1979) state that when such an assumption is made, there will never be excess harvesting capacity since capital stock will always equal effort. Therefore, investment can be eliminated from the model. This can be expressed in the following manner:
( ){ 0
0
tJ e ph cE K dt Kδ }π δ γ π∞
−= − − + +∫ (E.5)
where I(t) from equation (E.4) equals K K E Eγ γ• •
+ = + ; the term c denotes unit operating cost, while (δ+γ) from equation (E.5) is viewed as the unit “rental” cost of capital. The maximisation problem for equation (E.5) is subject to the condition that the growth of the stock equals the growth of the biomass minus the catch. This is determined by the following “modified golden rule”:
δ=−
′−′
*)(*)(*)(
*)(xcpxFxc
xFtotal
total (E.6)
where qx
cxc total
total =)( denotes the unit harvesting costs and q is the catch ability
constant. The left side of equation (E.6) represents the rate of interest of the resource biomass x* and the second term is the so-called marginal stock effect. The right side is the interest rate. In the case where disinvestment is unconstrained, capital is defined as a “scrap value” where unwanted capital can be sold only as scrap. Scrap is defined as the value of
UNU-Fisheries Training Programme 27

Elago
capital, which is greater than zero (0), but smaller than the profits from the investment. This is under the assumption that at any time decisions can be taken by investors whether to invest, disinvest or do neither. When the assumption is made that investment will occur where there are controlled vessels and a controlled harvesting level, disinvestment happens when the above is in reverse, whereby disinvestment turns out to be a once-and-for-all decision. Clark et al. (1979) have concluded from their theory model study that:
In a long run period, unless capital is perfectly non-malleable, the fishery reaches an equilibrium state corresponding to optimum sustainable yields, for which the relevant cost function incorporates the full cost of fishing, i.e. operating plus capital costs (Clark et al. 1979:46)
Price of capital is not expected to have an effect on the short term run of a fishery. On the other hand, it has a positive effect on the resource biomass (x*). In the short term licence, the operator might behave the same way as if he were operating under an open access system with regard to investment. In an open access fishery, capital will be free (as defined by the Clark et al. (1979) model) in the sense that 0== sππ 16. In reverse, Boyce’s (1993) theory relaxes the assumptions made by Clark et al. (1979) on the investment cost function and the variables that define the harvest profit function. Boyce assumes that the biological capital stock does not affect the harvest capacity, while in Clark et al. (1979) capital stock has an effect on the harvest capacity. He compares his study to that of Clark et al. (1979), by arguing that the optimal way for the physical capital stock was not necessarily optimal with a one-time investment only, but that a period during which the capital stock level is above its long run sustainable equilibrium is the best optimal level. In developing countries (including Namibia), such industries are considered to have a period of positive but declining gross investment in capital accumulation, which can still be recognised as being optimal. According to Boyce’s theory, the optimal capital accumulation paths problem is based on the following theorems:
a) In the final approach to the steady state equilibrium, if ( ) rx t x< then and if
( ) rk t k<( ) rx t x> , then . Where, x (t) is the biomass stock and is the
capital stock. ( ) rk t k> ( )k t
b) Once the investment rate becomes positive, it will never go back to zero. Therefore, if investment costs are convex, it will never be optimal to turn investment off once it has begun.
16 π In this case is defined as price (purchase or replacement) of capital (constant) and sπ is unit scrap
value of capital (constant). When capital is free, the optimal biomass level becomes xx ~= , where x~ is
determined from the equation: δ=−
′−′
)~()~()~()~(
xcpxFxcxF where .)~(
qxcxc = The operating costs in
this regard alone are relevant to the determination of x~ . Assuming that x* is equation (E.6) and x~ in the case of open access is determined by equation (E.6) and the open access equation is defined as x~ < . ∗x
UNU-Fisheries Training Programme 28

Elago
c) If the physical capital stock is insufficient to bring the biological capital stock to the steady-state equilibrium, then once investment begins the investment rate will be positive, finite and decreasing. In this case, net investment may be negative to gross investment.
Comparing the Clark et al. model to the Boyce model, the following explanation can be made: d) When the model is linear in investment costs, if , then where
is a harvest along the optimal path, k is capital and I is investment. This is a difference between the linear investment cost and the non-linear investment cost model. In the non-linear form of the Boyce model it may be optimal to invest in physical capital even though the capital is not currently being used. By linear form (as in the case of the Clark et al. model) the cost of investment is independent of the rate of investment.
( )h f k∗ < 0I ∗ =h∗
e) If investment costs are linear, such as in the Clark et al. case, then, when χ ≥ χr where χ refers to the biomass stock and an instantaneous jump in the physical capital stock, if it occurs, will occur at time t = 0.
0h∗ >
f) When the model is linear (Clark et al. case) in the harvest rate but non-linear (Boyce case) in the investment rate, with a singular harvest variable, then the biological capital stock is at the steady state equilibrium level.
g) When the harvest profit function is linear in the harvest rate, a non-linear investment cost function causes the physical capital stock to be built up with the gross investment rate remaining positive once investment starts, and with net investment declining along the optimal path.
Boyce (1993) describes the problem of optimisation in choosing the investment and harvest rates to maximise V by the following formula:
[0
( ) ( )r tV u h c Ie∞
−= −∫ ]d t (E.7)
where V represents profits as a function of the investment (I) and the harvest rate (h), u(h) is simply the harvest profits and c(I) is the investment cost per unit time. Both investment (cost function assumed to be increasing and strictly convex) and harvest (profits functions assumed to be strictly increasing and concave) can vary over time. From equation (E.7), in the case of the Clark et al model, they have restricted u(h) = h and c(I) = cI to be linear. However, in this study, assuming that equation (E.7) is reversed, then by theory it can be concluded that investment costs can be a function of harvest rate and variable profits. Considering the different effects of restricting assumptions as observed from Clark et al. (1979) and Boyce (1993), by both the linear and non-linear models, there is a markedly different conclusion about the shape of the capital accumulation paths from the model and by theory. As mentioned earlier in this section, in the linear form the biological stock is in excess of the steady state equilibrium, followed by a period of zero gross investment in the fleet that results in a decrease in the physical capital stock due to depreciation. In contrast to the non-linear model, it is never optimal to stop
UNU-Fisheries Training Programme 29

Elago
gross investment once it has begun. Such effects are purely based on the variable harvest profits and investment cost function as defined in the Clark et al. (1979) case. 4.4 Formulation of the model (specification of the investment function) It is worth mentioning that there seem to be no papers published that study the relationship between different terms of fishing rights and investment behaviour. Most papers study uncertainties in investment and investment from the financial point of view (see section 4.2). The authors who have written about investment decisions disagree whether the output control measures affect investment positively or negatively. From the empirical literature presented above, it is evident that output uncertainty negatively affects investment. However, there are a number of issues that arise in the literature concerning the measure of volatility. A measure based on volatility includes variables such as exchange rates, long term interest rates, inflation rates, share prices and industrial production. In Byrne and Davis (2003), empirical work on measuring the above concluded that only two variables, exchange rate and, to a lesser extent long rates, have a significant effect on investment in the major industrial countries. It is important to note that it is not easy to identify the effects of volatility of the exchange rate on growth of profits, since the effects of positive exchange rates is different from negative exchange rates. On the contrary, there is literature on the theory of irreversible capital investment, such as Clark et al. (1979), which concludes that investment may not necessarily be a function of the capital and therefore will not have any effects on the type of investment decisions the company makes. However, in the Namibian fisheries there is a controlled output, which is part of the Namibian government policy (i.e. a quota and term of fishing rights). At what level does both quota and length of rights affect the decision of investment? This study aims to identify some empirical answers to this question. Similarly, testing the results will magnify the degree of investment conditions, as defined by the government policy, on the conditions companies need to fulfil to be granted long term and/or short term rights. Taking another angle of the concept of investment as a variable tool for economic performance, in Hersoug (2002) economic performance is measured according to a number of indicators such as quota aggregation and quota prices, total revenue, export earnings, value of landings (ex vessels), profitability of sector, investment in harvesting and processing as well as international competitiveness. Though some of these indicators can be independent variables to the investment function, only a few of them are covered by a time-series, making it difficult to include them in the data sets and in the model variable specification. 4.4.1 Investment functions methodology Apart from the assumptions made by Clark et al. (1979) and Boyce (1993), there are other ways in which assumptions of the model might be over-restrictive. Some of the assumptions relate to other interpretations of its parameters, which define other meanings that are not necessarily relevant to this particular study. Investment has been the subject of a number of econometric studies. Most of the studies focus on a limited number of variables that vary greatly in their specification, methodology and data sample (Kolstad and Villanger 2004). This brings about the question of identifying
UNU-Fisheries Training Programme 30

Elago
appropriate parameters that influence investment decision makers. One factor that determines whether and how companies choose to invest depends on new capital goods. “Firms willingness to acquire new factories and machines depends on the expected cost of using them and the expected benefits, referring to the value of the marginal product that they will provide” (Frank and Bernanke 2004). The hypothesis of this paper assumes that the duration of fishing rights has an effect on investment. In other words, the longer the right, the greater the expected investment. Clark et al. (1979) consider an optimal-based approach in their study, by capital accumulation in the entire renewable resource stock and how policies as set by the government may depend significantly upon assumptions made. Present consideration is, however, based on the model variables that have an effect on behaviour between those with short term and long term harvesting rights. Let us estimate the model for the study, estimating equations that may then be used for testing hypotheses or forecasting the values of the dependent variable, given the values of the independent variables. The estimated model will not only give results as such, but will be guided by economic theory and past literature. Having said this, let us take the simple neoclassical model presented in equation (E.2) in its logarithm terms, as an approach to the model investment function. The only difference is that the neoclassical model refers to major industrial markets but this case takes into account the specifics of the fisheries industry. Let (It) continue to be investment in the fishing industry, that depends on an output, substituting Y from equation (E.2) for quota size allocated, q, and in addition, adding another output, INC, the fishing income, plus rr, the interest rate and cost is substituted by the variable d representing the duration of the fishing rights allocated to an individual rights holder (differentiated between short term and long term rights). In log-linear regression mathematical form, this can be interpreted as:
)()log()log()log()log( 43210 drrINCqIt θθθθθ ++++= (E.8) Investment herein is the total investment17 of the fishing companies. The d is included as a dummy variable for length categories, since length plays a major role in line with the quota allocation and harvesting. Investment will depend on the quota output of the fishery, the income from harvesting that quota, interest rates paid by the company, plus the time period the company is allowed to harvest and make income with profit and therefore have the incentive to invest further in the industry. Some companies may be buying starting capital to rent it out to other smaller companies. The firm is either borrowing money to pay for capital (thus paying interest on the loan) or it is using money that would otherwise have been earning interest. This makes interest rates critical to the level of investment, though it is not the sole explanation. By standard economic theory, quota has a positive effect on the decision of investing. According to Clark et al. (1979), capital investment over a period of time converts into a scrap value. One may then expect to have two kinds of results: in the first place 17 This is total investment that the individual companies have been making since they started fishing operations. It is very important to note that investment here is referred to as a proxy rather than a measure per say. Reasons being that it is not taken into account when the investment was made. What is important is that investment data includes accumulated investment since 1994 until 2003 as part of the sample for this study.
UNU-Fisheries Training Programme 31
Elago
companies with negative investment and in the second place companies not were investing at all, even though they are still making profits from harvesting the available quota. At a later stage of the study, one will notice why some other important variables are not included in the original specification as presented above. In most cases, it is due to their insignificance or not enough data sets included in the model.
4.4.2 Measuring differences in the length of fishing rights Total investment is explained as a function of the independent variables on the right hand side of equation (E.8). The difference between the short term and the long term can be explained by converting equation (E.8) back into exponential form. By doing so, the length of the rights is combined by defining a dummy variable that has a value of 0 for long term rights and 1 for short term rights. This will result in the following mathematical interpretation: Short term test:
[ dt errINCqeI *43210 *)(*)(*)(* θθθθθ= ] (E.9)
[ ] 4* θeAI t = Long term test:
[ ] dt errINCqeI *43210 *)(*)(*)(* θθθθθ=
(E.10)
[ ] 0* eAI t = The difference between the sub-equations in (E.9 + E.10) is given by the exponential 1 and 0 respectively. When d=1 the length function becomes that for short term rights. When d=0 the length function becomes that for long term rights. The dummy variable is treated just like any other explanatory variable in this model specification.
UNU-Fisheries Training Programme 32

Elago
5 THE DATA SET Two year period data information is combined to construct the data set. All the data presented are kept in the Namibian head office of the Ministry of Fisheries. Monetary data are taken from the Annual Income and Expenditure Survey (hereafter AIES). The survey is undertaken yearly by the Economics division of the Ministry of Fisheries and Marine Resources. The years covered are 2002 and 2003. The AIES survey is a standard questionnaire containing quantitative information on realised investment. The fishing companies are required to submit annually full details as set-up in the AIES questionnaire. Some companies do not respond at all for the submission of the survey report. It was only in 2002 that a standard questionnaire was put in place. Before that, information gathered was not differentiated between fishing and fish processing. The data consists of individual company data satisfying the following criteria: (1) Detailed individual fishing company income, expenditure, profits and/or losses. (2) Total fixed assets and capital on purchase of fixed assets. (3) Investment calculated from yearly major repairs/extensions/refurbishments. (4) Sales or losses of fixed assets, depreciation rates of assets. (5) Fixed assets on land, processing plants, buildings, machinery and equipment. (6) Total capital stock (liabilities). (7) Total assets, both the current and fixed assets for the years reported. (8) Yearly investment and accumulated investment since company started operating in the fishing industry. In addition to the data sources, information on the companies’ socio-economic (social) contributions (extracted from the annual quota motivations application for all rights by companies); quota size (as allocated by the Ministry of Fisheries); rate of interest (extracted from the Central Bank of Namibia) and the stock biomass for the different fisheries (extracted from the Ministry’s annual reports) are filtered to be part of the data sets. A sample of observation was selected from all Namibian fisheries. The selection of the sample was based on the fisheries which are the most economically important. The numbers of observations are fewer than the total existing rights. This is due to various factors. In the first place, there are companies that are not part of the Ministry’s survey area. Secondly, some smaller or new companies do not have financial statements, since they will be included as part of the larger companies’ statements that do their fishing operations including financial status etc. Lastly, the companies that do not respond in full to the survey have an influence on the total number of responses. It is worth noting at this stage that some of the Namibian fishing companies have fishing rights for more than one species, the investment data includes the total capital of the company not by separate fisheries but as one company.18 It is trusted that the dataset chosen for the study represents the true situation in the Namibian fisheries. The other important scenario in this study is that since it only covers the financial fishing operation until 2003, only three companies have started to
18 As an example, a company called Diaz Fishing has rights to harvest both hake and horse mackerel. The income and expenditure will differ between the two fisheries but the overall total is taken in one.
UNU-Fisheries Training Programme 33

Elago
operate in the 15 year rights term. More companies have now been granted 15 year rights, however the commencing date was not until 1 January 2004(falling outside the study period). For the sake of simplicity, the following two terms: “short-term rights” and “long-term rights” will be used. The short-term rights will refer to four and seven year terms, while the long term rights will refer to 10 and 15 year rights. The observations are tested in EVIEW econometric software under the hypothesis that companies with long term rights are expected to have done relatively well in terms of investment compared to companies with short term rights. A wide range of forecasts is also tested on the variables that have the most influence on investment. Before presenting the total sample data, the following section reviews the numbers of observations from the six fishery stocks. The background was described in length in chapter three. 5.1 Evaluation of the fisheries Hake: The number of observations for 2002 is 29 out of 30 companies19 (10 short-term rights and 19 long-term rights). The 30 companies represent more than 80% of the 38 current hake rights holders. For 2003, the number of observations is 38 (16 short-term rights and 22 long-term rights). The total number of observations from the hake industry is 67. Horse mackerel: There were eight observations for horse mackerel in 2002 (two short-term rights and six long-term rights) and in 2003 there were 10 (five short-term rights and five long-term rights). The current number of rights for this fishery is 12. The total number of observations from the horse mackerel fishery for both years is 18. Pilchard (sardine): Pilchard data is collected from the AIES data survey of 2003 only. Sixteen observations out of 22 total rights holders are sampled for the pilchard fishery. No financial report was presented in 2002 because it was the year where a zero TAC was announced. Orange roughy: Two data extractions were made for orange roughy in 2002 (both were short-term rights) and in 2003 there were three (all three were short-term rights). This fishery has the lowest number of licences in Namibia, having only five fishing rights and, as mentioned in Chapter 3, only three of the five are in operation. The sample has data from all the three companies.
19 Two of the hake companies’ data were collected in one form, taken as one operating company, i.e. the total number of observations is less one to total 29 observations for 2002 (this is the same for 2003).
UNU-Fisheries Training Programme 34

Elago
Monk: Monk data is from the AIES data collection of 2002 and 2003. The number of observations for 2002 is six (four short-term rights and two long-term rights). In 2003 the sample increased slightly from six to seven observations (four short-term rights and three long-term rights). The existing number of rights in the monk fishery is nine. The total number of observations is 13, representing over 70% of the fishery. Rock lobster: Rock lobster data is gathered from the AIES in2002 and 2003. In 2002, 17 companies are represented (six with short-term rights and 11 long-term rights). In 2003, there were only nine observations (four short-term rights and five long-term rights). There are 21 fishing rights for rock lobster. The total number of observations is 26, covering over 50% of the sector. The total number of observations for the study is 136, where 64 observations are extracted from the 2002 data survey and 72 from the 2003 accounts. Out of 159 existing right holders, about 107 are represented in this study sample. 5.2 Sample of acquisitions Table 6 below gives a statistical description of the samples in the model. Table 6: Descriptive statistics.
TOTAL INVESTMENT ( N$20)
QUOTA (metric tonnes)
TOTAL FISHING INCOME (N$)
INTEREST RATE
Mean 42761336 5842.813 28400082 16.06446 Median 16093750 2382.000 8338054. 15.86000 Maximum 4.58E+08 86152.00 4.21E+08 16.35000 Minimum 0.000000 10.00000 140000.0 15.86000 Std. dev. 77972685 11543.94 57359077 0.242497 Skewness 3.791075 4.901141 3.931309 0.335561 Kurtosis 18.69883 32.33111 21.92411 1.112601
Sample observations: 136
20 The values are in millions of Namibian dollars.
UNU-Fisheries Training Programme 35

Elago
6 EMPIRICAL RESULTS Using the background theory from the equations in the last chapter, a non-linear model and its logarithms was carried out, using equations (E.8) to (E.10), with total investment as the dependent variable and other variables as independent variables. The equation framed to test the hypothesis resulted in the outcomes outlined in this section. . The variables introduced in the analysis are: TOT INVEST = total investment (accumulated from 1994-2003) QUOTA = quota allocation for 2002 and 2003 TOT INCOME = total fishing income for 2002 and 2003 INTEREST RATE = prime rate during the years 2002 and 2003 DOR = duration of fishing rights of individual rights holders 6.1 Measuring investment using a log-linear regression form All variables are in logs (Table 7), except for the dummy variable DOR. The model explanation is based on a 5% significance level. Table 7: Investment by log-linear form (Model 1).
Dependent variable: LOG(TOT_INVEST) Number of observations 1-137 LOG(TOT_INVEST)=C(1)+C(2)*LOG(QUOTA)+C(3)*LOG(TOT_INCOME)+ C(4)*LOG(INTEREST_RATE)+C(5)*DOR21 Variables Coefficient Std. error t-Statistic Prob. C(1) constant 6.77 19.57 0.34 0.7301 C(2) quota 0.28 0.05 4.92 0.0000 C(3) income 0.42 0.07 5.67 0.0000 C(4)rate of interest 0.27 7.04 0.03 0.9686 C(5)length of rights 0.63 0.21 2.97 0.0035 R-squared 0.51 Mean dependent var 16.56 Adjusted R-squared 0.49 S.D. dependent var 1.67 S.E. of regression 1.19 Akaike info criterion 3.22 Sum squared resid 179.61 Schwarz criterion 3.33 Log likelihood -206.55 Durbin-Watson stat 1.97
The model has reasonable explanatory power. R-squared is 0.510, indicating that 51% of the variance in total investment is explained by the independent variables in the model. As per the expectations, the parameters are positive for short term and long term rights. The parameters have also turned out to be significant for both short term and long term rights. All parameters are significant with the exception of interest rate. Before further explanation is presented, variables that are insignificant will be eliminated from the model. What is important to notice in the model is that the variable to be suspended should not lead to any significant deterioration in either its summary or its explanatory power. Interest rate is eliminated in this case. Though eliminating interest rate could possibly be a significant policy influence, since the cost of capital is certainly linked to the interest rate, where in general an increase in 21 Eview write an explicit mathematical equation with C (1), C (2) etc. being the parameters.
UNU-Fisheries Training Programme 36

Elago
interest rates means a greater ‘opportunity cost’ and a reduced incentive to invest. In any case, the model has the same explanatory power as the original general equation and acceptable test statistics. Eliminating interest rate, the following results are obtained as presented in Table 8. Table 8: Investment by log-linear form (Model 2).
Dependent variable: LOG(TOT_INVEST) Number of observations 1-137 LOG(TOT_INVEST)=C(1)+C(2)*LOG(QUOTA)+C(3)*LOG(TOT_INCOME)+C(4)*DOR Variables Coefficient Std. Error t-Statistic Prob. C(1) constant 7.54 1.02 7.36 0.0000 C(2) quota 0.28 0.05 4.99 0.0000 C(3) fishing income 0.42 0.07 5.71 0.0000 C(4) short term right 0.63 0.21 3.00 0.0032 R-squared 0.51 Mean dependent var 16.56 Adjusted R-squared 0.49 S.D. dependent var 1.67 S.E. of regression 1.18 Akaike info criterion 3.21 Sum squared resid 179.61 Schwarz criterion 3.30 Log likelihood -206.55 Durbin-Watson stat 1.97
After omitting interest rate, 51% of investment is still explained by the explanatory variables. The quota, income and length of rights, which are considered as fundamental variables, are significant influencers of investing more in the industry. Notice that the constant becomes highly significant in this model, while in model 1 it was insignificant. The quota slope coefficient indicates that investment increases by 0.28% for each 1% increase in quota. This makes sense because part of the variation in quota is due to variance in the investment efficiency. The findings support the theoretical postulation that investment is the engine of the stated variables. According to the Marine Resources Policy (MFMR 2004) and the Policy Statement of 1993, those with higher investment must be recognised. As they invest and empower Namibians through technical skills etc., they are likely to have their quota increased in the years ahead. On the other hand, the fishing income slope coefficient indicated that investment increases by 0.42% for each 1% increase in income. In theory and in practical terms, investment can only be possible if there is extra income to the company where profits are made. Even though a fishing company is allocated a quota, income can decrease in value due to high market prices and high operating costs, which will automatically lead to less or no investment at all. The result analysis between quota and income outputs is that income is a better determinant of investment than quota as the coefficient is greater for fishing income than quota. The constant22 (intercept) is statistically significant. This indicates that if there is almost no output, investment would only be N$1881.00 per year, which is almost zero (in this study case), when productivity increases. The model results indicate that although both the short term and the long term rights increases with investment, investment in the long term rights holders is lower while it is greater for the short term rights holders. The short term rights holders invest almost
22 The constant term captures the mean of the dependent variable and the average effect of the omitted variables.
UNU-Fisheries Training Programme 37

Elago
twice as much as the long term rights holders. This is because the strategic power to invest is lower for long term rights holders. . For further explanations, the results are re-written in a simple non-linear as follows [see equation (E.9) and equation (E.10)]: Short-term rights test:
[ ] 636.0*** 421.0280.0541.7 eINCqeI =∧
The exponential of 0.636 results in the value 1.89. Long-term rights test:
[ ] 0*** 421.0280.0541.7 eINCqeI =∧
The exponential of 0 results in the value 1. Interpreting the two numerical equations above, 1.89 (this result is from calculating the exponential of 0.636 and exponential of 0 respectively) is greater than 1. Hence, short term rights holders invest more than long term rights holders. This does not support the theoretical analysis which suggests that long term rights holders invest more than short term rights holders. If the rule of the Namibian policy is followed from the conditions presented in Table 1 of this paper, it will be easy to conclude that companies were granted long term rights because of the high investments they have made and shown in their initial applications. At the same time, the result of the study does not invalidate the theoretical hypothesis since it depends mainly on the type of investment. When a company is granted longer term rights, having investment in the sector, it is expected that the same company will continue to introduce new strategies that can lead to more investment, considering a highly competitive market such as the Namibian fisheries industry. Clark et al. (1979) have mentioned that at some stage in the cycle of investment, some fishing companies will remain in operation as long as there is profit to keep running the company. Therefore, those with long term rights might have reached their peak stage of investing, even though that is not the best choice when the government wants to see companies that are investing for the development of the sector and the nation. Secondly, once an individual has invested and is granted longer term rights, the motivation to invest decreases, compared to those with short term rights who need to keep investing to fulfil the requirements of the government so that they can be granted long term rights in the future. Profits made by long term rights holders, can be directed towards other areas, which can be recorded as “private investment” and will not be reflected in the data collected. On the other hand, for the Namibian case, it is not expected that more investment is only from the long term rights holders. This is based on the fact that longer term fishing rights are not only given to those with high investment. As noted in Chapter 2 of this paper, long term rights in Namibia are also granted to companies with less or no investment because of the criteria of the
UNU-Fisheries Training Programme 38

Elago
Namibianisation Policy23 for the granting of rights and allocation of quotas in the Namibian fishing sector. This is part of the reason that short term rights holders invest more than the long term rights holders. Despite having the expected positive impact from both groups, the marginal results are minimal, which is unexpected for long term rights holders. As suggested by Byrne and Davis (2003), in most cases researchers omit important variables in the models, which are of theoretical importance. This is not the best way of modelling because all variables that have theoretical importance should, if possible, be made part of the model. In this study, variables such as fishing cost, fishing profit and total capital were tested. However, their explanations are not strong enough as supported by the theory and therefore they are left out of the formulation of the equation. Others found to be insignificant can only mean that they have no strong inferences to the findings of this study. Depreciation is one, which could have been measured explicitly. However, the data set was not sufficient to capture it in the model. 6.2 Social contribution estimation Because of the continuous contribution that the Namibian fishing companies have made to social development throughout the country, it is important to measure the difference between the two groups of rights holders. The output in Table 9 shows the result of regressing social contribution of the fishing companies measured on quota, income and length of the rights. The question is in the same form as the one presented in equation (E.8), the only difference in this case is that the dependent variable “investment” is replaced by the variable “social contribution”. )()log()log()log( 3210 dINCqSocialt θθθθ +++= All other explanatory variables are significant at the 5% level. However, the dummy variable for the length of the rights is insignificant and has a negative slope coefficient. When a variable is statistically insignificant, it does not mean that it is not important. It only tells us that from the significant test level used in this case (5%), length of rights is insignificant. If the significance level is relaxed, i.e. to the 10% significance level, the length of rights is significant. The insignificance in this regard is supported by Nichols (2004) who stated that social contribution by the fishing companies in Namibia is made out of the generosity of the companies toward the nation. Therefore, we will not expect social contribution to be influenced by whether the company has short term or long term rights. The negative trend observed for the duration of rights could be because social contribution is more concerned with the managerial view of the company giving to the nation because in that way they increase future development in the country. The statistical results of social contribution are tabulated below.
23 This criteria under the “Policy Statement” of MFMR refers to the Namibianisation and empowerment policies. For example, a company which is 100% Namibian owned, has invested only 20% in a vessel, can be granterd longer term fishing rights. Investment made by such a company is not comparable to investment made byother companies in operation.
UNU-Fisheries Training Programme 39

Elago
Table 9: Social contribution log-linear form.
Dependent variable: LOG(TOT_SOCIAL) Number of observations 1-137 LOG(TOT_SOCIAL)=C(1)+C(2)*LOG(QUOTA)+C(3)*LOG(TOT_INCOME)+C(4)*DOR Coefficient Std. Error t-Statistic Prob. C(1) constant 6.80 1.10 6.13 0.0000 C(2) quota 0.21 0.05 3.66 0.0004 C(3) income 0.30 0.07 3.84 0.0002 C(4) length of right -0.39 0.22 -1.78 0.0772 R-squared 0.34 Mean dependent var 13.04 Adjusted R-squared 0.32 S.D. dependent var 1.52 S.E. of regression 1.24 Akaike info criterion 3.31 Sum squared resid 193.20 Schwarz criterion 3.40 Log likelihood -207.97 Durbin-Watson stat 2.13
The results suggest that social contribution increases by 0.21% for each 1% increase in quota while the contribution increase is 0.30% for each 1% increase in fishing income. The results follow the same trend as for total investment. However, a movement in the duration of rights does not correspond to similar movements in social contribution. The explanatory power is only 34%, which is perhaps not the best, but still good enough considering the type of dependent variable in question. This equation is interesting in the sense that fishing rights are not a significant contributor to the explanation of variation in the growth of social contribution. The results indicate that short term rights holders made greater investments than long term rights holders. However, in social contribution the results reverse. For the short term rights, the logarithm of social contribution is decreased. This indicates that a company with short term rights does not react to increase social contributions. Short term rights holders contribute 32%24 less than long term rights fishing companies in terms of socio-economic contributions. In general, this is a true trend because while those with long term rights have come to consider other uses for the profits they are making, social contribution becomes a factor in their strategy to remain recognised. On the other hand, the short term rights holders will have more incentive to concentrate on making substantial investments in order to obtain long term rights. Note that being granted fishing rights is more important than any other variables because it is the key to entering the fishing industry. Therefore, many Namibians, especially those with business minds, seek strategies to secure fishing rights. 7 SUMMARY AND CONCLUSIONS The main motivation for this paper was to study the level of investment in the Namibian fishing sector and to analyse whether longer term fishing rights holders invest more than those with short term rights. It was expected that those with longer term rights would invest more than the short term rights holders. It has been possible to estimate a cross section model of investment in the Namibian fishing sector structured close to a theoretical model of investment. The empirical results suggest that the relationship between length of rights and investment is significantly positive. The econometric analysis has led to the conclusion of rejecting
24 This result is calculated as the exponential of the parameter -0.39 (0.68) for the short term (d=1).
UNU-Fisheries Training Programme 40

Elago
the null hypothesis of the study objective. No conclusion could be made to say that the longer the rights the higher the investment, apart from suggesting the possible reasons why short term rights holders will be (or are) investing more than the long term rights holders. An important factor for investment is the level of uncertainty as well as the timing of when to invest. When there is a lot of uncertainty in the fishing industry, companies reduce investment levels accordingly. It was the government’s thought that the longer the fishing rights granted, the more the investment expected; and that long term rights are granted to those that evidently have a high investment outlook. Currently, investment is doubled by the short term rights holders. Gross investment for both groups of rights holders remains positive, but the rate is declining over time in Namibian fisheries for the long term rights companies, as proved by Boyce’s (1993) non-linear model. The “Policy Statement” (MFMR 1993) of the Ministry of Fisheries points out that every applicant for rights of exploitation will be required to show how there will be investment in vessels within three years of the date from which the rights are valid. Priority is given to applicants who are prepared to make investments in vessels and/or onshore processing facilities. This study finds that priority is given mostly to short term rights holders. This does not mean to say, however, that companies should be given short term rights. This is contrary to the current status of fishing rights in the Namibian fishing sector, where more long term rights are currently being granted. The Ministry of Fisheries is granting more long term rights, which is a step forward towards “optimal policy” in the government system. For such a condition to be fulfilled short term licence holders will continue investing so as to fulfil to the requirements of the government policy. This is consistent with the case where over-capitalisation or investment usually occurs (Clark et al. 1979 and Boyce 1993), behaviour similar to regulations that can be set under an open access fishery. There are incentives for over-investment in this particular case for the short term license holders, but how efficient is such a policy? If such incentives are followed by the Namibian fishing participants, the result will be over-investment relative to the optimal path of investment. The theory of Clark et al. (1979) and Boyce (1993) for optimal capital accumulation of a fishery shows that it is possible that excessive capital can result from poorly defined policies. Furthermore, this paper shows that the three year condition may not be an efficient tool in the long run. Over-investment at the beginning of an operation can only be a better option if measured today, leading to efficiency of the fleet vs. efficiency of the quota system. However, in the future there is a need to look at efficiency as an important social goal as the country progresses both economically and socially. Two aspects have to be well defined in the Namibian policy framework by differences between investments versus efficiency. If the government opts to fully acquire efficiency, the best choice will be an industry efficient enough to provide a larger stake thereby allocating more long term rights. Short term rights will, on the other hand, also be successful as they bring about more investment in the sector in a relatively short period of time. In addition to the scenario summarised above, long term rights result in high social commitment. As a policy directive, social contribution on its own can measure the kind of investment there is in the Namibian fishing sector. If the government is to grant only long term rights in the near future, it will be worth a thought to revise the policy because long term rights are fulfilling high productivity in the sector which contributes to a rise in the living standards of the entire population. It will be
UNU-Fisheries Training Programme 41

Elago
worthwhile if social contribution is recognised (Nichols 2004). The only option will be, to make it visible to the officials in the fishing sector. This could well be a driving force for future developments in the country. In conclusion, investment is volatile because it is influenced by a number of short term factors. Interest rates are probably the most important overall determinant of the level of investment, but they alone cannot explain all fluctuations in investment and had less explanatory power in this study. Technology, demand, output and employment can all affect investment as well. In the theoretical literature on investment in the fishing sector by short term and long term rights holders there is still some ambiguity about the strength of the relationship. The topic of investment and fishing rights remains important. The findings are consistent with the fact that there is a positive relationship between investment and the variables used. Nevertheless, particular attention should be paid to the fact that the relationship between short term rights and investment does not guarantee an effective policy on economic growth in the long run. It is important to have investors who are investing in the sector with long term ideas. The results of the model indicate that, where data is available, further work should be done in identifying variables that are linked to investment, linking investment output and productivity (efficiency). While part of the policy continues to encourage investment in vessels, on-shore processing plants and the overall benefit of the Namibian nation, all three factors could be studied to see how much the companies invested in vessels, infrastructure, people, processing plants and so forth. The optimal policy calls for a switch between investment and efficiency and vice versa approaches. The Minister for Fisheries continues to emphasise that “sacrifice, hard work and re-investment are necessary if any company is to become successful in the long term”. Nevertheless, he has stated that investment has increased more than was expected since the introduction of the rights system in 1994. In the face of adverse economic conditions, the challenge facing the Namibian fishing and processing sector now is to identify courses of action to ensure future economic viability and competitiveness. There is a need for the Policy Statement of the Ministry of Fisheries to include conditions that must be practised as to how the rights holders are committed to investment decisions. This needs to be recorded as per figures of yearly investment. Investment should not be made as a condition measured for three years from the starting point of harvesting the country’s marine resources where investment is at its highest peak, but needs to be incorporated in its entirety. The fishing rights system came into effect only 10 years ago but the question remains whether the government policy on investment is well defined, implemented and understood by all parties involved. These questions open up room for further studies and development on the optimal investment in a system such as that of Namibia.
UNU-Fisheries Training Programme 42
Elago
ACKNOWLEDGEMENTS Thanks go to Dr Tumi Tomasson for giving me a lifetime opportunity to be part of the United Nation Uni. Fisheries Training Programme both financially and educationally. Thanks are also due to Thor Asgeirsson and Sigridur Kr. Ingvarsdottir for their guidance throughout the programme. To the staff members of the Marine Research Institute (MRI) of Iceland, I give you blessings for your kindness and understanding during my stay in Iceland. I am grateful to my supervisors Assist. Professor Eyjólfur Guðmundsson for considerable guidance in the course of this work and Assist. Professor Thorir Sigurdsson for helpful comments and suggestions during the model formulation of the project from a mathematical background. Finally, I would like to thank my colleagues at the Economics and Statistics division of the MFMR for providing helpful support on the data used in the study.
UNU-Fisheries Training Programme 43

Elago
LIST OF REFERENCES Anon. 1998. Namibia Brief. Focus on Fisheries and Research, Namibia. Armstrong, C. W., Sumaila, U. R., Erastus, A. and Msiska, O. 2004. Benefits and Costs of the Namibianisation Policy. In Sumaila, U.R., Boyer, D., Skogen, M. and Steinshamn S.I. eds. Namibia´s Fisheries: Ecological, Economic and Social Aspects pp. 203-214. Eburon, Delft. Boyce, J. R. 1993. Optimal Capital Accumulation in a Fishery: A nonlinear Irreversible Investment Model. J. Environ. Econom. Management, 28, 324-339 (1995). Boyer, D. and Oelofsen, B. 2004. Co-Management: Namibia´s experience with tow large-scale industrial fisheries Sardine and Orange Roughy. In Sumaila, U.R., Boyer, D., Skogen, M. and Steinshamn S.I. eds. Namibia´s Fisheries: Ecological, Economic and Social Aspects pp. 333-356. Eburon, Delft. Byrne, J. P. and Davis, P. E. 2003. Panel Estimations of the Impact of Exchange Rate Uncertainty on Investment in the Major Industrial Countries. NIESR and Brunel University, 17 February 2003. Clark, C. W., Clarke, F. H. and Munro, G. R. 1979. The Optimal Exploitation of Renewable Resource stocks: Problems of Irreversible Investment, Econometrica. 47: 25-47. Erastus, A.N. 2002. The Development of the Namibianisation in the Hake Subsector, 1994-1999. NEPRU Working Paper No. 82.Windhoek, Namibia. Food and Agriculture Organisation (FAO) 2000. The Allocation of Harvesting Rights in the South Africa Hake Fishery. By Japp, D. W. Fisheries & Oceanographic Support Services . FAO Technical Paper 411. Rom:FAO Frain, J., Howlett, D. and McGuire, M.1996. Estimating Investment functions for a small-scale econometric model. Economics Analysis, Research and Publications Department, Central Bank of Ireland. Frank, R. H. and Bernanke, B. S. 2004. Principles of Economics. Second Ed. McGraw Hill. Fuss, C. and Vermeulen, P. 2004. Firms’ Investment Decisions in Response to Demand and Price Uncertainty. European Central Bank. Working paper Series. No. 347. Hersoug, B. 2002. Unfinished Business. New Zealand’s experience with right-based fisheries management. Eburon Delft. Jurgen, J. D. 1998. A Tongue in Cheeck Assessment. In: Namibia Brief, Focus on Fisheries and Research. No. 20.
UNU-Fisheries Training Programme 44

Elago
Iyambo, A. 2000. “Managing Fisheries with Rights in Namibia: a Minister’s Perspective" in "Use of Property Rights in Fisheries Management", FAO Fisheries Technical Paper 404/1, Rome, pp. 142-150
Iyambo, A. 2003. Progress in broad-based empowerment in the Fisheries and marine Resources Sector. A paper presented by Hon. Dr Abraham Iyambo, Minister for Fisheries and Marine Resources. Socio-Economic Empowerment Workshop. Swakopmund, December 4-5. Kolstad, I. and Villanger, E. 2004. Promoting investment in small Caribbean states. Chr. Michelsen Institute Working Paper. 2002:9. Manning, P. 2000. Distributive Aspects of Namibia’s Fisheries Policy. NEPRU Research Report No. 21. Windhoek, Namibia. Ministry of Fisheries and Marine Resources (MFMR) 1991. Towards Responsible Development of the Fisheries Sector. White paper, Government Gazette of the Republic of Namibia. Windhoek. Ministry of Fisheries and Marine Resources (MFMR) 1992. Sea Fisheries Act. Government Gazette of the Republic of Namibia. Act No. 29 of 1992. Windhoek. Ministry of Fisheries and Marine Resources (MFMR) 1993. Policy Statement on the Granting of Rights of Exploitation to utilise Marine Resource and on the Allocation of Fishing Quotas. Ministry of Fisheries and Marine Resources. Government of the Republic of Namibia. Ministry of Fisheries and Marine Resources (MFMR) 2000. Marine Resource Act. Government Gazette of the Republic of Namibia. Act No. 27 of 2000. Windhoek. Ministry of Fisheries and Marine Resources (MFMR) 2001. Annual Report. Windhoek. Ministry of Fisheries and Marine Resources (MFMR). 2002 Annual Report. Windhoek. Ministry of Fisheries and Marine Resources (MFMR). 2003 Annual Report. Windhoek. Ministry of Fisheries and Marine Resources (MFMR). 2004. Towards Responsible Development and Management of the Marine Resources Sector. Namibia’s Marine Resources Policy. Government of the Republic of Namibia. Windhoek. Ministry of Trade and Industry (MTI) 1993. Special Incentives for Manufacturing Enterprises. Government of the Republic of Namibia. Nichols, P. 2004. Marine Fisheries Management in Namibia. In Sumaila, U.R., Boyer, D., Skogen, M. and Steinshamn S.I. eds. Namibia´s Fisheries: Ecological, Economic and Social Aspects pp. 319-332. Eburon, Delft.
UNU-Fisheries Training Programme 45

Elago
Nickell, S 1978. “ The Investment Decisions of Firms”, Cambridge Economic Handbook Series, Cambridge University Press, 1978. Oelofsen, B.W. 1999. Fisheries management: the Namibian approach. ICES Journal of Marine Science. 56: 999-1004. Ranganatham, M. and Madhumathi, R. 1996. Market Price as an Influencer of Investment Decisions. Journal of Finance India, 10. No.1. pp. 61-72. Sumaila, U. R. and Steinshamn, S. I. 2004. A brief overview of current bio economic studies of Namibian fisheries. In Sumaila, U.R., Boyer, D., Skogen, M. and Steinshamn S.I. eds. Namibia´s Fisheries: Ecological, Economic and Social Aspects pp. 165-185. Eburon, Delft.
UNU-Fisheries Training Programme 46
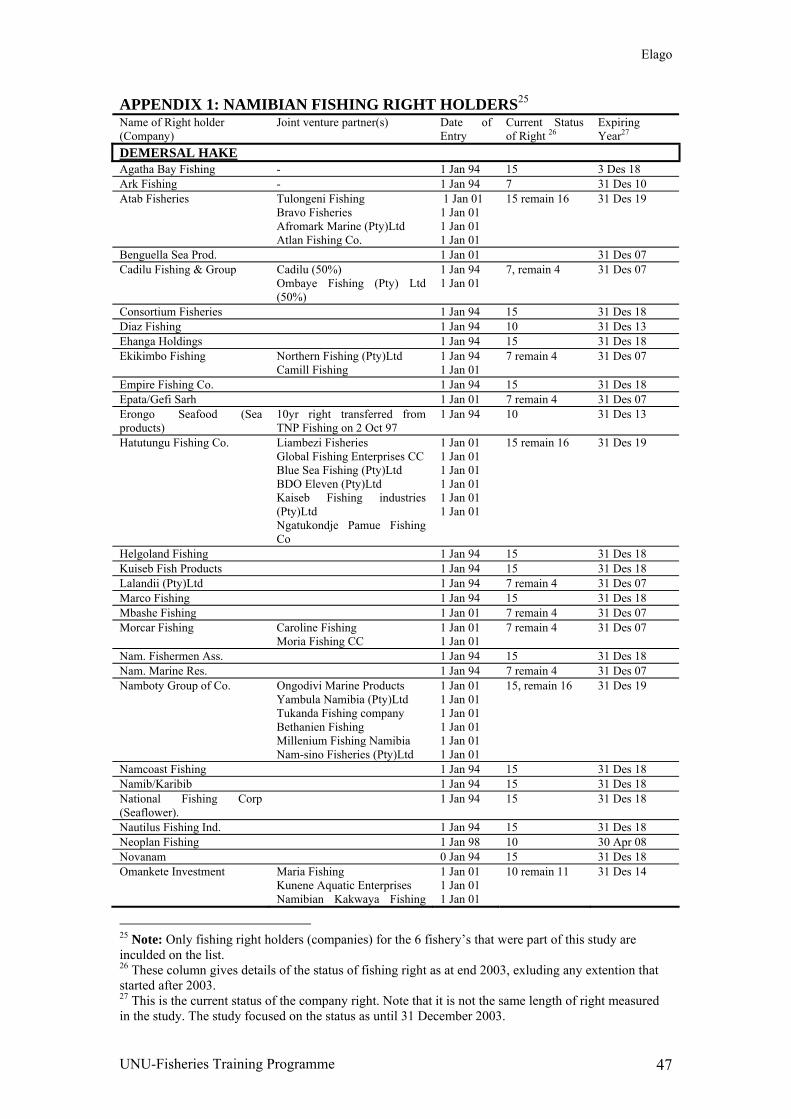
Elago
APPENDIX 1: NAMIBIAN FISHING RIGHT HOLDERS25 Name of Right holder (Company)
Joint venture partner(s) Date of Entry
Current Status of Right 26
Expiring Year27
DEMERSAL HAKE Agatha Bay Fishing - 1 Jan 94 15 3 Des 18 Ark Fishing - 1 Jan 94 7 31 Des 10 Atab Fisheries Tulongeni Fishing
Bravo Fisheries Afromark Marine (Pty)Ltd Atlan Fishing Co.
1 Jan 01 1 Jan 01 1 Jan 01 1 Jan 01
15 remain 16 31 Des 19
Benguella Sea Prod. 1 Jan 01 31 Des 07 Cadilu Fishing & Group Cadilu (50%)
Ombaye Fishing (Pty) Ltd (50%)
1 Jan 94 1 Jan 01
7, remain 4 31 Des 07
Consortium Fisheries 1 Jan 94 15 31 Des 18 Diaz Fishing 1 Jan 94 10 31 Des 13 Ehanga Holdings 1 Jan 94 15 31 Des 18 Ekikimbo Fishing Northern Fishing (Pty)Ltd
Camill Fishing 1 Jan 94 1 Jan 01
7 remain 4 31 Des 07
Empire Fishing Co. 1 Jan 94 15 31 Des 18 Epata/Gefi Sarh 1 Jan 01 7 remain 4 31 Des 07 Erongo Seafood (Sea products)
10yr right transferred from TNP Fishing on 2 Oct 97
1 Jan 94 10 31 Des 13
Hatutungu Fishing Co. Liambezi Fisheries Global Fishing Enterprises CC Blue Sea Fishing (Pty)Ltd BDO Eleven (Pty)Ltd Kaiseb Fishing industries (Pty)Ltd Ngatukondje Pamue Fishing Co
1 Jan 01 1 Jan 01 1 Jan 01 1 Jan 01 1 Jan 01 1 Jan 01
15 remain 16 31 Des 19
Helgoland Fishing 1 Jan 94 15 31 Des 18 Kuiseb Fish Products 1 Jan 94 15 31 Des 18 Lalandii (Pty)Ltd 1 Jan 94 7 remain 4 31 Des 07 Marco Fishing 1 Jan 94 15 31 Des 18 Mbashe Fishing 1 Jan 01 7 remain 4 31 Des 07 Morcar Fishing Caroline Fishing
Moria Fishing CC 1 Jan 01 1 Jan 01
7 remain 4 31 Des 07
Nam. Fishermen Ass. 1 Jan 94 15 31 Des 18 Nam. Marine Res. 1 Jan 94 7 remain 4 31 Des 07 Namboty Group of Co. Ongodivi Marine Products
Yambula Namibia (Pty)Ltd Tukanda Fishing company Bethanien Fishing Millenium Fishing Namibia Nam-sino Fisheries (Pty)Ltd
1 Jan 01 1 Jan 01 1 Jan 01 1 Jan 01 1 Jan 01 1 Jan 01
15, remain 16 31 Des 19
Namcoast Fishing 1 Jan 94 15 31 Des 18 Namib/Karibib 1 Jan 94 15 31 Des 18 National Fishing Corp (Seaflower).
1 Jan 94 15 31 Des 18
Nautilus Fishing Ind. 1 Jan 94 15 31 Des 18 Neoplan Fishing 1 Jan 98 10 30 Apr 08 Novanam 0 Jan 94 15 31 Des 18 Omankete Investment Maria Fishing
Kunene Aquatic Enterprises Namibian Kakwaya Fishing
1 Jan 01 1 Jan 01 1 Jan 01
10 remain 11 31 Des 14
25 Note: Only fishing right holders (companies) for the 6 fishery’s that were part of this study are inculded on the list. 26 These column gives details of the status of fishing right as at end 2003, exluding any extention that started after 2003. 27 This is the current status of the company right. Note that it is not the same length of right measured in the study. The study focused on the status as until 31 December 2003.
UNU-Fisheries Training Programme 47

Elago
Ent Omusati Development Trust Tega Fishing (Pty)Ltd (Atlantic Fishing) Ekango Fishing (Pty)Ltd Ambassador Fishing (Pty)Ltd Etaka Fishing (Pty)Ltd Tweya Fishing (Pty)Ltd
1 Jan 01 1 Jan 01 1 Jan 01 1 Jan 01 1 Jan 01 1 Jan 01
Omaru Consortium Aonin Fishing/Rundu Fishing Old Man Fishing Co
1 Jan 94 1 Jan 01
7 remain 4 31 Des 07
Ompagona Fishing Part of JV that forms Etale Fishing
1 Jan 98 10 30 Des 08
Omuhuka Holdings 1 Jan 94 15 31 Des 18 Oryx Fisheries 1 Jan 94 15 31 Des 18 Overberg Fishing 1Jan 94 15 31 Des 18 Ozohi Fishing Part of JV that forms Etale
Fishing 1 Jan 98 10 30 Apr 08
Southern Nam. Hake 1 Jan 94 15 31 Des 08 The Rainbow Fishing Cato Fishing Co. (Pty)Ltd
Old Pensioners Company 1 Jan 94 1 Jan 01
7 remain 4 31 Des 07
W/Bay Small Boat 1 Jan 94 15 31 Des 18 MIDWATER -HORSE MACKEREL Arechanab Fishing 1 Jan 94 10 31 Des 13 Atlantic Harvesters 1 Jan 98 10 remain 11 31 Des 14 Atlantic Sea Prod 1 Jan 98 10 remain 11 31 Des 14 Cerocic (Pty)Ltd 1 Jan 98 10 remain 11 31 Des 14 Diaz Fishing 1 Jan 98 10 remain 11 31 Des 14 Emeritus Fishing 1 Jan 98 10 remain 4 31 Des 07 Erongo Sea Products (right of TNP transferred in 2 Oct 97)
1 Jan 94 10 31 Des 13
Gendev of Namibia 1 Jan 98 10 remain 11 31 Des 14 Kuiseb Fishing Ent. 1 Jan 98 10 remain 4 31 Des 07 Mediva Fisheries 1 Jan 98 10 remain 4 31 Des 07 Namsov Fishing Ent. 1 Jan 94 15 31 Des 18 Ongwe Fishing 1 Jan 98 10 remain 4 31 Des 07 SMALL PELAGIC !Oe#gab Fishing Ent. Namsea
Namfish Anibib
1 Jan 94 1 Jan 94 1 Jan 01
7 remain 4 31 Des 07
Auob-Eigelaar JV Auob Fisheries Eigelaars Belange
1 Jan 01 1 Jan 01
7 remain 4 31 Des 07
Buccaneer Fishing 1 Jan 98 10 remain 4 31 Des 07 Champion Ladies Champion Fishing
Ladies Fishing 1 Jan 01 1 Jan 01
7 remain 4 31 Des 07
Coenrad A C Van Dyk 1 Jan 94 15 31 Des 18 Consortium Fisheries 1 Jan 94 0 EXPIRED Dec
2003 Dun-Al Fishing 1 Jan 94 15 31 Des 18 Etosha Fishing Co. 1 Jan 94 15 31 Des 18 Genmir Marine Res. Gendev Namibia
Mirabilis Marine Resources 1 Jan 94 1 Jan 01
7 remain 4 31 Des 07
Henties Bay People 1 Jan 94 15 31 Des 18 Hesko Visserye 1 Jan 94 10 31 Des 13 J.M.C. Theart (Pty)Ltd 1 Jan 94 15 31 Des 18 Marine Dev. Co 1 Jan 94 15 31 Des 18 Matutura Fishing Co. 1 Jan 94 15 31 Des 18 Meyiga Fishing Ind. Namchild
Edelweiss Visserye 1 Jan 01 I Jan 01
7 remain 4 31 Des 07
Mukorob Fishing 1 Jan 94 10 31 Des 13 Namibia Fisheries 1 Jan 94 10 31 Des 13
UNU-Fisheries Training Programme 48

Elago
Okahulo Fisheries 1 Jan 94 7 31 Des 10 Oshakati Fishing Co 1 Jan 94 15 31 Des 18 Otjiwanda Fishing 1 Jan 94 7 31 Des 10 Sarusas Development 1 Jan 94 10 31 Des 13 Silence Holdings 1 Jan 94 10 31 Des 18 ORANGE ROUGHY Atlantic sea Prod. 1 Apr 97 10 31 Mar 14 Gendor Fishing 1 Apr 97 10 31 Mar 14 Glomar Fisheries 1 Apr 97 10 31 Mar 14 Consortium Fisheries 1 Apr 97 10 remain 4 30 Mar 07 Continental Deep Sea 1 Apr 97 10 remain 4 30 Mar 07 MONK Belinda Fishing 1 Jan 94 15 31 Des 18 Frebeca Fishing Freddie Fisheries
Benguella Sea Products Caroline Fishing
1 Jan 01 1 Jan 01 1 Jan 01
7 remain 4 31 Des 07
Helgoland Fishing 1 Jan 94 15 31 Des 18 National Fishing Corp 1 Jan 94 15 31 Des 18 Nexus Fishing Cato Fishing
Masilahi Fishing Black Rock Fishing
1 Jan 01 1 Jan 01 1 Jan 01
7 remain 4 31 Des 07
Overberg Fishing 1 Jan 94 15 31 Des 18 Oviwana Ovitoto Fishing
Oshiwana Fishing Atlantic Sea Products
1 Jan 01 1 Jan 01 1Jan 01
10 remain 11 31 Des 14
Twafika Fishing Namsov Fishing
1 Jan 01 1 Jan 94
10 remain 11 31 Des 14
Voorbok Fishing 1 Jan 94 15 31 Des 18 ROCK LOBSTER A Plaatjie 1 Jan 94 15 31 Des 18 Aloe Fishing Seafood distributors
Kosis Fishing Sea Products Seagull Fishing
1 Jan 01 1 Jan 01 1 Jan 01 1 Jan 01
10 remain 11 31 Des 14
Atushe Lobster Co. Lalandii Jeselto Bogenfels Omungua
1 Jan 94 1 Jan 01 1 Jan 01 1 Jan 01
15 remain 16 31 Des 19
Blomeha Fishing 1Jan 94 15 31 Des 18 D Shoombe 1 Jan 94 15 31 Des 18 D Victor 1 Jan 94 15 31 Des 18 Epoko Fishing 1 Jan 98 15 remains 14 31 Jan 17 Golden Horizons Season Fisheries (33.3%)
New Generation (33.3%) New Horizon Fishing (33.3%)
1 Jan 01 1 Jan 01 1Jan 01
15 remains 16 31 Des 19
H Kakoro 1 Jan 94 15 31 Des 18 J A Lawrence 1 Jan 94 15 31 Des 18 J A Schroeter 1 Jan 94 15 31 Des 18 Luderitz Pioneer 1 Jan 98 15 remain 14 31 Des 17 Martin´s Den Fisheries 1 Jan 97 15 remain 14 31 Des 17 Omulonga Fishing I Jan 94 15 31 Des 18 Prim Fishing 1 Jan 98 15 remain 14 31 Des 17 R & F. O Fishing Rasco Fishing (50%)
F.O.F (50%) 1 Jan 01 1 Jan 01
15 remain 16 31 Des 19
Robert Van Ast 1 Jan 01 15 31 Des 18 R.P.M.G. Fishing 1 Jan 98 15 remain 14 31 Des 17 S Andrews 1 Jan 94 15 31 Des 18 Seaflower Lobster 1 Jan 94 15 31 Apr 19 Shoremillkol (Pty)Ltd Kolmanskop (33.3%)
Millenium Fishing (33.3%) 1 Jan 01 1 Jan 01
15 remain 16 31 Des 19
UNU-Fisheries Training Programme 49

Elago
Shoreline Fishing (33.3%) 1 Jan 01
UNU-Fisheries Training Programme 50

Elago
APPENDIX 2: INCOME AND EXPENDITURE SURVEY QUESTIONNAIRE
Section A: PARTICULARS OF COMPANY Year: Fishery Classification :
A1 Name & Address Port of Operation:
A1 Name of Company : Address: Name and position of authorized official to whom enquiries may be addressed: I, the undersigned, being duly authorized in terms of a resolution passed by the Board of Directors of this company, declare that the information provided in this document is true and correct to the best of my knowledge and belief. A2 Name : Position : Tel : Signature:
A2 Ownership A21 National Private 50 % or more owned or controlled by private Namibian nationals A22 National Public 50% or more owned or controlled by the Government A23 Foreign 50% or more owned or controlled by foreign nationals
A3 Legal Status A31 Limited Company A32 Proprietary Limited Company A33 Partnership A34 Sole Proprietorship A35 Joint-Venture Registered: Not Registered: A36 Companies Act Registration Number A37 Date registered A38 Is the company registered on the Namibian Stock Exchange ? If so, when?
A39 Number of Shareholders Namibian Foreign
A40 Enter approximate Namibian and Foreign Shareholdings (%):
A4 Type of Operations Does the Company: A41 Charter vessels? A42 Own and Operate vessels? A43 Own and Operate a Shore Processing Facility?
UNU-Fisheries Training Programme 51

Elago
B1 INCOME Total Catches: Ex-Vessel Landed B101 Sales Revenue* Specify Species: By catch: B102 Plus: Value of Closing Stocks B103 Less: Value of Opening Stocks B104 Commission for catches Products: Onshore, Own Products B105 Sales Revenue* Specify Species: By catch: B106 Plus: Value of Closing Stocks B107 Less: Value of Opening Stocks Other Income (received and receivable) B108 Vessel Charter Fees B109 Fees from other operators for use of quota B110 Rent: Plant & Machinery B111 Rent: Land & Buildings B112 Sales of other goods & services** B113 Interest received B114 Dividends B115 Bad Debts recovered B116 Foreign Exchange gains B117 Income from Processing*** B118 All other income Specify:
B119 TOTAL INCOME NOTES TO B1 INCOME *Please list the income as received for each targeted species separately. ** Please specify the type or form of good or service. ***This includes all payments received for processing of another right holder’s catch. All income should exclude any sales tax or sales duty. B101 should include unprocessed catches and catches processed on board. B105 should include all products processed onshore. NOTES TO B2: EXPENDITURE ON PAGE 3 Onshore refers to all expenditure related to activities undertaken on land. Offshore refers to all expenditure related to fishing or processing activities undertaken at sea. 1: This includes all fish designated for processing. 2: Professional Fees include Director's fees, accounting fees, administration & management fees, audit fees, consulting , marketing, secretarial and any other fees of a professional nature. 3. Processing fees include those fees paid to another right holder/company who undertakes any processing of fish on right holder’s behalf. B3 should equal B117 minus B242. PLEASE ATTACH A COPY OF YOUR LATEST AUDITED FINANCIAL STATEMENTS.
UNU-Fisheries Training Programme 52
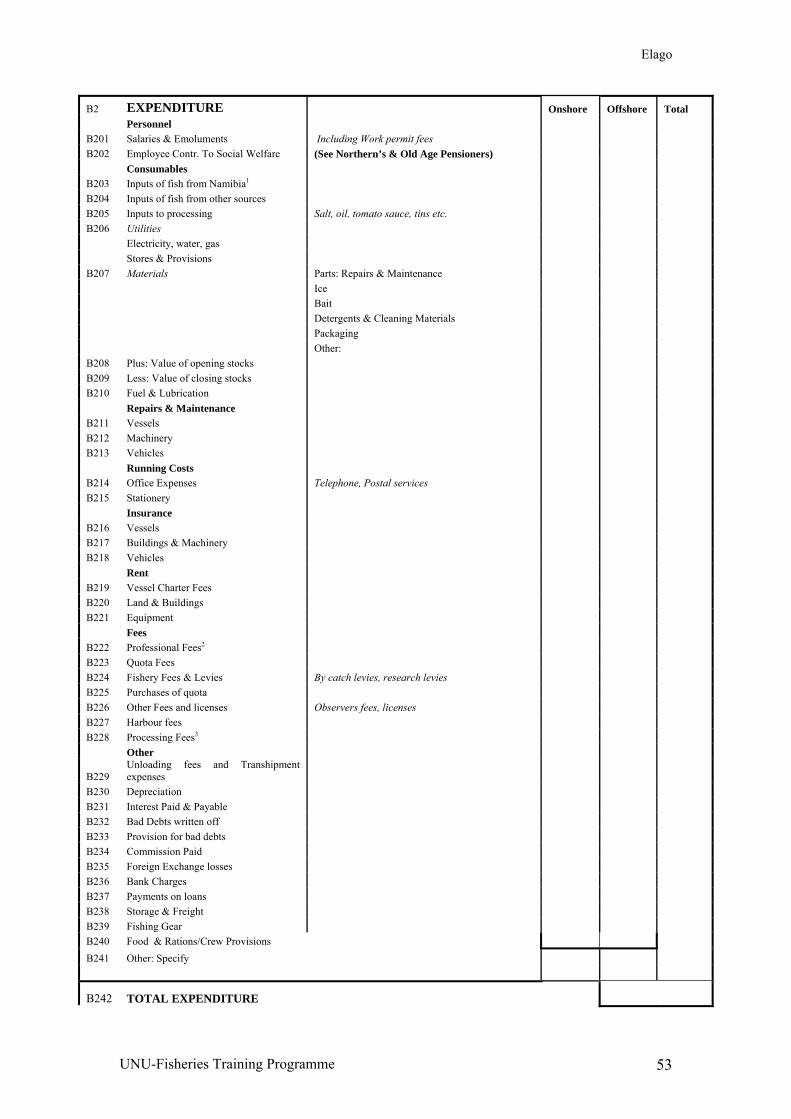
Elago
B2 EXPENDITURE Onshore Offshore Total Personnel B201 Salaries & Emoluments Including Work permit fees B202 Employee Contr. To Social Welfare (See Northern’s & Old Age Pensioners) Consumables B203 Inputs of fish from Namibia1 B204 Inputs of fish from other sources B205 Inputs to processing Salt, oil, tomato sauce, tins etc. B206 Utilities Electricity, water, gas Stores & Provisions B207 Materials Parts: Repairs & Maintenance Ice Bait Detergents & Cleaning Materials Packaging Other: B208 Plus: Value of opening stocks B209 Less: Value of closing stocks B210 Fuel & Lubrication Repairs & Maintenance B211 Vessels B212 Machinery B213 Vehicles Running Costs B214 Office Expenses Telephone, Postal services B215 Stationery Insurance B216 Vessels B217 Buildings & Machinery B218 Vehicles Rent B219 Vessel Charter Fees B220 Land & Buildings B221 Equipment Fees B222 Professional Fees2 B223 Quota Fees B224 Fishery Fees & Levies By catch levies, research levies B225 Purchases of quota B226 Other Fees and licenses Observers fees, licenses B227 Harbour fees B228 Processing Fees3 Other
B229 Unloading fees and Transhipment expenses
B230 Depreciation B231 Interest Paid & Payable B232 Bad Debts written off B233 Provision for bad debts B234 Commission Paid B235 Foreign Exchange losses B236 Bank Charges B237 Payments on loans B238 Storage & Freight B239 Fishing Gear B240 Food & Rations/Crew Provisions B241 Other: Specify
B242 TOTAL EXPENDITURE
UNU-Fisheries Training Programme 53
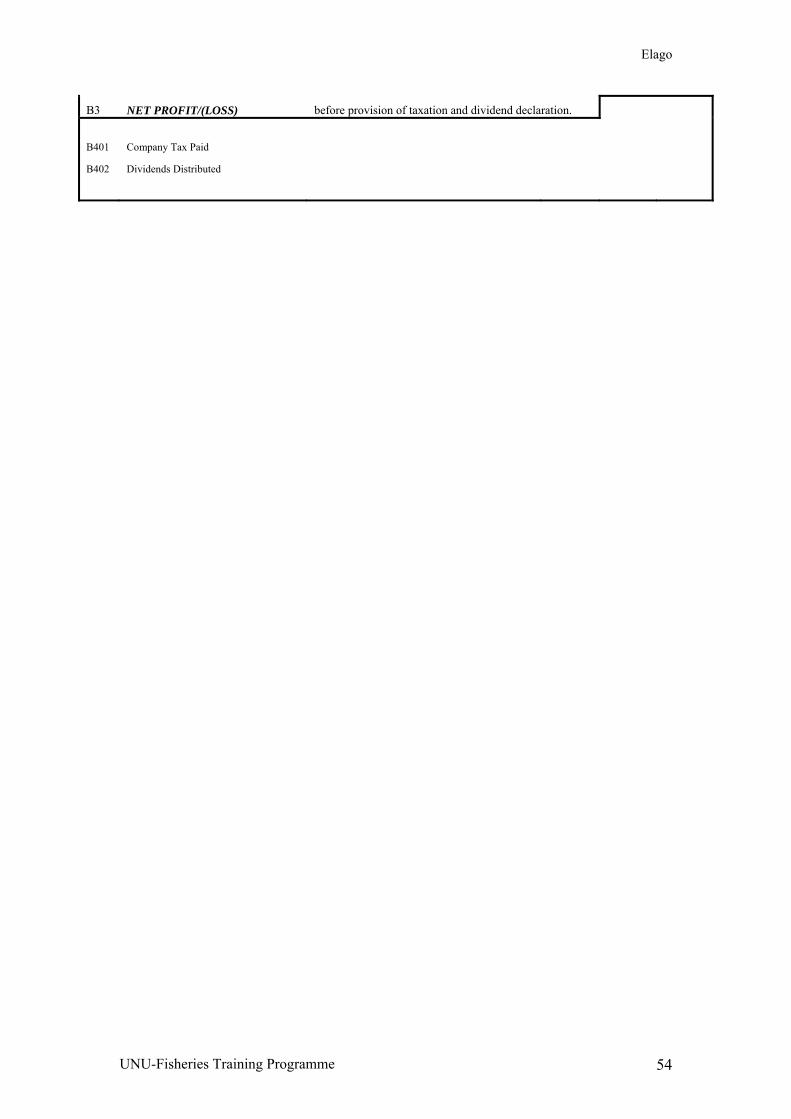
Elago
B3 NET PROFIT/(LOSS) before provision of taxation and dividend declaration.
B401 Company Tax Paid
B402 Dividends Distributed
UNU-Fisheries Training Programme 54
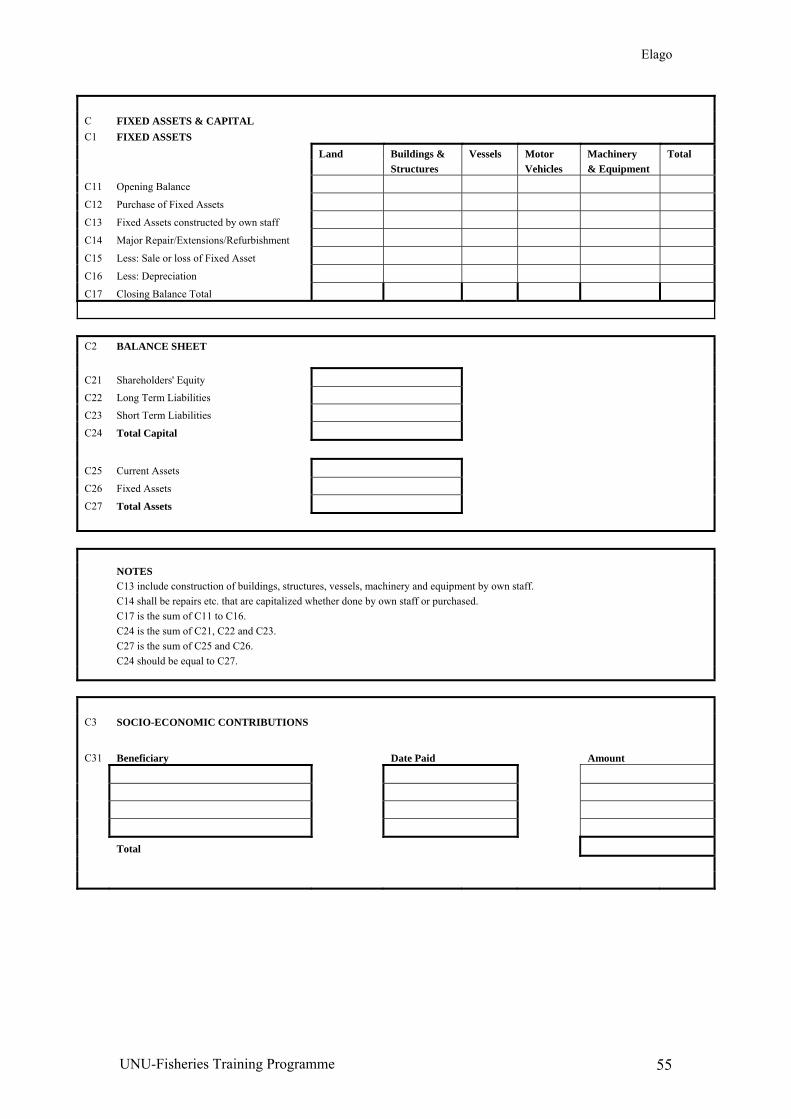
Elago
C FIXED ASSETS & CAPITAL C1 FIXED ASSETS Land Buildings & Vessels Motor Machinery Total Structures Vehicles & Equipment
C11 Opening Balance
C12 Purchase of Fixed Assets
C13 Fixed Assets constructed by own staff
C14 Major Repair/Extensions/Refurbishment
C15 Less: Sale or loss of Fixed Asset
C16 Less: Depreciation
C17 Closing Balance Total
C2 BALANCE SHEET
C21 Shareholders' Equity
C22 Long Term Liabilities
C23 Short Term Liabilities
C24 Total Capital
C25 Current Assets
C26 Fixed Assets
C27 Total Assets
NOTES C13 include construction of buildings, structures, vessels, machinery and equipment by own staff. C14 shall be repairs etc. that are capitalized whether done by own staff or purchased. C17 is the sum of C11 to C16. C24 is the sum of C21, C22 and C23. C27 is the sum of C25 and C26. C24 should be equal to C27. C3 SOCIO-ECONOMIC CONTRIBUTIONS
C31 Beneficiary Date Paid Amount
Total
UNU-Fisheries Training Programme 55
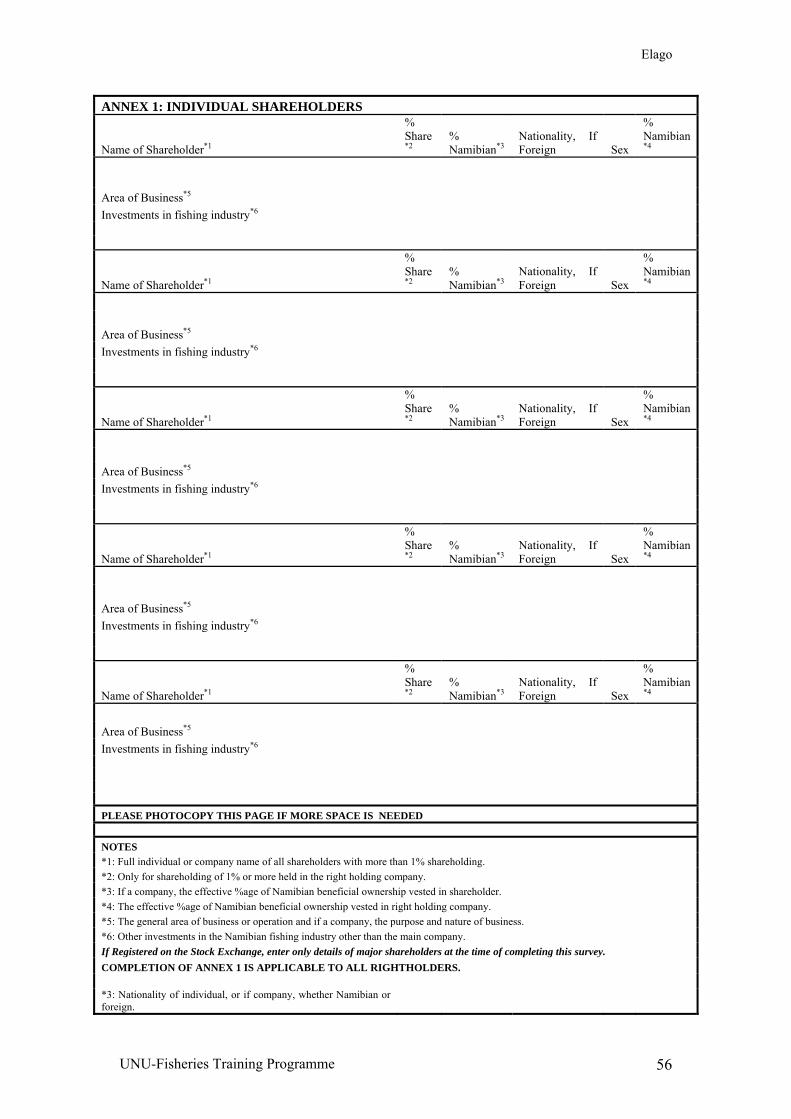
Elago
ANNEX 1: INDIVIDUAL SHAREHOLDERS
Name of Shareholder*1
% Share *2
% Namibian*3
Nationality, If Foreign Sex
% Namibian *4
Area of Business*5 Investments in fishing industry*6
Name of Shareholder*1
% Share *2
% Namibian*3
Nationality, If Foreign Sex
% Namibian *4
Area of Business*5 Investments in fishing industry*6
Name of Shareholder*1
% Share *2
% Namibian*3
Nationality, If Foreign Sex
% Namibian *4
Area of Business*5 Investments in fishing industry*6
Name of Shareholder*1
% Share *2
% Namibian*3
Nationality, If Foreign Sex
% Namibian *4
Area of Business*5 Investments in fishing industry*6
Name of Shareholder*1
% Share *2
% Namibian*3
Nationality, If Foreign Sex
% Namibian *4
Area of Business*5 Investments in fishing industry*6 PLEASE PHOTOCOPY THIS PAGE IF MORE SPACE IS NEEDED NOTES *1: Full individual or company name of all shareholders with more than 1% shareholding. *2: Only for shareholding of 1% or more held in the right holding company. *3: If a company, the effective %age of Namibian beneficial ownership vested in shareholder. *4: The effective %age of Namibian beneficial ownership vested in right holding company. *5: The general area of business or operation and if a company, the purpose and nature of business. *6: Other investments in the Namibian fishing industry other than the main company. If Registered on the Stock Exchange, enter only details of major shareholders at the time of completing this survey. COMPLETION OF ANNEX 1 IS APPLICABLE TO ALL RIGHTHOLDERS. *3: Nationality of individual, or if company, whether Namibian or foreign.
UNU-Fisheries Training Programme 56

Elago
UNU-Fisheries Training Programme 57