durham e-theses the aerodynamics and performance of a
TRANSCRIPT

Durham E-Theses
The aerodynamics and performance of a cross �ow fan
Tuckey, Paul R.
How to cite:
Tuckey, Paul R. (1983) The aerodynamics and performance of a cross �ow fan, Durham theses, DurhamUniversity. Available at Durham E-Theses Online: http://etheses.dur.ac.uk/7163/
Use policy
The full-text may be used and/or reproduced, and given to third parties in any format or medium, without prior permission orcharge, for personal research or study, educational, or not-for-pro�t purposes provided that:
• a full bibliographic reference is made to the original source
• a link is made to the metadata record in Durham E-Theses
• the full-text is not changed in any way
The full-text must not be sold in any format or medium without the formal permission of the copyright holders.
Please consult the full Durham E-Theses policy for further details.
Academic Support O�ce, Durham University, University O�ce, Old Elvet, Durham DH1 3HPe-mail: [email protected] Tel: +44 0191 334 6107
http://etheses.dur.ac.uk
The copyright of this thesis rests with the author.
No quotation from it should be published without
his prior written consent and information derived
from it should be acknowledged.
THE AERODYNAMICS AND
PERFORMANCE OF A
CROSS FLOW FAN
Paul R. Tuckey B.Sc.
Thesis submitted for the degree of Doctor of Philosohy
in the Faculty of Science, University of Durham.
July, 1983
/<.:·-·--·.".. ! ' - •: ' I ,. ,.) ' ' - J
\~'~>' i
Dedicated to my mother, Mrs. R.M. Tuckey and my father,
Mr. C. Tuckey B.Sc., C.Eng. for their persuasion, guidance
and encouragement.
ii
CONTENTS
Page
ACKNOWLEDGEMENTS 1
ABSTRACT 2
NOMENCLATURE 4
CHAPTER ONE: INTRODUCTION 8
1.1 Problems with Cross Flow Fan Development 9
1.2 Early History 10
1.3 Recent History 16
L4 Present Research 17
CHAPTER TWO: THE AERODYNAMIC FACILITY 19
2. 1 Introduction 20
2.2 The Rotor Geometry 20
2. 2. 1 The Number of Blades 22
2. 2. 2 The Blades Angles S1
and 82 22
2. 2. 3 The Diameter Ratio Dl/D2 25
2.2.4 The Length to Diameter Ratio L/D.., 26 ... 2.2.5 The Motor Drive and Drive Shaft 26
2.2.6 The Rotor Safety Cage 28
2.3 The Fan Casing Geometry 29
2.3.1 The Vortex Wall 29
2.3.1.1 Stiffening of the Vortex Wall Leading Edge 31
~.3.2 The I~dr Wall 32
2.3.3 The Outlet Duct Diffuser 34
2.3.4 Wind Tunnel Working Section Outlet Diffuser 35
2.3.5 Pressure Tappings 35
2.4 The Aerodynamic Measurements 37
2.4.1 Determination of Volume Flowrate 37
iii

2.4.2 Determination of Pressure Rise 39
2.4.3 Determination of Power Input and Efficiency 41
2.4.4 The Rotor Rotational Speed 42
2.4.5 Instrumentation 42
2.4.5.1 Cranked Three Hole Probe 42
2.4.5.2 The Traversing Mechanism 43
2.4.5.3 The Measurement of Pressures 48
2.4.6 The Experimental Procedure 48
2.4.7 The Calculation of Results 52
2.4.7.1 The Calculation of Stream Function 52
2.4.7.2 The Calculation of Total Pressure
Coefficient
2.5 Results and Conclusions
CHAPTER THREE: THE HYDRODYNAMIC FACILITY
3.1
3.2
3.3
3.3.1
3.3.2
3.3.3
3.3.4
3.3.5
3.4
3.5
3.5.1
3.5.2
3.6
3.6.1
3.6.2
Introduction
Flow Visualization Techniques
The Water Table
The Design and Manufacture of
The Design and Manufacture of
The Design and Manufacture of
Casing
The Drive to the Rotor
Tank Flow Guide Walls
Tank
Model Rotor
the Rotor
Photographic Materials and Techniques
Experimental Procedure
The Rotor in Unbounded Fluid
The Rotor with Casing
Results and Conclusions
Rotor in Unbounded Fluid
The Rotor with Casing
iv
62
63
70
71
71
74
74
75
75
81
81
81
82
83
83
84
84
93

3.6.2.1
3.6.2.2
3.6.2.3
3.6.2.4
CHAPTER
4. 1
4.2
4.3
4.4
4.5
4.5.1
Flow in the Suction Region
Flow in the Interior Region
Flow in the Discharge Region
The General Flow Field
FOUR: THEORY OF THE CROSS FLOW FAN
Introduction
The Theory of CO ESTER
The Theory of ILBERG and SADEH
The Theory of MOORE
The Theory of IKEGAMI and MURATA
Problems with the Theory of IKEGAMI
MURATA
and
94
98
100
102
106
107
108
114
117
121
132
4.5.2 A Parameter for Blade Geometry 140
4.5.3 The Reflex Curvature of the Streamlines 145
4.5.4 Losses within Cross Flow Fans 149
4.5.4.1 Inlet 'Shock' Loess 153
4.5.4.2 Viscous Losses within a Rankine Vortex 153
4.5.4.3 Losses within the Vortex of the Cross
4.6
Flow Fan
Conclusions
CHAPTER FIVE: CONCLUSIONS
5.1
5.2
5.3
5.4
5.5
5. 5. 1
5.5.2
5.5.3
5.5.4
The Aerodynamic Facility
The Hydrodynamic Facility
Theory of the Cross Flow Fan
Losses Within the Vortex
The Modern Design of Cross Flow Fans
The Vortex Wall
The Rear Wall
The Rotor
Fans in Series
v
159
165
167
168
172
173
174
175
175
176
177
179

5.5.5 Fans in Parallel 179
REFERENCES 181
APPENDICES 186
1 Determination of the Mid-span Deflection
of a Cross Flow Fan Blade
2 Author's Paper (ref. 27)
vi
ACKNOWLEDGEMENTS
My gratitude is extended to everyone in the Department
of Engineering Science who contributed towards this research
project through physical labour or useful discussion.
Particular thanks are due to Dr. M.J. Holgate for
conceiving and supervising the research and to the Science
and Engineering Research Council for its funding.
Finally, I wish to extend my thanks to all the techni-
cians of the department, particularly David James, and the
staff of the computer unit for operating valuable services.
Paul Tuckey

ABSTRACT
The cross flow fan consists of a cylindrical rotor
closed at the ends with a cascade of axial blades around its
curved surface. The rotor is mounted in a housing which
defines the suction and discharge arcs. The housing extends
the full length of the rotor and the throughflow is in a
plane at right angles to the rotor axis. This fan is a
unique type of turbo-machine which differs significantly
from axial flow, centrifugal and mixed flow machines, in
that each blade passage experiences a continuosly varying
flow each time it makes a revolution through the flow field.
In this thesis, experimental results are presented
which describe the internal flow regime of a large cross
flow fan of rotor length 1.0 m and outside diameter 0.625 m.
Details of the flow field are examined for a range of
dimensionless flow coefficient ~ between 0.4 and 0.8, which
is taken to be the usual operating range for reasons of
efficiency and stability of flow. The measurements are
transformed into streamlines for the purpose of illustration
and the corresponding variations of a dimensionless total
pressure coefficient are also given.
Flow visualization techniques have been applied to a
dynamically similar model to a reduced scale of 1:6.25
operating in water and photographs representing the flow
have been examined both quantitatively and qualitatively.
2

A Rankine-type vortex centered near the inner
periphery is confirmed but the core was found to remain
virtually stationary over the flow range investigated. The
total pressure distribution indicates the spatial growth and
weakened circulation of the forced vortex core as the flow
rate reduces. A depression of total pressure has been
identified in a region diametrically opposite the vortex
core which intensifies as the flow rate increases.
These data are broadly interpreted and are used to
improve a previous theoretical model, in which the location
of the vortex is used to define the operating point on the
fan characteristic.
3

NOMENCLATURE
Symbol Units
a probe calibration factor (chapter 2)
a factor relating radial vortex location (chapter 4)
a to 1 regions of flow (chapter 3)
A Area
b blockage factor (4.
b
c
c
d
d
D
E
E
F
g
h
H
I
distance (4.
chord length
Local flow velocity
deflection (a?pendix 1)
distance (chapter 2)
diameter
energy dissipation (cha?ter 4)
Young's modulus (appendix 1)
centrifugal force
weight per unit mass
distance
Total head
second moment of area
k' suction region flow function
K constant value
1 blade length
L fan length
m mass
m strength of source and sink
n integer 4
2 m
m
m
-1 ms
m
m
m
w
Pa
N
-2 ms
m
Pa
4 m
m
m
kg
2 -1 m s
Symbol N rotational speed
N blade number (chapter 4)
0 " pressure
pressure rise
power (chapter 4)
q local flow velocity
Q volume flow rate
r blade curvature
r radius
R reaction force (appendix 1)
R radius
t blade thickness
t time ,.., t total pressure coefficient -
u blade velocity
v fluid velocity
w distributed force
distance to centroid of area
y deflection
z constant factor
a included angle of blade section
a location of sink (chapter 4)
rear wall leading edge location
vortex wall leading edge location
location of source
blade angle
y = pg, specific weight
r vortex strength
E 1 rear wall leading edge clearance
5
Units 1 rev.s
Pa
Pa
w -1
ms
3 -1 m s
m
m
N
m
m
s
-1 ms
-1 ms
-1 Nm
m
m
degs
degs
degs
degs
degs
degs
-3 Nm
2 -1 m s
m
symbol
vortex wall leading edge clearance
s conformal mapping function
~ conformal mapping function
~ efficiency
e angle
8 peripheral vortex location
arc
)..1 viscosity of air
p density
T shear stress
¢ velocity potential
dimensionless flow coefficient
stream function
dimensionless pressure coefficient =
w rotational speed
Subscripts
l fan inner periphery
2 fan outer periphery
AV average
t centre-line
d discharge
1 fan inner periphery (MOORE)
IN input
n normal
o fan outer periphery (MOORE)
r radial
s static
s suction (MOORE)
t rear wall leading edge (MOORE)
6
Q LD~Ua
units
m
rads
rads
rads
-1 -1 kgm s
kgm-3
Pa
2 -1 m s
2 -1 m s
Y2.S Ui -rads- 1
Symbol
t total
to total on fan centre-line
v vortex
8 tangential
e. tangential on free/forced vortex boundary 1
Superscripts
mean
~ free vortex
* rotational flow
7

CHAPTER ONE
INTRODUCTION
8

1. INTRODUCTION
1.1 Problems with Cross Flow Fan Development
Although cross flow fans have been designed and built
for nearly a century, there still remain ambiguities and
a lack of precision in the description of the aerodynamic
behaviour of these devices. Many of the difficulties
arise from the presence of numerous geometric variables
which are deemed to have an influence on performance and
even now, optimisation criteria are not universally
accepted. Nevertheless, the dominant feature of a cross
flow fan (and to a large extent its vertical axis wind
turbine counterpart) lies in the inherent unsteady, non
uniform aerodynamics of the rotor. The passage of blades
through the vortex core, the reversal of flow direction
relative to the blade during one revolution and the presence
of highly turbulent flow zones, present problems of
extreme difficulty for the analyst.
An account of the historical development of cross
flow fans is given by CLAYTON (ref. 5 ) who additionally
compiled a wide range of data in order to improve design
guide lines. A more recent study by ALLEN (ref. 1 ) ,
confirmed by previous research on the aerodynamic facility
used fiD~ the present investigation, details a fan selection
procedure which is included in Chapter 5.
9
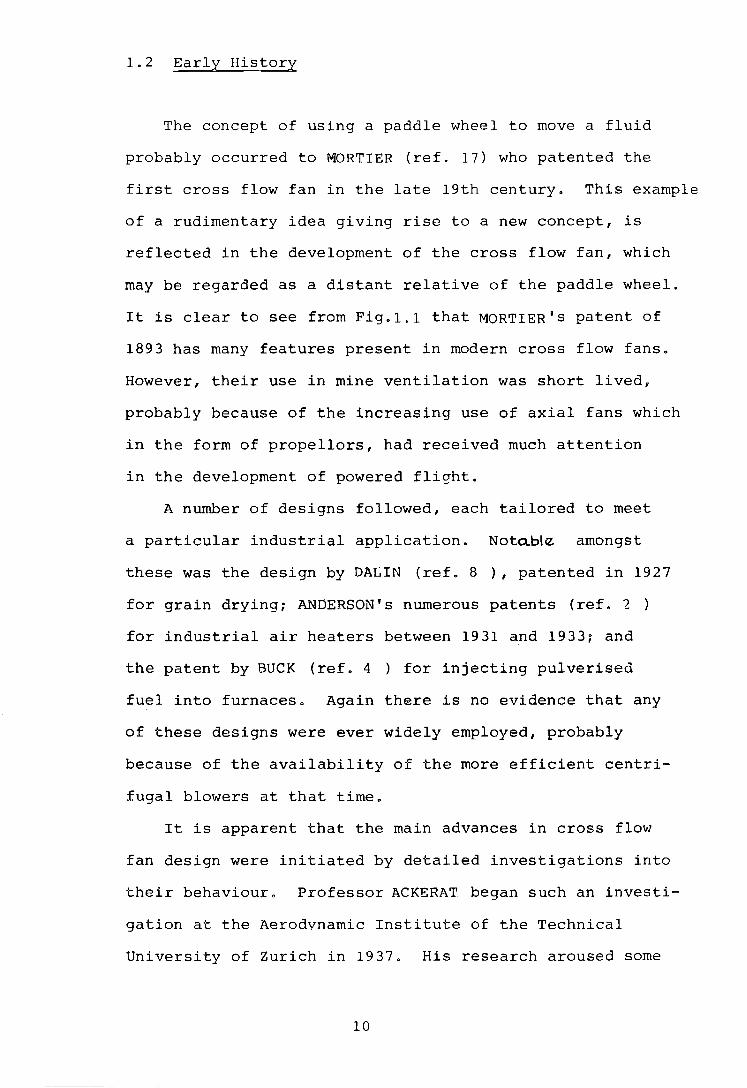
1.2 Early History
The concept of using a paddle wheel to move a fluid
probably occurred to MORTIER (ref. 17) who patented the
first cross flow fan in the late 19th century. This example
of a rudimentary idea giving rise to a new concept, is
reflected in the development of the cross flow fan, which
may be regarded as a distant relative of the paddle wheel.
It is clear to see from Fig.l.l that MORTIER's patent of
1893 has many features present in modern cross flow fans.
However, their use in mine ventilation was short lived,
probably because of the increasing use of axial fans which
in the form of propellers, had received much attention
in the development of powered flight.
A number of designs followed, each tailored to meet
a particular industrial application. NotQbl~ amongst
these was the design by DALIN (ref. 8 ), patented in 1927
for grain drying; ANDERSON's numerous patents (ref. 2
for industrial air heaters between 1931 and 1933; and
the patent by BUCK (ref. 4 ) for injecting pulverised
fuel into furnaces. Again there is no evidence that any
of these designs were ever widely employed, probably
because of the availability of the more efficient centri
fugal blowers at that time.
It is apparent that the main advances in cross flow
fan design were initiated by detailed investigations into
their behaviour. Professor ACKERAT began such an investi
gation at the Aerodynamic Institute of the Technical
University of Zurich in 1937. His research aroused some
10

Filler BodY----~--~
Figure 1.1 MORTIER FAN (U.S. ~ATENT 507, 445, 1893).
11
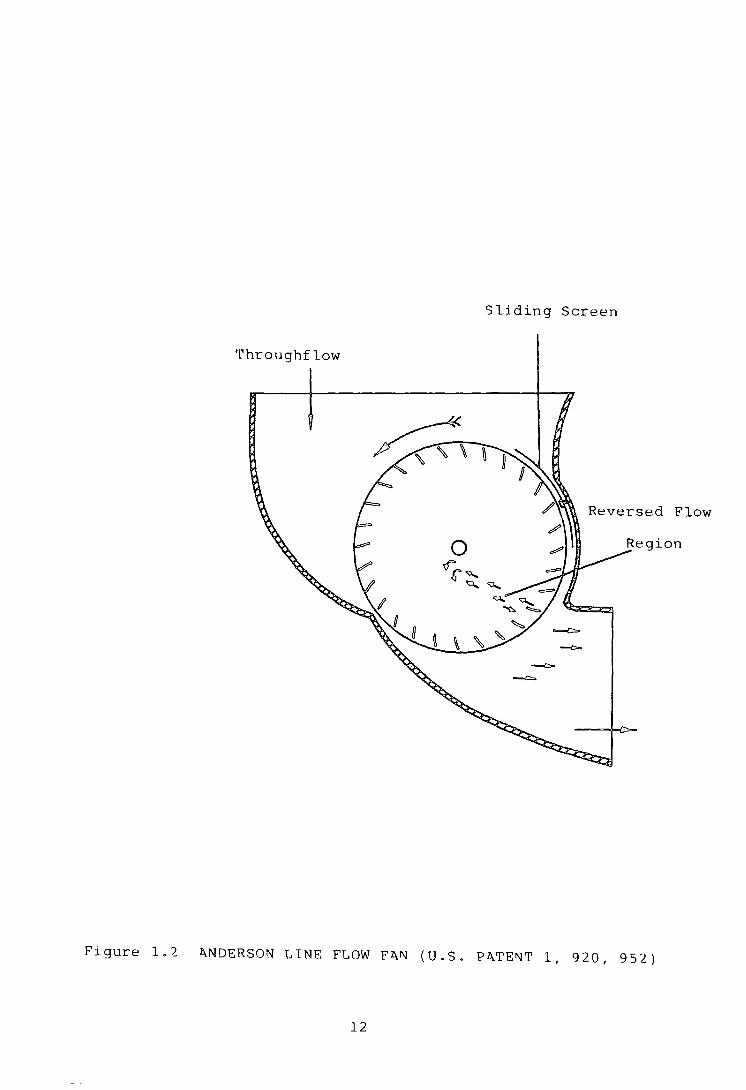
Sliding Screen
Throughflow
Reversed Flow
Figure 1.2 ~NDERSON LINE FLOW F~N (U.S. P~TENT 1, 920, 952)
12
interest in Swiss industry; notably at Sulzer Brothers of
Winterthur who investigated the properties of these
machines for applications in air conditioning.
A graduate of the same institute, Dr. D.B.TWYLER ,
commenced research in 1950 which resulted in patents
(ref. 9 which have since been licensed to several coun
tries. In 1959, Dr. COESTER, also of the institute,
published a paper (ref. 7 ) dealing with his research into
and the analysis of improved cross flow fans with novel
casing geometries.
Sadly, none of these endeavours culminated in the manu
facture of a commercial machine and there can be little
doubt that it was the research carried out by Dr. ECK in
Germany which began the development of the modern cross
flow fan.
ECK introduced the term cross flow, in a purely generic
sense , iri his research which began in 1950. A design was
soon completed comprising a fan having no external casing,
relying on an internal body to stabilise the vortex, or
indeed to provide a break of symmetry, thus initiating
the throughflow. This design was subsequently sold to a
West German company, giving these fans their first prac-
tical application since their use in mine ventilation at
the turn of the century. BCK's exhaustive text on fans
(ref. 10 ) contains an article on this fan type.
Although a market was created for this novel duct
free fan as a desk top ventilator, the constructional
difficulties and the increased manufacture cost prompted
further research directed towards the development of a low
13

Throughflow
\ \ Recirculation Pocket
Recirculation
Figure 1.3 IMPROVED COESTER BLOWER
14

--f+-
:;.... ...-! "C ...-! o ro
11) 3:
1-1 ~ il) il)
.-' .;..J
...-! 1-1 ·.-i 0 ~ :>
Figure 1.4 ECK CROSS FLOW BLOWER (U.K. P'TENT 757, 543)
15

cost ventilation unit based on the same principle of vortex
control. From performance evaluations together with flow
visualization studies, ECK determined that the vortex could
be controlled by correctly profiling the vortex wall. A
running clearance was no longer necessary as he noted
that the vortex acted as an aerodynamic seal, preventing a
passage between the high pressure side and atmosphere.
This had the added benefit of considerable noise reduction.
ECK 1 s design of an efficient cross flow fan, ideal for
use in l0w Reynolds number applications and cheap to manu
facture through the absence of internal guide bodies and
the larger running clearances, was patented in 1954.
Today, this fan is still evident on the small fan market,
where they find their predominant application in the air
conditioning field.
1.3 Recent History
Since 1960, much of the research has been consolidated
by the Japanese. YAMAFUJI (refs.28 and 29) conducted experi
ments with a small (160mrn. d.d.) isolated rotor, in an
effectively unbounded fluid contained by a water tank. He
was able to show that a stable eccentric vortex could be
formed, located close to the inner periphery of the rotor,
provided that the Reynolds number (based on the outer
blade tip speed and the blade chord) exceeded about 250.
Under these circumstances a through flow across the rotor
was established. Using the implications of this and further
experimental work, an actuator disc theory was deve~oped
16
(ref. 29). Good agreement with his experiments was found
including some examples in whch simple casing geometries
were specified.
MURATA anct NISHIHJ.\RJ.\ (ref. 18 ) used a somewhat larger
rotor of 240mm. o.d. and examined the influence of a variety
of casing configurations on the performance. These
generally tended to confirm the optimised values used in
the present research. In ref. 19 , these researchers investi
gated the shape of the fan performance curves in relation
to controlled adjustments of the casing. In this and the
previous work, the vortex centre formed near the inner
periphery of the rotor and was observed to move away from
the vortex wall and towards the rotor centre line, as the
flow rate was reduced from its maximum value. Further
systematic studies were conducted by MURATA et al (ref.20
along similar lines to ECK, where the effects of guide
vanes within the rotor which encircled the vortex region,
were examined.
1.4 The Present Research
At present, the field of applications of the cross flow
fan in diameters of up to 65mm. has been consolidated but
advances in industrial size has been slow. This is because
royalty income is largely dependent on total turnover and
as such, the mass market has received much more attention
by researchers and licensing companies than possible indus~
trial develooments. Also, the tooling and manufacturing
costs of larger machines would be relatively high.
17

For these reasons, among others, previous workers
have tended to concentrate research on quite small rotors
(i.e. less than 300mm o.d.) but there has been some evi
dence to suggest that large rotors may behave differently
(ref. 12). In order to clarify some of the areas of doubt
concerning the aerodynamics of large cross flow machines,
an experimental and theoretical research programme has been
undertaken. Quantitative data were obtained from a large
rotor previously installed in a purpose-built wind tunnel
(Chapter 2) and also from a smaller scale rotor placed in
a water tank (Chapter 3). This latter facility also all
owed the adoption of reliable flow visualization techniques.
The theoretical study (Chapter 4) was aimed principally
at improving the approach adopted by IKEGAMI and MURATA
(ref. 13) .
18
CHAPTER TWO
THE AERODYNAMIC FACILITY
"No one is competent to predict things about absolute space
and absolute motion; they are pure things of thought, pure
mental constructs that cannot be produced by experience".
Ernst Mach 1838-1916
19
2. AERODYNAMIC FACILITY
2.1 Introduction
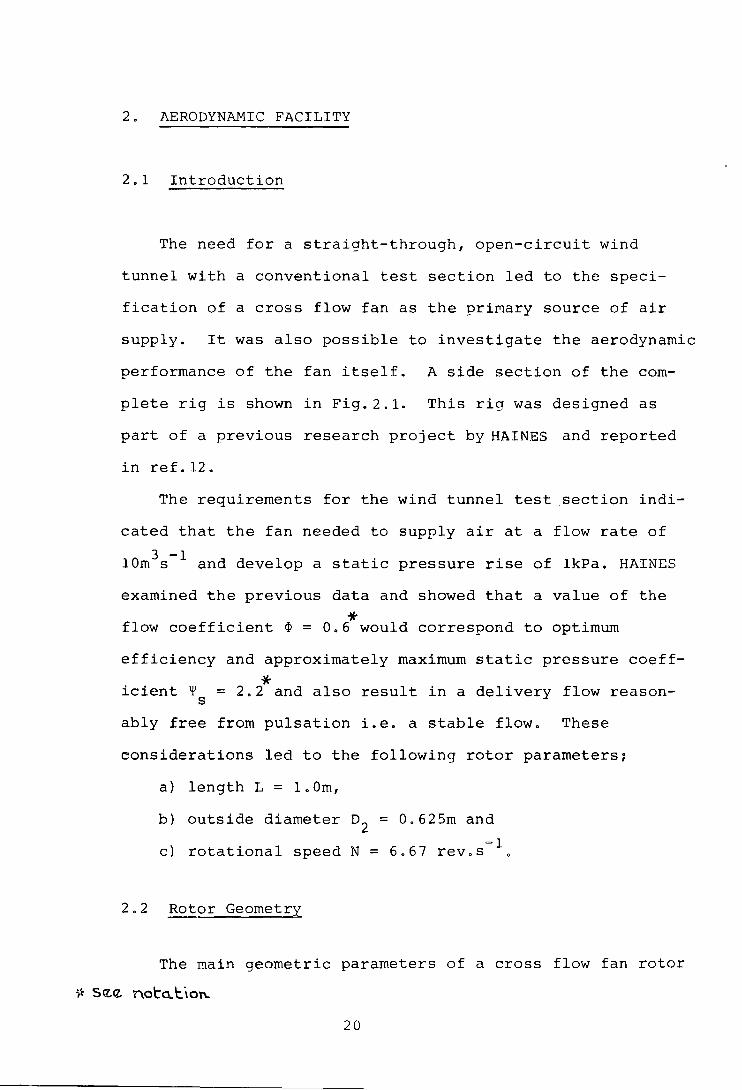
The need for a straight-through, open-circuit wind
tunnel with a conventional test section led to the speci-
fication of a cross flow fan as the pri~ary source of air
supply. It was also possible to investigate the aerodynamic
performance of the fan itself. A side section of the com-
plete rig is shown in Fig.2.1. This rig was designed as
part of a previous research project by HAINES and reported
in ref.12.
The requirements for the wind tunnel test .section indi-
cated that the fan needed to supply air at a flow rate of
3 -1 10m s and develop a static pressure rise of lkPa. HAINES
examined the previous data and showed that a value of the
* flow coefficient ¢ = 0.6 would correspond to optimum
efficiency and approximately maximum static pressure coeff
* icient ~ = 2.2 and also result in a delivery flow reason-s
ably free from pulsation i.e. a stable flow. These
considerations led to the following rotor parameters;
a) length L = 1.0m,
b) outside diameter o2
= 0.625m and
-1 c) rotational speed N = 6.67 rev.s .
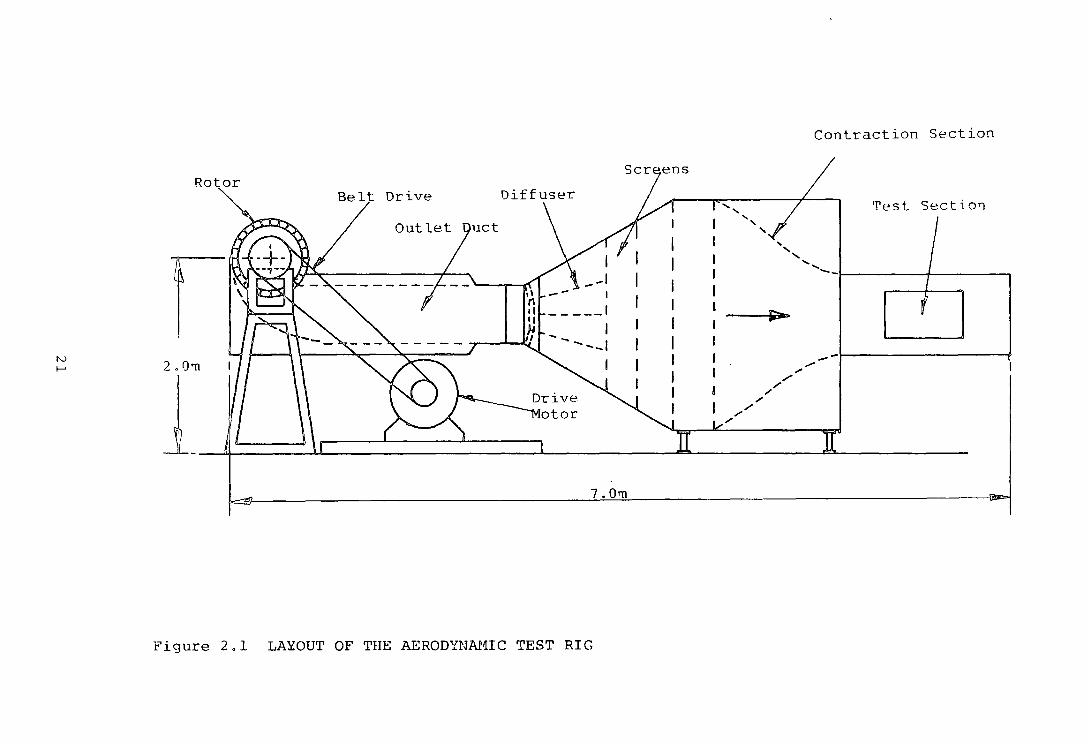
2.2 Rotor Geometry
The main geometric parameters of a cross flow fan rotor
* SIZ<Z. no to..\::. \o"-
20
Rotor Belt Drive
........... ' Outlet ' '
' ',
Contraction Section
Test Section
......... --~--------+-------~
2.0~ ;/
1-~---~-////'~ 7.0'11
Figure 2. 1 LAYOU'r OF THE AERODYNAJ.I1IC TEST RIG
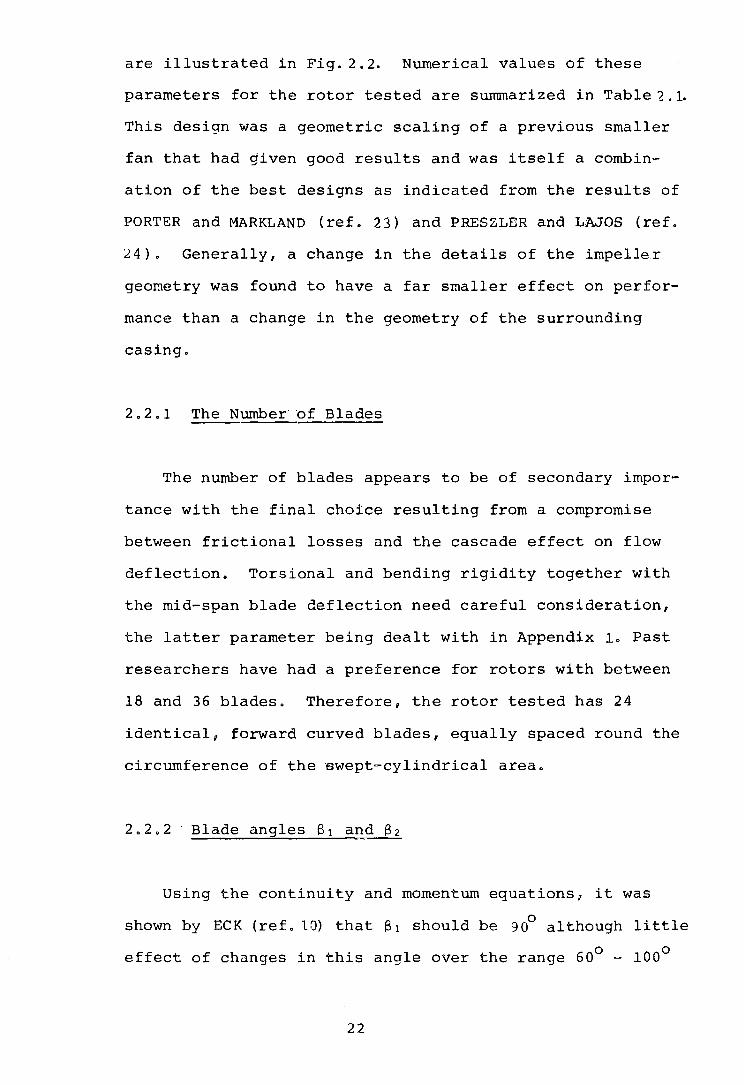
are illustrated in Fig. 2.2. Numerical values of these
parameters for the rotor tested are summarized in Table '2. 1.
This design was a geometric scaling of a previous smaller
fan that had given good results and was itself a combin-
ation of the best designs as indicated from the results of
PORTER and MARKLAND (ref. 23) and PRESZLER and LAJOS (ref.
24). Generally, a change in the details of the impeller
geometry was found to have a far smaller effect on perfor-
mance than a change in the geometry of the surrounding
casing.
2.2.1 The Number of Blades
The number of blades appears to be of secondary impor-
tance with the final choice resulting from a compromise
between frictional losses and the cascade effect on flow
deflection. Torsional and bending rigidity together with
the mid-span blade deflection need careful consideration,
the latter parameter being dealt with in Appendix 1. Past
researchers have had a preference for rotors with between
18 and 36 blades. Therefore, the rotor tested has 24
identical, forward curved blades, equally spaced round the
circumference of the swept-cylindrical area.
2.2.2 Blade angles 61 and 62
Using the continuity and momentum equations, it was
0 shown by ECK (ref. lO) that 81 should be 90 although little
effect of changes in this angle over the range 60° - 100°
22
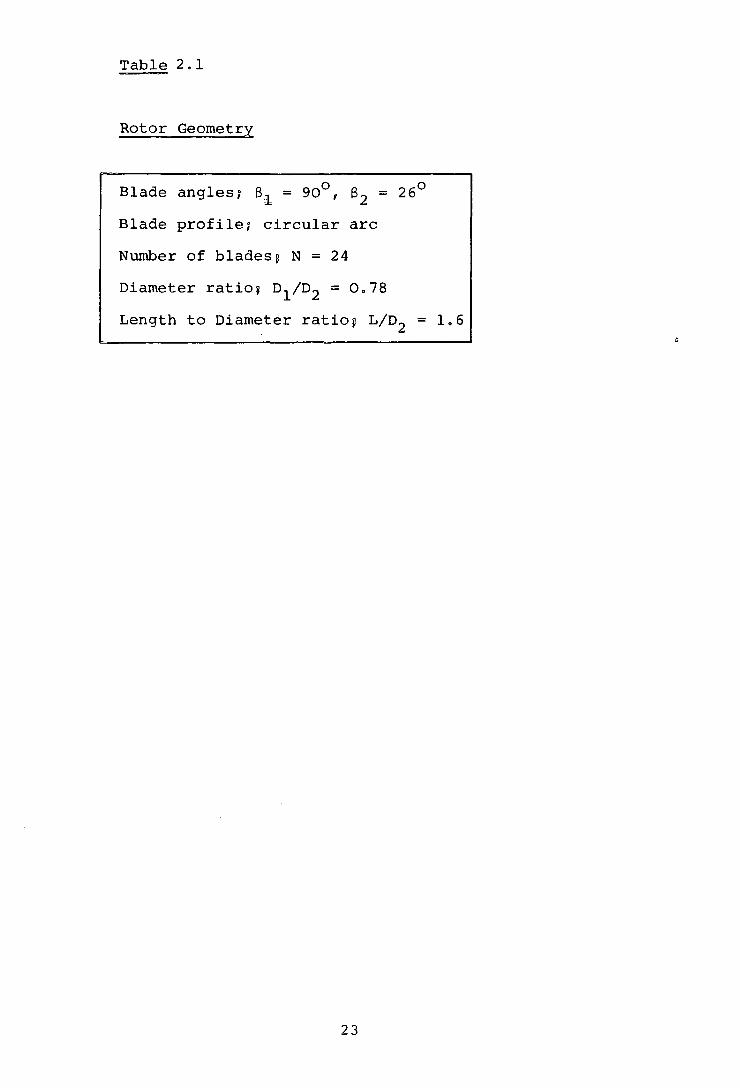
Table 2.1
Rotor Geometry
Blade angles; 81 = 90°, 82 = 26°
Blade profile; circular arc
Number of bladesp N = 24
Diameter ratio¥ D1/D2 = 0.78
Length to Diameter ratiop L/D2 = 1.6
23

Rear Wall
Figure 2.2 GEOMETRY OF THE CROSS FLOW F~N
24
Vortex Wall
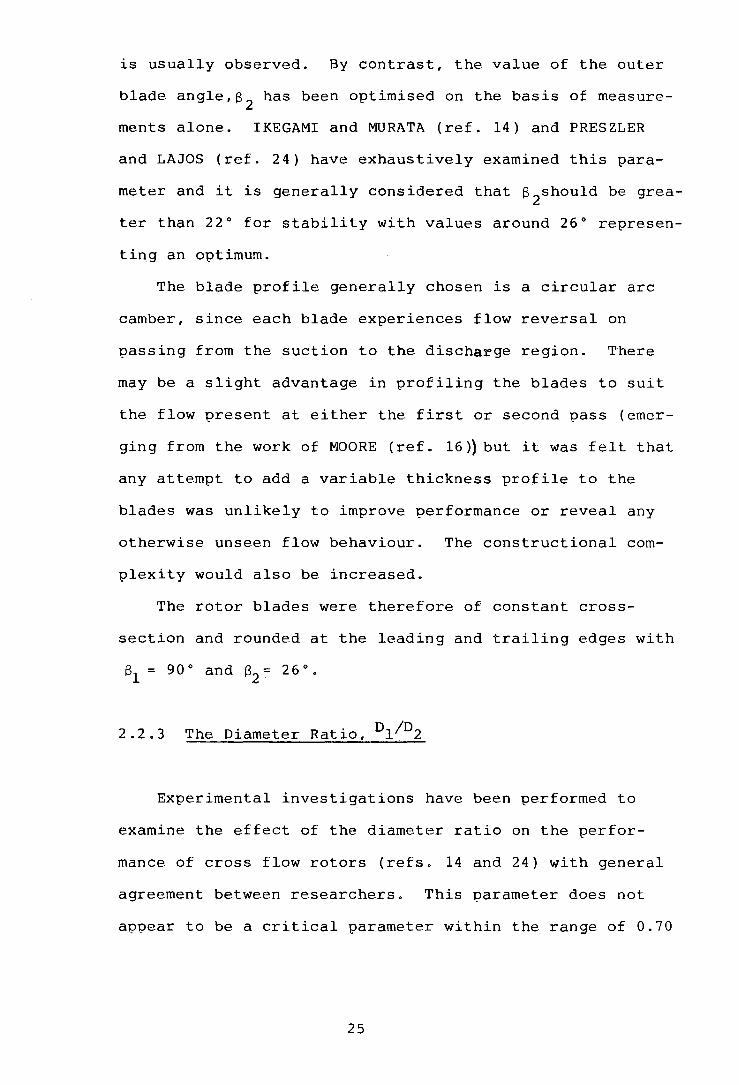
is usually observed. By contrast, the value of the outer
blade angle,82
has been optimised on the basis of measure
ments alone. IKEGAMI and MURATA (ref. 14) and PRESZLER
and LAJOS (ref. 24) have exhaustively examined this para
meter and it is generally considered that 82should be grea
ter than 22° for stability with values around 26° represen
ti:r~g an o-ptimum.
The blade profile generally chosen is a circular arc
camber, since each blade experiences flow reversal on
-passing from the suction to the discharge region. There
may be a slight advantage in -profiling the blades to suit
the flow present at either the first or second {)ass (emer
ging from the work of MOORE (ref. 16)} but it was felt that
any attempt to add a variable thickness profile to the
blades was unlikely to improve -performance or reveal any
otherwise unseen flow behaviour. The constructional com
-plexity would also be increased.
The rotor blades were therefore of constant cross
section and rounded at the leading and trailing edges with
81
= 9 0 o and 82
= 2 6 o •
2.2.3 The Diameter Ratio, 01/0 2
Experimental investigations have been performed to
examine the effect of the diameter ratio on the perfor
mance of cross flow rotors (refs. 14 and 24) with general
agreement between researchers. This parameter does not
ap{)ear to be a critical parameter within the range of 0.70
25
to 0.85 and an average value of 0.80 was accepted for the
tested rotor.
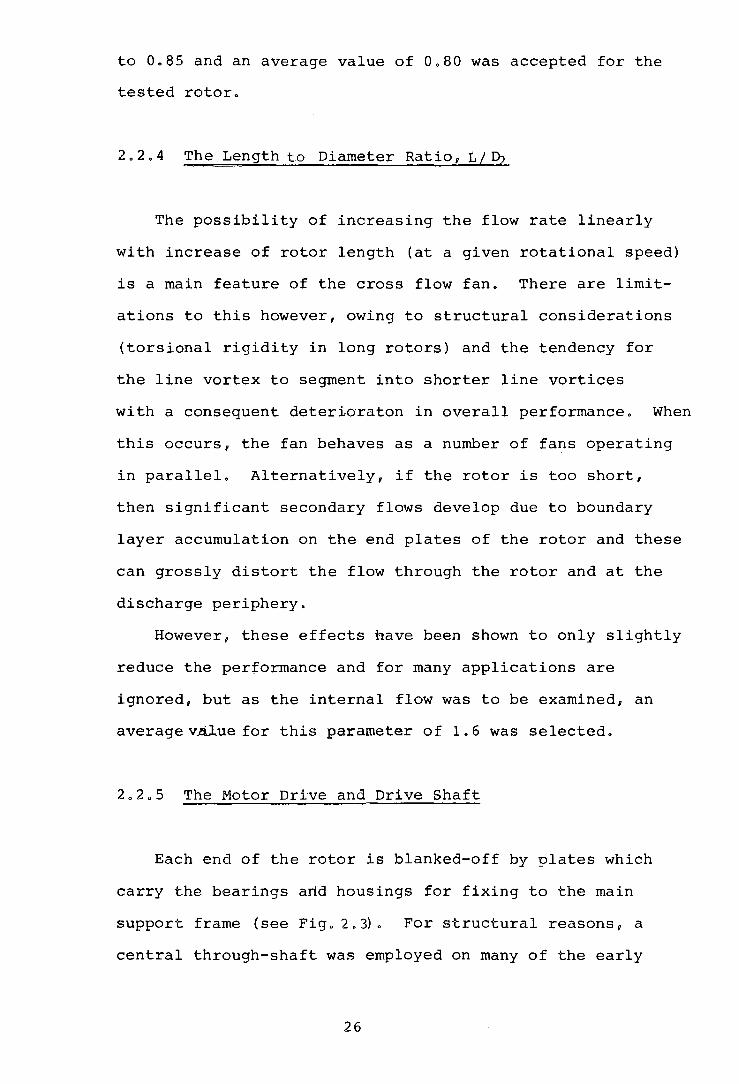
2.2.4 The Length to Diameter Ratio, L/1?;?
The possibility of increasing the flow rate linearly
with increase of rotor length (at a given rotational speed)
is a main feature of the cross flow fan. There are limit
ations to this however, owing to structural considerations
(torsional rigidity in long rotors) and the tendency for
the line vortex to segment into shorter line vortices
with a consequent deterioraton in overall performance. When
this occurs, the fan behaves as a number of fans operating
in parallel. Alternatively, if the rotor is too short,
then significant secondary flows develop due to boundary
layer accumulation on the end plates of the rotor and these
can grossly distort the flow through the rotor and at the
discharge periphery.
However, these effects have been shown to only slightly
reduce the performance and for many applications are
ignored, but as the internal flow was to be examined, an
average v.Alue for this parameter of 1. 6 was selected.
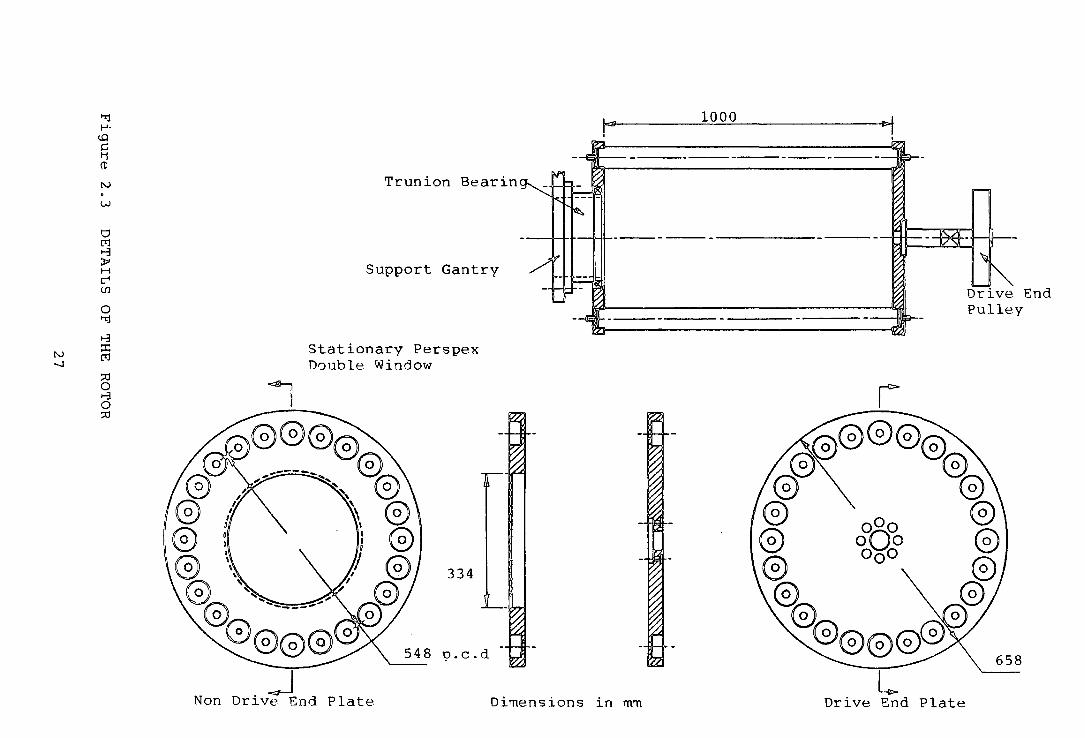
2.2.5 The Motor Drive and Drive Shaft
Each end of the rotor is blanked-off by plates which
carry the bearings and housings for fixing to the main
support frame (see Fig. 2.3). For structural reasons, a
central through-shaft was employed on many of the early
26
"'l 1-'· lO c 1'1 (tl
N
w
Cl ttl >-3 ;po H c"" (fl
0 "'l
>-3 N
::X:: (Ij
-....1
:::0 0 >-3 0 :::0
Trunion Bearin
Support Gantry
Stationary Perspex Double ~IVindow
334
o.c.d
1000
----------------------------
----------------------- -----
-~ Non Dr1ve End Plate Di~ensions in ~~ Drive End Plate
658
cross flow fans. Subsequent tests by Yl\1>11\FUJI (ref. 28)
showed that large reductions in pressure ratio and effi-
ciency would occur, mainly because of the wake generated
by the internal shaft. l-1odern units dispense with a
central shaft and rely on the blades and occasionally
diametral plates or struts at mid-span for torsional
rigidity.
The drive-end end plate includes a hollow stub
srurrt containing a strain gauge system for input power meas-
urements. The non-drive end end plate is annular and
supported on the framework by a trunnion bearing. This was
to enable measuring probes to be inserted into the fan
interior, for subsequent flow investigations. The drive to
the rotor is from a 50 h.p., 440 volt, 3 phase Schrager
motor using a belt and pulley system. The rotor speed is
variable between 5 and 16 rev. s- 1 and could be controlled
to within one per cent of that selected.
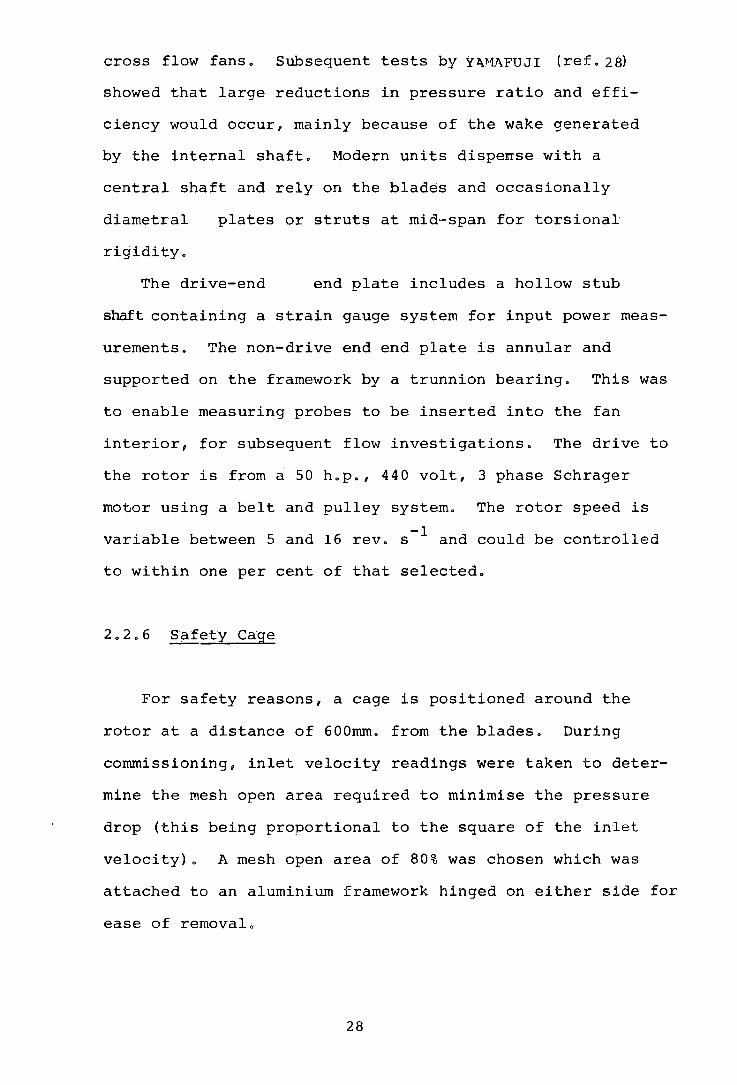
2.2.6 Safety Cage
For safety reasons, a cage is positioned around the
rotor at a distance of 600mm. from the blades. During
commissioning, inlet velocity readings were taken to deter-
mine the mesh open area required to minimise the pressure
drop (this being proportional to the square of the inlet
velocity). A mesh open area of 80% was chosen which was
attached to an aluminium framework hinged on either side for
ease of removal.
28

2.3 The Fan Casing Geometry
2.3.1 The Vortex Wall
After the discovery of the line vortex by Dr. Bruno
ECK (ref. 1~, much emphasis was placed on stabilising the
throughflow by control of the vortex. This was evident
in his designs where a return flow path was incorporated
in the vortex wall to stabilise and locate the vortex.
Also, under nolr!mal operating conditions, the vortex would
provide an aerodynamic seal preventing flow between the
high pressure and suction regions. Based on this, a small
running clearance was no longer necessary. By increasing
this clearance, the sound generated at the vortex wall
edge (mainly at multiples of the blade passing frequency)
could be considerably reduced.
COESTER (ref. 7 .) paid much attention to the vortex
wall geometry following his analytical study (see Chapter
4). Again, a recirculating path was employed generating
a jet of air with raised total pressure, which was intro
duced to the rotor just prior to the blades passing from
the vortex wall to the intake region. This addition
tended to stabilise the vortex and a much improved
pressure at low flow rates was produced.
To obtain a more uniform velocity profile at the exit
of the rotor, COESTER used a solid body as an integral
part of the vortex wall, optimising the recirculating
flow. Satisfactory results were then achieved when
employing a diffuser for pressure recovery.
29
\.
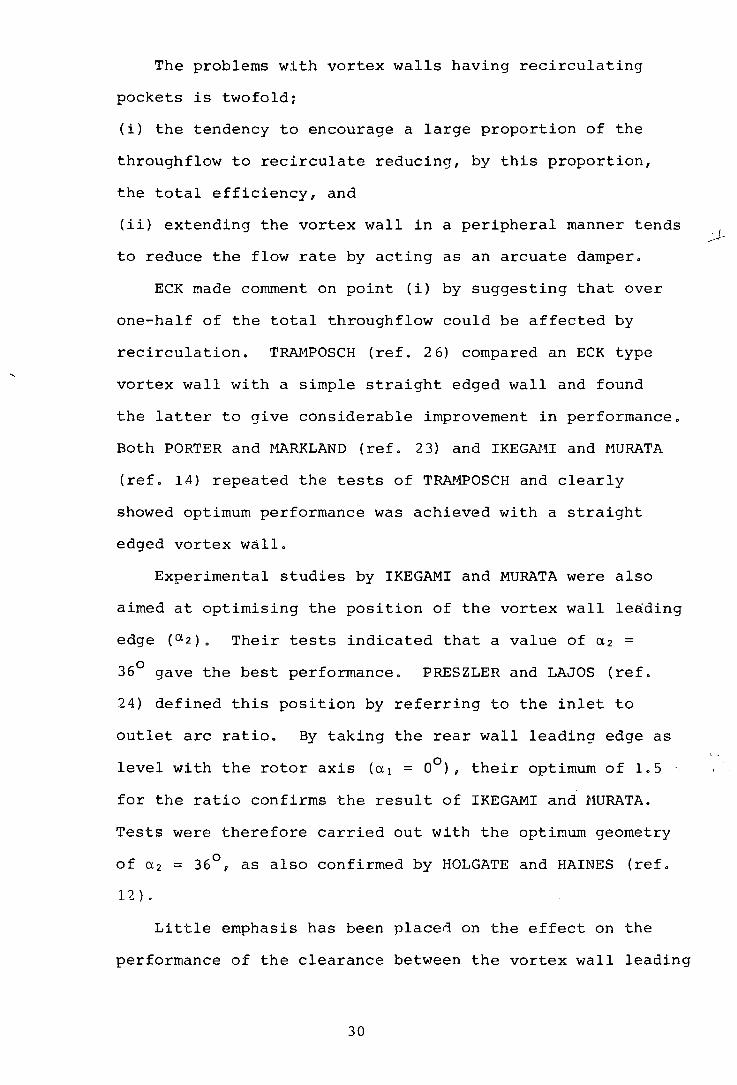
The problems with vortex walls having recirculating
pockets is twofold;
(i) the tendency to encourage a large proportion of the
throughflow to recirculate reducing, by this proportion,
the total efficiency, and
(ii) extending the vortex wall in a peripheral manner tends
to reduce the flow rate by acting as an arcuate damper.
ECK made comment on point (i) by suggesting that over
one-half of the total throughflow could be affected by
recirculation. TRA}1POSCH (ref. 26) compared an ECK type
vortex wall with a simple straight edged wall and found
the latter to give considerable improvement in performance.
Both PORTER and f''lARKLAND (ref. 23) and IKEGAMI and f'1URATA
(ref. 14) repeated the tests of TRM1POSCH and clearly
showed optimum performance was achieved with a straight
edged vortex wall.
Experimental studies by IKEGAMI and MURATA were also
aimed at optimising the position of the vortex wall leading
edge (a2). Their tests indicated that a value of a2 =
36° gave the best performance. PRESZLER and LAJOS (ref.
24) defined this position by referring to the inlet to
outlet arc ratio. By taking the rear wall leading edge as
level with the rotor axis (a 1 = 0°), their optimum of 1.5
for the ratio confirms the result of IKEGAMI and f'1URATA.
Tests were therefore carried out with the optimum geometry
of a 2 = 36°, as also confirmed by HOLGATE and HAINES (ref.
12 ) .
Little emphasis has been placen on the effect on the
performance of the clearance between the vortex wall leading
30

edge and the bladesv since ECK suggested the existence of
the aerodynamic seal. IKEGAMI and MURATA followed this by
showing performance and efficiency could be increased by
reducing the clearance below e 2 /D2 = 3%, with the associ-
ated increase in noise generation.
The original research pursued by HOLGATE and HAINES
(re£.12), indicated a trade-off between the performance
and efficiency for clearances below 5%. Following this
earlier controversy surrounding the function and geometry
of the vortex wall, there now seems little doubt that a
simple straight wall with a rounded leading edge produces
good fan performance and an acceptable level of noise.
For the aerodynamic rig tested the vortex wall followed 0
the above recommendations with a2 = 36 and e 2 /D2 = 4%.
2.3.1.1 Stiffening of the Vortex Wall Leading Edge
From original tests, the vortex wall was observed to
vibrate violently, at low flow rates i.e. high throttling,
because of the relatively long unsupported span. These
unwanted vibrations were successfully removed by the
addition of a 25° stiffening wedge. However, subsequent
tests showed the wedge to have a small effect on the per=
formance; acting primarily as an arcuate damper. More
irnportantv the internal flow field was significantly dis-
torted by the wake produced by this obstructionv in what
is known to be a high velocity region of the suction arc.
For this reason v the stiffeninc:r wedc:re 'if7as removed and is
not recommended for flow rates above ¢ = 0.4.
31
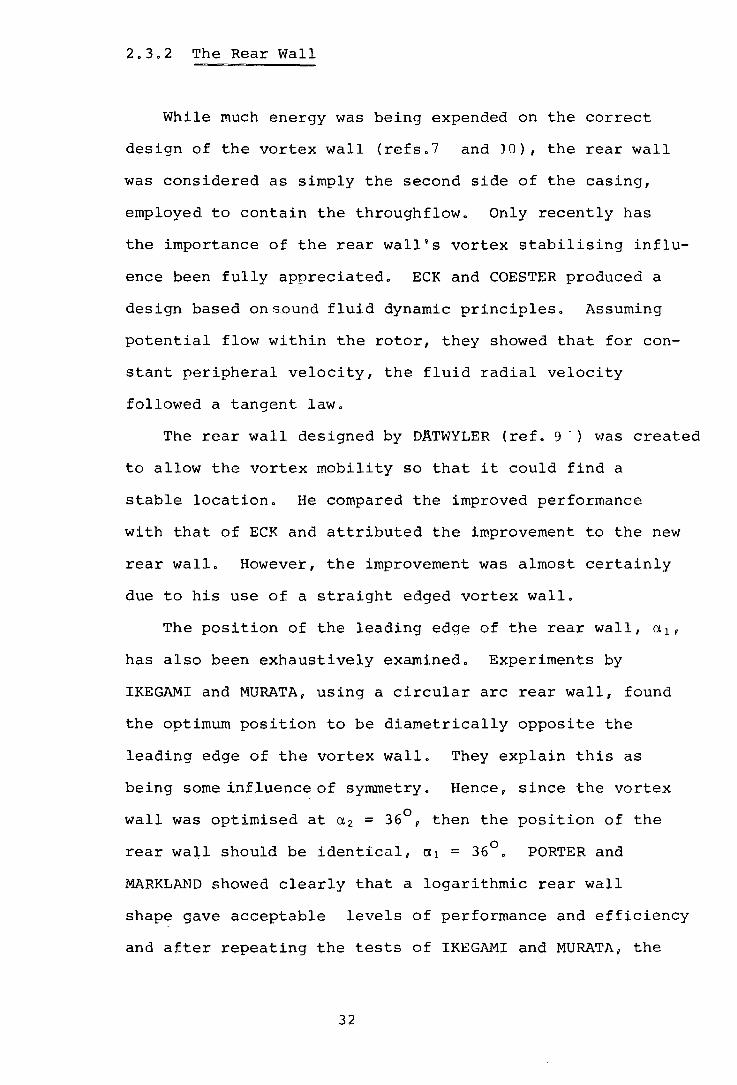
2.3.2 The Rear Wall
While much energy was being expended on the correct
design of the vortex wall (refs.7 and JO), the rear wall
was considered as simply the second side of the casing,
employed to contain the throughflow. Only recently has
the importance of the rear wall's vortex stabilising influ-
ence been fully appreciated. ECK and COESTER produced a
design based on s.ound fluid dynamic principles. Assuming
potential flow within the rotor, they showed that for con-
stant peripheral velocity, the fluid radial velocity
followed a tangent law.
The rear wall designed by DATWYLER (ref. 9-) \'las created
to allow the vortex mobility so that it could find a
stable location. He compared the improved performance
with that of ECK and attributed the improvement to the new
rear wall. However, the improvement was almost certainly
due to his use of a straight edged vortex wall.
The position of the leading edge of the rear wall, a 1 ,
has also been exhaustively examined. Experiments by
IKEGAMI and MURATA, using a circular arc rear wall, found
the optimum position to be diametrically opposite the
leading edge of the vortex wall. They explain this as
being some influence of symmetry. Hence, since the vortex
wall was optimised at a 2 = 36°, then the position of the
0 rear wall should be identical, ~ 1 = 36 . PORTER and
MARKLAND showed clearly that a logarithmic rear wall
shape gave acceptable levels of performance and efficiency
and after repeating the tests of IKEGAMI and MURATA, the
32
positioning of the rear wall leading edge at a 1
seemed to agree with their findings.
HOLGATE and HAINES found that diffusion becaMe too
great when a logarithmic spiral rear wall was used with
its leading edge diametrically opposite the leading edge
of the vortex wall, leading to flow separation and reversal.
To combat this problem, a logarithmic spiral was developed
from the leading edge at a 1 = 0° but with a circumferential
extension attached to the leading edge extending forwards
0 to a1=20 • They also showed the profound effect of the
rear wall clearance on the performance and the stability
of the flow in the outlet duct, and suggested a value
between 3% and 5% of the rotor diameter should give
optimum conditions.
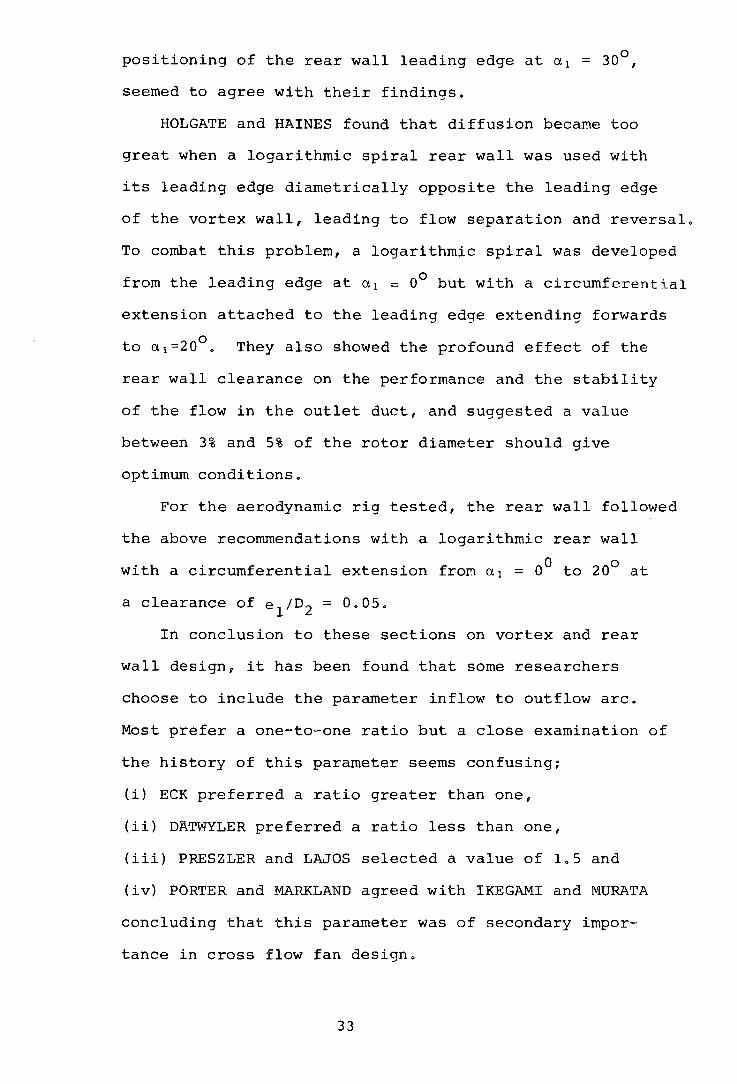
For the aerodynamic rig tested, the rear wall followed
the above recommendations with a logarithmic rear wall
0 0 with a circumferential extension froM a 1 = 0 to 20 at
a clearance of e1;o2 = 0.05.
In conclusion to these sections on vortex and rear
wall design, it has been found that some researchers
choose to include the parameter inflow to outflow arc.
Most prefer a one-to-one ratio but a close examination of
the history of this parameter seems confusing;
(i) ECK preferred a ratio greater than one,
(ii) DATWYLER preferred a ratio less than one,
(iii) PRESZLER and LAJOS selected a value of 1.5 and
(iv) PORTER and MARKLAND agreed with IKEGAMI and MURATA
concluding that this parameter was of secondary impor-
tance in cross flow fan design.
33

In the sense of a fluid flowing into and out of the
rotor, this parameter is quite meaningless. Flow visual
ization studies described in Chapter 3, show how the
inflow and outflow arcs are largely dependent on the flow
rate and should not be confused with the geometrical arcs,
although some dependency is present.
2.3.3 Outlet Duct Diffuser
Like many early experimenters, ECK and PORTER and
MARKLAND use a diffusing section attached to the fan out
let duct, and maintain that the efficiency of the fan stands
or falls by the effectiveness of such a diffuser. The
effectiveness of a diffuser is greatly reduced by the
presence of a strongly non-uniform velocity and pressure
distribution at its entrance. As the vortex lies partly
in the outlet duct, the velocity profile at the fan dis
charge is far from uniform. COESTER recognised this fact
incorporating recirculation pockets, producing a more
uniform outlet velocity profile before entry to a short
diffusing section. DATWYLER used no diffusing section as
he accepted that the diffusion of the flow takes place
mainly in the region enclosed by the rear wall which acts
as a volute, plus the natural diffusion due to the vortex
location.
Investigations by TRAMPOSCH indicated that only minor
improvements could be achieved by using a diffuser and
similar tests by PRESZLER ann LAJOS showed that although
the static pressure did increase, it did so at the expense
34

of the total pressure and the efficiency, especially in
the normal working range of the fan (greater than¢= 0.5).
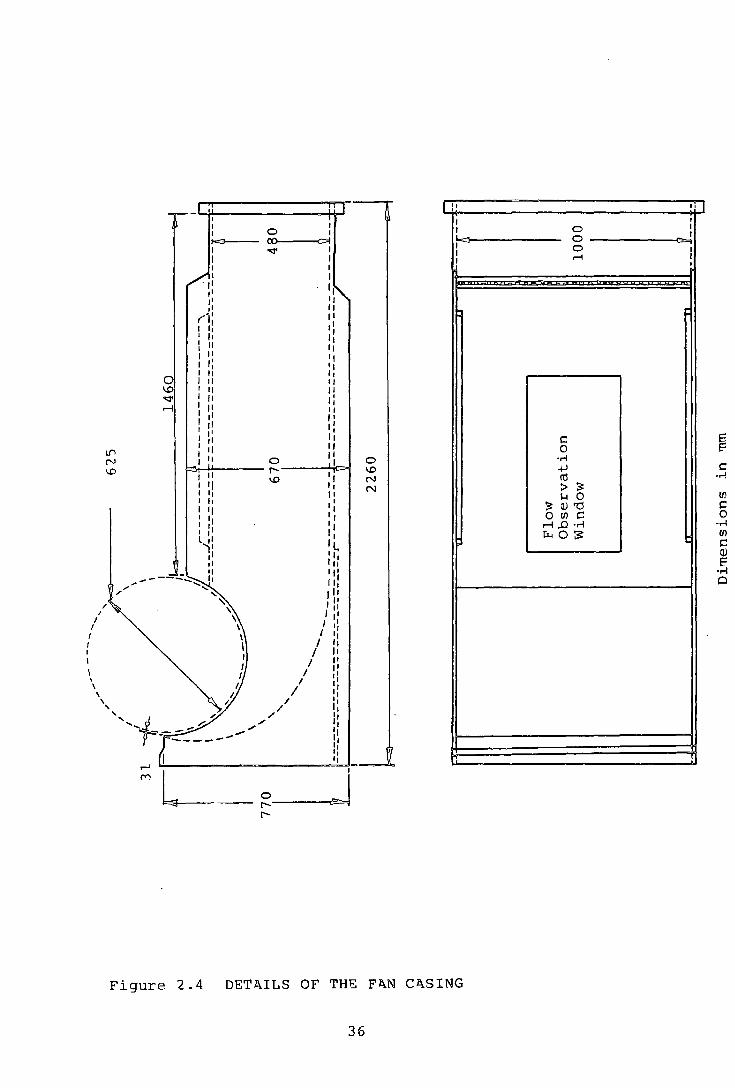
For these reasons, the surrounding ductwork of the fan
tested (as shown in Fig. 2.4) contains no diffuser and has
a simple parallel sided outlet duct.
2.3.4 Wind Tunnel Working Section Outlet Diffuser
The air from the test section was originally allowed
to pass to atmosphere by means of a sudden expansion. The
maximum flow rate through the 'fan was reduced because of the
considerable pressure drop experienced. A pyramid diffuser
0 with a cone angle of 14 and an area ratio of two positioned
at the outlet of the working section had the effect of
increasing the flow rate to in excess of ¢ = 1.0. A simple
iris shutter system attached to the downstream end of the
diffuser allowed the flow rate to be set with fine resolu-
tion to better than 1%, without unduly affecting the velo-
city profile in the working section.
2.3.5 Pressure Tappings.
Four symmetrically placed pressure tappings holes
with brass inserts were located in the casing in a plane
three rotor diameters downstream from the leading edge of
the vortex wall. These were connected to a manifold and
the mean response used to calculate the static pressure
rise from the fan and hence the static pressure coefficient
'!' • s
35
1.{"1
'"'' 1.0
I
I I 1-Gl I .,. I I I
·rl II II II
,...-,: I II I ,, " II
1: 0
II II
1.0 II .,. II rl " II ,,
I' tl II II 0
!"--1.0
II .: ~ ~~--------------~----------~·~~
M L--~----, !"--
I i' I I
I I I
0 1.0 N N
Figure 2.4 DET~ILS OF THB F~N C~SING
36
0 0 0 rl
c 0
·.-l ...., ro :> ~ 1-l 0
~ il)'"CJ o rn c rl ..0 ·.-l li<O~
,, I I I I ~
I I I
I
1/)
c 0
·.-l rn c Q) e:
·.-l 0
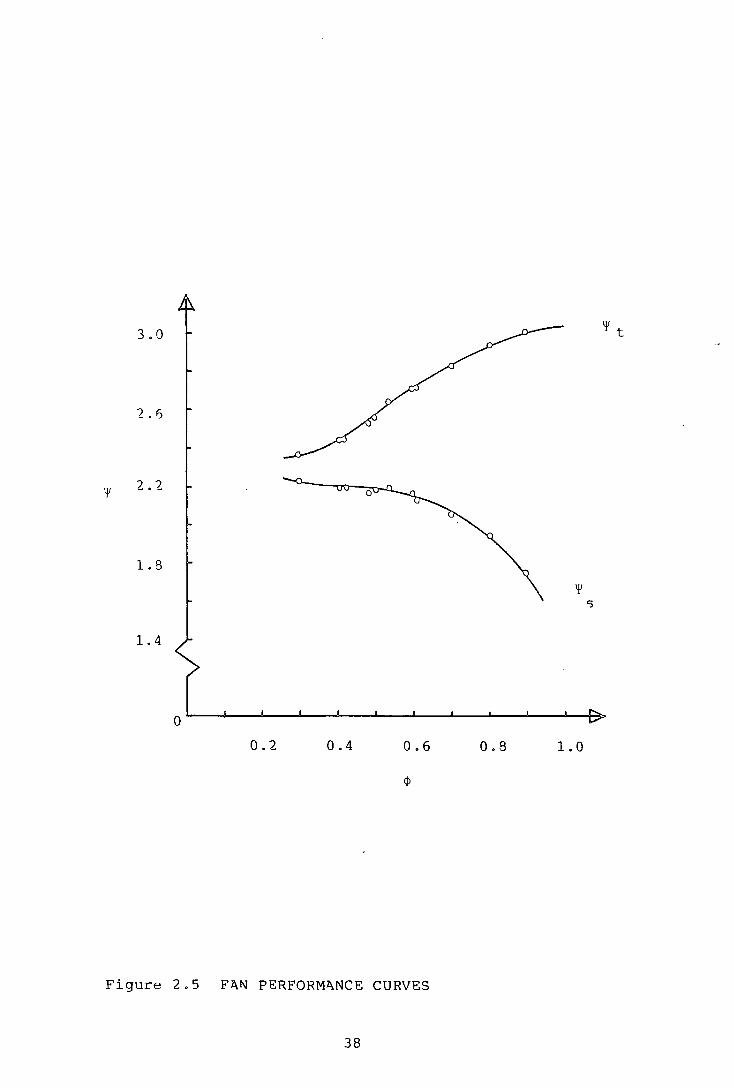
The test section of the wind tunnel had been previously
calibrated in terms of the flow rate related to the centre
line velocity, from which the flow coefficient ¢ and the
total pressure coefficient ~t was easily determined.
The perforMance curves for the fan tested (at a
-1 rotational speed of 6.67 rev. s ) in terms of these
parameters are shown in Fig.2.5. It can be seen that the
design requireMent is met and subsequent data will be rel-
ated to these curves.
2.4 The Aerodynamic ~asurernents
The experiments performed on the aerodynamic facility
previously described detailed the internal flow regime of
a large cross flow fan. Measurements of velocity, direc-
tion and total pressure were transformed into streamlines
for the purpose of illustration together with corresponding
variations of a total pressure coefficient t, throughout
the flow field.
From these results, general conclusions were made
which assisted with the development of an ,improved theore-
tical model (see Chapter 4).
2.4.1 Determination of Volume Flow Rate
The centre line velocity in the wind tunnel working
section was calibrated by HOLGATE and HAINES (ref. 12)
against the velocity obtained from a 26 point traverse
across the fan exit ductwork at a section three rotor d~-
~~ters downstream from the vortex wall leading edge (in
37
3.0
'2.6
'2.'2
1.8
1.4
0
0.2 0.4 0.6
<P
Figure 2.5 F~N PERFORM~NCE CURVES
38
'¥ t
'¥ c;
0.8 1.0
the same plane as the static pressure tappingrin~. This
is a reduced form of the B.S. 1943, 48 point traverse.
This was checked using the pyramid diffuser previously
described to achieve different flowrates. The velocity
profile across the working section was maintained during
this calibration to ensure that no distortion occurred due
to the throttling hardware downstream.
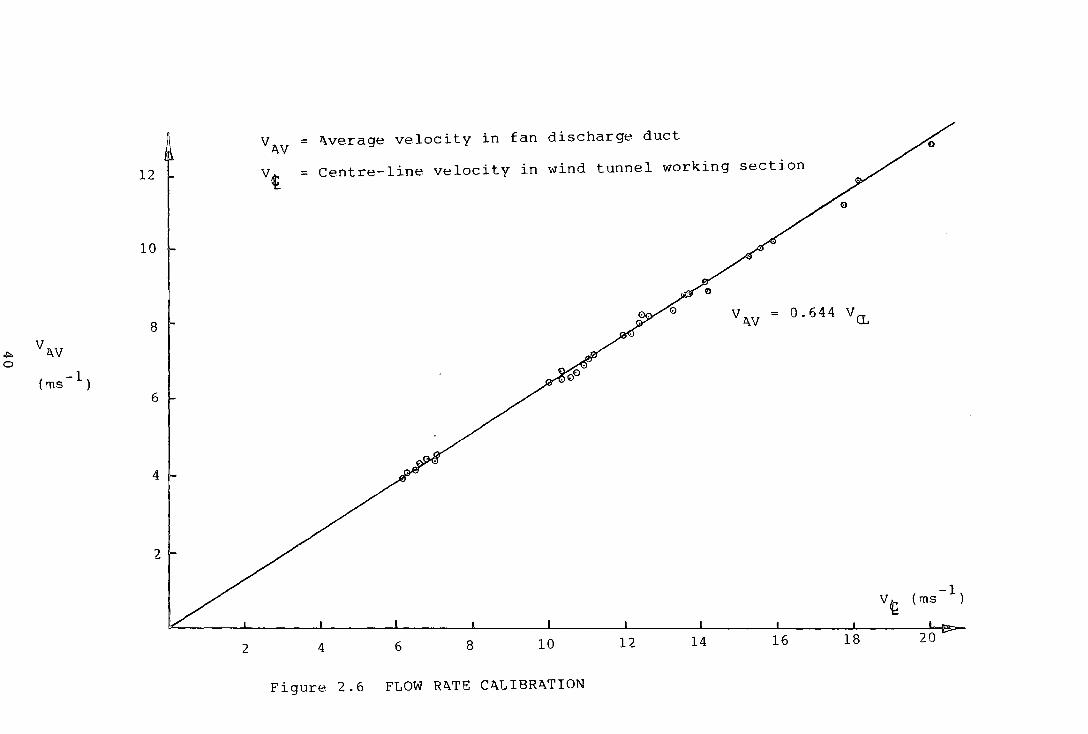
The flowrate was determined from a single centre=line
reading in the working section and using the calibration
chart (see Fig.2.6) the flowrate was expressed in dimension-
less form.
<P = Q L D U ' 2 2
where Q = flow volume flowrate m3s- 1
L = rotor length m,
= rotor outer diameter m and
-1 = outer periphery blade tip speed ms
A least squares fit of the data points from the cali-
bration chart yielded
VAV = 0.644 Vet
which is very close to the result obtained by taking
the ratio of the working section area to the fan outlet
duct area of 0.64.
2.4.2 Determination of Pressure Rise
The static pressure rise across the fan was determined
from a rinq of four nressure taopings located one on each
side of the exit ductwork at a section three rotor
39
VAV "A..verage velocity in fan discharge duct
12 v~ Centre-line velocity in wind tunnel working section
10
8 vr,.v 0.644 va..
,!::>. vr,.v 0
-1 ( ms )
6
4
2
vt (rns-1
)
2 4 6 8 10 12 14 16 18 20
Figure 2.6 FLOW R"A..TE C"A..LIBR"A..TION
diameters downstream from the vortex wall leading edge.
The tappings were connected to a manifold from which a
central connection provided the mean pressure response at
this section. The velocity profile at this section
showed to be substantially uniform indicating a uniform
pressure variation. The static pressure rise was expressed
in dimensionless form.
where p s
If' = Pss J.: P u2.
2 2
= static pressure rise P , a -3 = density of air kgrn ,
-1 = outer periphery blade tip speed ms
By measuring the velocity in the working section and
relating this to the velocity in the fan exit duct, the
2 velocity pressure~ pVAV was calculated and added·
dimensionlessly to the static pressure coefficient, yielding
the total pressure coefficient lf't.
2.4.3 Determination of Power Input and Efficiency
Although efficiency was not a prime parameter in this
research, the facility for its assessment was available.
The power input to the fan was determined by measurement
of the torque on the drive=end shaft between the drive
pulley and the end plate. Two pairs of strain gauges
bonded diametrically opposite each other (eliminating
bending and axial strains) and connected via slip rings
to a full wheatstone bridge 6 produced microstrain signals.
The power input was easily determined from
41
PIN = torque x speed
and the efficiency calculated from
n = Q Pt t . Torque x speed
2.4.4 The Rotor Rotational Speed
A bakelite disc containing sixty symmetrically spaced
soft iron segments was mounted on the drive-end shaft. A
magnetic transducer fixed to the support frame and held
in close proximity to the periphery of the disc, produced
a direct reading in revolutions per minute on a standard
timer-counter unit. The control circuity associated with
the Schrager motor, ensured the rotor speed did not drift
by more than one per cent from that selected.
2.4.5 Instrumentation
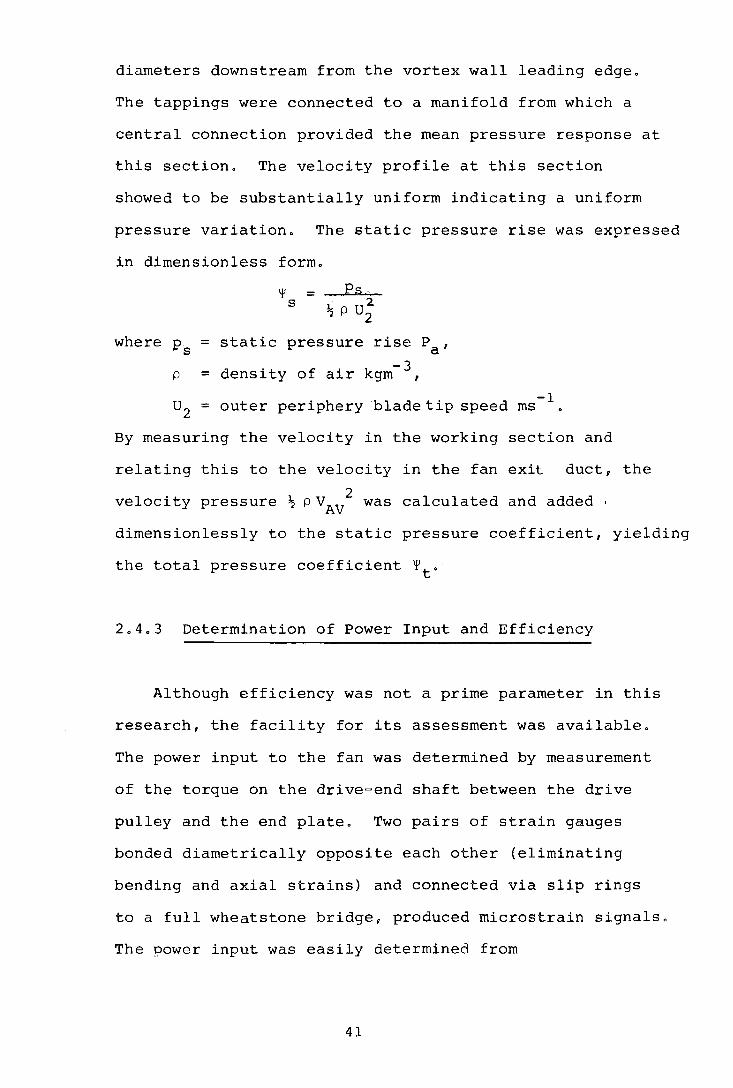
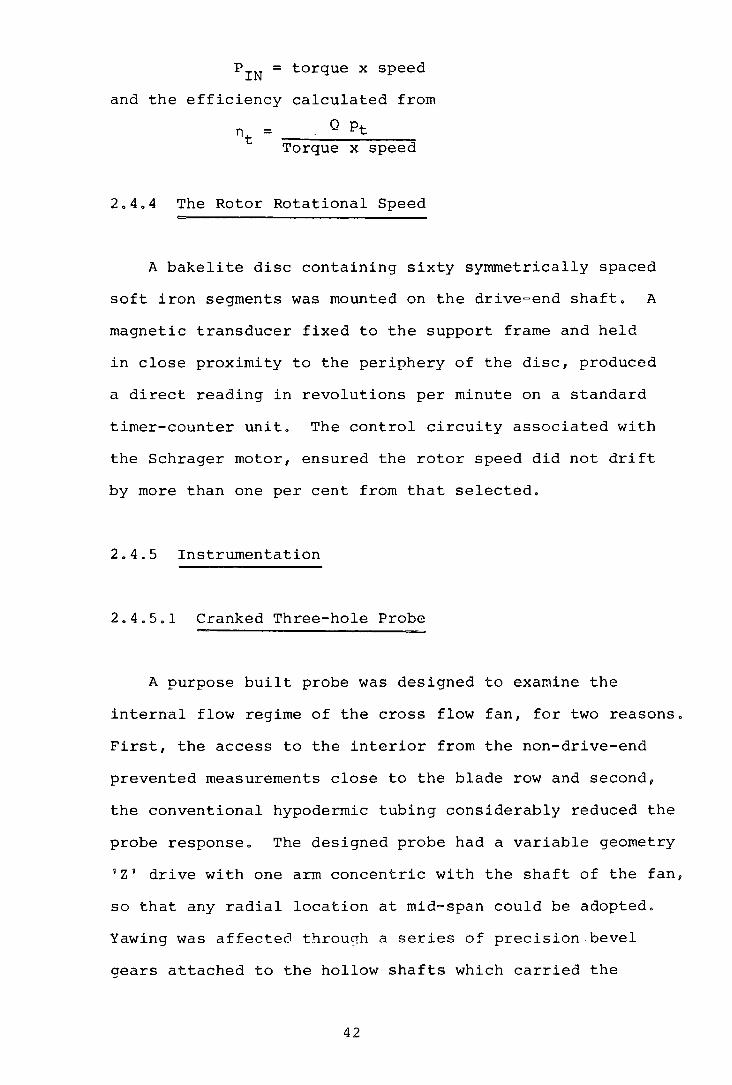
2.4.5.1 Cranked Three-hole Probe
A purpose built probe was designed to examine the
internal flow regime of the cross flow fan, for two reasons.
First, the access to the interior from the non-drive-end
prevented measurements close to the blade row and second,
the conventional hypodermic tubing considerably reduced the
probe response. The designed probe had a variable geometry
1 Z' drive with one arm concentric with the shaft of the fan,
so that any radial location at mid-span could be adopted.
Yawing was affecte0 throuqh a series of precision bevel
gears attached to the hollow shafts which carried the
42

pressure tubes. Flexible tubing was used where direction
changes occurred through the bevel gears.
The probe head was manufactured using a 'nest' of five
hypodermic tubes arranged so that three of the internal
tubes formed the conventional geometry for a yaw probe,
i.e. the angle between the central and outer tubes being
40°. To combat the problems associated with drilling the
0.3mm diameter pressure taps, a section of the probe head
was milled revealing the three tubes. This was filled with
transparent resin creating a window and after allowing to
set, the holes were drilled at the required angles without
the drill slipping on the cylindrical surface. A short
distance away from the head, the nest of tubes was connected
to three large bore tubes for the remainder of the run
through the probe unit. This considerably improved the
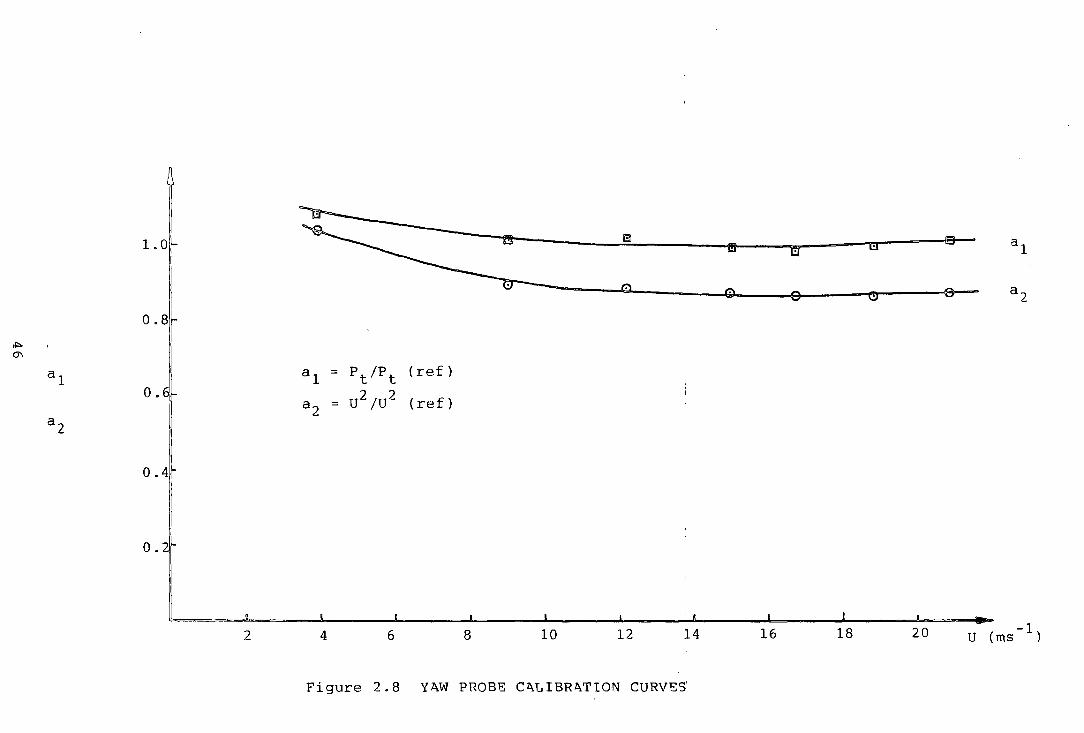
pressure response rate. The probe is shown in Fig.2.7with
its calibration curves presented in Fig. 2. 8.
2.4.5.2 The Traversing Mechanism
The traversing equipment was mounted adjacent to the
opening provided by the non-drive end plate. This cons-.
isted of a bezel mounted on a slide which was in turn atta
ched to a second bezel aligned with the centre-line of the
rotor, as illustrated in Fig. 2.9.
The probe was positioned within the rotor and a key
on the probe body was allowed to travel in a slot milled
in a pair of circular 9erspex windows which sealed the fan
interior from atmosphere. A key on the probe shaft ensured
43
Figure 2.7(a) THE CRANKED YAW PROBE
44
:;: Q.) ~ u t/)
tTl c:
·r-l ......! ..-l
Q.) :>
Q.) N Q.) [!!
l~\ i' 1~ IJ T--r::t~t::;~ ===::,_tt:_ ~~t::J~ ~r-
rN
: I I nh : nh
I
I r
I
co I 1.[) ~ 1 ',.' 1 r 'X" 11
r.-----------~$~ lt:.-'>~-r.J.-:.._>11 1 I I II
I I I
1 I : : I I :
-r- 0
I <2+.1 ,..----.... -=:; 8_
,"'t-\ I 'I I'' p r- r : 'r ~~---f~ ----------Nrr-+;-----+L~~~:+~+~4----~- -~---------~
/-- --l I ,I , "'>' ~-- ---'~'I 'J ~'' ~ n..' , _.._ ___ ... __
~-fr ~- -- --_...._-It!:~~- to"-~ I I I I
: I I I I I I : l r;;-~- -1.--..
.{1---JA.:.I ,_>~ ..... :....._./.!:: ;_ .. ~::,.~----~-=.------"""_l'l__
'0 ro Q.)
::c Q.) .D 0
0
1-J p., ,~:; ----L-
N M
'-'-.,.~- f:-~d _ ___£ 1--- :e""--~r-.lt:--h'
L ,:,.-.r---,., ,1 ~-- _;;:~o
r,.J .,~', , 1/ 1 '\-- _ _,, ----------- _ _, ____ I "i" I :
-r ------------ ,-,?,----~, ,.,f,il\ I
.__..c: ,t',l I, ,r '~" 1 - L - r==lf-=:---:-- ~ I e
Figure 2.7(b) THE CR~NKED Y~W PROBE
45
'1:i---._
1.0 ~ a : a1 : e : 0 a2 0
ol:>. 0'1
a1 a1 Pt/Pt (ref)
0. a2 U2/U2 (ref)
a2
0.4
0.
2 4 6 8 10 12 14 16 18 20 -1 U (ms )
Figure 2. 8 Y"A.W PROBE CAL I BRAT ION CURVES'
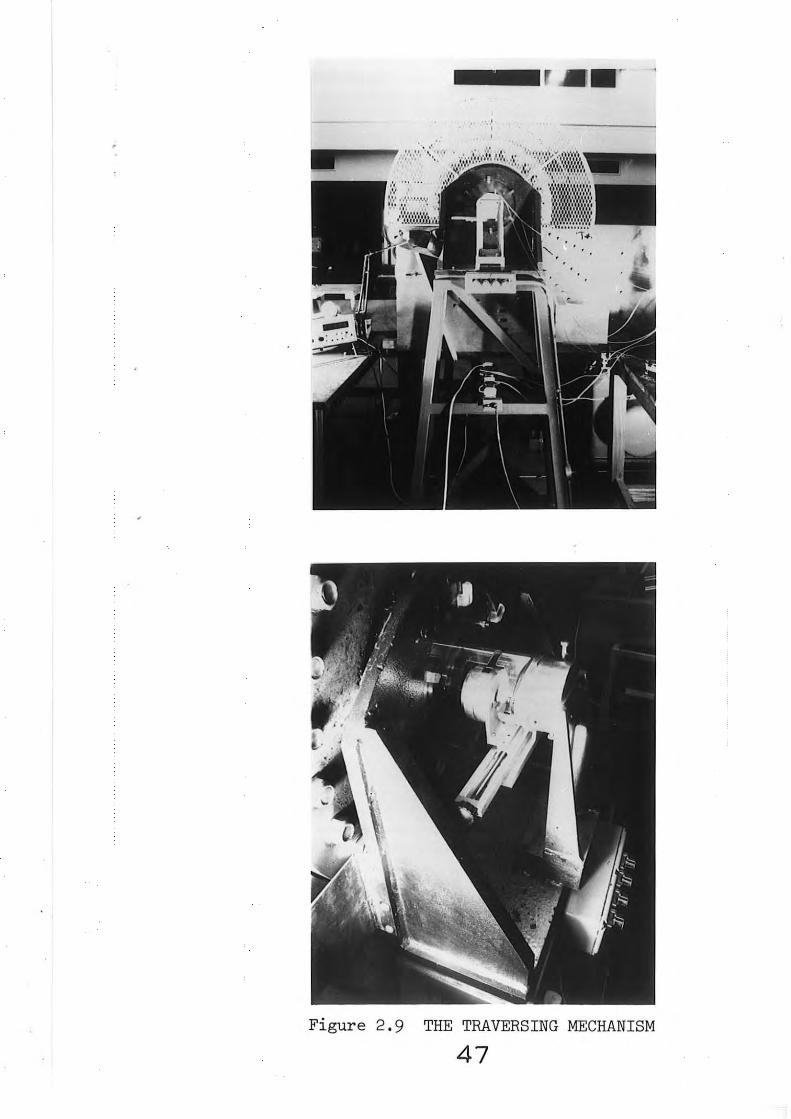
Figure 2.9
- r • ......... ., ........... , .• . ''(J (1~ ••• ·.········~ •' 1'1~1t\1i.'t't'•'•'••'• ····· ····•Itt I tlf f llt II
I • II I 11
.
·,•,·1·'•'•'•'•'•'' IJ llfltt1t
~ ··~····· ~ ·. '•'•' •'fJ' '•'•• ~·.· •'I, ••. •.•.•.•.•.•,• ·············· '14.
THE TRAVERSING MECHANISM
47
the centre hole of the probe head maintained the same
angular orientation to the scale on the bezel at all times.
The probe bezel is shown in Fig. 2.10.
Diametral wires attached to the fan blades allowed the
probe head to be levelled with the centre-line of the
totor by means of three small jacking screws and provided
the zero reading on the slide scale.
With this traversing geometry, the probe head could be
positioned at any desired polar co-ordinate. The probe
bezel was used to null the side tapping pressures and the
flow veToci ty determined in the u-sual -manner. This bezel
was always rotated in the same sense during calibration in
the working section and whilst traversing the fan interior
to avoid any angular hysterisis that may have been present.
2.4.5.3 The Measurement of Pressure
All pressure measurements were made using microman-
ometers filled with silicon oil as manufactured for general
department use. These instruments are accurate to + O~:Olmm
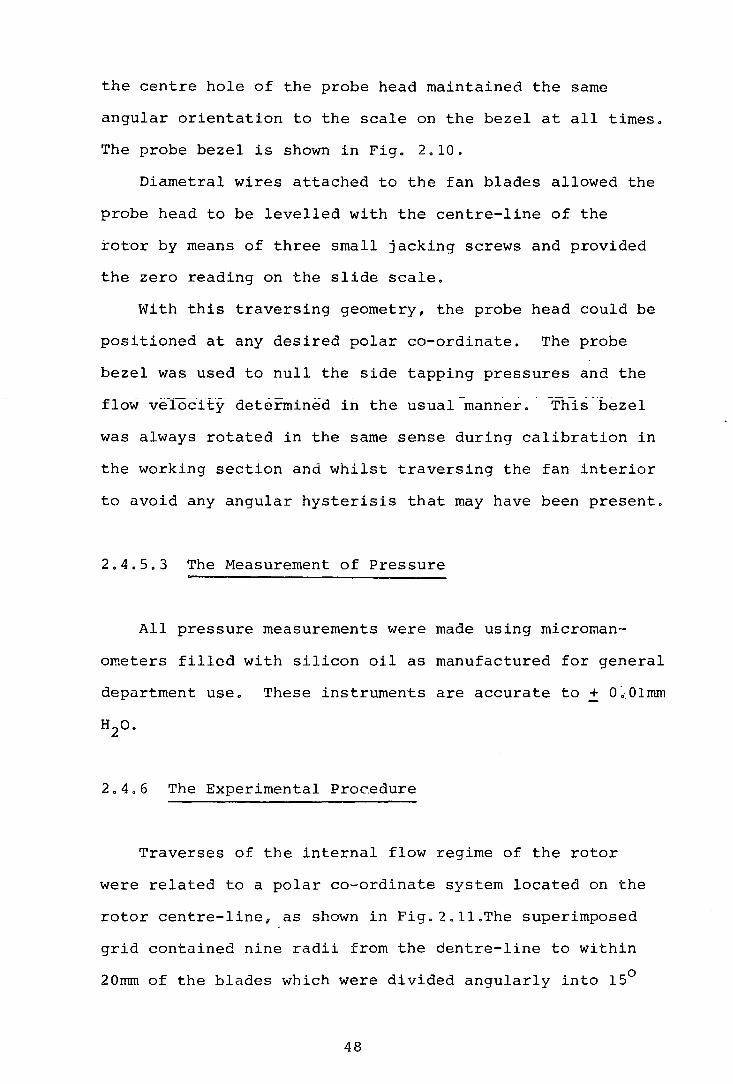
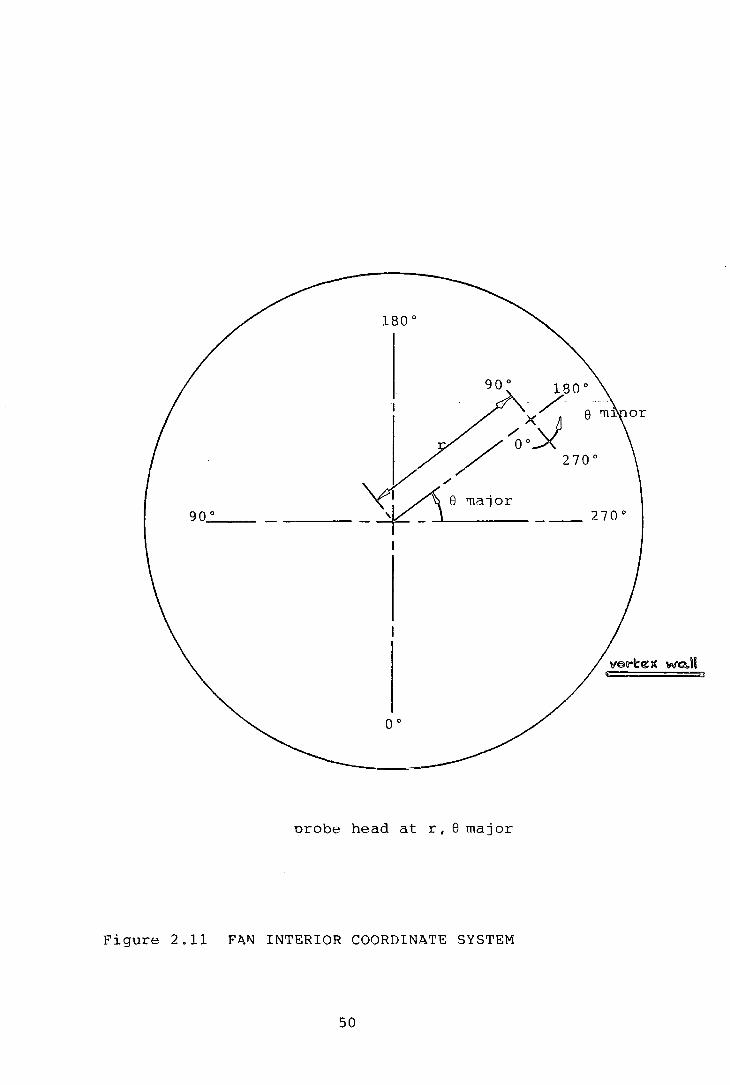
2.4.6 The Experimental Procedure
Traverses of the internal flow regime of the rotor
were related to a polar co~ordinate system located on the
rotor centre-line, as shown in Fig.2.ll.The superimposed
grid contained nine radii from the dentre-line to within
20mm of the blades which were divided angularly into 15°
48

~~
'<:!' ....-4
co ....-4
I I
rrjiJ
4!~ 1 I
N '<:!'
0 co
49
:;:.... I
ro I I
~ I I I
(!) I
::.::: I I I I (!)
.0 0 1-1 0...
0 co
E E c:
·r-l
If)
c: 0
·.-! If)
c: (!)
!? ·.-! Cl
._J l:il N l:il CD
E-t p::; 0 0.... p.. :::> U'l
w co 0 p::; 0...
w ::r: E-t
li-< 0
z 0 H E-t u :::> p::; E-t r.J)
z 0 u
0 ....-4
N
(!) 1-l ::l tn
·r-l li-<
90_0 __
oo
orobe head at r, 8 major
Figure 2.11 F~N INTERIOR COORDINATE SYSTEM
50
sectors. To yield a: :more comprehensive picture in the
quadrant containing the vortex, the step size was reduced
0 to 5 •
At each position in the polar grid, the probe head was
yawed by means of the probe bezel, to null the pressures
present at the two ~ide tappings. Measures were then
obtained of:
(i) the angle of the flow relative to a radial line between
the fan centre-line and the probe head,
(ii) the velocity of the flow and,
--(iii) the total pre-ssure of the flow.
In some cases, especially in the quadrant containing the
vortex, difficulty was found in assessing the predominant
flow direction. To combat this problem, a series of tufts
were connected freely to the shaft of the probe head, so
that a visual indication of flow direction and quality was
available.
The internal flow regime was examined at five flow
coefficients between ~ = 0.4 and 0.8 as this overlaps the
general operating range of this type of fan. As complete
traverses of the internal region took several days, it
was important to maintain a fixed flow rate throughout.
The iris shutter system attached to the pyramid diffuser
allowed fine control over this parameter.
51

2.4.7 The Calculation of Results
2.4.7.1 The Calculation of Stream Function
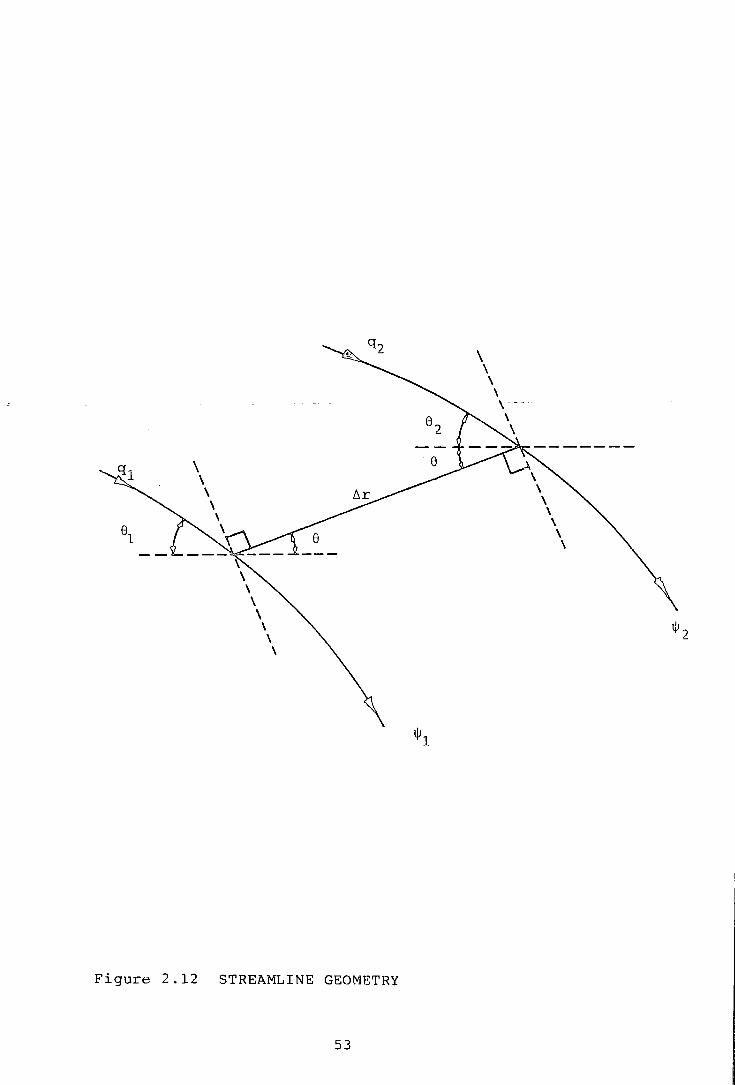
For a comparison with previous studies the streamline
pattern in the rotor was required. Fig.2.12shaws~wo adja-
cent streamlines associated with stream functions w1 and w2'
with local velocities of q 1 and q 2 and making angles of
81 and 82 with respect to a radial line in the co-ordinate
system. The streamlines are separated by the small radial
distance f:..r, with the origin of the polar co-o~~lin~te system
on the rotor centre-line. By definition
where, d is the normal distance between the streamlines n
and
u = ~{q 1 sin(8 + 81 ) + q 2 sin(8 + 82 )}
therefore,
The stream function for the streamline crossing the rotor
axis was arbitrarily chosen to be zero. The radial and
tangential components of the velocities may be related to
the stream function by the expressions:
ow = =rV 08 r (1)
and ow = v8 ( 2) rr
From the experimental resultsv all the velocity and
direction data were transformed into radial and tangential
components, so that the above expressions could be used
52
ljJ 2
Figure 2.12 STREAMLINE GEOMETRY
53
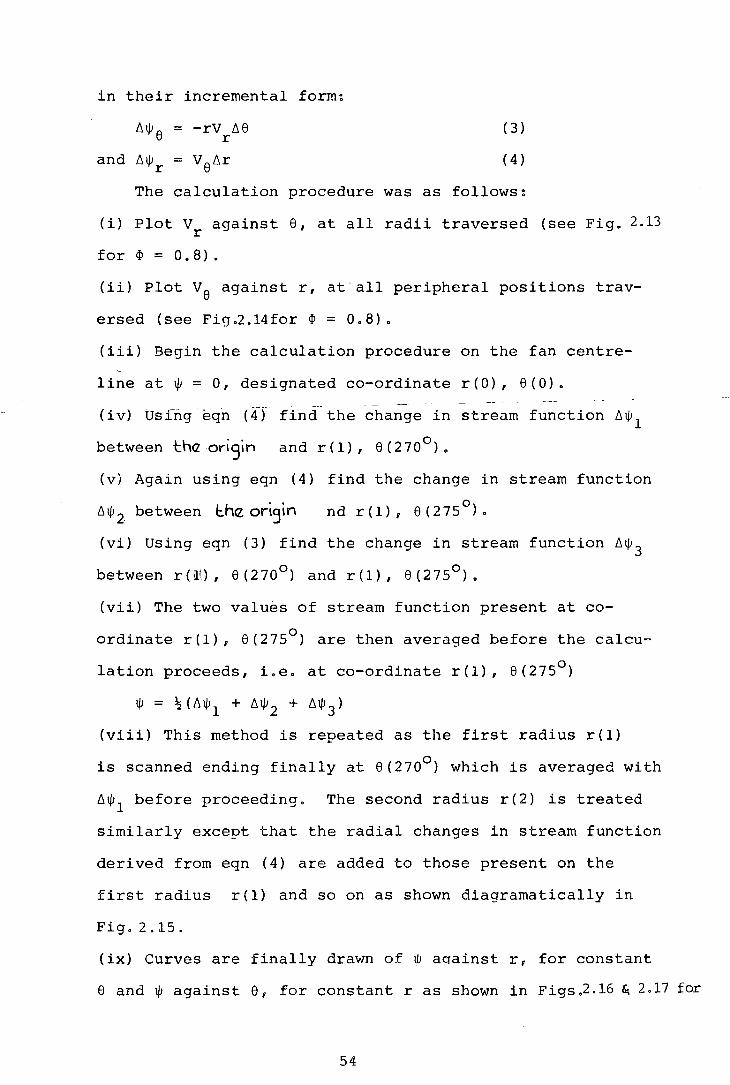
in their incremental form:
-rv 118 r
( 3)
( 4)
The calculation procedure was as follows:
(i) Plot V against 8, at all radii traversed (see Fig. 2.13 r .
for ¢ = 0.8).
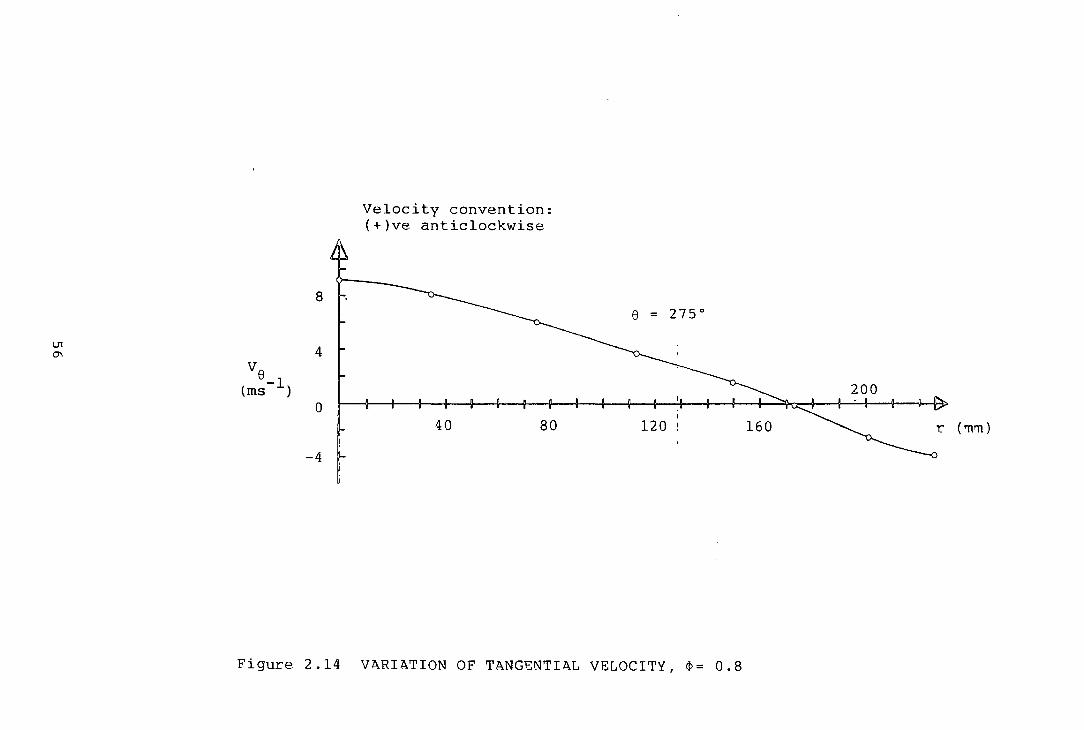
(ii) Plot v8 against r, at all peripheral positions trav
ersed (see Fig.2.14for ¢ = 0.8).
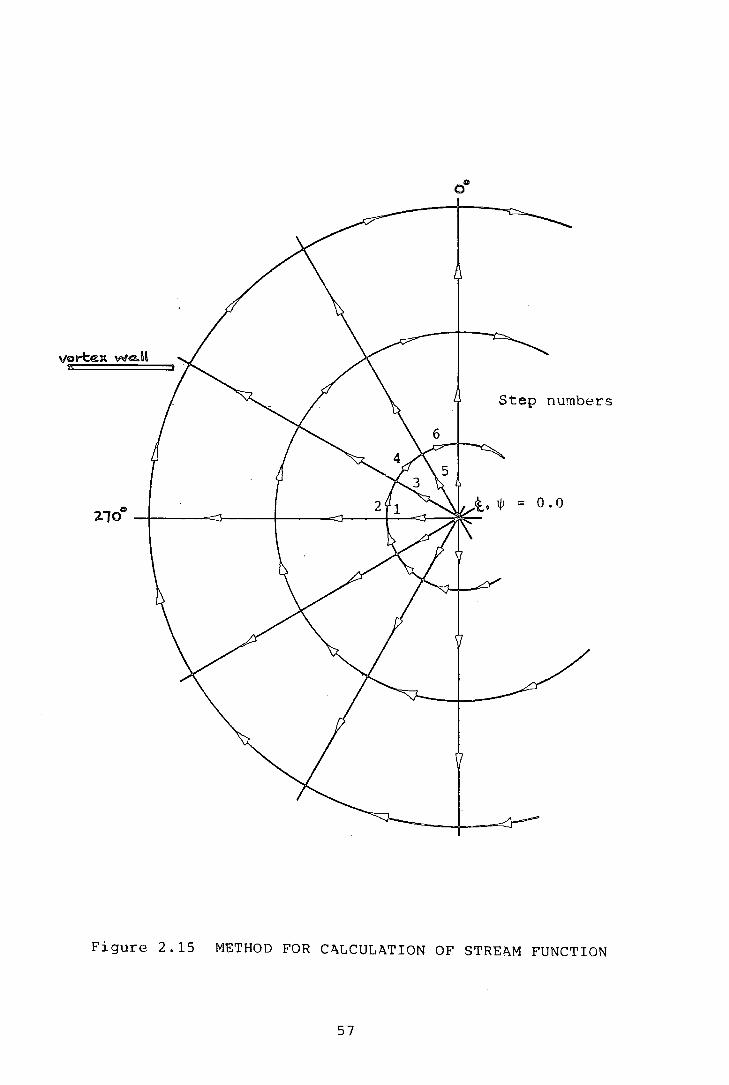
(iii) Begin the calculation procedure on the fan centre-
line at~= 0 1 designated co-ordinate r(O) 1 8(0).
(iv) Us1ng eqn (4) find the change in stream function 11~ 1 between th<Z origin and r ( 1) , 8 ( 2 70°) •
(v) Again using eqn (4) find the change in stream function
11~ 2 between t.hcz origin nd r(1) 1 8 (275°).
(vi) Using eqn (3) find the change in stream function 11~ 3 between r(M), 8(270°) and r(1) 1 8(275°).
(vii) The two values of stream function present at co
ordinate r(1), 8(275°) are then averaged before the calcu
lation proceeds, i.e. at co-ordinate r(1), 8(275°)
~ = ~(11~1 + 11~2 + 11~3)
(viii) This method is repeated as the first radius r(1)
is scanned ending finally at 8(270°) which is averaged with
11~ 1 before proceeding. The second radius r(2) is treated
similarly except that the radial changes in stream function
derived from eqn (4) are added to those present on the
first radius r(l) and so on as shown diagramatically in
Fig. 2.15.
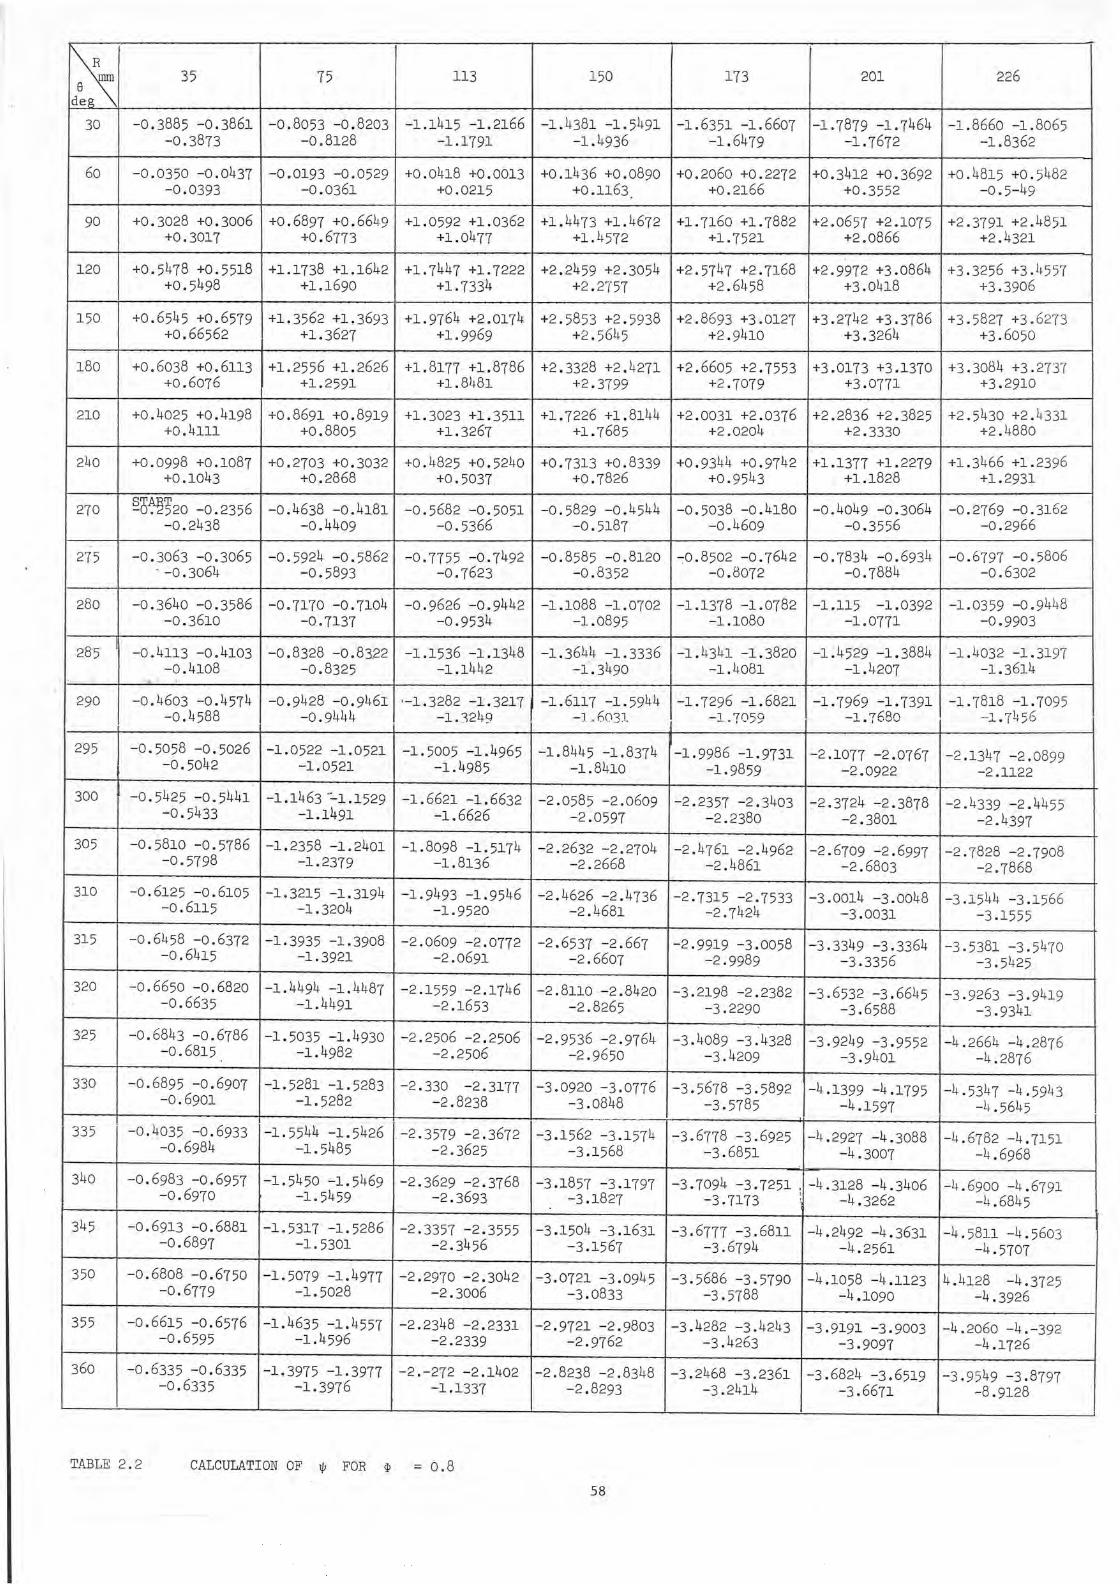
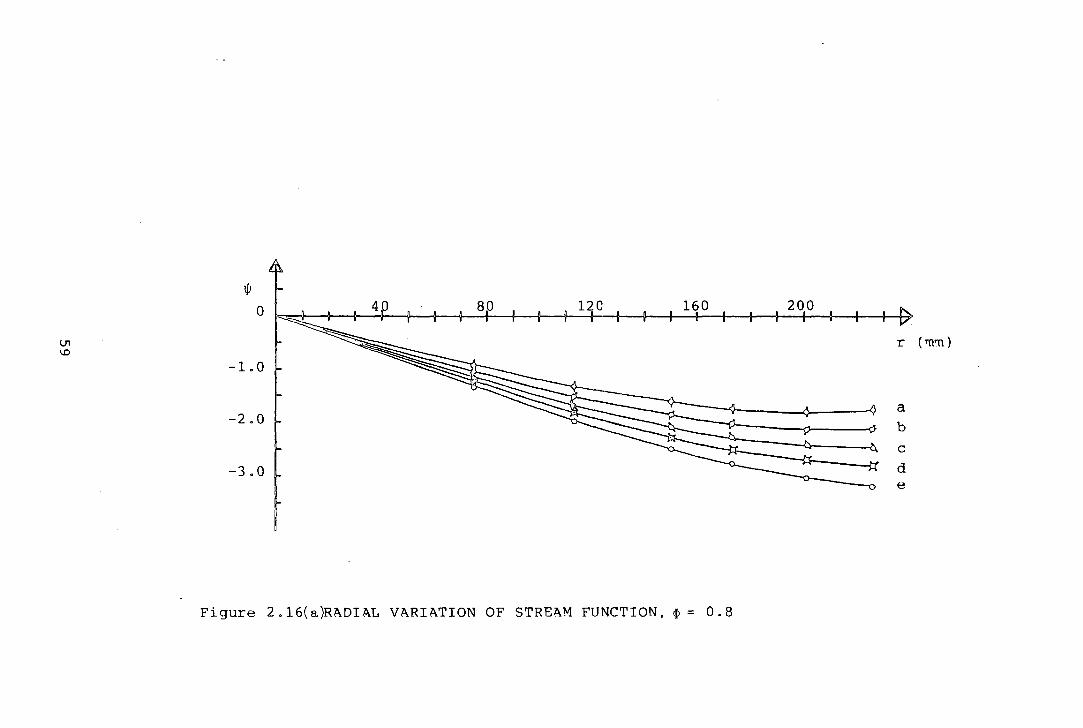
(ix) Curves are finally drawn of w a~ainst r, for constant
e and ~ against 8, for constant r as shown in Figs.2.16 ~ 2.17 for
54
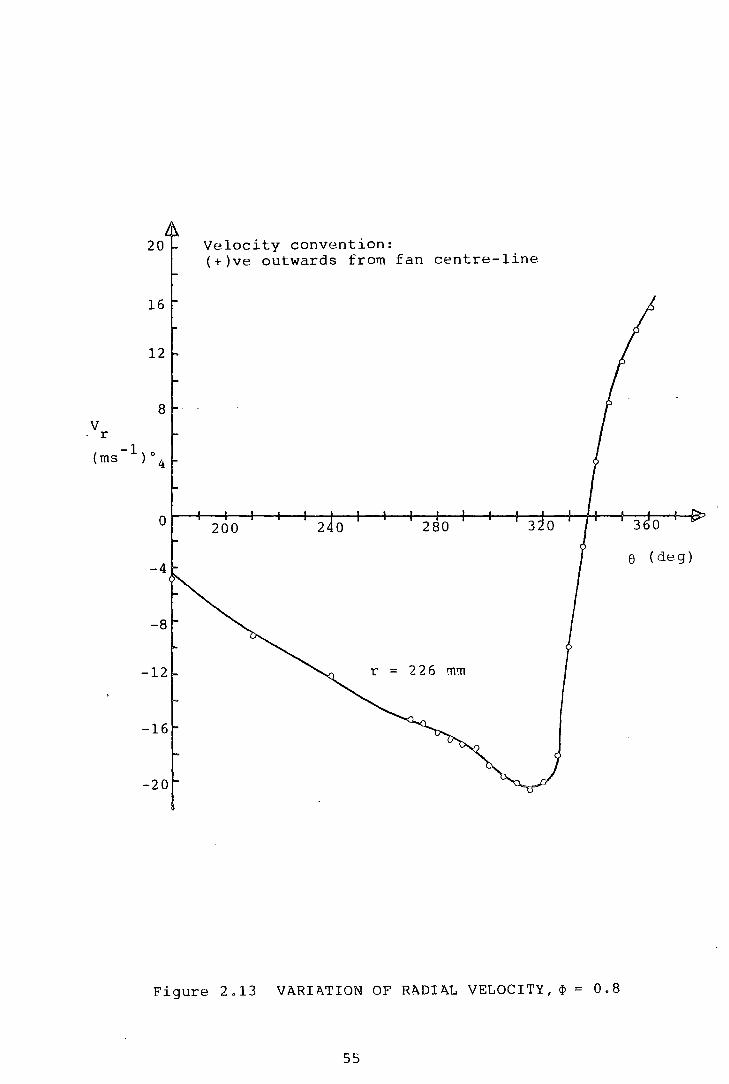
20 Velocity convention: (+)ve outwards from fan centre-line
v . r -1 ( ms ) o 4
-4 8 ( deg)
-8
-12
-16
Figure 2.13 VARIATION OF RADIAL VELOCITY,¢= 0.8
55
U1 ~
ve -1 (ms )
8
4
0
-4
Velocity convention: (+)ve anticlockwise
Figure 2.14 V~RIATION OF TANGENTI~L VELOCITY, ¢= 0.8
Step numbers
0.0
Figure 2.15 METHOD FOR C~LCULATION OF STREAM FUNCTION
57
35 I 75 I 113 I 150 I 173 I 201 I 226
30 - 0.3885 - 0.3861 - 0.8053 - 0.8203 -1.1415 -1.2166 -1. 4381 -1.5491 -1.6351 -1.6607 -1.7879 -1 .7464 I - 1.8660 -1.8065 -0.3873 - 0.8128 -1.1791 - 1.4936 -1.6479 -1.7672 -1.8362
60 I - o.o350 -o.o437 - 0.0193 - 0.0529 +0.0418 +0.0013 +0.1436 +0.0890 +0.2060 +0.2272 +0.3412 +0.3692 +0.4815 +0.5482 - 0.0393 - 0.0361 +0.0215 +0.1163 +0.2166 +0.3552 - 0.5- 49
90 I +0.3028 +0.3006 +0.6897 +0.6649 +1.0592 +1. 0362 +1. 4473 +1.4672 +l. 7160 +l. 7882 +2 .0657 +2. 1075 +2.3791 +2.4851 +0.3017 +0 . 6773 +1.0477 +1. 4572 +1.7521 +2.0866 +2.4321
120 I +0.5478 +0.5518 +1.1738 +1. 1642 +l. 7447 +l. 7222 +2.2459 +2.3054 +2.5747 +2. 7168 +2.9972 +3.0864 +3.3256 +3.4557 +0.5498 +1.1690 +l. 7334 +2.2757 +2.6458 +3.0418 +3.3906
150 I +0.6545 +0.6579 +1.3562 +1. 3693 +1. 9764 +2 .0174 +2. 5853 +2.5938 +2.8693 +3.0127 +3.2742 +3.3786 +3.5827 +3. 6273 +0.66562 +1.3627 +1. 9969 +2 . 5645 +2.9410 +3.3264 +3.6050
180 +0.6038 +0.6113 + l. 2556 + l. 2626 +1.8177 +1.8786 +2.3328 +2.4271 +2.6605 +2.7553 +3.0173 +3.1370 +3.3084 +3.27 37 +0.6076 +1.2591 +1.8481 +2.3799 +2.7079 +3.0771 +3.2910
210 I +0.4025 +0.4198 +0.8691 +0.8919 +1.3023 +1. 3511 + l. 7226 + l. 8144 +2.0031 +2.0376 +2.2836 +2.3825 +2.5430 +2.4331 +0.4111 +0.8805 +1.3267 +1.7685 +2 .0204 +2.3330 +2.4880
2L~O I +0.0998 +0.1087 +0.2703 +0.3032 +0.4825 +0.5240 +0.7313 +0 .8339 +0.9344 +0.9742 + 1.1377 + l. 2279 + l. 3466 + l. 2396 +0.1043 +0 . 2868 +0.5037 +0.7826 +0 .9543 +1.1828 +1.2931
270 1 §6~52o - 0.2356 - 0.4638 - 0.4181 - 0.5682 - 0.5051 - 0 . 5829 - 0.4544 - 0.5038 - 0.4180 1- 0.4049 - 0.3064 I - 0.2769 - 0.3162
- 0.2438 - 0.4409 - 0.5366 - 0.5187 - 0.4609 - 0.3556 . -0.2966
275 I - 0.3063 - 0.3065 - 0.5924 - 0.5862 - 0.7755 - 0.7492 - 0 .8585 - 0.8120 -:0.8502 - 0.7642 - 0. 7834 - 0.6934 - 0.6797 -0.5806 . - 0.3064 - 0.5893 -0.7623 - 0 .8352 - 0.8072 - 0.7884 - 0.6302
280 I -o.364o - 0.3586 - 0.7170 - 0.7104 - 0.9626 - 0.9442 -1.1088 -1. 0702 -1.1378 -1. 0782 -1.115 - 1.0392 -1.03 59 - 0. 94l.~ 8 - 0.3610 - 0.7137 - 0.9534 -1.0895 -1.1080 -1. 0771 - 0.9903
285 1 - 0.4113 -0.4103 - 0.8328 - 0.83.22, -1.1536 -1.1348 -1. 3644 -1. 3336 -1.4341 - 1.3820 -1.4529 -1.38841 -1.4032 -1.3197 - 0.4108 - 0.8325 -1. 1442 -1.3490 -1.4081 -1 .4207 -1.3614
· •· I .,_ •.
290 I - o.46o3 - 0.4574 - 0.9428 - 0.94611 ·-1.3282 -1 .3217,-1.6117 -1.5944 1-1.7296 -1.6821 -1.7969 -1.7391 1 -1.1818 -1.7095 - 0.4588 - 0.9444 - 1.3249 -1 . 6031 - 1.7059 -1 .7680 -1.7456
295 I - o.sos8 - o.so26 -1.0522 -1.0521 -1.5005 -1. 4965 -1.8445 -1.8374 - 1.9986 -1.9731 - 2.1077 - 2.0767 - 2.1347 -2.0899 - 0.5042 -1.0521 -1.4985 -1. 8410 -1.9859 - 2.0922 - 2.1122
300 f - 0.5425 - 0.5441 -1.1463 ·:_1.1529 - 1.6621 - 1.6632 - 2.0585 - 2.0609 - 2.2357 -2.3403 - 2.3724 - 2.3878 - 2.4339 - 2.4455 - 0.5433 -1.1491 -1.6626 -2.0597 - 2.2380 - 2.3801 - 2.4397
305 I - 0.5810 - 0.5786 - 1.2358 -1.2401 -1.8098 -1.5174 - 2.2632 - 2.2704 - 2.4761 -2.4962 - 2.6709 - 2.6997 - 2 .7828 - 2.7908 -0.5798 - 1.2379 -1.8136 - 2.2668 -2.4861 - 2.6803 - 2.7868
310 I - 0.6125 - 0.6105 -1.3215 -1.3194 -1.9493 -1.9546 - 2.4626 - 2.4736 - 2.7315 - 2.7533 - 3.0014 -3.0048 - 3.1544 - 3.1566 - 0.6115 -1.3204 - 1.9520 - 2.4681 - 2.7424 - 3.0031 -3.1555
315 I -o.6458 -0.6372 - 1.3935 -1.3908 - 2.0609 - 2.0772 - 2.6537 - 2 .667 - 2.9919 - 3.0058 - 3.3349 - 3.3364 - 3.5381 - 3.5470 - 0.6415 -1.3921 - 2.0691 - 2.6607 - 2.9989 - 3.3356 -3.5425
320 I -0.6650 - 0.6820 -1 .4494 -1 .4487 - 2.1559 - 2. 1746 - 2.8110 - 2.8420 - 3.2198 - 2.2382 - 3.6532 - 3.6645 - 3.9263 - 3.9419 - 0.6635 -1 .4491 - 2. 1653 - 2.8265 - 3.2290 - 3.6588 - 3.9341
325 I - o.6843 -0.6786 - 1.5035 -1.4930 - 2 .2506 - 2.2506 - 2.9536 - 2.9764 - 3.4089 - 3.4328 - 3.9249 - 3.9552 - 4.2664 - 4.2876 - 0.6815 -1. 4982 - 2.2506 - 2.9650 - 3.4209 - 3.9401 - 4.2876
330 I - 0.6895 -0.6907 - 1.5281 - 1.5283 - 2.330 - 2.3177 - 3.0920 - 3.0776 - 3.5678 -3.5892 - 4.1399 - 4. 1795 -4.5347 - 4.5943 - 0.6901 - 1.5282 - 2.8238 - 3.0848 - 3.5785 - 4. 1597 - 4.5645 -
335 I - 0.4035 - 0.6933 -1.5544 - 1.5426 .- 2.3579 - 2.3672 - 3.1562 - 3.1574 - 3.6778 - 3.6925 -4.2927 - 4.3088 -4. 6782 - 4.7151 - 0.6984 -1. 5485 - 2 . 3625 -3.1568 - 3.6851 - 4.3007 -4.6968
340 I - 0.6983 - 0.6957 - 1.5450 -1. 5469 -2.3629 - 2.3768 -3.1857 - 3.1797 - 3.7094 - 3.7251 . - 4 .3128 - 4.3406 -4 . 6900 - 4.6791 - 0.6970 -1. 5459 - 2.3693 - 3. 1827 - 3.7173 I
-4.3262 - 4.6845
345 I - 0.6913 - 0.6881 - 1.5317 -1.5286 -2 .3357 - 2. 3555 - 3.1504 - 3.1631 - 3.6777 - 3.6811 - 4.2492 - 4.3631 - 4.5811 - 4.5603 - 0.6897 -1. 5301 - 2.3456 - 3. 1567 - 3.6794 - 4.2561 - 4.5707
350 I - o.68o8 - 0.6750 -1.5079 -1.4977 - 2.2970 - 2.3042 - 3.0721 - 3.0945 -3~5686 -3 . 5790 - 4.1058 - 4.1123 4.4128 - 4.3725 - 0.6779 - 1.5028 - 2.3006 - 3.0833 - 3.5788 -4.1090 - 4.3926
355 I - 0.6615 -0.6576 -1.4635 - 1.4557 - 2.2348 - 2. 2331 - 2.9721 - 2.9803 - 3.4282 - 3. 4243 - 3.9191 - 3.9003 - 4.2060 - 4. - 392 - 0.6595 - 1.4596 - 2.2339 - 2.9762 - 3.4263 - 3.9097 - 4.1726
360 I - 0.6335 - 0.6335 -1.3975 -1.3977 - 2. - 272 - 2. 1402 - 2.8238 - 2.8348 - 3 .2468 - 3.2361 -3.6824 - 3.6519 - 3.9549 - 3.8797 - 0.6335 - 1.3976 -1.1337 - 2.8293 - 3.2414 - 3.6671 -8.9128
TABLE 2. 2 CALCULATION OF l)J FOR <I> = 0. 8
58
1jJ
0
LT1 r (rnrn) 1.0
-1.0
a -2.0
b
c
-3.0 d e
Figure 2.16(a)R1\DIAL VARIATION OF STRE1\M FUNCTION, q, = 0.8
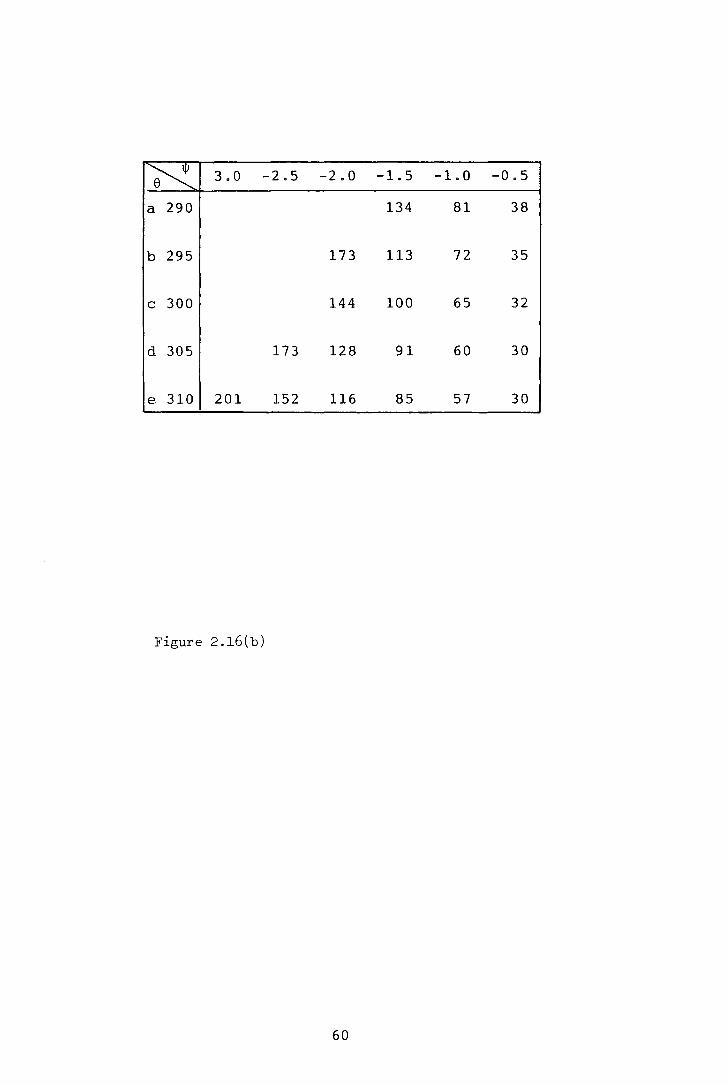
~ 3.0 -2.5 -2.0 -1.5 -1.0 -0.5
a 290 134 81 38
b 295 173 113 72 35
c 300 144 100 65 32
d 305 173 128 91 60 30
e 310 201 152 116 85 57 30
Figure 2.16(b)
60

2.0
1.0
0
e deg a
-1.0 b
-2.0 c
I~ -3.0 -2.5 -2.0 -1.5 -1.0 -0.5 0.0 0.5 1.0 1.5 2.0
a 35 295 249 199
b 75 325 293 272 252 230 202 350 c 113 311 295 281 269 255 240 223 201
d 150 326 310 298 288 278 269 258 247 234 219 200 354
Figure 2.17 PERIPHERAL VARIATION OF STREAM FUNCTION,@ =0.8
61
~ = 0.8, from which co-ordinates are extracted for the
final flow diagrams.
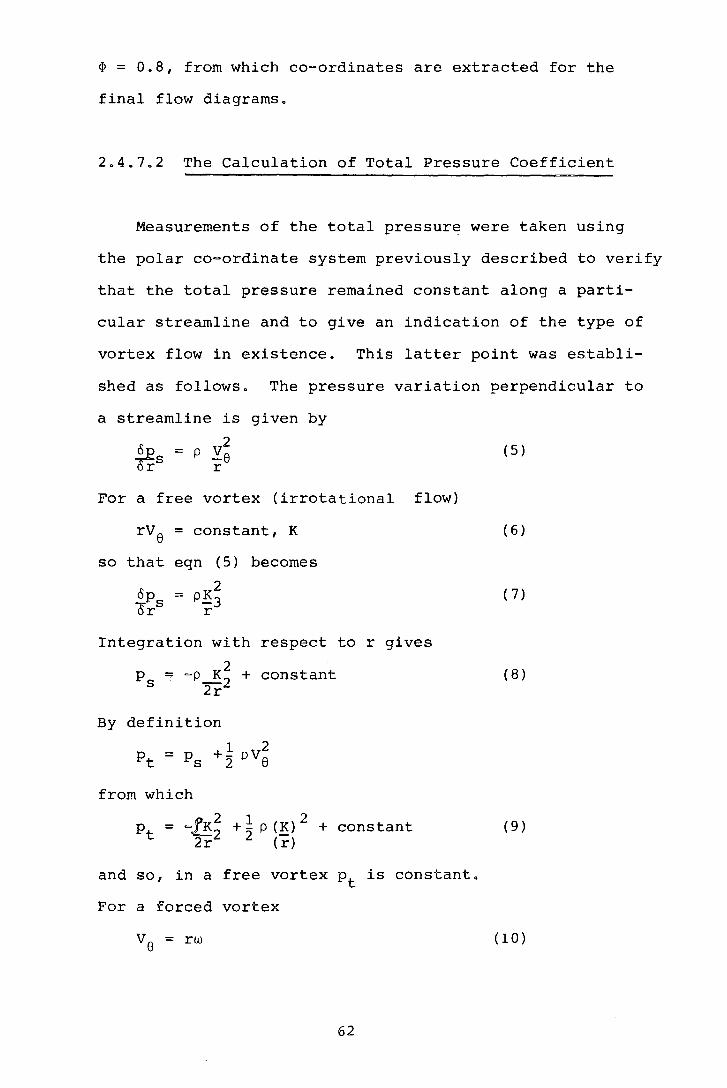
2.4.7.2 The Calculation of Total Pressure Coefficient
Measurements of the total pressure were taken using
the polar co-ordinate system previously described to verify
that the total pressure remained constant along a parti~
cular streamline and to give an indication of the type of
vortex flow in existence. This latter point was establi-
shed as follows. The pressure variation perpendicular to
a streamline is given by
2 ~s = P .Ye Or r
For a free vortex (irrotational
rv8
= constant, K
so that eqn ( 5)
2 -- p~3
r
becomes
flow)
Integration with respect to r gives
2 ps = -p~2 + constant
2r
By definition
from which
p = -JK2 + -
21 p (~) 2 + constant
t 2r2 (r)
and so, in a free vortex pt is constant.
For a forced vortex
V = rw e
62
( 5)
( 6)
( 7)
( 8)
( 9)
(10)
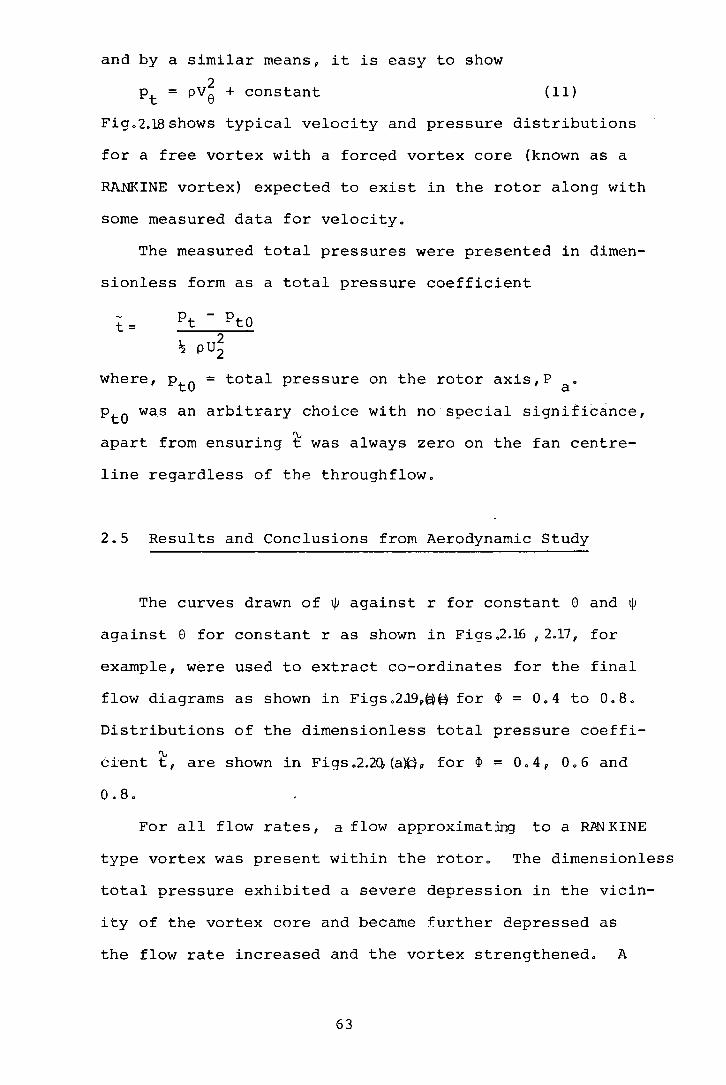
and by a similar means, it is easy to show
2 pt = pv8 + constant (11)
Fig. 2.18 shows typical velocity and pressure distributions
for a free vortex with a forced vortex core (known as a
RANKINE vortex) expected to exist in the rotor along with
some measured data for velocity.
The measured total pressures were presented in dimen-
sionless form as a total pressure coefficient
t= Pt - Pto 2
~ pU2
where, Pto =total pressure on the rotor axis,P a
Pto was an arbitrary choice with no special signifi6~nce,
t f . ~ 1 h f apar rom ensur1ng t was a ways zero on t e an centre-
line regardless of the throughflow.
2.5 Results and Conclusions from Aerodynamic Study
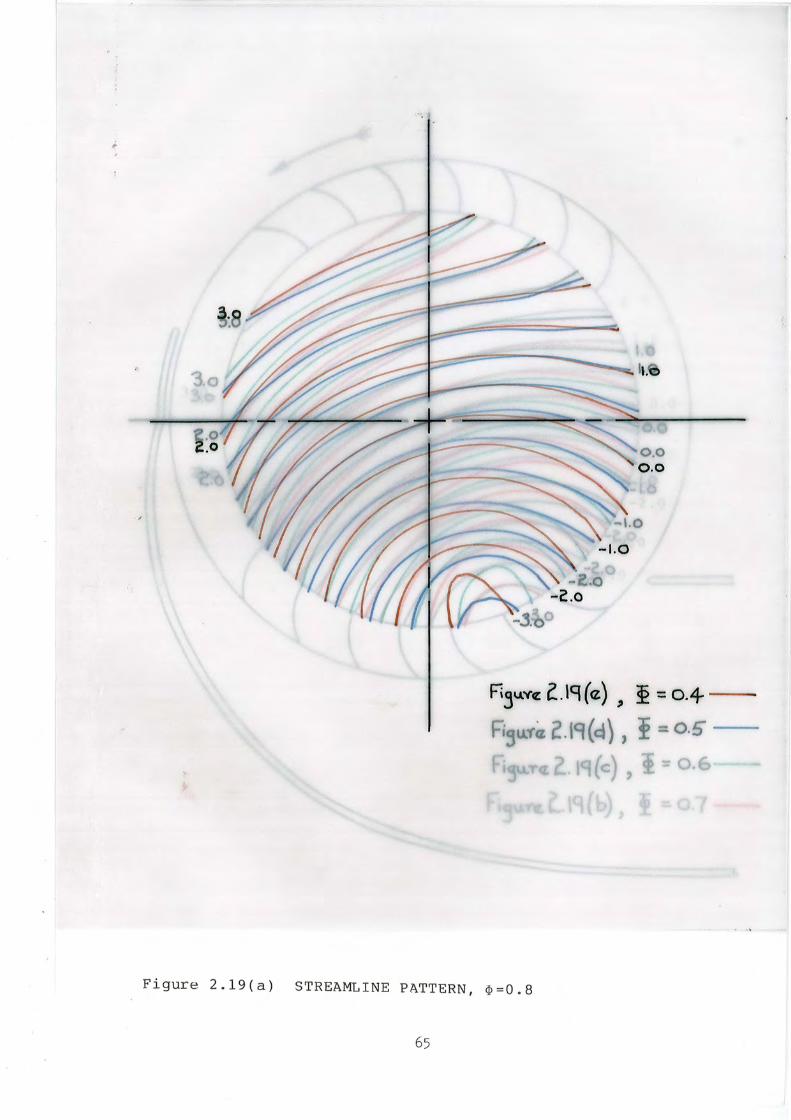
The curves drawn of ~ against r for constant e and ~
against e for constant r as shown in Figs .2.16 , 2.17, for
example, were used to extract co-ordinates for the final
flow diagrams as shown in Figs .2J.9,~~ for <P = 0. 4 to 0. 8.
Distributions of the dimensionless total pressure coeffi-
'V ci:ent t, are shown in Figs.2.20,(a~, for <P = 0.4, 0.6 and
0. 8 0
For all flow rates, a flow approximatillg to a RAN KINE
type vortex was present within the rotor. The dimensionless
total pressure exhibited a severe depression in the vicin-
ity of the vortex core and became further depressed as
the flow rate increased and the vortex strengthened. A
63

Const.
I
~orced Vortex +>----=--Fr-ee -Vo-rte-x --1
Figure 2.18 THEORETICAL VELOCITY AND PRESSURE DISTRIBUTIONS
IN ~ R~NKINE VORTEX
64
-Z.o -2.0
-J.o
Fi3u.v«: C..l9 (cz) , ~ = 0.4- -
R u:ra '-'9(~) , t = o.5
(c) , O.
Figure 2.19 ( a ) STREAMLINE PATTERN, ~=0.8
65

IV
Region t Range 1 2 -2 to 0 3 -4 to -2 4 -6 to -4 5 -8 to -6
Figure 2.20 ( a ) TOTAL PRESSURE DISTRIBUTION, ¢ =0 . 8
66

I"'J
REGION t RA.NGE
1 0 2 -2 to 0 3 -4 to -2 4 -6 to -4
Figure 2.20(b) TOTAL PRESSURE DISTRIBUTION, ¢ = 0 .6
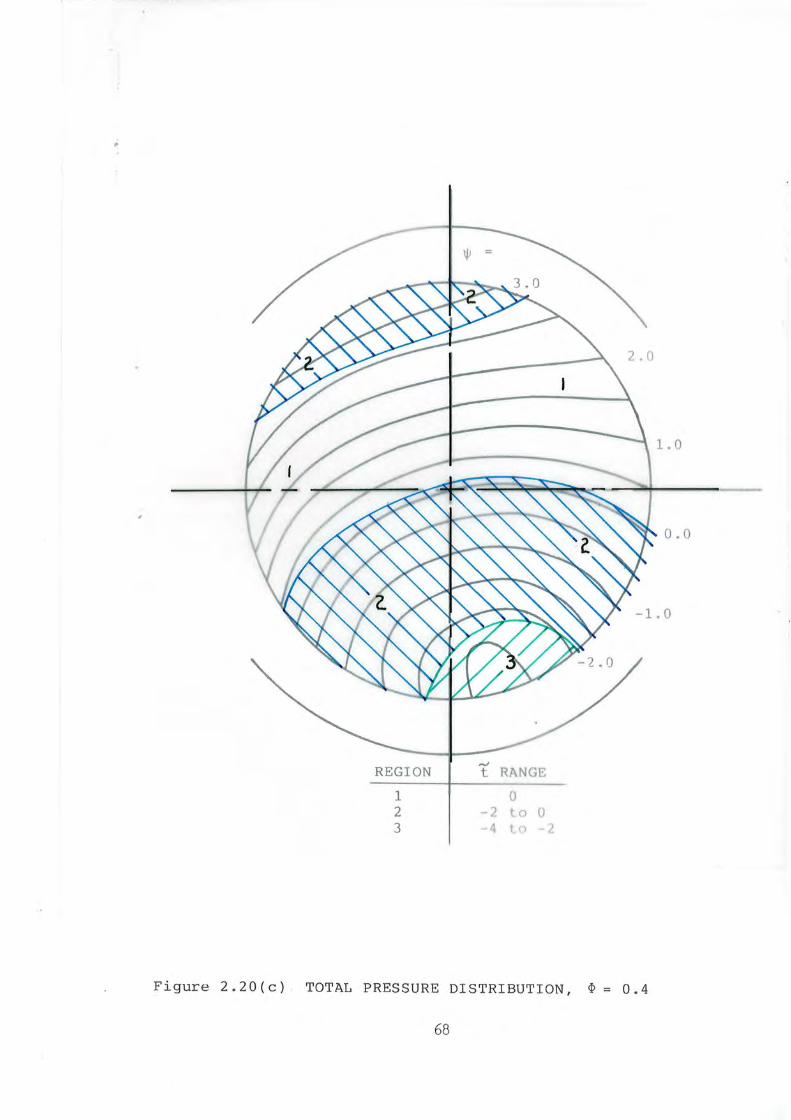
,;
REGION
1 2 3
""" t RANGE
0 -2 to 0 -4 0 2
Figure 2 . 20 (c) TOTAL PRESSURE DISTRIBUTION, <P = 0 . 4
68
region of low total pressure (low energy) was present
almost diametrically opposite the vortex core, which
became more depressed and covered a larger area as the
flow rate increased (Chapter 3 on the hydrodynamic facility
confirms the existence of this region). The streamlines
do not remain concentric with the vortex core as the fan
is traversed radially. They are seen to flatten and indeed
exhibit reversed curvature towards the rear wall leading
edge (again see Chapter 3 for confirmation of this effect).
The streamlines yield a velocity profile across a
diameter 9 including the vortex core, ~hich p~-a~s __ at _ _!he_
boundary between the free and forced vortex regions and
progressively reduces towards the rea:rt., wall leading el.dge.
The streamlines also indicate a general acceleration of
the flow across the fan interior. For ¢ = 0.8, the veloci
ties in the quadrant containing the vortex core are seen
to be higher than those for ¢ = 0.4, whereas the velocities
in the opposite quadrant towards the rear wall, are similar
for both flow rates.
The location of the vortex core changed little in the
range ¢ = 0.5 to 0.8, but began to displace peripherally
and radially in the range ¢ = 0.4 to 0.5.
69
CHAPTER THREE
THE HYDRODYNAMIC FACILITY
70
3. THE HYDRODYNAMIC FACILITY
3.1 Introduction
Flow visualization techniques are often used to indi
cate -the·- general nature of the flow behaviour and with care,
some may be developed to yield not only qualitative but
quantitative data, particularly for water flows (see ref.
6 ) . To provide a full understanding of the basic aero
dynamic_ princ_ip_les _governing the flow ·through a -cross flow
fan, visualization studies were carried out on a model
rotor built to a geometric scale of 1:6.25 and operated with
dynamic similarity to the aerodynamic facility (see Chapter
2) 0
3.2 Flow Visualization Techniques
Many techniques now exist for the visualization of
water flows, of which twowere examined for their suitability.
The controlled introduction of hydrogen in water by
electrolysis has become a very popular method in recent
years. Hydrolysis of water generates hydrogen bub~les
from a cathode when d.c. is supplied between electrodes.
If the cathode takes the form of a thin wire, a very fine
cloud of bubbles is formed whruch appears as a line when
viewed edgewise. It is also possible to pulse the supply
to obtain time-streak markers, which can provide quantitative
71
data.
This technique has several advantages over other meth
ods of flow visualization. The hydrogen bubbles are
easily produced and their size and density controlled
using standard power supplies. The flow is unaffected if
the cathode wire is made sufficiently small and contamin
ation of the fluid does not occur as with colloidal tellur
ium or dye streaks. It is also possible to maintain flow
identity in wakes or minor turbulence, when sufficient
power is supplied between electrodes. Due to the highly
reflective nature of a liquid/gas interface, good contrast
-may be achi-eved on tne -photo~raphic flow records.
ASANUMA and TAKEDA (ref. 3 ) used this technique to
visualize the flow in a rotary cascade consisting of an
inlet guide vane, a rotor, a stator and finally an outlet
guide vane, with internal velocities up to 7ms- 1 • Although
a d.c. voltage of 800 volts at 2.1 amps was used, it was
only possible to determine the location of flow disturbances
and stalling of blades.
The highly turbulent flow in and around a cross flow
rotor was found too great to allow any reasonably sus
tained stream to be observed, especially on passing through
blade passages where the bubbles were totally dispersed.
General flow patterns could be discerned but the powers
associated with the hydrolysis were dangerously high.
Howeveru a facility was included on the rig whereby two
adjacent blades acted as electrodes, allowing the flow
between blades to be exaMined at various positions around
the suction and discharge arcs.
72

The second visualization technique examined for its
suitability was the already proven method using neutral
density polystyrene spheres. ROBERSON (ref. 25) used
opaque polysterene spheres in water containing a little
salt, so that the ratio of particle density to liquid
density was in the range of 0.99 to 1.01. His theoretical
analysis, as with that of FAURE (ref. 11) , showed large
deviations could be expected between the particle direction
and the true streamlines, with density ratios outside this
range. Also, deviations were minimised with small particle
diameters. A compromise between the hydr<?_dyl}ami_c perfor-- --
mance-arid the optical requirements is called for.
Using this method, neutral density polysterene beads
of O.Srr~. diameter were used as tracers after first soaking
them in water to ensure a thoroughly wetted surface.
Illumination was provided by three high-power, halogen
strip lamps each collimated to produce a thin slice of
light transversely across the tank at the mid-span
position of the rotor. A camera was mounted above the tank
and was positioned directly above the rotor axis. By
choosing a suitable shutter speed it was possible to record
photographic streaks which represented the displacements
of the beads during the period of shutter opening. From
these, local velocities both in terms of magnitude and
direction could be estimated knowing the shutter speed.
Care was taken to ensure that the start and end of
a streak was due solely to the chosen exposure time and
that the corresponrin~ sphere had not had a large axial
velocity component which caused it to pass across and out
73
of the light beam. lvith this condition satisfied, the
motion could be regarded as substantially two dimensional.
3.3 The Water Table
A water table was constructed to enable flow visuali-
zation studies to be carried out on a model cross flow
fan, using techniques discussed in the last section.
Dynamically similar operating conditions were achieved
by driving the rotor at the speed necessary to give equality
of Reynolds number with the aerodynamic facility. Normally,
the characteristic length used in defining Reynolds number
is the blade chord with the velocity term given by the
blade tip speed. However, certain shortcomings of this
will be discussed later.
3.3.1 The Design and Manufacture of Tank
The tank was constructed totally from thick perspex
sheet. All butted faces were flat and well finished to
ensure water tight joints, using both screws and a bonding CL
agent. The rectangular tank was supported on framework
of all welded construction using mainly square section
hollow tubing. The frame sat on six legs of which the
four outer legs were made of steel angle section. The
finished tank was located and supported on a square sec-
tion tube perimeter.
To limit the calculated high deflections throughout
the framework due to the large weight of waterv a
74

longitudinal carriage truss was installed below the tank
base which was positioned at mid-span and ran the full
length of the support framework. Calculations showed mid
span deflections to be reduced by a factor of eight.
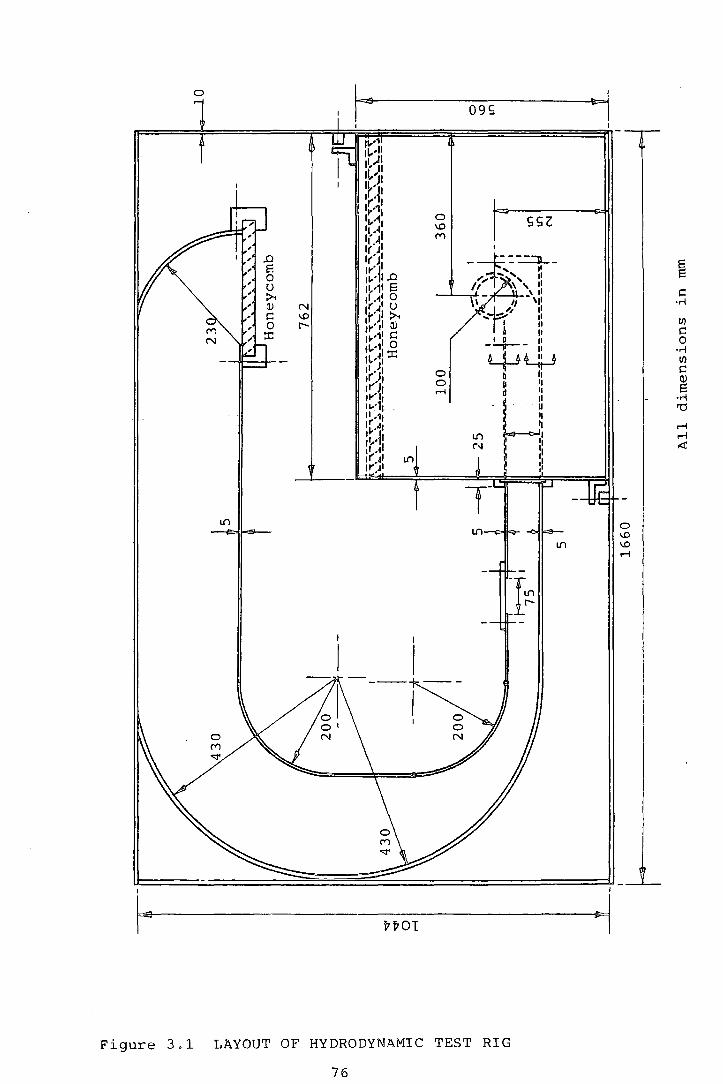
Figure3.1 shows a general arrangement of the water table.
3.3.2 The Design and Hanufacture of Model Rotor
The rotor was a 1:6.25 geometric~lly similar model of
the fan described in Chapter 2 and consisted of 24 pressed
stainless steel blades, manufactured using a jig having
a ractitis of curvature somewhat smaller than that required
for the final blades, to allow for stress relief. The
rotor end plates were constructed from heavy gauge perspex.
The lower end plate was annularly rebated which allowed
the blades to be located radially. The 24 identical blades
were arranged symmetrically around the circumference using
a wooden cylinder marked in 24 equal increments. A
bonding agent was poured around each blade root filling
completely the annular slot. After the solution hardened,
the wooden cylinder was removed and the upper and plate
(which took the form of a ring) was located and bonded.
A side elevation of the rotor features is shown in Fig. 3.2 .
Excessive mid-span deflection of the rotor blades was
avoided by using the principles discussed in Appendix ~ .
3.3.3 The Design and Manufacture of the Rotor Casing
All casing components were manufactured totally from
75
0
1 09S
IV1
11-·11 1'-~l I~'JI 1~·~, II"'· I II>'., I 1r,·11 0 ssz ,,_ ... , \0
lr . ..t, M
I( J t(J' § "''ll ..... 1..0 tl,-11 6 c II·~· 0
N r • u ·r-l
\0 'f''l :>.. r- I Jl Ill ,,., Q)
M rv1' c c N
tl-·1: ~ 0
·r-l ll.•~r Ill
:Hr 0 c r·/ 0 Q)
I I .-i 6 rVI, ·r-i ud1 'd ".,, '~·,j' r-1
:r,.1t 1.() r-1 rl ,tl N ,.::(
rl"' ~~ 1.() I(JI
' ps---------J
'Vl701 l
Figure 3.1 LAYOUT OF HYDRODYNAMIC TEST RIG
76

1-Ij I"·
1.0 / c Too Cover
li (1)
w . N ...... 9
~ -
::.:1 \ 0 ~ 0 ::.:1
t1 ::.:1 H
< t:lj
;:~:>' 162 I I I I z 111
-.J t1 -.J
H z Ul ~ s .LU . J.±firi _________ u ' ',: T Tank ;1:>' C"' , _ ~r l Base C"' ;:~:>' ~ H 0
501
3 z 24~
48 35
~±mf:i~F~ ""' Seal Unit Threaded 350 Hexagonal Head y- -
22 -
22
~~ Dimensions in mm

perspex allowing maximum transmission of light to the rotor
interior. The logarithmic spiral rear wall was formed
from a solid block made by bonding together sheets of
heavy gauge perspex. The circular arc extension to the
rear wall included five sections, each allowing an
addition of 10° to the rear wall height (a 1 ). These exten-
sion pieces were located by two lugs on the underside and
two holes in the top side. l•!hen fitted together in the
0 correct order, a rear wall height of a 1 = 50 could be
achieved. A pair of square headed, threaded brass bars,
~firmly ~secured the whole rear __ wall unit~ to ~the ~duct base~
plate, which contained two slots allowing adjustment of
the rear wall clsara.-;ce. A slotted plate attached to the
rear wall gave further support on two brass studs and a
key protruding from the tank base.
The vortex wall was constructed from three layers of
light gauge perspex. The two outer layers were bonded to
the downstream wall section and the middle layer was
allowed to slide freely varying the vortex wall clearance.
A simple brass mechanism attached between the vortex wall
and the duct base enabled the position of the leading
edge (a 2 ) to be adjusted. Details of the rear and vortex
walls are shown in Fig. 3.3 .
-~he second side of the fan casing was provided by a
large perspex cover, shown in Figs. 3.1 and 3.2, which corn-
pletely sealed the test section from atmosphere. The
underside of the cover 0ontained an annul~r rebate which
located the top rinq of the rotor. Thin walled plastic
tubing sliced longitudinally and positioned along the
78
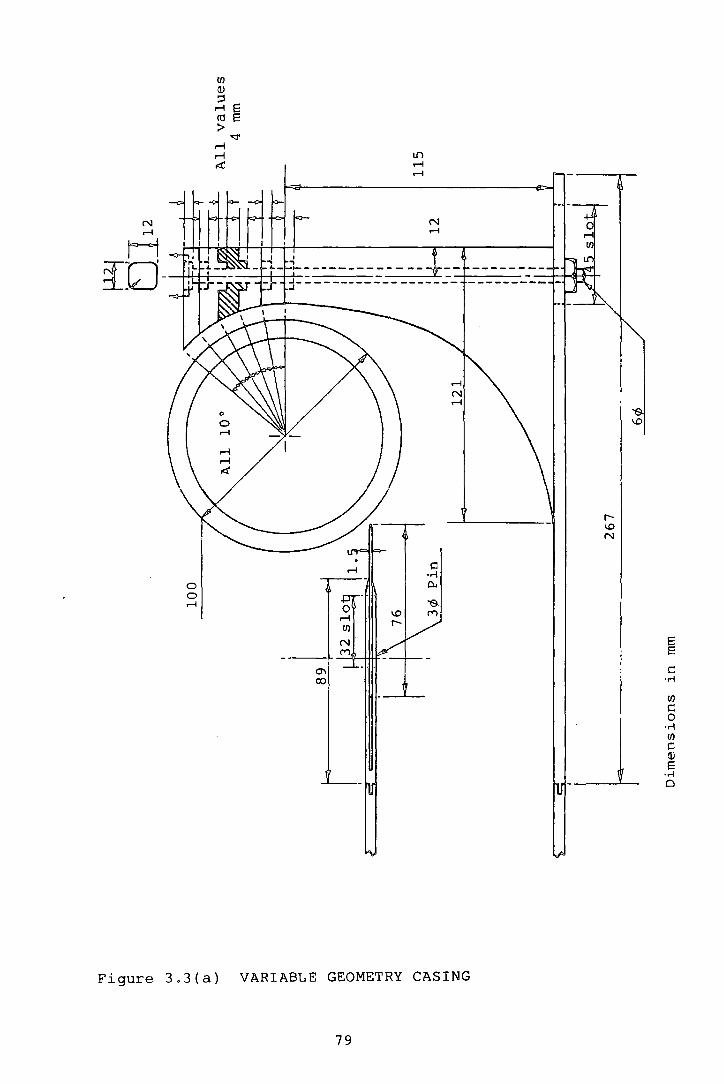
0 0 ~
Figure 3.3(a) VARIABLE GEOMETRY CASING
79
§ c:
·.-l
Ul c: 0
·r-l Ul c: (!)
E ·r-l Cl
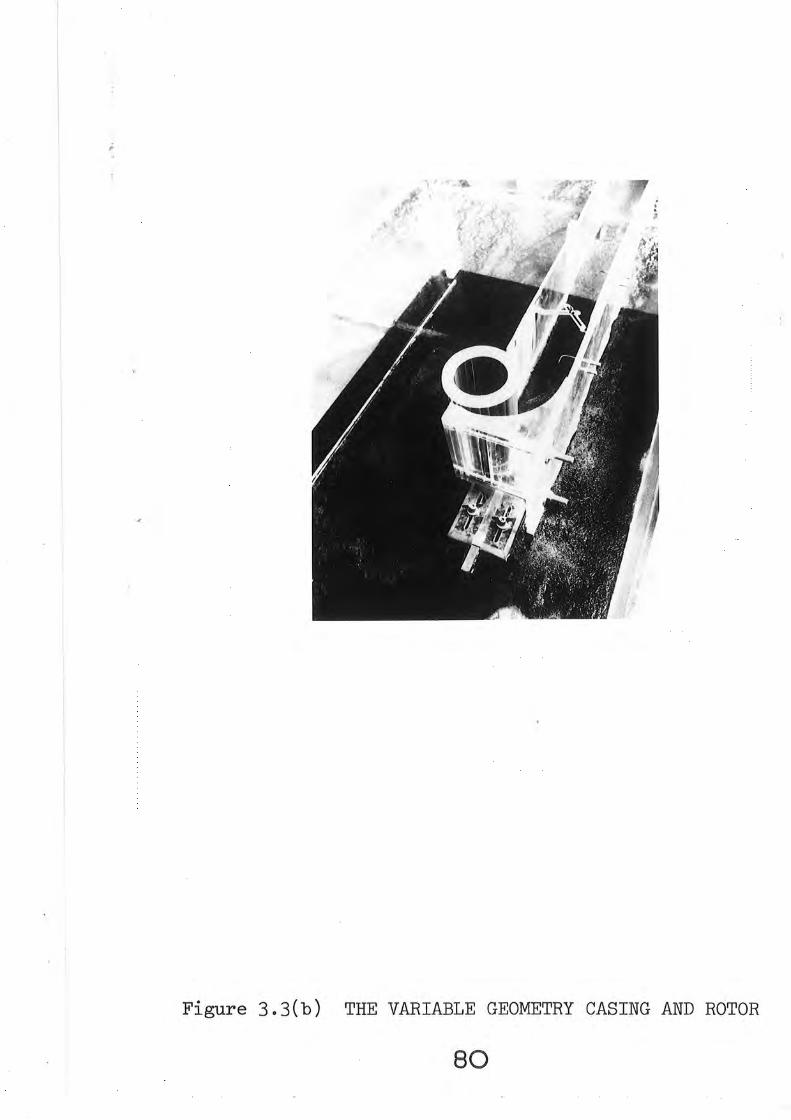
Figure 3.3(b) THE VARIABLE GEOMETRY CASING AND ROTOR
80
edges of all duct walls, ensured firm location and pre~
vented leakage between the discharge and suction regions.
3.3.4 Tne Drive to the Rotor
The drive shaft attached to the lower end of the
rotor passed through a seal in the base of the tank,
shown in Fig.3.2. The power was transmitted from a 0.5
h.p., a.c. motor to the rotor shaft by a system of timing
belts and pulleys. Self-aligning plummer block bearings
were used througout.
3.3.5 Tank Flow Guide Walls
To avoid excessive swirling of water within the tank
an internal channel was installed, which directed the
flow from the fan discharge smoothly towards the t$t
section. Downstream of the test section, the vortex wall
could be adjusted which allowed the tank to be 'trimmed',
regulating the flow rate in the channel.
Honeycombs, water-proofed by coating in laquer, were
positioned at the outlet of the channel and at the top
end of the test section which eliminated any remaining
eddies in the water flow prior to entry into the fan
suction region.
3.4 Photographic Materials and Techniques
A Canon AEl fitted with a Canon FD 50mm. Fl.4 s.s.c. lens
81
was used thrc;mghout the visualization study. Automatic
light metering was utilized in nearly all cases whereby
the shutter speed was given priority over the f number.
Kodak Tri-X 35mm. roll film was chosen as an appro
priate recording emulsion. The film was developed using
Tetenal Neofin Red because its greater developing power
1 pushes' the film speed resulting in a much improved con
trast. This developer also reduces the normal graininess
assoc~ated with high speed film by chemically affecting
the total negative at an equal rate, independant of local
densities. This prevents the usual clumping of the silver
halide crystals.
After neutralising the developer in an acid stop
bath, the film was fixed for twice the clearing time. The
contrast was further enhanced by printing on grade 4 paper.
3.5 Experimental Procedure
The base of the tank below the test section was painted
with matt black paint to eliminate unwanted reflections
and provide a suitable photographic background. Illumin
ation was provided by three high-power halogen strip lamps
forming a 6mm. thick slice of light transversely across
the tank at the mid-span position of the rotor. The two
lamps positioned adjacent to the test section contained
lkW lampsv while the lamp opposite the test sectionv a 1.5
kW lamp. This arrangement provided an even light level in
ana around the rotor.
82
The camera was mounted on a tripod directly above the
axis of the rotor by aligning the microprism focussing
ring concentrically with the rotor. A ruler clamped in
a retort stand and positioned directly in the slit beams
allowed accurate focussing and provided a scale for future
streak measurements. Whenever the film was changed or
the camera repositioned, an updated photograph of the scale
was required.
3.5.1 The Rotor in Unbounded Fluid
Initially, no casing components were used to study
both the transient flow at start~up and the steady state
flow. Tb examine the transient flow process, the rotor
was accelerated to full speed within one second and the
shutter released remotely at some arbitrary time after
start-up. Repeated shots were taken of this process and
straightforwardly placed in temporal order as judged by
the development and position of the vortex and the general
magnitude of the velocity vectors.
The steady state flow was examined by taking several
photographs in quick succession once a particular type of
flow was stabilised. Various types of flow were achieved
by vtrimrningv the tank, as discussed earlier.
3.5.2 The Rotor with Casing
The vortex wall an~ rear wall leading edne clearances
were both set to 0.0502 as it was unclear how these
83
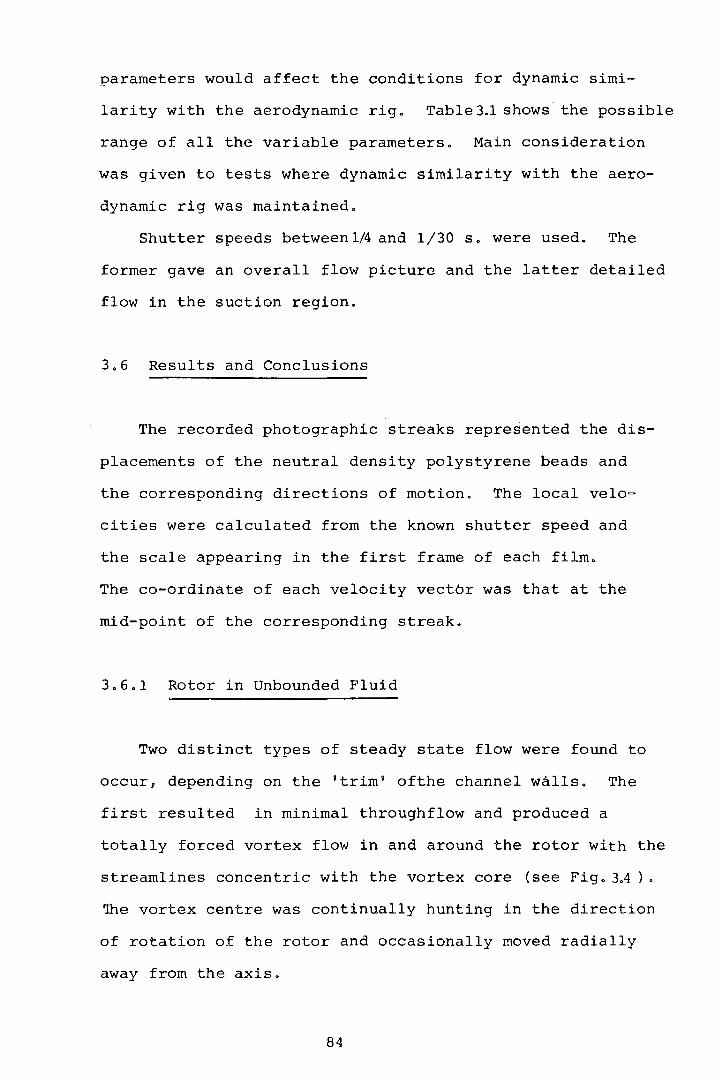
parameters would affect the conditions for dynamic simi
larity with the aerodynamic rig. Table3.1 shows the possible
range of all the variable parameters. Main consideration
was given to tests where dynamic similarity with the aero
dynamic rig was maintained.
Shutter speeds betweenlA and 1/30 s. were used. The
former gave an overall flow picture and the latter detailed
flow in the suction region.
3.6 Results and Conclusions
The recorded photographic streaks represented the dis
placements of the neutral density polystyrene beads and
the corresponding directions of motion. The local velo
cities were calculated from the known shutter speed and
the scale appearing in the first frame of each film.
The co-ordinate of each velocity vector was that at the
mid-point of the corresponding streak.
3.6.1 Rotor in Unbounded Fluid
Two distinct types of steady state flow were found to
occur, depending on the 'trim' ofthe channel walls. The
first resulted in minimal throughflow and produced a
totally forced vortex flow in and around the rotor with the
streamlines concentric with the vortex core (see Fig. 3A ) •
The vortex centre was continually hunting in the direction
of rotation of the rotor and occasionally moved radially
away from the axis.
84
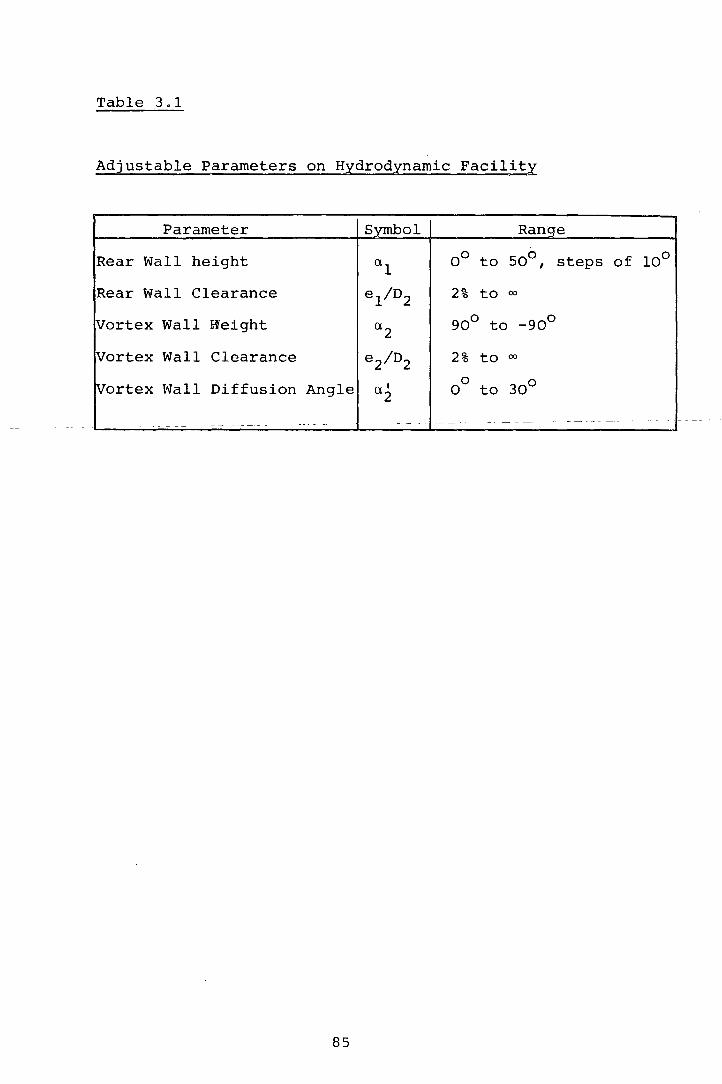
Table 3.1
Adjustable Parameters on Hydrodynamic Facility
Parameter Symbol Range
Rear Wall height 0'.1 00 to 50°, steps of 10°
Rear Wall Clearance el/D2 2% to (X)
vortex Wall W'eight 0'.2 90° to -90°
Vortex Wall Clearance e2/D2 2% to (X)
Vortex Wall Diffusion Angle a' 0
30° 2 0 to
---- ~-- -- - --- -~ - --- - --- ----- -- -- --- - - -·- ---
85
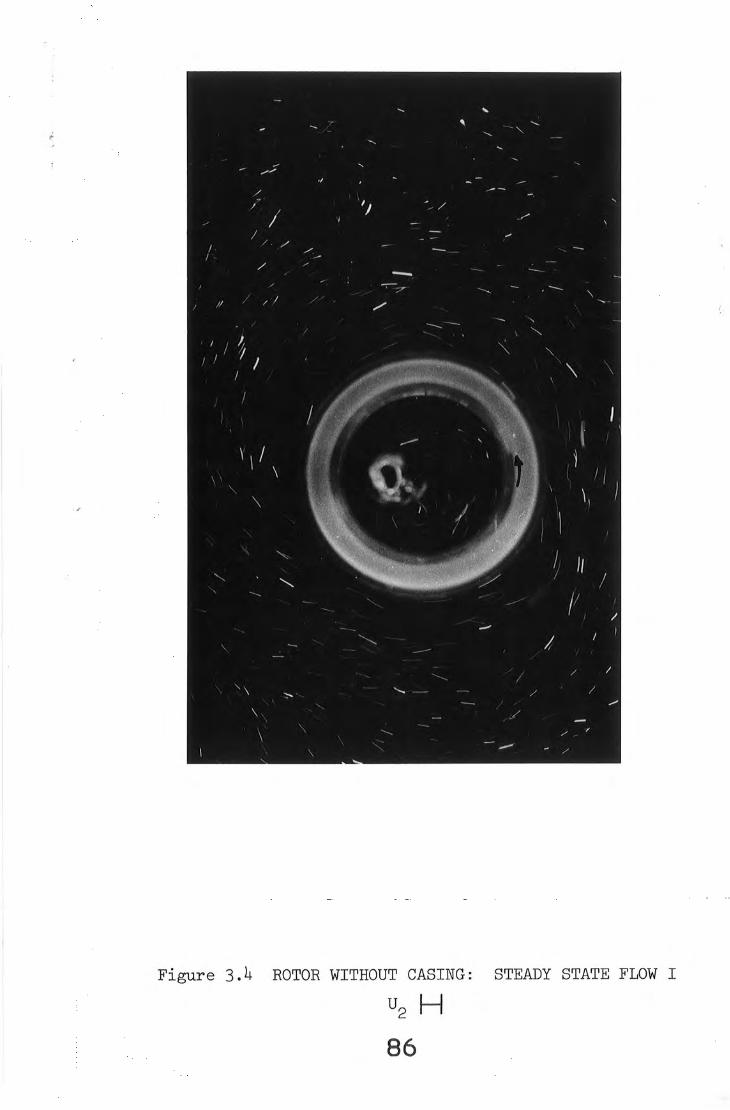
Figure 3.4 ROTOR WITHOUT CASING: STEADY STATE FLOW I
u2 H
86
The second type of flow produced a more familiar
pattern with tl:e \IOrtex on the inner periphery of the rotor
and substantial throughflow. At times, the vortex would
find a stable location which vlas maintained for several
seconds before hunting in the direction of rotation of the
rotor. During stable periods, it was possible to identify
a dividing streamline between the suction and discharg~~
regions which might indicate the ideal location for the
vortex wall (a dividing streamline in itself). Figure 3.5
illustrates this flow during a stable period, showing
vortices shed from the vortex core and passing downstream,
caused by snall perturbations in the vortex position. These
seem to be a major cause of pulsations and instability
of the discharge flow.
Photographs of the transient flow during start-up, were
of great interest. The geometry of the tank recirculation
channel was arranged for steady state flow of the second
type, as discussed above. Initially, a number of vortices
formed on the inner perphery of the rotor, each rotating
in the same sense as the rotor. The action of these indi
vidual vortices caused localised throughflow and viscous
forces caused the region surrounding the rotor axis to
rotate in an opposite direction. As this central region
began to gain in strength the outer vortices diminished.
A sudden transition occured as the rotation of this region
change sense and as the throughflow began, the vortex moved
towards a stable position on the inner perphery.
Photogra~hs of this process always show an odd number
of vortices present on the inner periphery, although symmetry
87
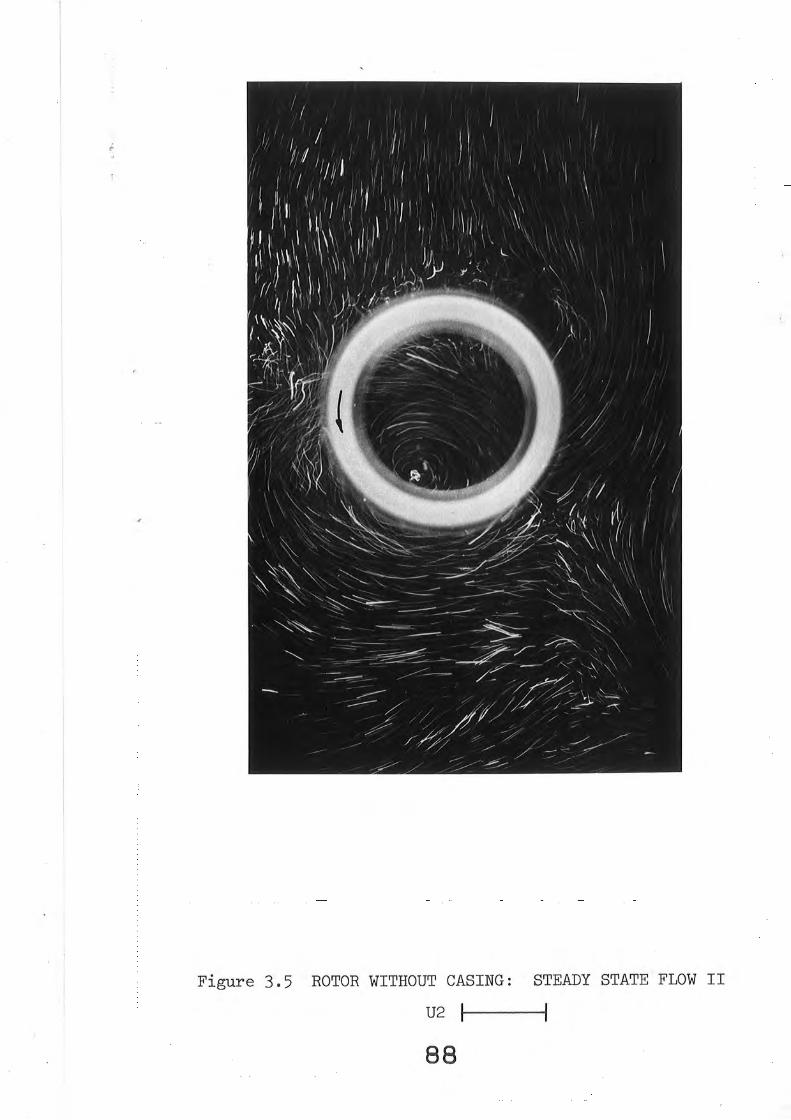
Figure 3. 5 ROTOR WITHOUT CASING: STEADY STATE FLOW II
U2 It------t
88
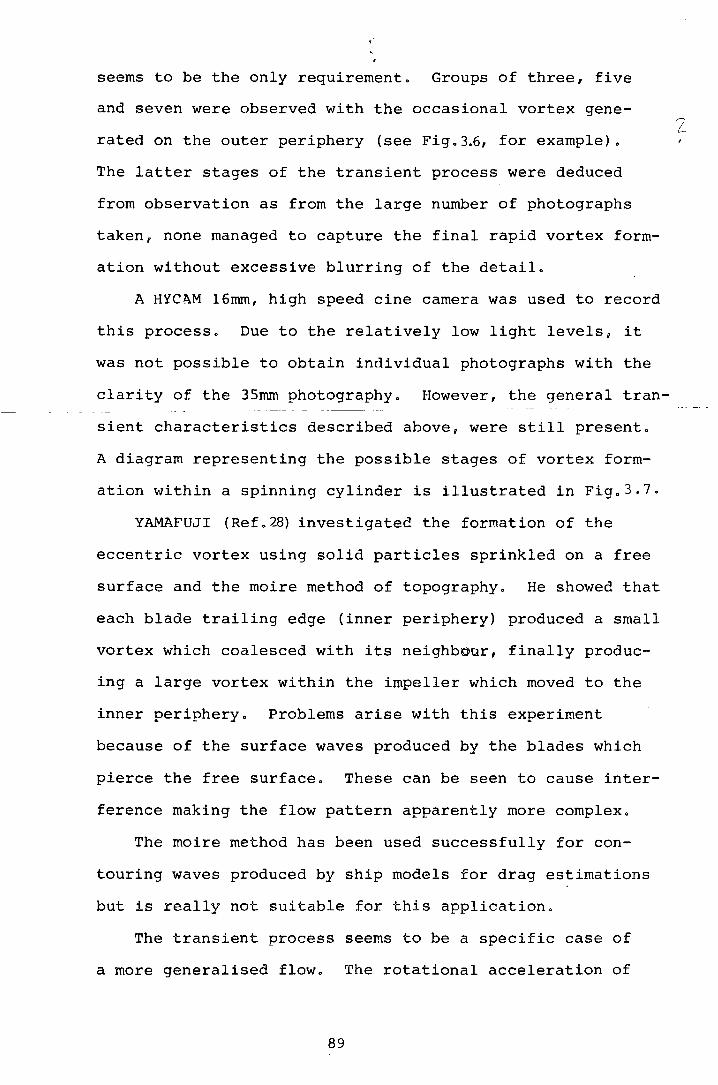
seems to be the only requirement. Groups of three, five
and seven were observed with the occasional vortex gene-
rated on the outer periphery (see Fig.3.6, for example).
The latter stages of the transient process were deduced
from observation as from the large number of photographs
taken, none managed to capture the final rapid vortex form-
ation without excessive blurring of the detail.
A HYC~M 16mm, high speed cine camera was used to record
this process. Due to the relatively low light levels, it
was not possible to obtain individual photographs with the
clarity of the 35mm photography. However, the general tran-
sient characteristics described above, were still present.
A diagram representing the possible stages of vortex form-
ation within a spinning cylinder is illustrated in Fig.3.7.
YAMAFUJI (Ref.28) investigated the formation of the
eccentric vortex using solid particles sprinkled on a free
surface and the moire method of topography. He showed that
each blade trailing edge (inner periphery) produced a small
vortex which coalesced with its neighbour, finally produc-
ing a large vortex within the impeller which moved to the
inner periphery. Problems arise with this experiment
because of the surface waves produced by the blades which
pierce the free surface. These can be seen to cause inter-
ference making the flow pattern apparently more complex.
The moire method has been used successfully for con-
touring waves produced by ship models for drag estimations
but is really not suitable for this application.
The transient process seems to be a specific case of
a more generalised flow. The rotational acceleration of
89
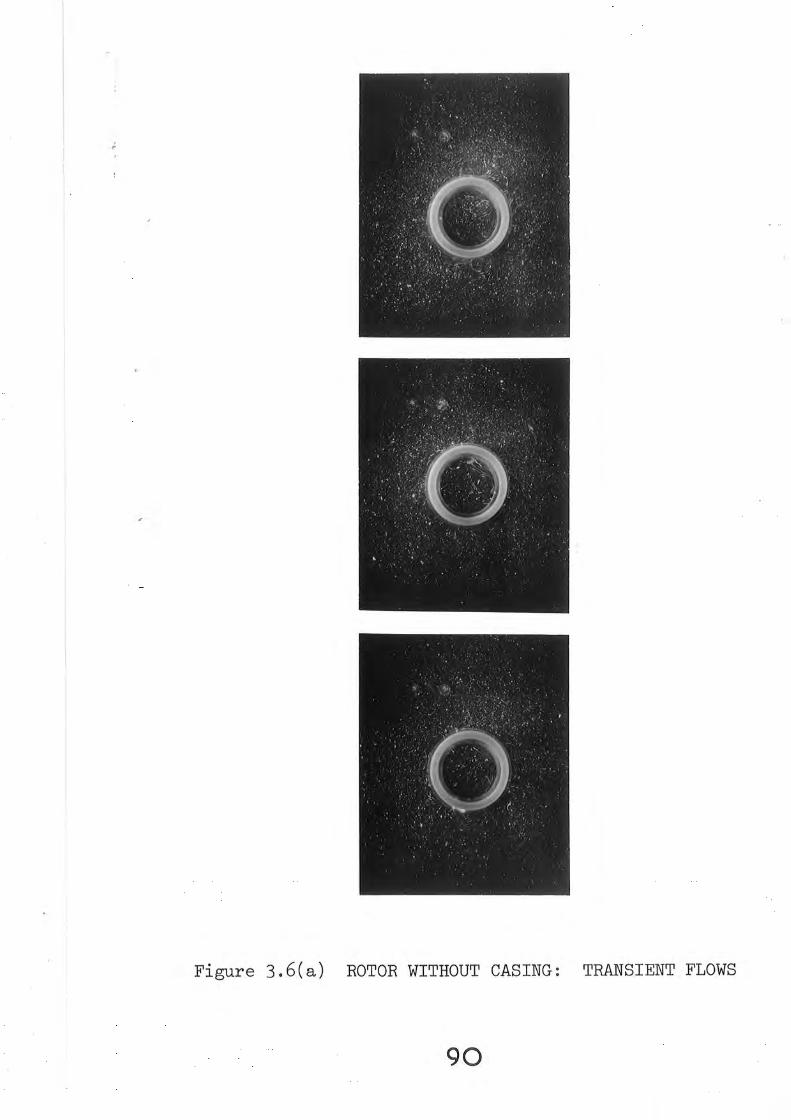
Figure 3.6(a) ROTOR WITHOUT CASING: TRANSIENT FLOWS
90
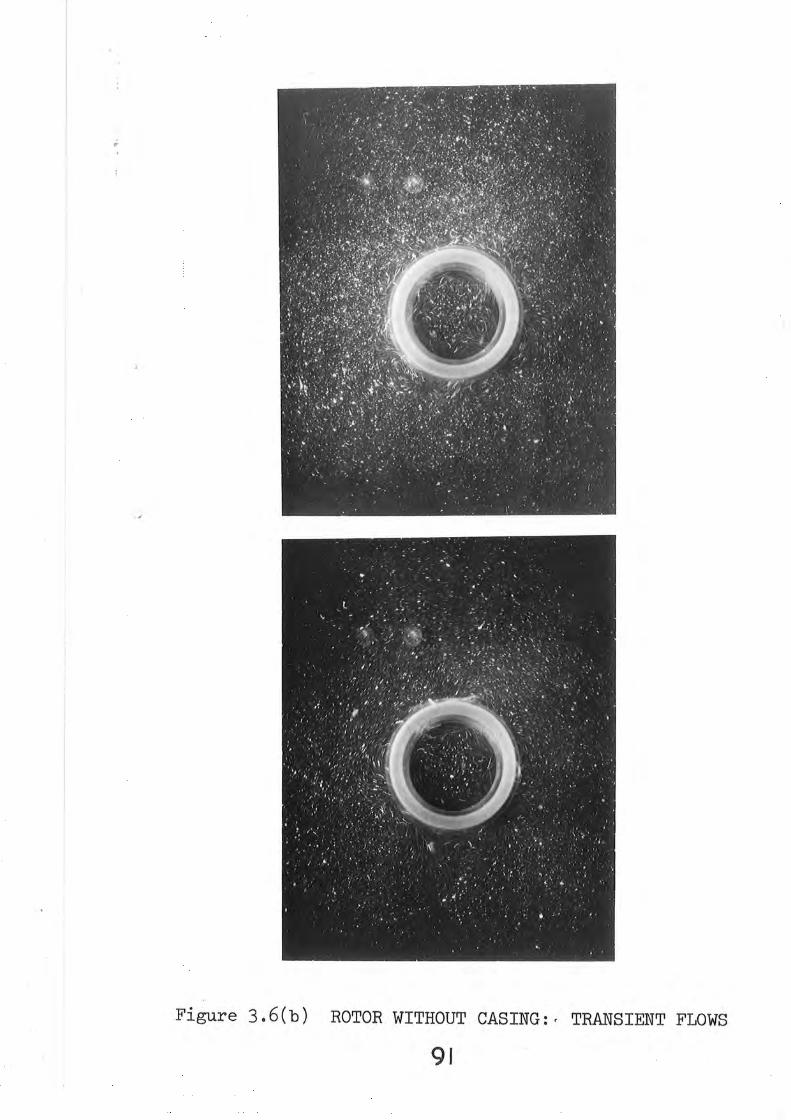
Figure 3.6(b) ROTOR WITHOUT CASING:· TRANSIENT FLOWS
91
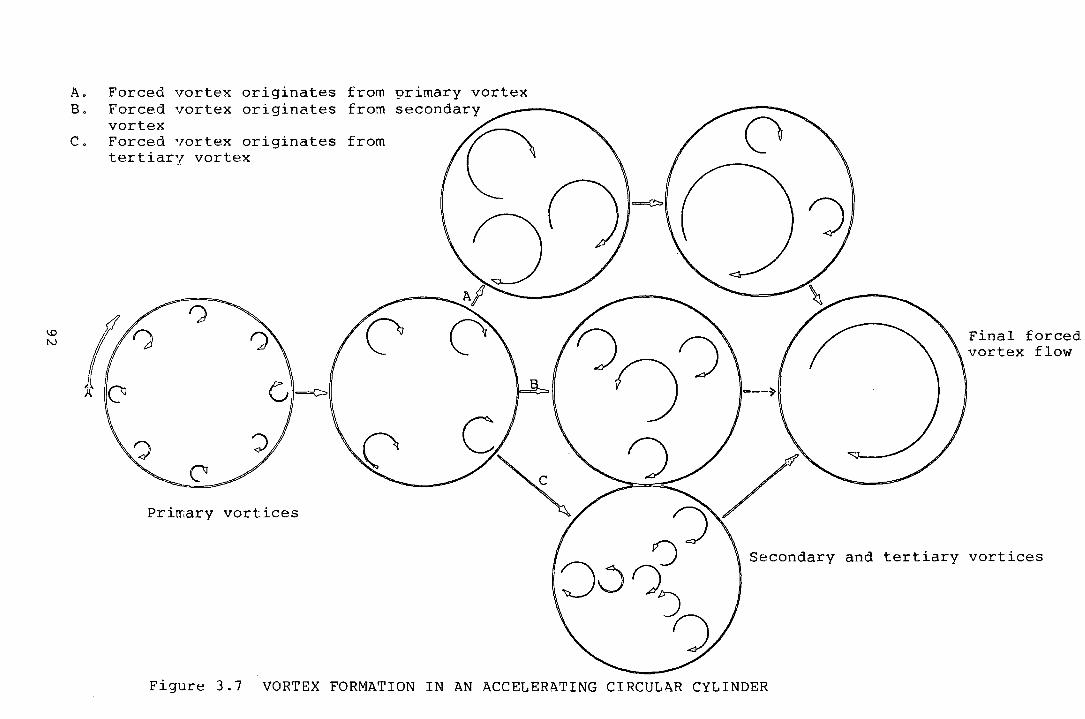
\0 N
A. B.
c.
Forced vortex originates Forced vortex originates vortex Forced vortex originates tertiary vortex
Primary vortices
from primary vortex from secondary
from
Final forced vortex flow
Secondary and tertiary vortices
Figure 3.7 VORTEX FORMATION IN AN ACCELERATING CIRCULAR CYLINDER
a hollow cylinder submerged in fluid, where the viscous
action between the solid and liquid produces high shear
stresses at the interface causes the formation of small
vortices around the inner periphery and finally results
in a forced vortex centred on the cylinder axis. Once
this is formed, the true cross flow action begins.
3.6.2 The Rotor with Casing
For each photograph, velocities in the various regions
were determined from a knowledge of the camera shutter
speed and the scale appearing in the first frame of each
film-. " The -information-- extracted from each of the photo
graphs took the form of:
(i) the effective inflow arc (this is different from the
geometrical inflow arc),
(ii) the general behaviour of the flow in the suction region,
(iii) the flow velocities in the suction region,
(iv) the size and velocity of the discharge jet over the
rear wall,
(v) the general behaviour of the flow in the interior region,
(vi) the flow velocities in the interior region,
(vii) the position of the vortex core,
(viii) the effective outflow arc (different from the geo~
metrical outflow arc),
(ix) the general behaviour of the flow in the discharge
region, and
(x) the flow velocities in the discharge region.
From the resulting data it was possible to identify
93

discrete zones of flow within the suction, interior and
discharge regions, as shown in Fig .3.8.
3.6.2.1 Flow in the Suction Region
The zones identified within the suction region were:
a) an inflow zone covering an arc beginning at the vortex
wall leading edge,
b) a discharge jet from the rotor interior covering an arc
beginning at the leading edge of the rear wall, and
c) a zone of entrained flow resulting from the jet over
the rear wall.
For the fan operating under medium throttle conditions,
the flow in the suction region exhibited all three regions.
Figure 3.9 shows the high velocity region close to the vortex
wall where the majority of the flow enters the fan (regiona
with velocities in this region estimated at 0.5 u2
• The
geometric suction arc consists of 80% inflow, with the
remainder comprising the jet (region b) and its associated
entrainment (region c). The velocity of the jet region is
the order of the blade speed, showing clearly that the
origin of the flow lies within the fan interior. {see
Fig :3.1() •
The suction region velocities for a throttled fan are
little different from those of the full flow condition.
However the inflow arc then diminishes to 50% of the geo
metric arc, with the rear wall jet becoming increasingly
dominant containing flow velocities up to 3.0 u2 • This
jet region appears to be a major source of losses and hence
94
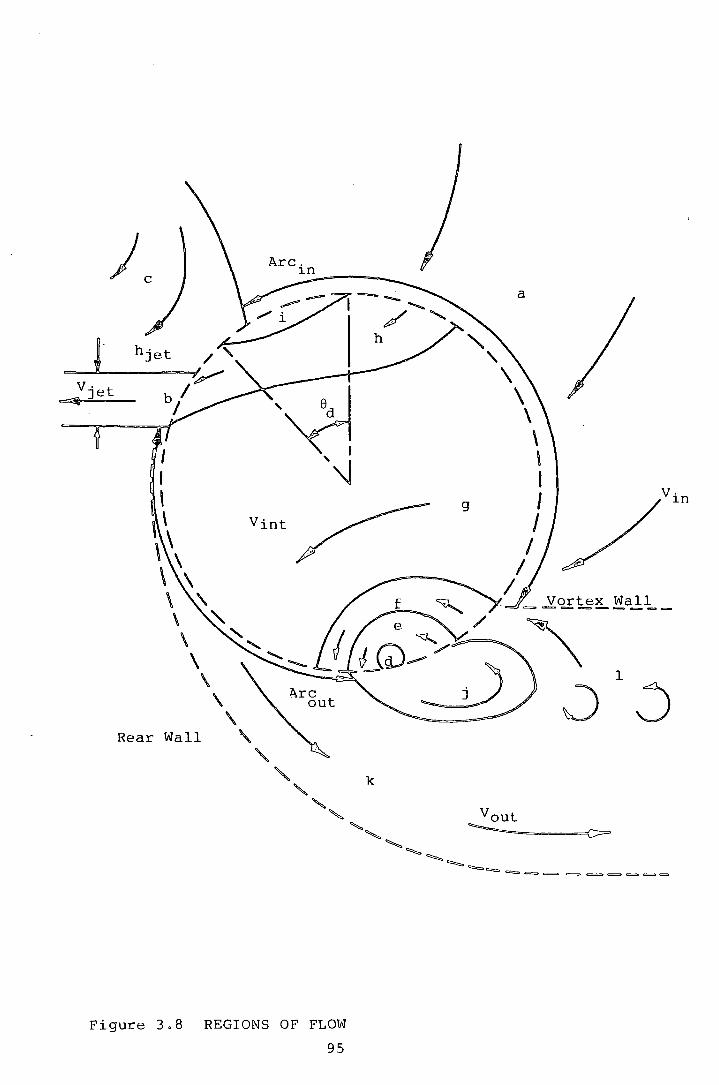
hjet / '
b I I
~
Rear Wall
Figure 3.8 REGIONS OF FLOW
95
k
'
g
' \ \ \
I I
\ \ I I I
I
Vortex Wall ~ -=::. ~ ~ c===- - -==- ~ -=-
1
Vaut ~
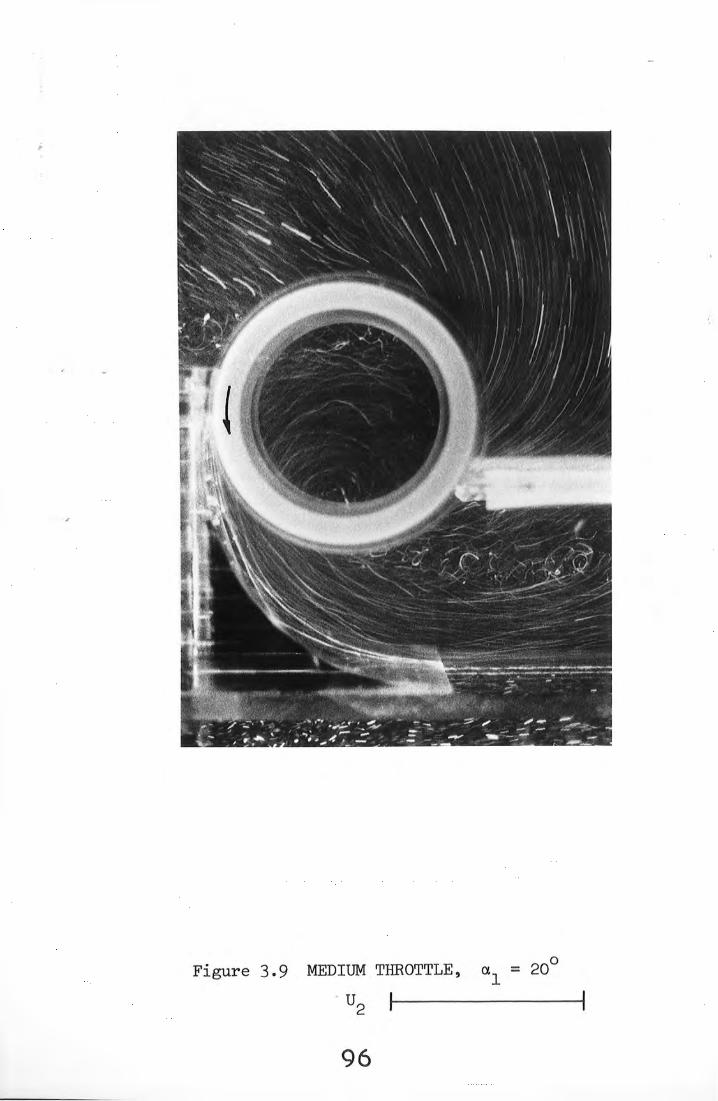
Figure 3.9 MEDIUM THROTTLE,
-u 2
96
0 a = 20
1

Figure 3.10 HIGH THROTTLE, a1 = 0°
u2 H
97
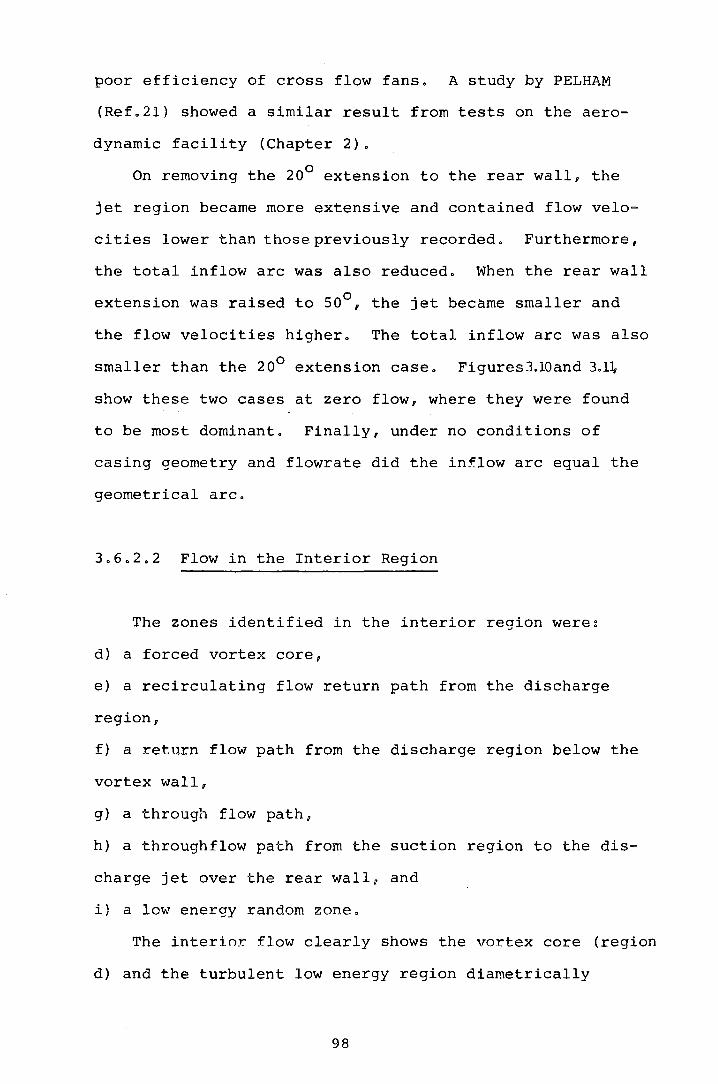
poor efficiency of cross flow fans. A study by PELHAM
(Ref.21) showed a similar result from tests on the aero
dynamic facility (Chapter 2).
On removing the 20° extension to the rear wall, the
jet region became more extensive and contained flow velo
cities lower than thosepreviously recorded. Furthermore,
the total inflow arc was also reduced. When the rear wall
extension was raised to 50°, the jet became smaller and
the flow velocities higher. The total inflow arc was also
smaller than the 20° extension case. Figures3.10and 3.1],
show these two cases at zero flow, where they were found
to be most dominant. Finally, under no conditions of
casing geometry and flowrate did the inflow arc equal the
geometrical arc.
3.6.2.2 Flow in the Interior Region
The zones identified in the interior region were:
d) a forced vortex core,
e) a recirculating flow return path from the discharge
region,
f) a return flow path from the discharge region below the
vortex wall,
g) a through flow path,
h) a throughflow path from the suction region to the dis
charge jet over the rear wall, and
i) a low energy random zoneo
The interior flow clearly shows the vortex core (region
d) and the turbulent low energy region diametrically
98
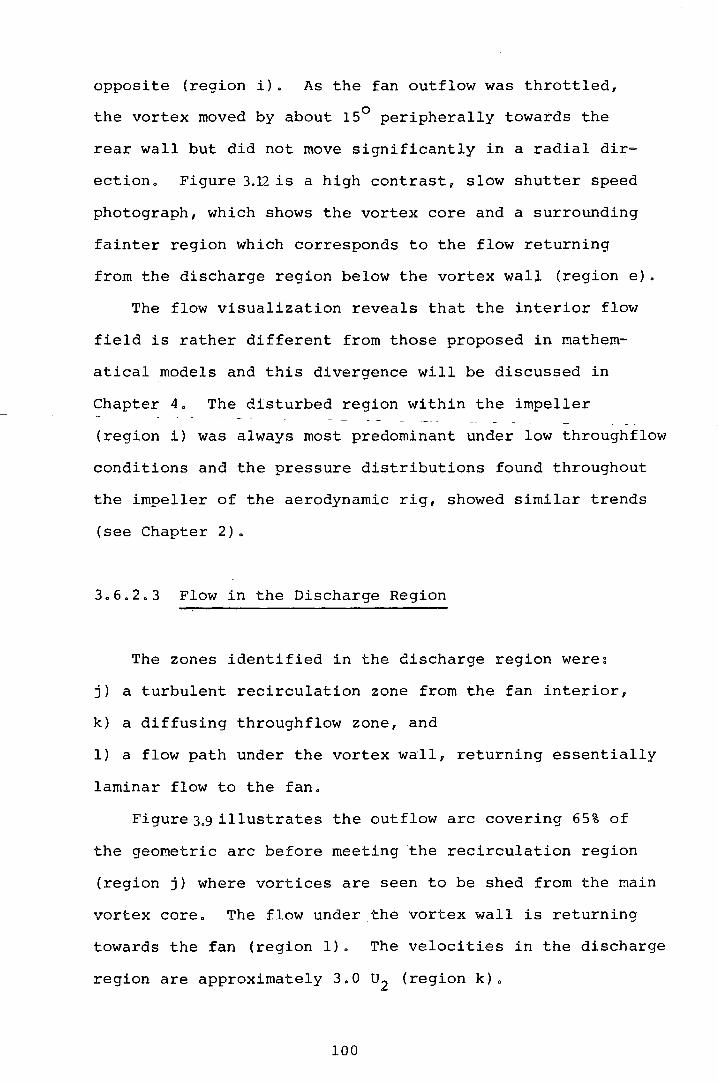
opposite (region i). As the fan outflow was throttled,
the vortex moved by about 15° peripherally towards the
rear wall but did not move significantly in a radial dir~
ection. Figure 3.12 is a high contrast, slow shutter speed
photograph, which shows the vortex core and a surrounding
fainter region which corresponds to the flow returning
from the discharge region below the vortex wall (region e).
The flow visualization reveals that the interior flow
field is rather different from those proposed in mathem
atical models and this divergence will be discussed in
Chapter 4. The disturbed region within the impeller
(region i) was always most predominant under low throughflow
conditions and the pressure distributions found throughout
the impeller of the aerodynamic rig, showed similar trends
(see Chapter 2).
3.6.2.3 Flow in the Discharge Region
The zones identified in the discharge region were:
j) a turbulent recirculation zone from the fan interior,
k) a diffusing throughflow zone, and
1) a flbw path under the vortex wall, returning essentially
laminar flow to the fan.
Figure33illustrates the outflow arc covering 65% of
the geometric arc before meeting the recirculation region
(region j) where vortices are seen to be shed from the main
vortex core" The flow under the vortex wall is returning
towards the fan (region 1}. The velocities in the discharge
region are approximately 3.0 u2 (region k}.
100
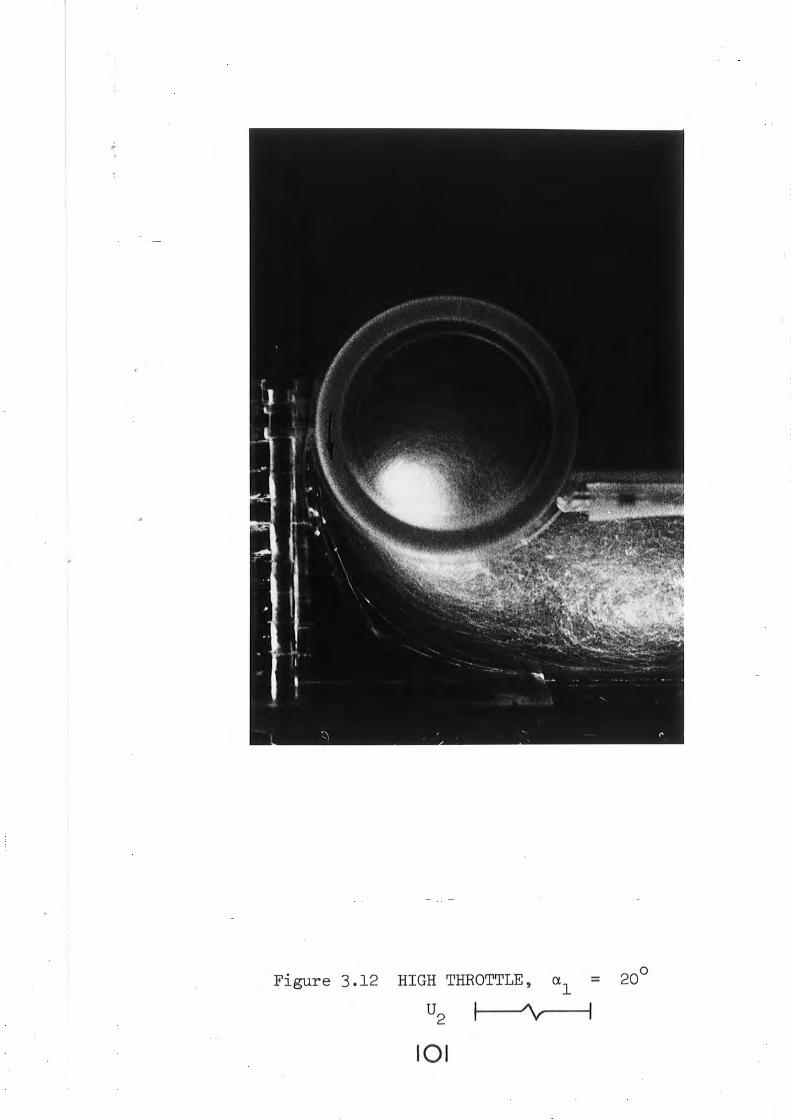
Figure 3.12 HIGH THROTTLE, a1 = 20°
u2 I ~----~
10 1

~3.U illustrates the zero flow criterion and shows
the large recirculating region in the fan discharge (region
j}. It is important to appreciate that zero flow relative
to the fan cannot exist by throttling the outlet duct as
flow is always maintained through the fan owing to re-
circulation within the duct. A true zero flow condition
can only be imposed using a damper installed adjacent to
the fan outlet and extending over the geometric arc. The
vortex then moves to the centre of the rotor and the
interior flow field becomes that of a forced vortex.
The size and associated velocities of the zones dis-
cussed ±n Section 3.6.2.3 were found to be entirely depen-
dent on the flow rate passing through the fan. Table 3.2
· th h t h' d t k for the 0°, 20° summar1zes e p o ograp 1c recor s a en
and 50° extensions to the rear wall, with the specific
parameters labelled on Fig .3.8. Figure 3.14 illustrates a
more general view of the total flow fields mentioned pre-
viously and clearly indicates that the cause of pulsations
found during the use of many of these units stems from
the shed vortices and recirculation in the outlet duct.
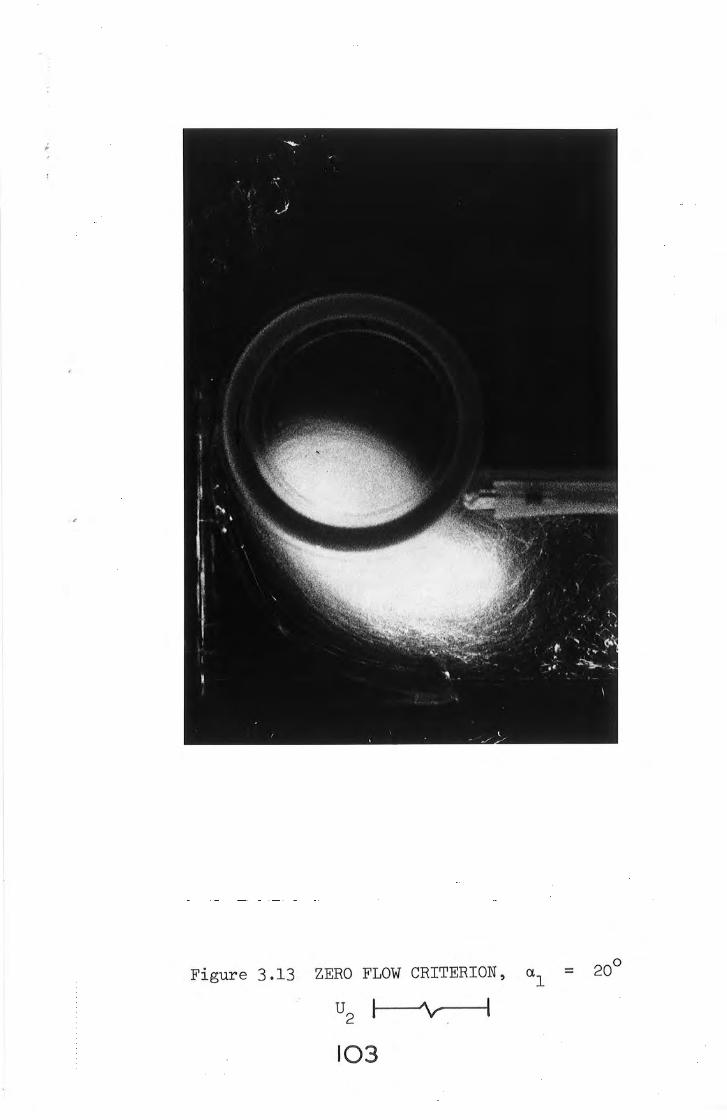
Figure 3.13 ZERO FLOW CRITERION,
u2 I y--t
103
0 ct = 20
1
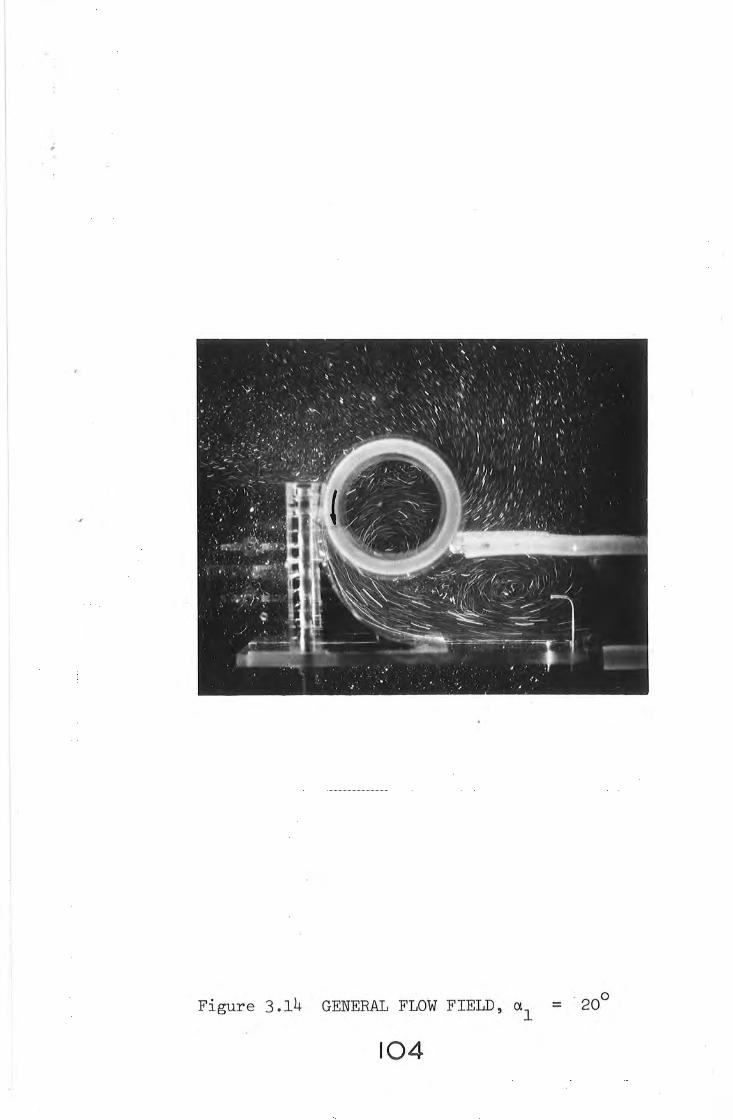
Figure 3.14 GENERAL FLOW FIELD, a1 = 20°
104
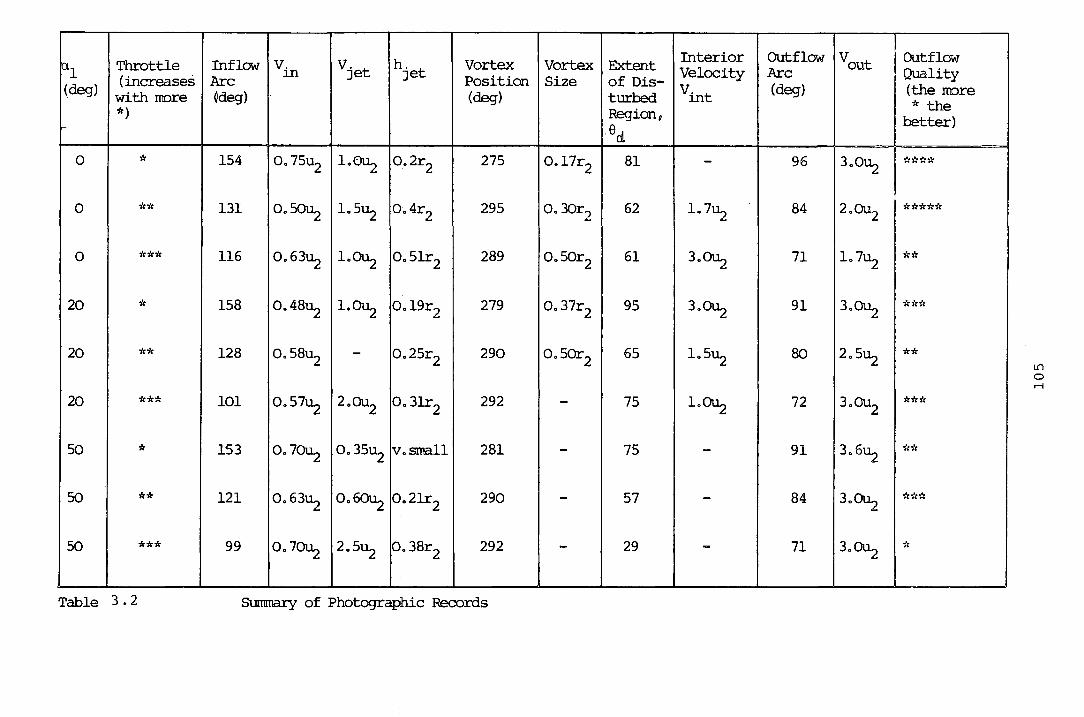
~1 Throttle Inflow v. vjet h. t Vortex (increases Arc m Je Position
(deg) with more Qdeg) (deg) *)
0 * 154 0. 75u2 1.~ 0.2r2 275
0 ** 131 o.~ 1.5~ 0.4r2 295
0 *** 116 0.63~ 1.~ 0.51r2 289
20 * 158 0.48~ 1.~ o. 19r2 279
20 ** 128 0.58u2 - 0.25r2 290
20 *** 101 0.57~ 2.~ 0.3lr2 292
50 * 153 0.7~ 0.35~ v.small 281
50 ** 121 0.63~ 0.6~ 0.2lr2 290
50 *** 99 0.7~ 2.5~ 0. 38r2 292
Table 3. 2 Summary of Photographic Records
Vortex Extent Interior
Size of Dis- Velocity
turbed vint Regionu eat
0.17r2 81 -
0. 30r2 62 1.7~
0.50r2 61 3.~
0.37r2 95 3.~
0.50r2 65 1.5~
- 75 1.~
- 75 -
- 57 -
- 29 -
Outflow vout Arc (deg)
96 3.0u:2
84 2.0U2
71 1. 7~
91 3.~
80 2.5~
72 3.0U2
91 3.6~
84 3.~
71 3.0U2
I 1j OUtflow
Quality (the more *the
better)
****
*****
**
***
**
***
**
***
*
I
i
--
L{)
0 ...-i
CHAPTER FOUR
THEORY OF THE CROSS FLOW FAN
"One cannot escape the feeling that these mathematical
formulas have an independent existence and intelligence
of their own, that they are wiser than we are, wiser even
than their discoverers, that we get more out of them than
was originally put into themo
Hertz
106
4. THEORY OF THE CROSS FLOW FAN
4.1 Introduction
As yet, no theory exists which satisfactorily explains
the basic operation of the cross flow fan. Since its
introduction by Paul :vi ORTIER of France in 1891, numerous
workers have puzzled over this problem with limited success.
Only methodical experimentation has made a significant con
tribution to the development of the cross flow fan. However,
this too, has proved to yield results which are at times
confusing and inconsistent. There is little doubt that a
predictive performance theory would benefit the design
engineer but analytical attempts have provided only partial
answers to this enigma.
Without a proper understanding of the processes of
energy transfer and the consequent losses, it is not poss
ible to make even crude predictions. This forces severe
limitations upon the future development of this blower.
Even so, the theoretical models postulated during the last
25 years have given some clues, which a few research
workers have put to good use, often providing a guide to
experiment.
A brief summary of cross flow fan theory is given by
the author in ref. n. In this chapter 1 the author intends
to review some of the more important papers and finally to
extend the work of IKEGAtH and l'iURATA (ref. 13).
107
4.2 The Theory of COESTER
Robert COESTER (ref. 7:) worked in Switzerland on cross
flow fan theory and experimentation during the period of
great research activity Setween 1955 and 1957. His was
the first detailed theoretical exploration of the fan's
principle of operation and the flow fields likely to be
encountered within the impeller. An experimental study of
the flow on either side of the blade row gave rise to the
conclusion that the flow within the impeller consisted of
two zones, which he describes as;
(i) a region of approximately constant total pressure and
(ii) a region of random, low energy flow, i.e. low total
pressure.
(It is by no 1 means obvious why COESTER described the flow
in the forced vortex region as random or low energy, as
in fact it is highly organised.)
These correspond to the free and forced vortex zones,
respectively. COESTER's experiments indicated that the
boundary between these two zones was well enough defined
that a streamline of constant static pressure (i.e. con- .
stant velocity) enabled the so called 'dead water zone' to
be removed from the flow altogether. This left a two-
dimensional potential field for analytical treatment using
Laplace's equation in polar co-ordinates.
~} dr = 0 ( 1)
A general solution obtained by the method of separation of
~ariables was found to be
108
( 2)
which may be superimposed upon other solutions as it is
a harmonic and analytic solution of Laplace's equation.
The boundary condition on the inner periphery of the rotor,
ensured the velocity potential function became unique
<f>(1,e) = :F(e)
for r = 1 and the most logical form for the periodic F(8)
being a Fourier series
F(8) = ft (an sin n8 + bn cos n8) ( 3)
Defining F(8) as a polynomial allowed a variety of boundary
conditions to be considered
F(8) = E A 8m -IT<6<IT m m ( 4)
and the fourier coefficients were then written;
a = Amr n8m sin n8 d8 nm IT j -n
and b nm AfTI = m IT -TI
em cos nB dS
( 5)
( 6)
A solution of Laplace's equation was then expressed
<P = E E rn (a sin ne + b cos n8) (7) m n nm nm
the resulting value depending on the boundary conditions
applied. The Cauchy-Riemann relations yielded the ortho-
gonal expression for stream function
1/J=E rn ft r n (a cos n8 + b sin n8) nm nrn
( 8)
Initially, COESTER chose the simple case rn = 1 and
found that substitution in eqns. (5) to (8) gave;
_ , r sinS <Pl - 2A1 ~rctan( 1 + r cose) ( 9)
109

which produced a potential vortex with a core located at
coordinate (1,TI) as shown in Fig.4.1 • Determination of the
flow velocities was carried out using;
and substituting from eqn. (9) gave;
q = - A Tan (~} r 2
and q = - A, a constant . e
(11)
(12)
(13)
(14)
COESTER commented on these results, 'If a boundary
condition q8
= constant is assumed, the flow regime is
that of a vortex with its centre on the rotor inner peri-
phery and for such a vortex, q follows a tangent law; r
where 8 = 0 is at a point 180° away from the vortex core.
Casings which attempt to· guide the flow, other than in ~··. · c'~
accordance with this law, will either be unsatisfactory or
generate other vortices which will accommodate the
situation.'
COESTER found that these conditions could only be
satisfied with the blade angle on the inner periphery of /
the rotor, !3 1 = 90° (which by definition implied q 8 constant,
for perfect guidance through the blade row, i.e. an
infinite number of blades). The calculation involving
eqns. (7) and (8) was extended to include terms for m = 2
and 3. The solution obtained displayed an accelerated
throughflow, with no streamlines of constant static pres-
sure, as shown in Fig.4.2, and as such, the low energy
110

-2.0
-3.0
1. 39
m = 1
l\ = 1
Figure 4.1 POTENTI~L VORTEX SOLUTION (COESTER)
1, l\1 = 6.96
= 2, A2 = 1. 50
m = 3, A3 = 0.50
Figure 4.2 ACCELERATED FLOW (COESTER)
111

region could not be removed from the solution. To over-
come this, two unit vortices were introduced to achieve
the desired condition and this is shown in Fig.4.3. COESTER
then found it possible to choose q 8 and qr independently
by selecting suitable constants to give the tangential com-
ponent of velocity and by adjusting the strength of the
unit vortices to change q • Establishing a line of r
constant static pressure tended to limit the choice of g • r
The resulting casing designs showed a marked similarity
to those of MORTIER, especially in respect of their close
fitting arrangement. In an attempt to improve the radial
velocity profile at exit from the rotor, COESTER included
a vortex opposite the main vortex, which increased the
energy of the flow farthest from the main vortex. This
was thought to remove the poor effect of a free vortex on
the distribution of energy at outlet and thus to improve
the pressure recovery in the diffuser. By moving this
vortex away from the symmetrical position, it was found
possible to either accelerate or decelerate the flow through
the rotor. Again, vortex distributions were needed to
reduce one streamline to a constant static pressure. COESTER
said about this situation that vThe creation of the vortex
opposite the Main vortex, automatically causes the vortex
distributions to be formed, whether or not the housing
construction favours this. 0 (see Fig.4.4).
COESTER 0 s later casing designs show direct evidence of
the use of this theoretical study, with a fairly complicated
housing geometry containinq two large recirculating pockets
to presumably induce the vortex distributions described. (fig. 1.3)
112
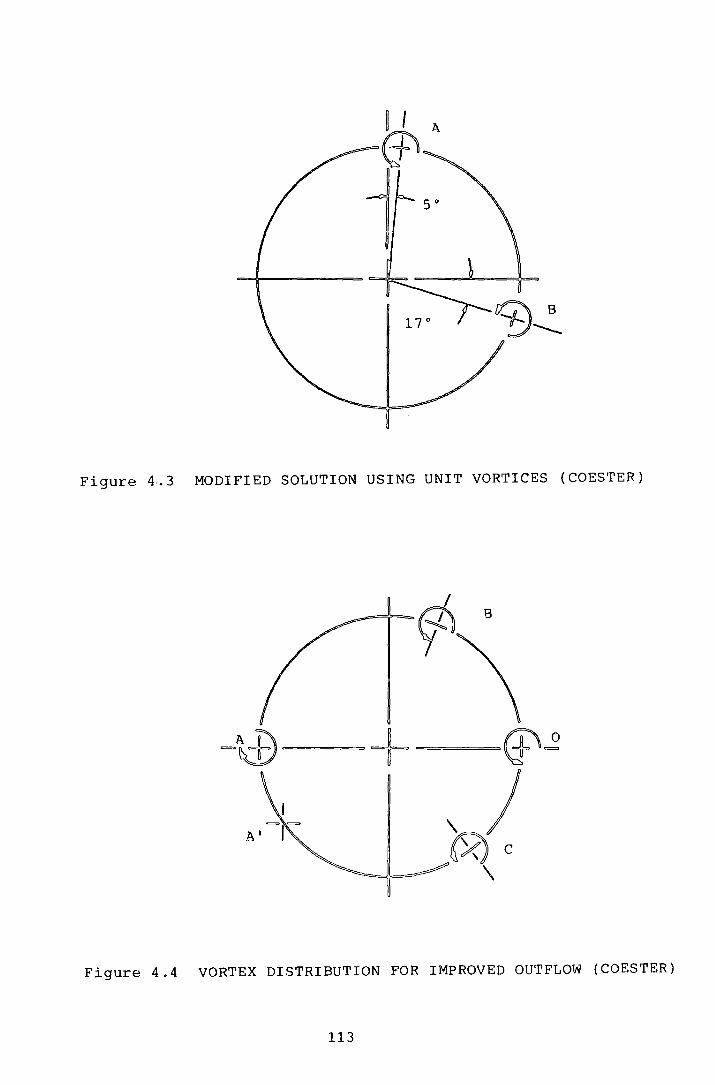
Figure 4 .. 3 MODIFIED SOLUTION USING UNIT VORTICES ( COESTER)
Figure 4.4 VORTEX DISTRIBUTION FOR IMPROVED OUTFLOW (COESTER)
113
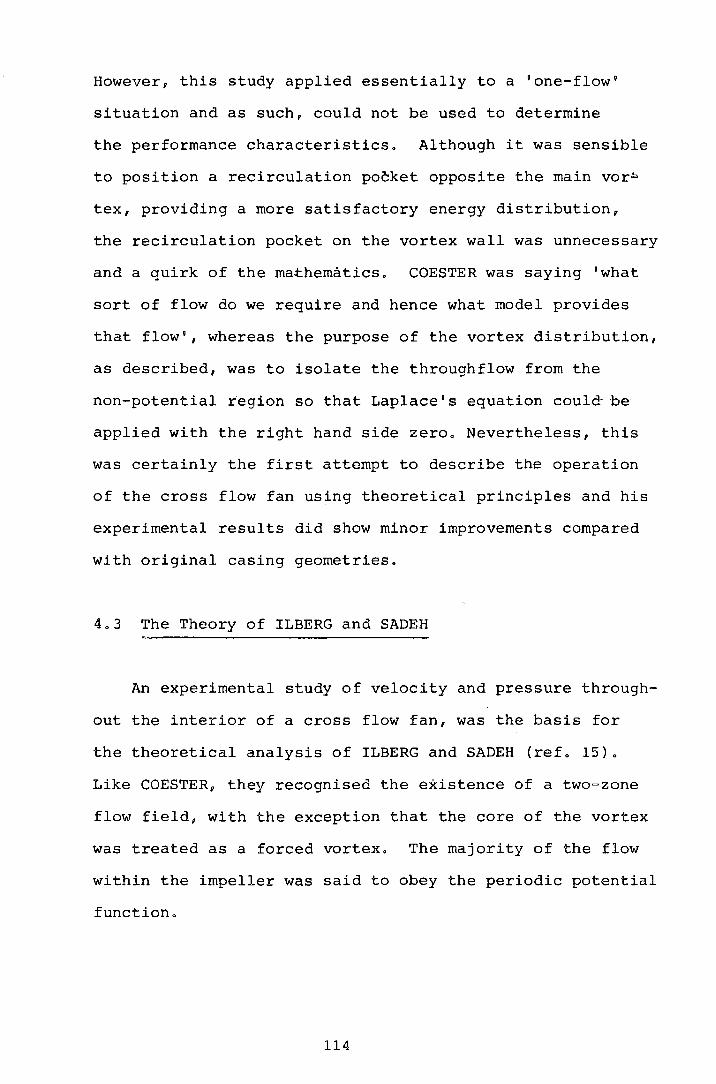
However, this study applied essentially to a 0 one-flow 0
situation and as such, could not be used to determine
the performance characteristics. Although it was sensible
to position a recirculation pocket opposite the main vor~
tex, providing a more satisfactory energy distribution,
the recirculation pocket on the vortex wall was unnecessary
and a quirk of the ma~hematics. COESTER was saying 0 what
sort of flow do we require and hence what model provides
that flow 0, whereas the purpose of the vortex distribution,
as described, was to isolate the throughflow from the
non-potential region so that Laplace 0 s equation could be
applied with the right hand side zero. Nevertheless, this
was certainly the first attempt to describe the operation
of the cross flow fan using theoretical principles and his
experimental results did show minor improvements compared
with original casing geometries.
4.3 The Theory of ILBERG and SADEH
An experimental study of velocity and pressure through
out the interior of a cross flow fan, was the basis for
the theoretical analysis of ILBERG and SADEH (ref. 15).
Like COESTER, they recognised the existence of a two-zone
flow fieldv with the exception that the core of the vortex
was treated as a forced vortex. The majority of the flow
within the impeller was said to obey the periodic potential
function.
114
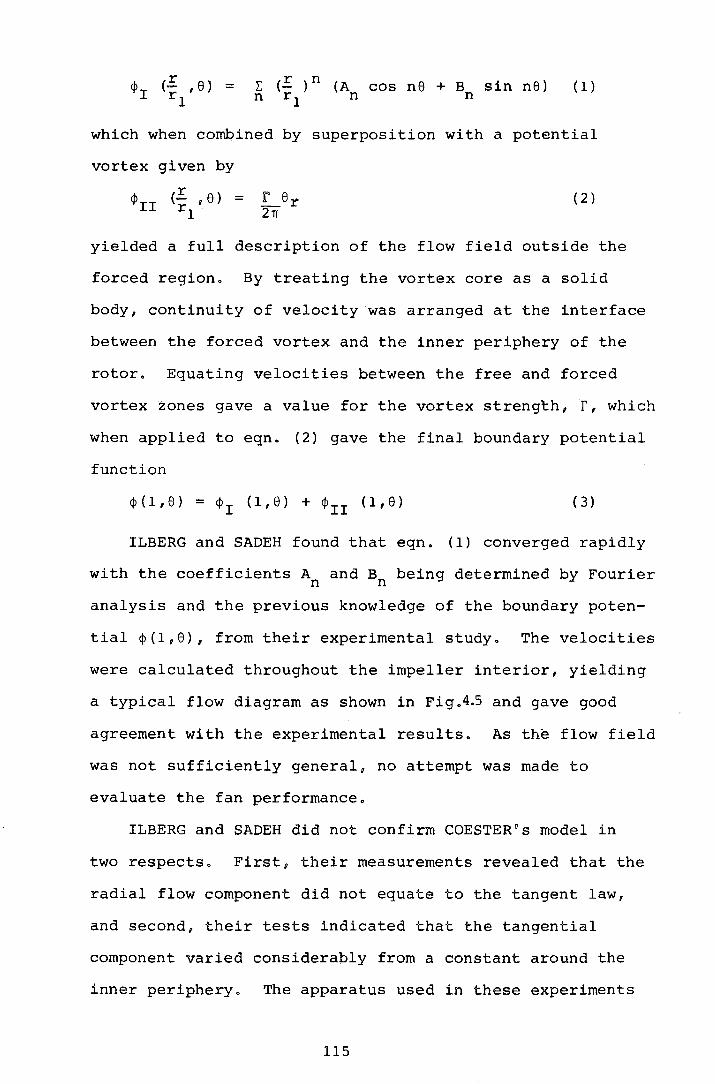
r <Pr <- , 8) = r1
~ (E )n (A cos n8 + B sin n8) n r 1 n n
( 1)
which when combined by superposition with a potential
vortex given by
"' (!: 8) = '~'rr r , 1
( 2)
yielded a full description of the flow field outside the
forced region. By treating the vortex core as a solid
body, continuity of velocity was arranged at the interface
between the forced vortex and the inner periphery of the
rotor. Equating velocities between the free and forced
vortex zones gave a value for the vortex strength, r, which
when applied to eqn. (2) gave the final boundary potential
function
¢(1,8) = ¢1
(1,8) + ¢11
(1,8) ( 3)
ILBERG and SADEH found that eqn. (1) converged rapidly
with the coefficients A and B being determined by Fourier n n
analysis and the previous knowledge of the boundary poten-
tial ¢(1,8), from their experimental study. The velocities
were calculated throughout the impeller interior, yielding
a typical flow diagram as shown in Fig .4.5 and gave good
agreement with the experimental results. As the flow field
was not sufficiently general, no attempt was made to
evaluate the fan performance.
ILBERG and SADEH did not confirm COESTER 0 s model in
two respects. First, their measurements revealed that the
radial flow component did not equate to the tangent law,
and second, their tests indicated that the tangential
component varied considerably from a constant around the
inner periphery. The apparatus used in these experiments
115
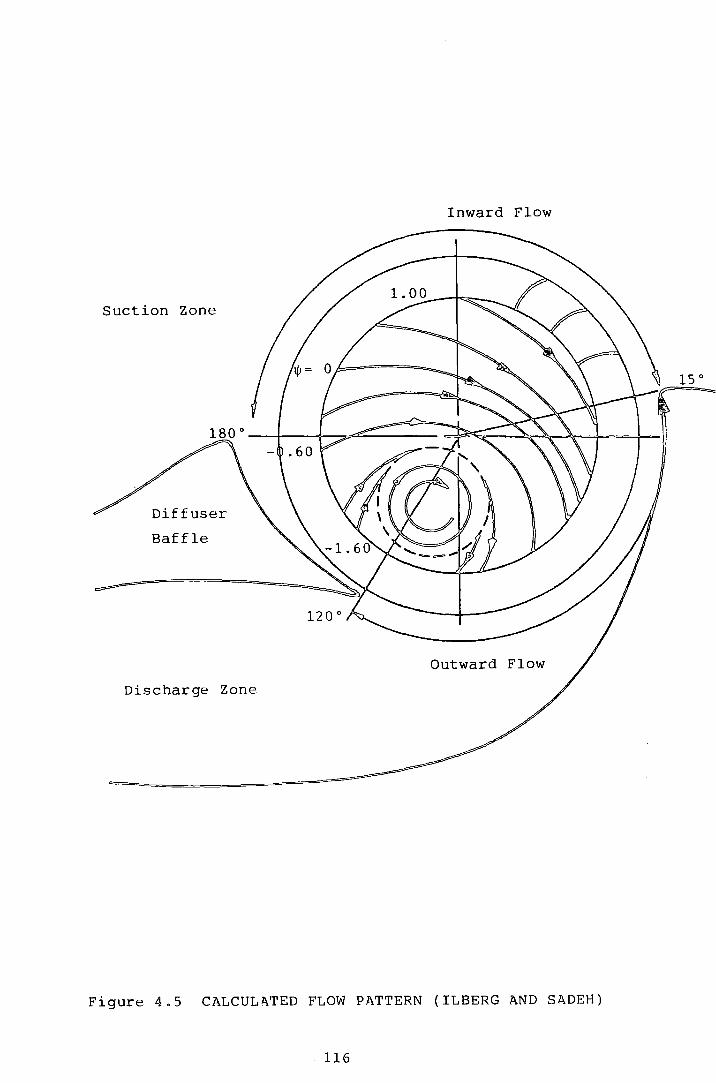
Suction Zone
Diffuser
Baffle
Discharge Zone
Inward Flow
Figure 4.5 CALCUL~TED FLOW PATTERN (ILBERG AND S~DEH)
116

may explain these discrepancies. The impeller had a very
low aspect ratio of 0.25 and the non-drive end plate of
the rotor was fixed. A secondary flow perpendicular to
the main flow was described, which they attributed to the
superposition of the flow caused by the rotor disc and
the main flow but more likely, the pressure gradient
across the rotor was caused by a boundary layer set up on
the fixed end plate. Hence, the short rotor may have
accounted for many of the flow properties encountered.
The forced vortex.region was treated as solid body rotation
but the assumption of equivalent velocities on the boundary
with the inner periphery, although intuitively correct,
resulted in further problems which will be commented on in
a later chapter. Finally, like the COESTER solution, this
model was selected for a particular flow rate and consisted
of fitting the developed theory to the experimental results.
This analysis cannot be extended to predict the fan
performance.
4.4 The Theory of MOORE
The paper of MOORE (ref. 16) stemming from work at the
National Engineering Laboratory during 1972, derived the
change in angular momentum between suction and discharge
by the use of a mean line joining all the stations consid
ered across the rotoru as shown in Fig. 4.6. The Euler
head, ~~ of a generalised impeller was written as a func
tion of the flow coefficient, ~. By examining this
equationu MOORE was able to determine the contribution of
117

suction
Discharge
llB
I
At I I
the inlet and discharge blade rows, to the total pressure
rise. From this emerged the new concept of controlling
the two-stage pressure generation, so that a characteristic
could be obtained which would rise continuously from full
to zero flow, with no possibility of the fan stalling.
MOORE suggested that stability would be achieved by
operating the first stage blades as a turbine over a portion
of the flow range. The overall design procedure was
iterative, relying on the correct choice of vortex strength
to obtain the desired values for a particular casing geo-
metry. MOORE added that the net value of total pressure
rise, governed the inlet and hence exterior blade angles
(8 2 ) with freedom of choice for the interior blade angles
(8 1 ) being limited and essentially fixed by the ratio of
the suction to the discharge arc.
There was good agreement with his experimentally
evaluated results in some cases but in others, the corre~
lation was poor and MOORE suggested that the general depar-
ture from the theory was due totally to the losses within
the vortex. This, he explained from the equality
Total Power Input, y = ~ ¢ + Power lost in the momentum
change in the vortex, y . v
from which was obtained an expression for the power absorbed
by the vortex
Yv = ¢ ~~
where ~~ is the departure from theory.
MOORE 1 s quest for a vstable tangential f~h 0 led him
to a preliminary design which indeed produced a desirable
performance characteristic. The departure from the
119

estimated Euler line suggested the power consumed by the
vortex was high. He stated that all subsequent research
should be directed towards r.educing this loss, probably
by means of an internal guide vane positioned to reduce
the work done by the second stage blading in the recircu.::..
lating region.
It appears that the line chosen to bisect the inlet
arc, is an attempt perhaps to find a mean condition (see
Fig.4.6). Experiments (ref. 21) have however shown that
the bulk of the inflow occurs close to the vortex wall and
his mean line is far from representing the mean flow.
It is doubtful whether a·simple analysis of this sort
can ever be expected 'to produce satisfactory results, given
the extreme variation over both the inflow and outflow
arcs.
MOORE attributed the majority of losses to those
occurring within the vortex region. He states that up to
one half of the input power could be dissipated with some
designs. There will, of course, be losses occurring in
the vortex region but others are present, such as the so
called 0 shock 0 losses, due to the relative flow angle
departing from the inlet blade angle and this will be
discussed later.
Although interesting to note that ~~ was found to be
virtually constant over the design range, MOORE 0 s calcul
ations also showed it could become negative, which implied
that energy was being transferred from the vortex to the
throughflow. Clearly this is unacceptable as energy
cannot continuously be exchanged from the vortex but
120
may occur over an unstable transient period.
4.5 The Theory of IKEGAMI and MURATA
The work of IKEGAMI and MURATA (Ref .13) at Os.aka
University during the period up to 1966 was novel in many
respects. It displays the possibility of a completely
analytic solution based on rotor geometry, with an internal
flow field allowing the vortex complete mobility within
the rotor. A simple casing was also included, providing
separation between the suction and discharge sides in the
form of a dividing streamline. This analysis is considered
so radical that the author intends to review this study,
in some detail, with consideration given to the progression
of thougtt and the generation of ideas as the theory unfolds.
From the abstract to their paper 0 The authors tried to
calculate characteristics of a cross flow fan which consis-
ted of a simple linear casing and an impeller with an infi-
nite number of blades, on the assumption that the fluid was
non-viscous and incompressible'. They considered that
failing to realise the effect of casing configuration on
the performance, was the major defect in previous theories.
They later showed that the flow within the impeller could
not be judged 1as purely potential and their equations
included this possibility.
I~EGAMI and MURATA began the analysis with the suction
region which could be regarded as purely potential flow,
obeying LAPLACE'S equation in the forrr
d21}; dl}; 2 (l) 1 1 d tiJ
0 +- +- --· = d!r2 r dr r2dcj>2
121
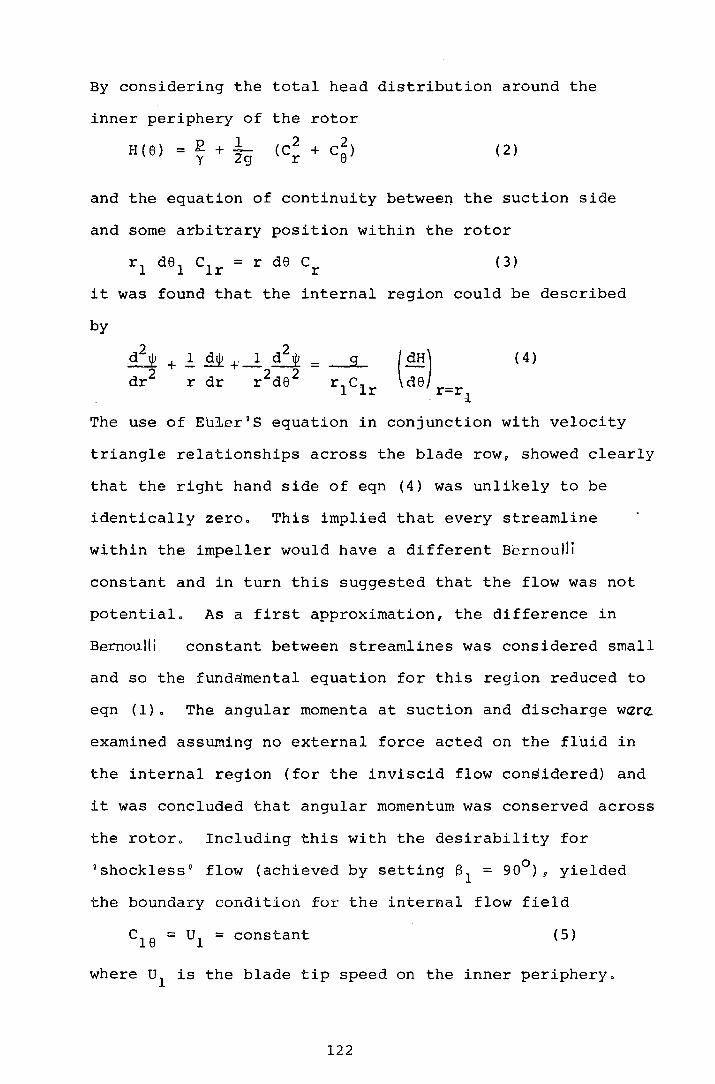
By considering the total head distribution around the
inner periphery of the rotor
H(6) = E + l_ (C 2 + c2 } y 2g r e ( 2)
and the equation of continuity between the suction side
and some arbitrary position within the rotor
( 3)
it was found that the internal region could be described
by
( 4)
The use of Eu~er 1 S equation in conjunction with velocity
triangle relationships across the blade row, showed clearly
that the right hand side of eqn (4) was unlikely to be
identically zero. This implied that every streamline
within the impeller would have a different Bernoulli
constant and in turn this suggested that the flow was not
potential. As a first approximation, the difference in
Bernoulli constant between streamlines was considered small
and so the fUndamental equation for this region reduced to
eqn (1}. The angular momenta at suction and discharge wara
examined assuming no external force acted on the fluid in
the internal region (for the inviscid flow con~idered) and
it was concluded that angular momentum was conserved across
the rotor. Including this with the desirability for
0 shockless 0 flow (achieved by setting 81 = 90°} u yielded
the boundary condition for the internal flow field
c18 = u1 = constant ( 5)
where u1 is the blade tip speed on the inner periphery.
122
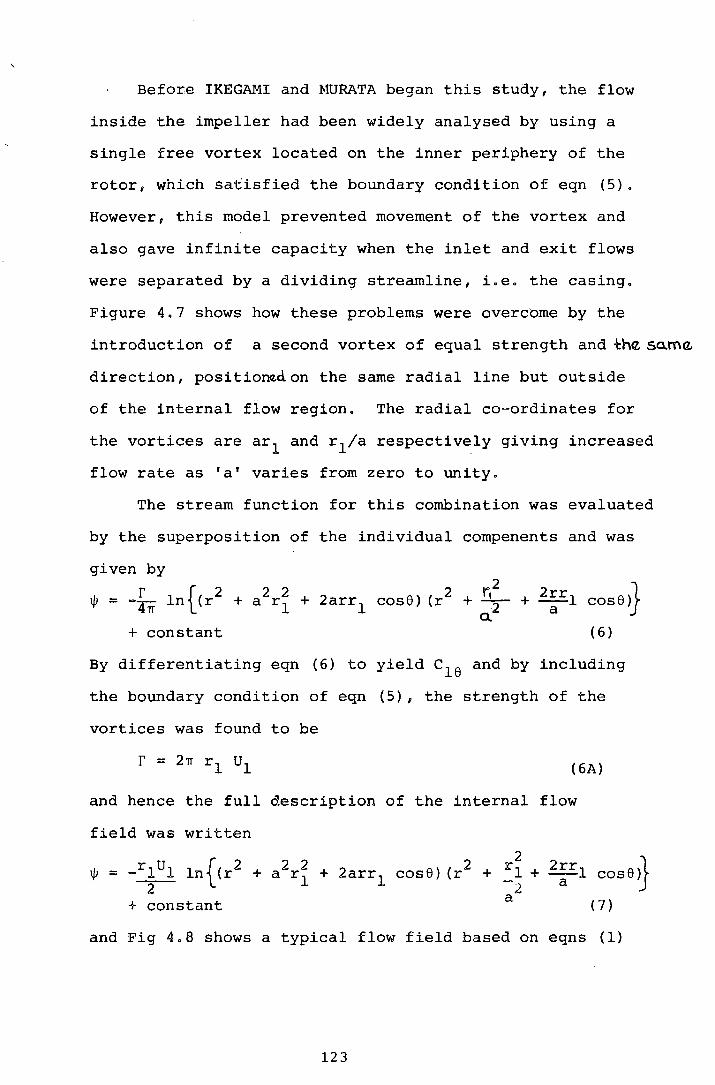
Before IKEGAMI and ~IDRATA began this study, the flow
inside the impeller had been widely analysed by using a
single free vortex located on the inner periphery of the
rotor, which satisfied the boundary condition of eqn (5).
However, this model prevented movement of the vortex and
also gave infinite capacity when the inlet and exit flows
were separated by a dividing streamline, i.e. the casing.
Figure 4.7 shows how these problems were overcbme by the
introduction of a second vortex of equal strength and th<t sa.ma,
direction, positiontdon the same radial line but outside
of the internal flow region. The radial co~ordinates for
the vortices are ar1 and r 1/a respectively giving increased
flow rate as 'a' varies from zero to unity.
The stream function for this combination was evaluated
by the superposition of the individual compenents and was
given by
~ = -frr ln{(r2
+ a2rf + 2arr1 cosel (r
2 + ~~ +
2~rl coseJ
+ constant (6)
By differentiating eqn (6) to yield c18 and by including
the boundary condition of eqn (5), the strength of the
vortices was found to be
( 6A)
and hence the full description of the internal flow
field was written
{ 2 2 2 2
2 ~ = =rlul ln (r + a r
1 + 2arr1 cose) (r + :
21 +
-2-
+ constant a
2rr 1L ---a-1 coseJ
{ 7)
and Fig 4.8 shows a typical flow field based on eqns {1)
123
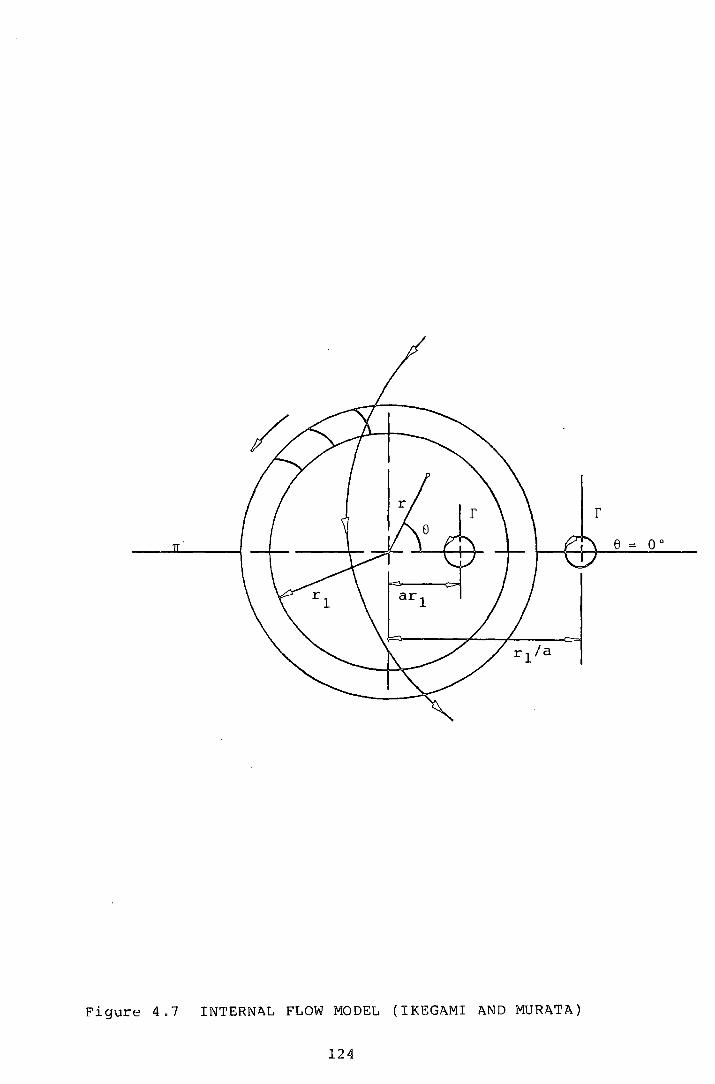
Figure 4.7 INTERN~L FLOW MODEL (IKEGAMI AND MUR~TA)
124
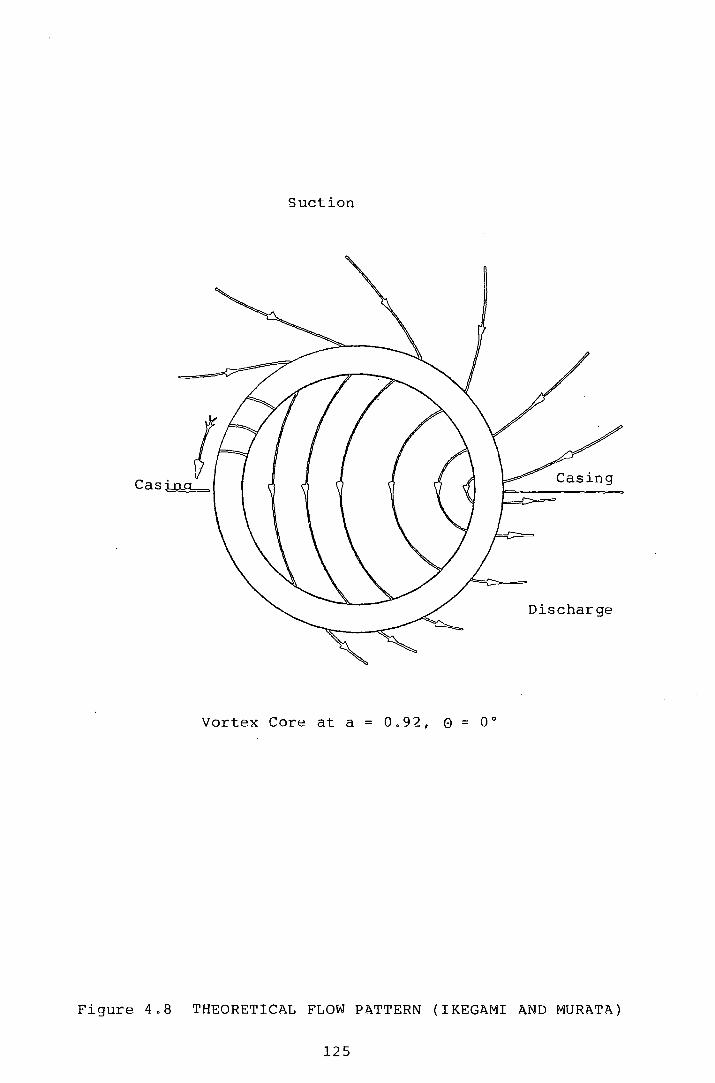
Suction
Discharge
Vortex Core at a = 0.92, 0 = oo
Figure 4.8 THEORETICAL FLOW PATTERN (IKEGAMI AND MURATA)
125
and ( 7) "
For the flow in the suction region, IKEGAMI and
MURATA used LAPLACE 1 S equation rigorously" The primary
solutions took the form;
l/J(r, 8) = Ln{An cos n8 + Bn sin n8} ( 8)
and
·'·(r 8) = L fc rn + D r~~} '~' ' --n l n n - ( 9)
solutions was also a solution The product of these
w ( r 8) = E [ (A , n n cos n8 + Bn sin n8) (Cnrn + Dnr-n)}
A periodicity was introduced to this function
l/J(r,8) = l/J(r,8 + 2TI)
which in turn implies that 'n' had to be integer and
therefore
l/J(r,8) = P + Q8 + Ln{ (An cos n8 + Bn sin n8) (C.nrn + D-nr-n)}
The boundary conditions applied to this flow field were:
(i) l/J(r,8) to be finite for r + oo and
( ii) w ( r, 8) to be constant for 8 = 0 and TI for r 2
<r<oo
C was set to zero which satisfied condition (i) and for n
both 8 = 0 and rr it was found
'f'(r, ~) = P + QTI.:!: ~ An rn
and if An = O, was then independent of r which satisfied
condition (ii)o
The total solution finally read
l/J(r 8) p + Q8 + L B ~n
sin n8 = r • n n
which in the form of IKE GAM I and ~1URATA read
~r{'r, 8) = k8 + Ln Kn sin n8 + constant (10) n r
126
They achieved the evaluation of the unknown constants k
and k by mathematically linking the equations for the n
suction and interior regions so that the streamlines of
both were connected coherently at the outer periphery of
the impeller. The equation of continuity was used in the
form
'" - '" + constant ~r = r1
- ~r = r2
(lOa}
giving k~ , shown to be a Fourier coefficient of a sine
series.
kn' = ~~ j:rr f(8} sin ne de , for n integer (lOb}
where,
f(e} ;= _.!. lnJ(l- 2a cos~+ a2 )L + ~ ln{l +a} (lOc)
2 l (l _ a)2 J IT 1 - a
IKEGAMI and MURATA were then in a position to produce
theoretical performance characteristics, by moving the vor-
tex in a radial sense. The flow rate through the impeller
was expressed
Q = ~e = o = ljie = IT
and in dimensionless terms
<I> = Q = (rl)~ ln {1 + :} 2r2U2 r2 1
( 11)
per unit length of rotor.
The cross flow impeller does not give uniform energy
transfer to each streamline and so the total pressure rise
had to be expressed as a mean value of energy transfer to
each streamline passing through the machine. The total
pressure rise for an arbitrary streamline was given by
127

pt - ~u2 (C2D8 + c2se> -y g (12)
where y = pg
and hence the mean value became
pt :: l_.rTI Q ·o Pt c2Dr r2 de ( 13)
Pt was eliminated between eqns. (12) and (13). The inlet
absolute velocity, c 258 , was determined from the differen
tial of eqn. (10) and the outlet absolute velocity c 20r
was found from the outlet velocity triangle together with
the equation of continuity. The total ~ressure coefficient
defined by p
'!'- _! - 1 2 ·{P.lJ2
was then expressed in full
= cot 8 2 + a 2 - 2 a cose
I - 2 l: nkn sin
n
IKEGAMI and MURATA cross plotted eqns. (11) and (14)
( 14)
to reveal the first theoretical performance characteristics
as a function of the rotor geometry and the position of the
vortex core. Figure 4.9shows the effect of the blade angle
B2 p indi.~atjng th~ difference between each graph increasing
as capacity increasesp with the smaller values of 8 2 giving
a correspondinqly hiqher pressure rise. They demonstrated
also the small influence of diameter ratio on the
128
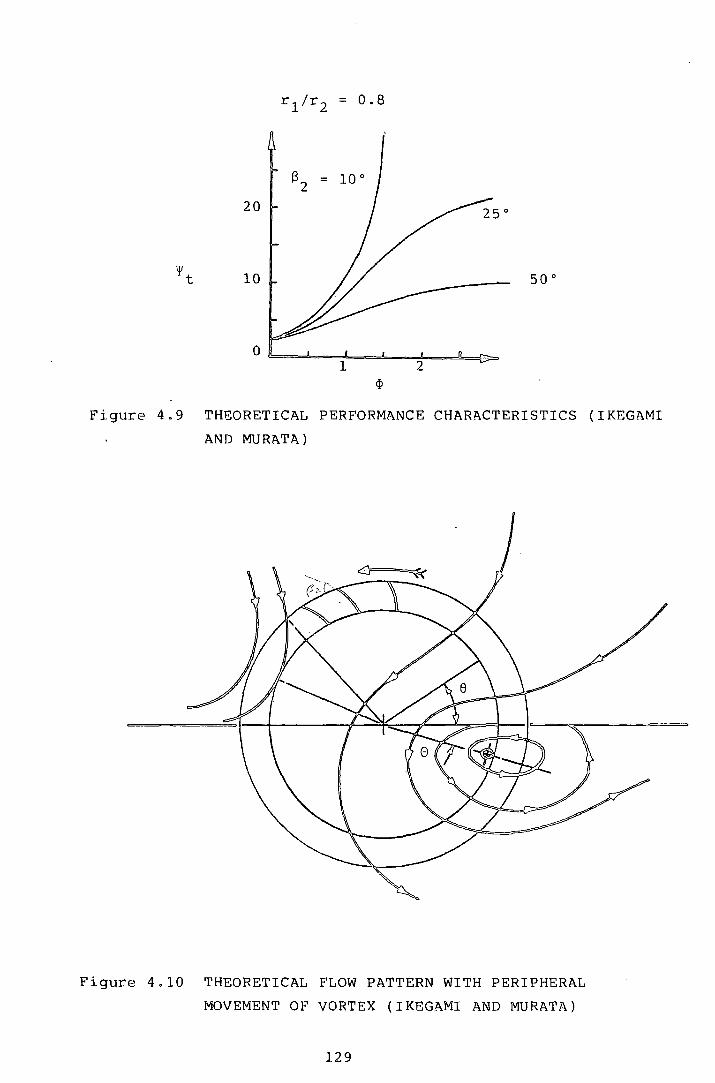
20
10
Figure 4.9 THEORETICAL PERFORMANCE CHARACTERISTICS (IKEGAMI
AND MURATA)
Figure 4.10 THEORETICAL FLOW PATTERN WITH PERIPHERAL
MOVEMENT OF VORTEX (IKEGAMI AND MURATA)
129
performance.
To allow the vortex total freedom w~thin the impeller,
they accounted for circumf~ential as well as the previous
radial motion. Inflow and outflow now occurred in both the
suction and discharge regions as shown in Fig .4.10 , which
implied that the flow in all regions differed from poten-
tial. They then argued that if the effective flow was not
influenced by the other flows, performance characteristics
could be calculated by changing the integration limits in
eqn. ( 14) to cover the range of 0 and IT - G ( e being the ·
peripheral displacement of the vortex core). It was then
possible to evaluate a performance curve having previous
knowledge of the locus of the vortex core over the flow
range.
The final section of their paper considered the flow
within the impeller rotational, i.e. with the right hand
side of eqn. (4) non-zero. By introducing dimensionless
terms for the stream function and the radius (asterisk
terms), the flow regime was described by
1 dlJI* _1 - d2
p* + r* --;- + 2 ·
d rr r* de*2
-a* (r*, e)
and substitution of eqns. (7) and (10) yielded
a* ( r*, e) = 1 + a2
= 2a cose 2a sine
z: n2 k~ cos ne
n
(15)
(16)
After finding convergence problems with cqn. (16)u due
2 to the n term, IKEGMU and MURATA found it possible to
evaluate a* graphically, by using the distribution of
130
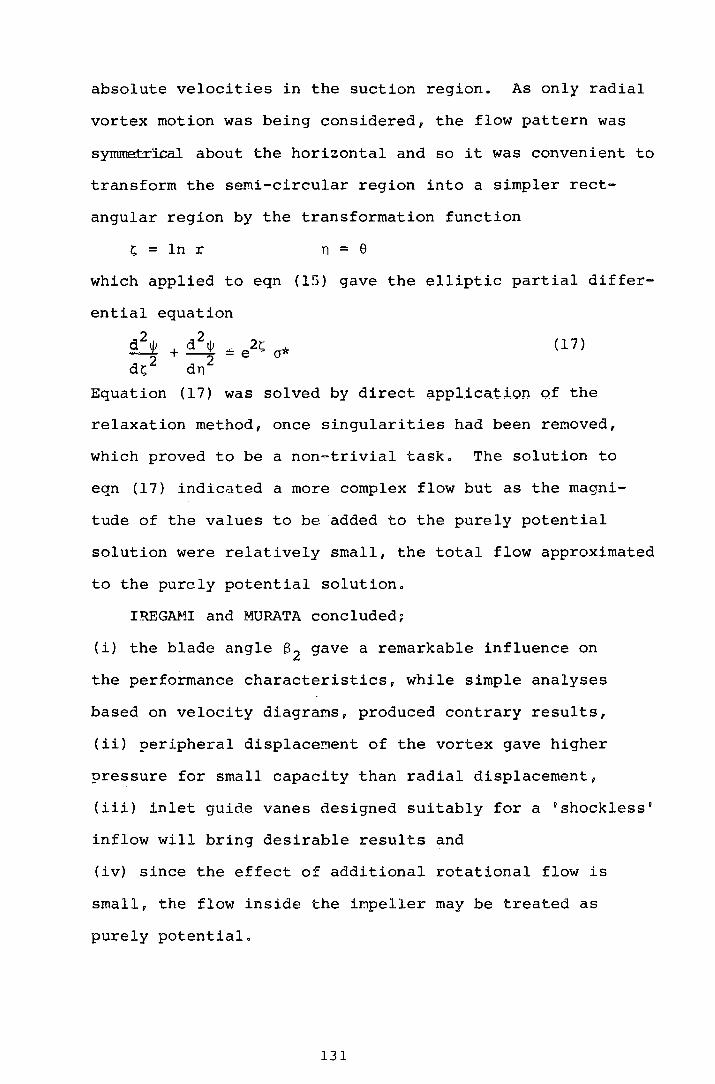
absolute velocities in the suction region. As only radial
vortex motion was being considered, the flow pattern was
s~ about the horizontal and so it was convenient to
transform the semi-circular region into a simpler rect-
angular region by the transformation function
r,: = ln r n = e
which applied to eqn (15) gave the elliptic partial differ-
ential equation
(17) d21/J + d21/J
dr,: 2 dn2
Equation (17) was solved by direct application of the
relaxation method, once singularities had been removed,
which proved to be a non-trivial task. The solution to
eqn (17) indicated a more complex flow but as the magni-
tude of the values to be added to the purely potential
solution were relatively small, the total flow approximated
to the purely potential solution.
IREGM1I and MURATA concluded;
(i) the blade angle s2 gave a remarkable influence on
the performance characteristics, while simple analyses
based on velocity diagrams, produced contrary results,
(ii) peripheral displace~ent of the vortex gave higher
pressure for small capacity than radial displacement,
(iii) inlet guide vanes designed suitably for a 0 shockless 0
inflow will bring desirable results and
(iv) since the effect of additional rotational flow is
small, the flow inside the impeller may be treated as
purely potential.
131

4.5.1 Problems with the Theory of ~KEGAMI and MURATA
The paper of IKEGAMI and MURATA is the only publi-
cation devoted to a purely theoretical treatnent of the
cross flow fan. Apart from their own studies, it was
likely that they drew experience from the work of many
experimenters, notably BRUNO ECK (Ref .10). Unlike other
fixed flow analyses, particularly COESTER 9 S, they were
able to present a flow model which included a simple casing
and allowed the vortex total mobility within the impeller.
Although the mathematical analysis presented for radial
vortex motion is correct and in order, errors have been
found when co~puting the performance characteristics.
Fig. 4.9, taken from their paper, indicates the tendency for
the graphs to plateau at high flow rates, especially for
large values of 82 • The author found that the curves
rose continuously for all values of 82 • The discrepancy
arose over the calculation of the constant K' • For the n
calculation of eqn (14), numerical techniques were called
for and therefore great care was required in ensuring
complete convergence of equation elements. The author
improved the com~utation by using up to 100 strips for
the quadrature and included the effect of 25 harmonics
for summations. This extension was observed to be most
important when peripheral vortex motion was considered.
In section 4.5 6 the possibility of the vortex moving
in a peripheral sense was examined by IKEGAJI.U and MURA'!'A.
It appears that the flow arrangement for the interior
consisted of a pair of vortices (as before) but there is
132
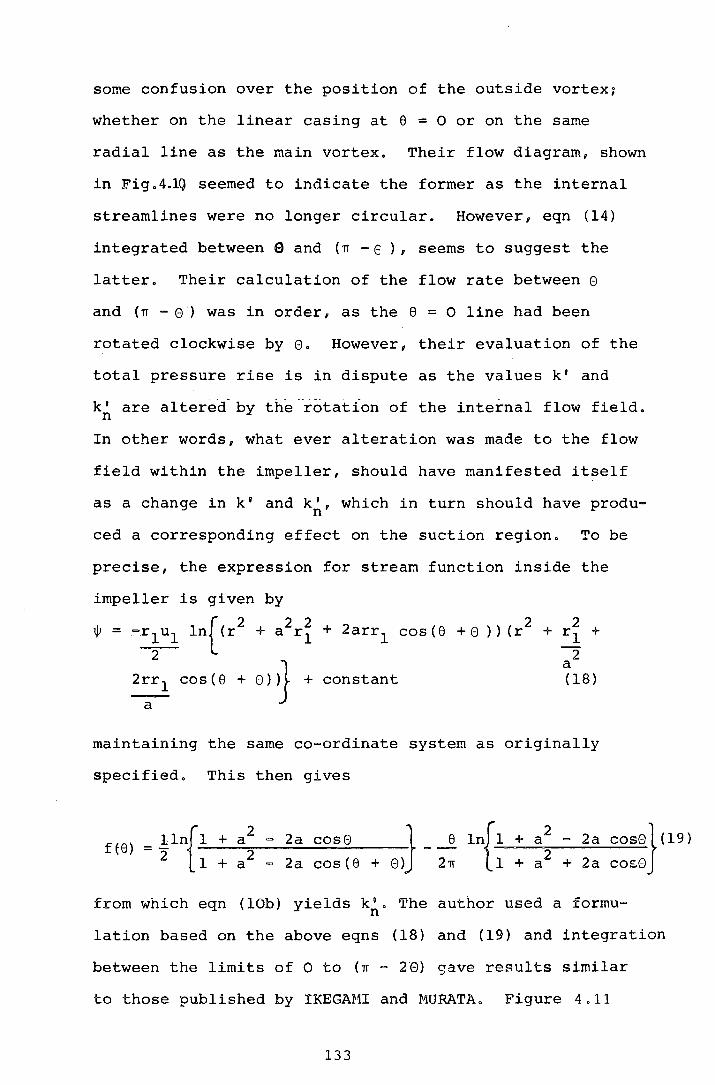
some confusion over the position of the outside vortex,
whether on the linear casing at 8 = 0 or on the same
radial line as the main vortex. Their flow diagram, shown
in Fig.4.m seemed to indicate the former as the internal
streamlines were no longer circular. However, eqn (14)
integrated between e and (TI-E), seems to suggest the
latter. Their calculation of the flow rate between e
and (TI - 0 ') was in order, as the 8 = 0 line had been
rotated clockwise by e. However, their evaluation of the
total pressure rise is in dispute as the values k 9 and
k' are altered-by the rotation of the inte~nal flo~ field. n
In other words, what ever alteration was made to the flow
field within the impeller, should have manifested itself
as a change ink' and k', which in turn should have produn
ced a corresponding effect on the suction region. To be
precise, the expression for strea~ function inside the
impeller is given by
ljJ = -r1
u 1 ln (r +a r1
+ 2arr1
cos(e +e)) (r + (
2 2 2 2
2
2rr1 cos(e + e))} + constant
a
2 rl + 2 a (18)
maintaining the same co~ordinate system as originally
specified. This then gives
f(e) = .!_ln{l + a2
= 2a cose 2 1 + a 2
= 2a cos(e l_ ..J!. ln{l + a~ = 2a cose} (19)
+ eJ 2n 1 + a + 2a cose
from which eqn (lOb) yields k~. The author used a formu
lation based on the above eqns (18) and (19) and integration
between the limits of 0 to (n = 20) gave results similar
to those published by IKEGAHI and l\1URATA. Figure 4 .11
133
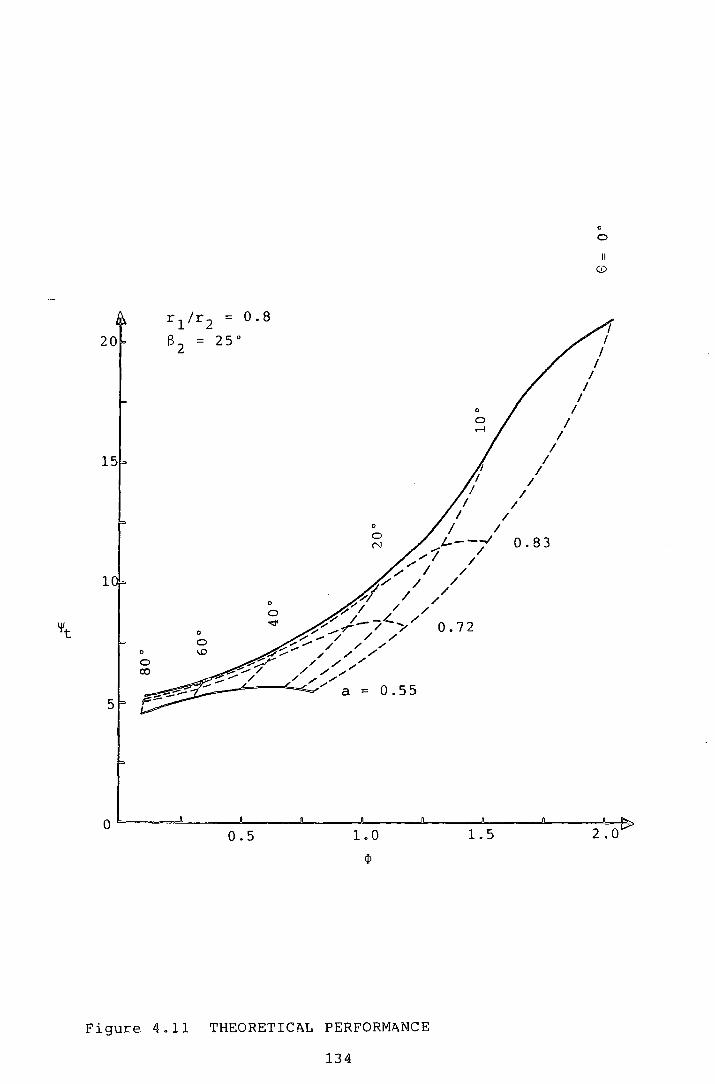
'~'t 0
0 co
0
0 1.0
0
I I
I /
/ /
/ 0
0 N
I / L----.1 0.83
-1 / ,.,,.,., / ,.- I /
/// / / v/ / /
:;.' / '/ / / /
;;.'':/ /--/~ .... / 0 72 .... _.,-;""" 7 •
;;.- .... / / / ,.':::- ........ / / /
~.... / / /
0
:::;r / / / ,..""', / / -~;....-/ / ,<,,/ ~-b=---~~/ a = 0.55
0.5 1.0
¢
Figure 4.11 THEORETIC~L PERFORM~NCE
134
I I
I I
I
0
0
I I
I I
I

corrects their computations and compared with their study
is seen to be dissimilar for a= 0.92 with k' being the n
responsible term, as previously discussed. At low capa-
cities, the form of the characteristic is almost inde-
pendent of the radial vortex position. Above ~ = 1.0,
higher pressure may be achieved by radial motion and in
some cases a fall in pressure is apparent for peripheral
motion. Figures4.U and 4.Dshow the effect of the diameter
ratio~. For r 1;r2 = 0.7 (Fig.4.~, a small performance net
is evident but it is interesting that for r 1;r2 = 0.9 the
form of the characteristic is virtually independent of
the radial vortex position for flow rates up to @ = 1.0.
Figures4.M and4.~ display the effect of the outer blade
angle s2 • Figure4.M shows that for large forward curva
ture, high values of ·pressure can be expected, however,
with less curvature, Fig.4.~indicates a considerably lower
pressure rise with a virtually constant value of ~ at low
flow rates.
Overall, the diameter ratio had a relatively small
effect on the slope of the characteristic but its chief
effect seems to be on the value of total pressure at zero
flow, ~~=O , where higher values of r 1/r2 are seen to
produce higher total pressure at zero flow. Larger chara-
cteristic slopes were evident with larger forward curva-
ture of the rotor blades with a corresponding increase in
~~=0 0
As previously stated, Fig.4.Nappeared to suggest that
the vortex outside the rotor lay on the radial line 8 = 0,
producing non-circular streamlines within the rotor. The
135

'¥ t
r 1 ;r2 = 0.7
82 = 2 50
15
10
0
5
0.5
0
0 N
1.0
0
0 ..-I
Figure 4.12 THEORETICAL PERFORMANCE
136
0
0
(])
0.92
1.5
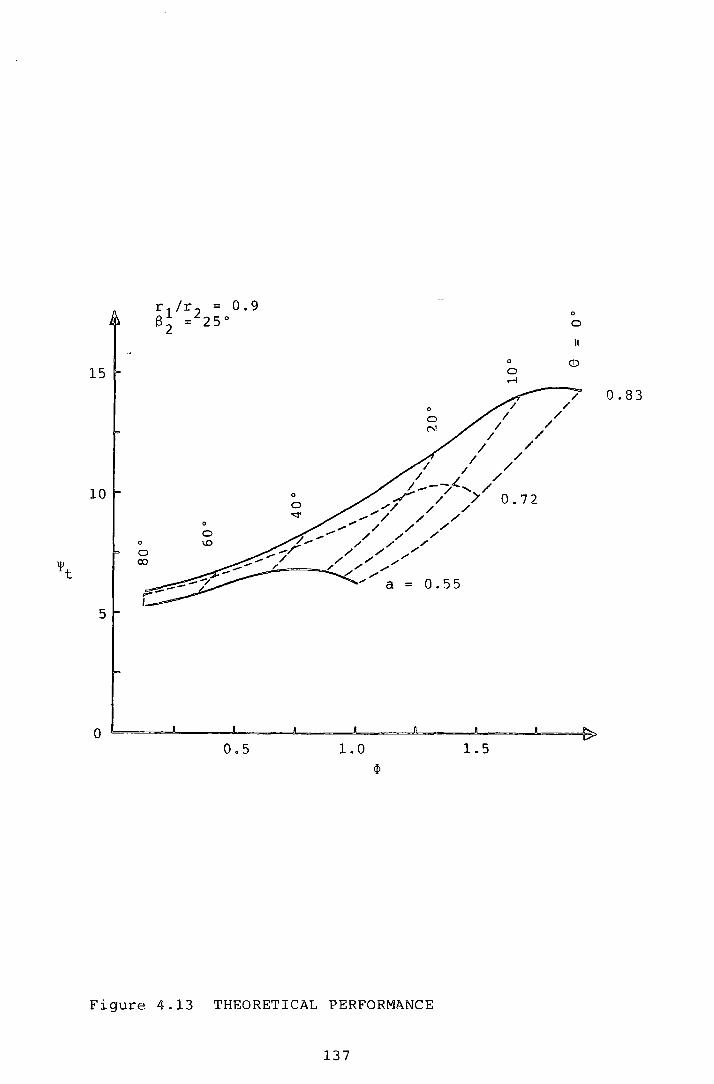
'!'t
15
10
0
0 0 \.0 0 co
5
0 0.5
0
0
0
0 ..-l
/
/ / //
/ /
/--/" ....... / / )' 0.72 0
0 / / / / """ / /
/ / / /
/ / / /
/ / ~;.....=--.C. / ...-""
" a = 0.55
1.0 1.5
Figure 4.13 THEORETICAL PERFORMANCE
137
/
0
0
CD
/ /
/
0.83

'l't
25
10
5
0
0
0 co
0
0 1.0
0
I I
I I I
I I
I I
I
0.55
Figure 4.14 THEORETICAL PERFORMANCE
138
0
0
CD
0.83

15
10
1ft
0
5
0
Figure 4.15 THEORETICAL PERFORMANCE
139
0
0
II CD
0.92
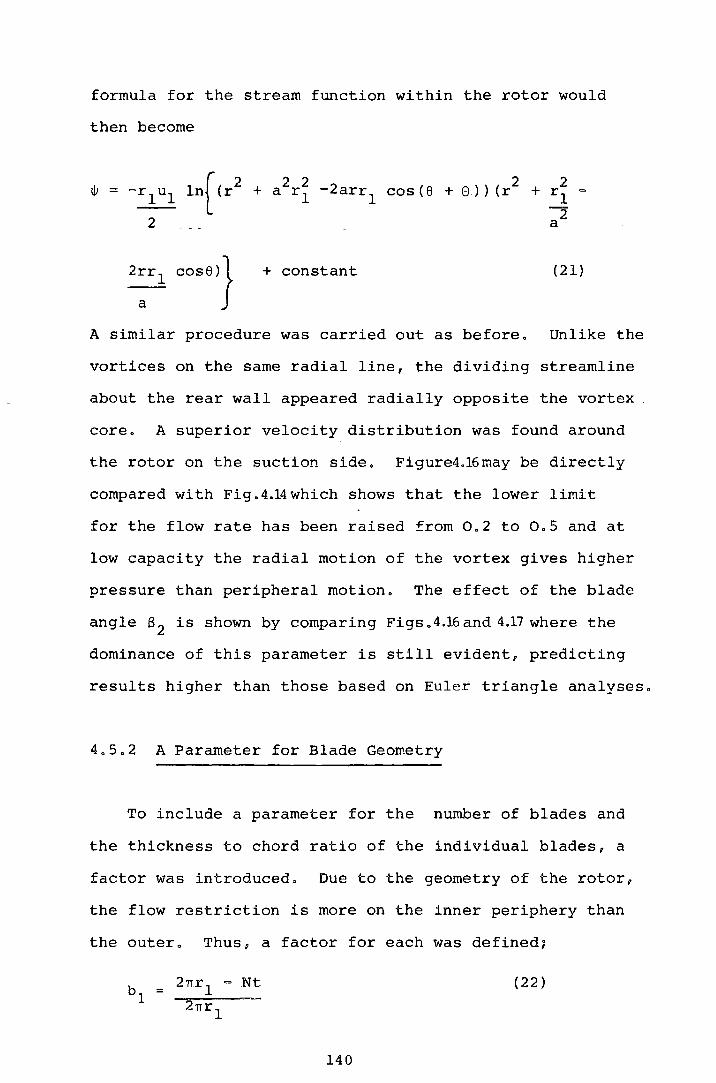
formula for the stream function within the rotor would
then become
ln[ (r2 2 2 2 2
1jJ = -rlul + a r 1 -2arr1
cos(S + 8)) (r + r -1 2 2 a
2rr1 cose)} + constant (21)
a
A similar procedure was carried out as before. Unlike the
vortices on the same radial line, the dividing streamline
about the rear wall appeared radially opposite the vortex
core. A superior velocity distribution was found around
the rotor on the suction side. Figure4.16 may be directly
compared with Fig. 4.14 which shows that the lower limit
for the flow rate has been raised from 0.2 to 0.5 and at
low capacity the radial motion of the vortex gives higher
pressure than peripheral motion. The effect of the blade
angle B 2 is shown by comparing Figs .4.16 and 4.17 where the
dominance of this parameter is still evident, predicting
results higher than those based on Euler triangle analyses.
4.5.2 A Parameter for Blade Geometry
To include a parameter for the number of blades and
the thickness to chord ratio of the individual blades, a
factor was introduced. Due to the geometry of the rotor,
the flow restriction is more on the inner periphery than
the outer. Thus, a factor for each was defined;
b1
= 2Tir1 = Nt 27Tr1
140
(22)
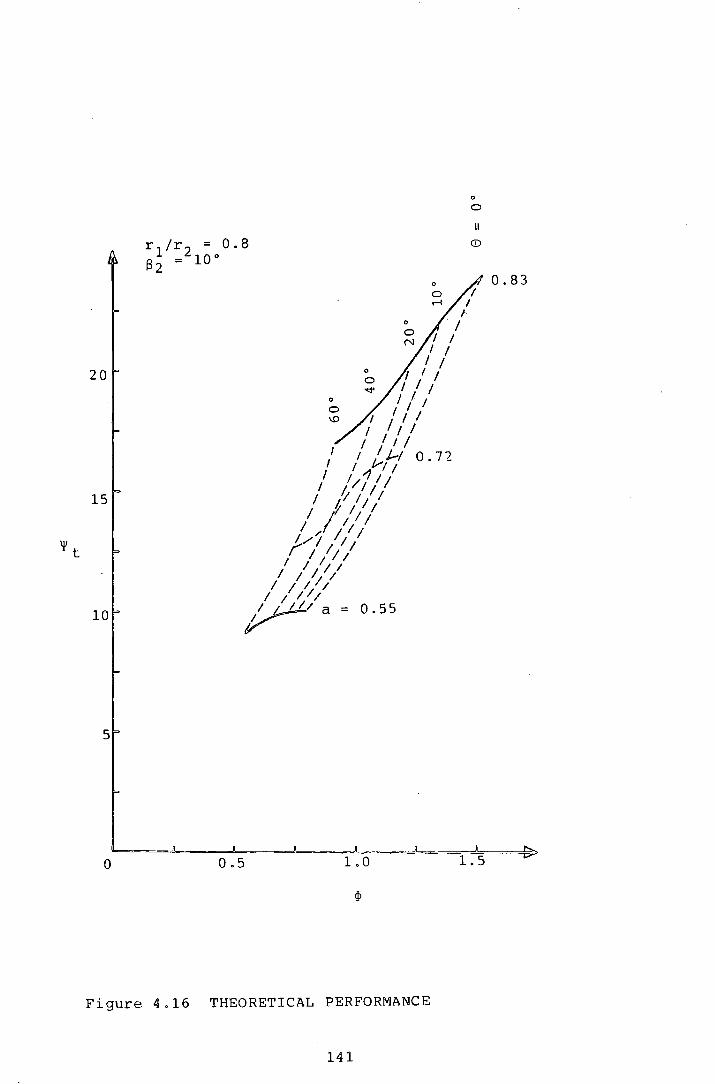
'i't
5
0 0.5
0
0
0
I I I I
I I I 1 I
I I 1 I/ 1
1 I I I I I I I
I I I I ,' I j.J.-1 0 • 7 "2
I I I I 1/11;
/ 1;/11 I j 1/ I
I I /1 I 1./} !1 I
I 1 11 / I I II I
I I 11 1
I I 1;11;/ I
~~a= 0.55
Figure 4.16 THEORETICAL PERFORMANCE
141
I
0
0
II
<D
I I
f
0.83

15 0
0
II
0.92
10
'l't
5
0
Figure 4.17 THEORETICAL PERFORMANCE
142
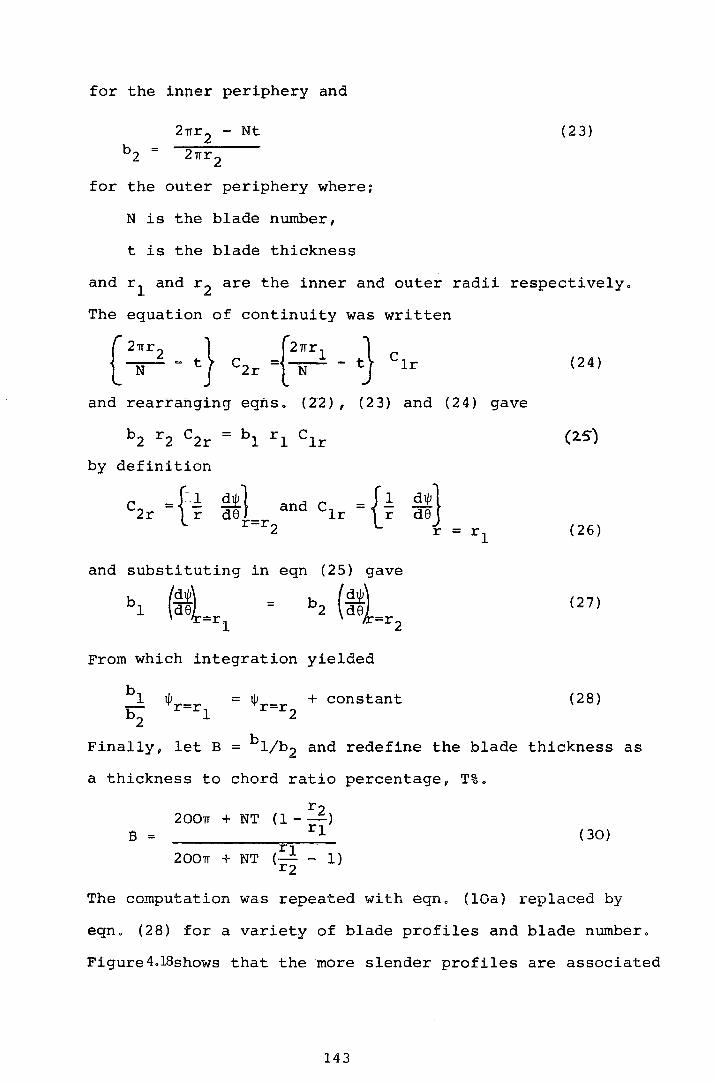
for the inner periphery and
21rr2 - Nt ( 2 3)
b2 = 21rr 2
for the outer periphery where;
N is the blade number,
t is the blade thickness
and r 1 and r 2 are the inner and outer radii respectively.
The equation of continuity was written
( 2~r2
- t} c2r -e~rl - t} clr ( 2 4)
and rearranging eqns. (22), (23) and (24) gave
b2 r2 c2r = bl rl clr (25)
by definition
c2r = {.-~ di/J1 c =P d$} de and lr r de r=r2 r = rl ( 2 6)
and substituting in eqn (25) gave
bl (~~L=r 1
= b 2 (~~l-r - 2
( 27)
From which integration yielded
bl 1/Jr=r = 1/Jr=r + constant b2 1 2
( 28)
Finally, let B = bl/b2 and redefine the blade thickness as
a thickness to chord ratio percentage, T%.
2007T + NT r2
(1 = -)
B = rl ( 30)
2007T + NT 1 1) (- =
r2
The computation was repeated with eqn. (lOa) replaced by
eqn. (28) for a variety of blade profiles and blade number.
Figure4.18shows that the more slender profiles are associated
143
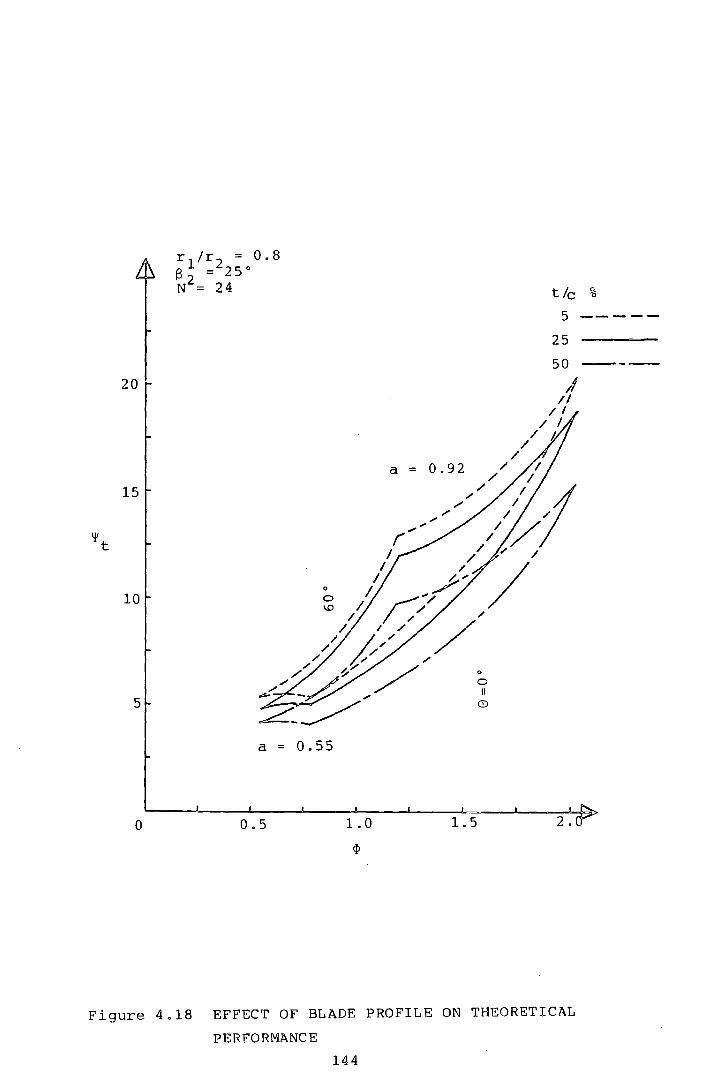
15
'!'t
10
5
a == 0.55
0 0.5 1.0
¢
1.5
t/c %
5 -----
25
2 .
Figure 4.18 EFFECT OF BLADE PROFILE ON THEORETICAL
PERFORMANCE
144
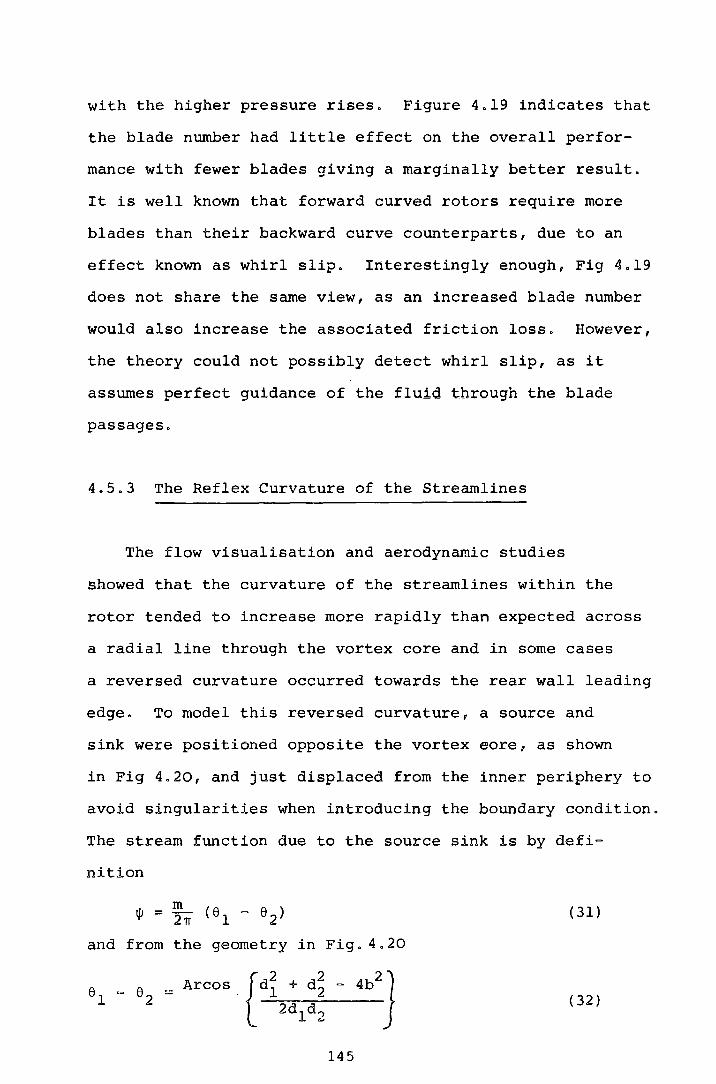
with the higher pressure rises. Figure 4.19 indicates that
the blade number had little effect on the overall perfor-
mance with fewer blades giving a marginally better result.
It is well known that forward curved rotors require more
blades than their backward curve counterparts, due to an
effect known as whirl slip. Interestingly enough, Fig 4.19
does not share the same view, as an increased blade number
would also increase the associated friction loss. However,
the theory could not possibly detect whirl slip, as it
assumes perfect guidance of the fluid through the blade
passages.
4.5.3 The Reflex Curvature of the Streamlines
The flow visualisation and aerodynamic studies
showed that the curvature of the streamlines within the
rotor tended to increase more rapidly than expected across
a radial line through the vortex core and in some cases
a reversed curvature occurred towards the rear wall leading
edge. To model this reversed curvature, a source and
sink were positioned opposite the vortex eore, as shown
in Fig 4.20, and just displaced from the inner periphery to
avoid singularities when introducing the boundary condition.
The stream function due to the source sink is by defi-
nition
m ljJ = 2'1T ( 6 1 - 6 2) ( 31)
and from the geometry in Fig. 4.20
(32)
145
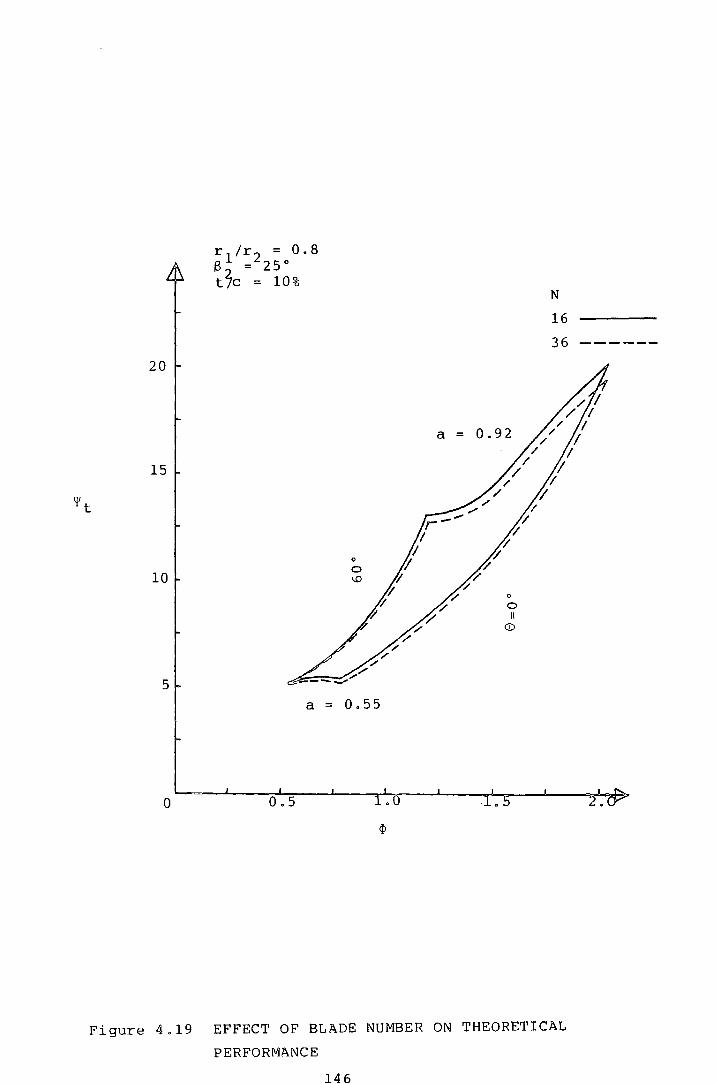
20
15
ljlt
10
5
0
a = 0.55
0.5
N
16
36 ------
Figure 4.19 EFFECT OF BLADE NUMBER ON THEORETICAL
PERFORMANCE
146

SOURCE
SINK
I --~
Vortex 1
I
Figure 4.20 ADDED SOURCE AND SINK TO MODIFY THEORETICAL
INTERNAL FLOW
147
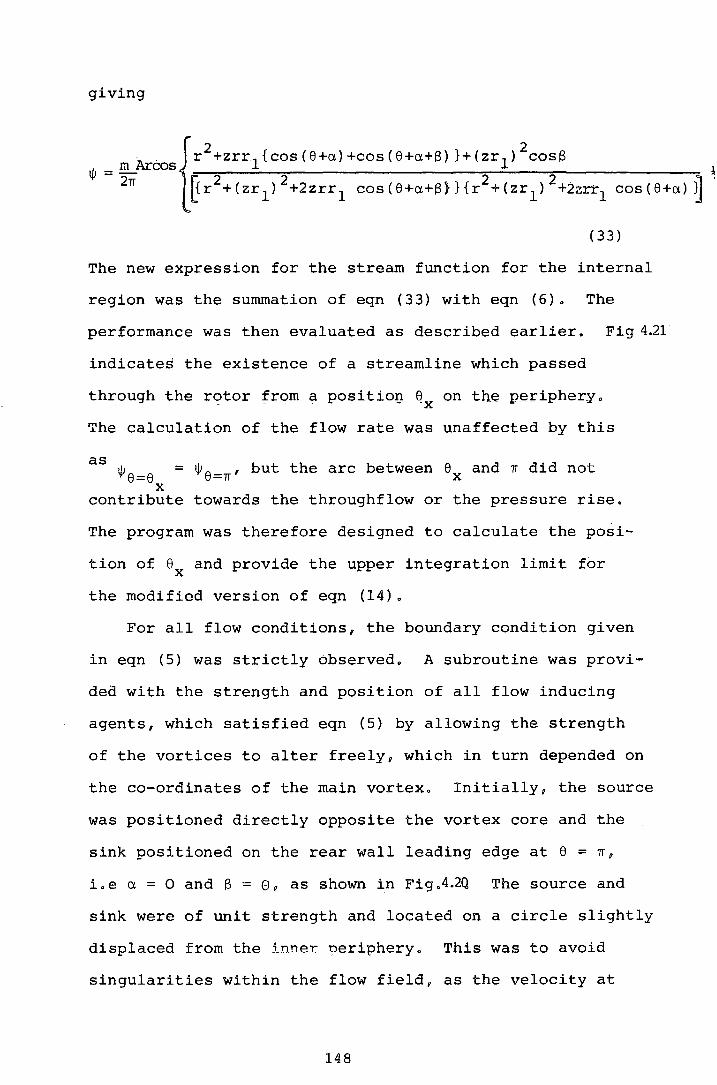
giving
Ar. . r +zrr
1{cos(e+a)+cos(e+a+B)}+(zr1 ) cosB
,,, - !!!._ cos
{
2 2
'1'- 2 2 2 2. 2TI ~r +(zr 1 ) +2zrr 1 cos(e+a+B}Hr +(zr
1) +2zrr
1 cos(e+a) ~
(33)
The new expression for the stream function for the internal
region was the summation of eqn (33) with eqn (6). The
performance was then evaluated as described earlier. Fig 4.21
indicates the existence of a streamline which passed
through the rotor from a positior1 ex on the periphery.
The calculation of the flow rate was unaffected by this
as ~Pe=e =
X
~Pe=n' but the arc between ex and n did not
contribute towards the throughflow or the pressure rise.
The program was therefore designed to calculate the posi-
tion of ex and provide the upper integration limit for
the modified version of eqn (14).
For all flow conditions, the boundary condition given
in eqn (5) was strictly observed. A subroutine was provi-
ded with the strength and position of all flow inducing
agents, which satisfied eqn (5) by allowing the strength
of the vortices to alter freely, which in turn depended on
the co-ordinates of the main vortex. Initially, the source
was positioned directly opposite the vortex core and the
sink positioned on the rear wall leading edge at e = n,
i.e a = 0 and B = e u as shown in Fig .4.2Q The source and
sink were of unit strength and located on a circle slightly
displaced from the inner oeriphery. This was to avoid
singularities within the flow field, as the velocity at
148
the centre of a source or sink is infinite (zr1 may be
considered as the rear wall clearance}.
Figure 4.n.shows the variation in the vortex strength as
a function of position within the rotor, which is seen to
change considerably for peripheral movement, although not
for radial movement, apart from the region close to the
inner periphery of the blade row. The resulting perfor
mance diagram was not significantly different to that of
Fig.4.ll. This change in the vortex strength substantiates
experimental investigations carried out by the author and
mentioned in Chapter 2.
A description of the cross flow fan T;Erfarrran:::e~resul ting from
changes in the vortex strength, is called for which will
requireabetter modelling of the strengths and locations of
the source and sink. An example of the effect of the
source and sink on the overall flow field is shown in
Fig .4.23. The f lovl chart for the theoretical performance
computer program is detailed in Fig .4.24.
4.5.4 Losses within Cross flow fans
The losses occuring within cross flow fans may be
divided into two categories;
(i} shock losses resulting from the inlet relative flow
angle not being equivalent to the outer blade angle and
(ii} losses within the vortex.
149
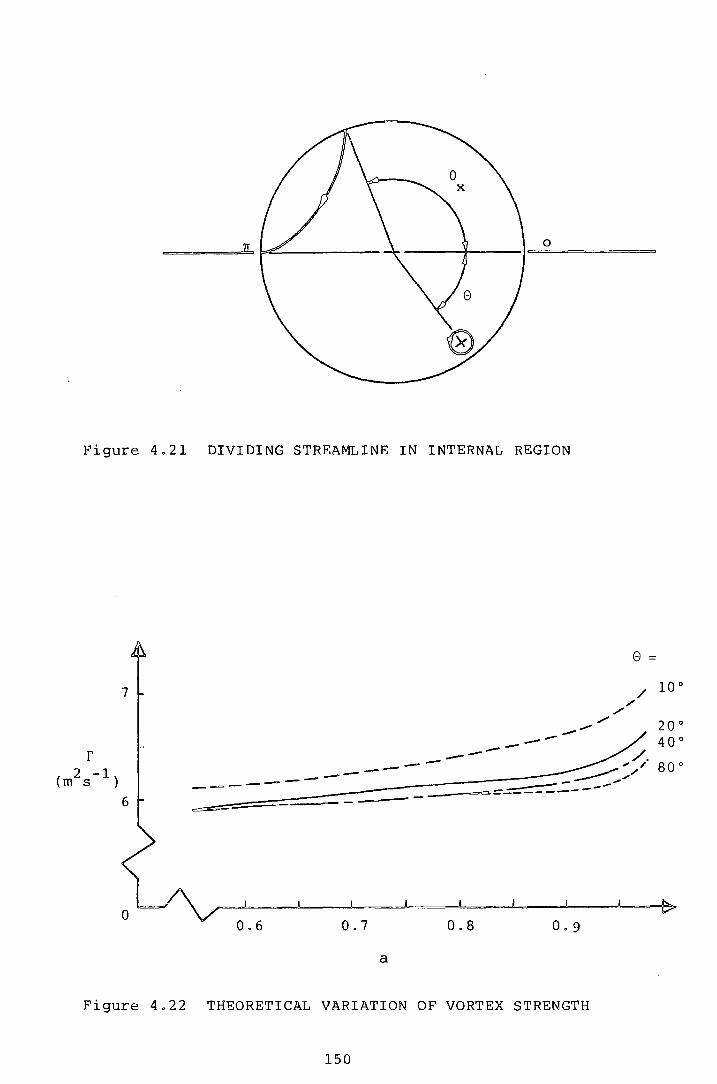
TT 0
Figure 4.21 DIVIDING STREAMLINE IN INTERNAL REGION
7
0
./
e =
/
10° /
__ ...... 20° ------ /. -------- "'/ ------ -- __,.,.,. ,."" --- ----- , -=-- ::..::=..--==-----==-
Av~~~~~~~~~~ 0.6 0.7 0.8 0.9
a
Figure 4.22 THEORETICAL VARIATION OF VORTEX STRENGTH
150
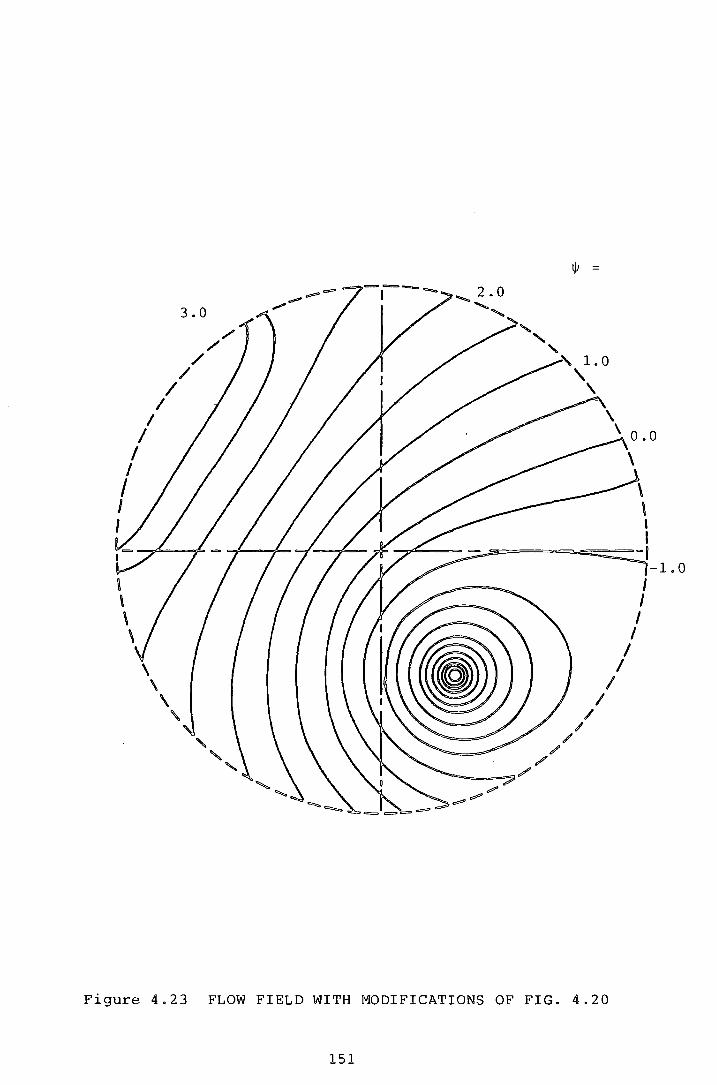
I I
I I I I I
/ I
3.0
/
/ /
/
\
\
' ' I ~===--=:o..o~~=i
--==~/
/ /
/ /
I I
/
Figure 4.23 FLOW FIELD WITH MODIFICATIONS OF FIG. 4.20
151
I I I
I I
I
-1.0
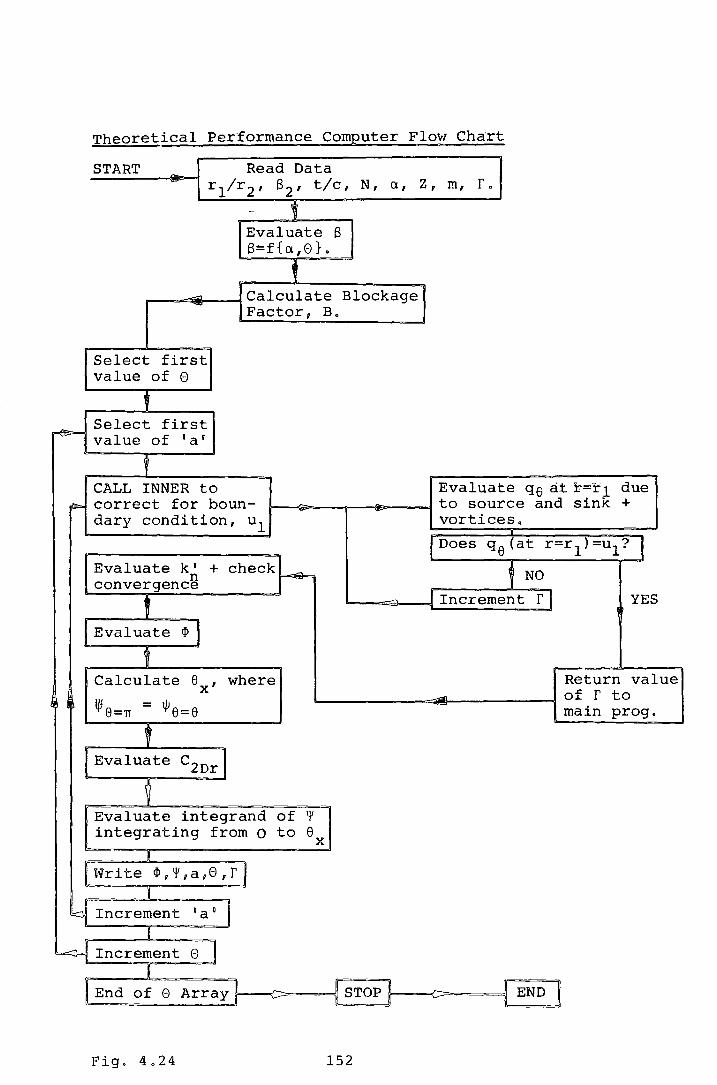
Theoretical Performance Computer Flot-r Cha.rt
START Read Data ~
rl/r2' B2' t/c, N, a, z, I!l, fo
-- 1 Evaluate B B=f{a,0}o
t """"' Calculate Blockage - Factor, Bo
Select first value of 0
t r=®=-=
Select first value of 'a'
CALL INNER to Evaluate q6 at. r=r1 due ~ correct for boun- to source and sink +
"" dary condition, ul vortices a
Does q 6 (at r=r1 )=u1 ? 1 Evaluate k' + check
~ i NO convergend! ~ I Increment r YES
Evaluate <P
t Calculate e x' where Return value
' -"'"' of r to l/Je=n = lJJe=e main prog.
t Evaluate C2Drl
Evaluate integrand of '¥ integrating from 0 to e
X
I
l'l7rite <P,'¥,a,0,r
bj Increment ua u I j
~ Increment 0 I
End of 0 Array I ~ 1r STOP l i END l r l
Fig. 4.24 152
4.5.4.1 Inlet 'shock' losses
The inlet shock losses were examined by using the
expression for the stream function in the suction region,
given by eqn (10). The peripheral component of the
absolute velocity was then found to be
c28
={-~} = 2r1 u1 fi nk~ sin ne r=r2 r 2
(34)
and the corresponding radial component
c2r ~, ·{i ~~}r=r = 2rl u.l (]<' + fi: nk~ cos ne)
2 r2
(35)
Figure4.25shows the variation of the tangential and radial
velocities around the outer periphery of the rotor, together
with the deviation of the relative velocity from the blade
angle. It is seen that the majority of shock losses occur
near the vortex wall, where the radial velocities are
highest. Clearly, the blades cannot always be presented
at zero incidence to the relative flow and so, unless inlet
guide vanes are used (designed using eqn (lo», shock losses
will always be present, to an extent.
4.5.4.2 Viscous Losses within a Rankine Vortex
The second form of losses are those present within the
vortex. These losses may be both viscous and inertial
(as suggested by MOORE (Ref.l6)). For the purpose of this
analysis it was assumed that the vortex was unbounded,
i.e. lying within an infinite expanse of fluid. The vortex
was of a Rankine type, with the forced region described by
153

0.8
0.6
0.4
0.2
r1;r2 = 0.8
'82 = 250 a = 0.97 8 = 10°
8 = 0 o on Vortex Wall
\ \ \ \ \ \ \ \ \
\ \ \
\
' \...
' ' ' ' ' ......................
30
10
........ ...... ............ ...... -----,_
Figure 4.25 THEORETICAL V~RIATION OF VELOCITY AND DEVIATION
IN THE SUCTION REGION
154
~2
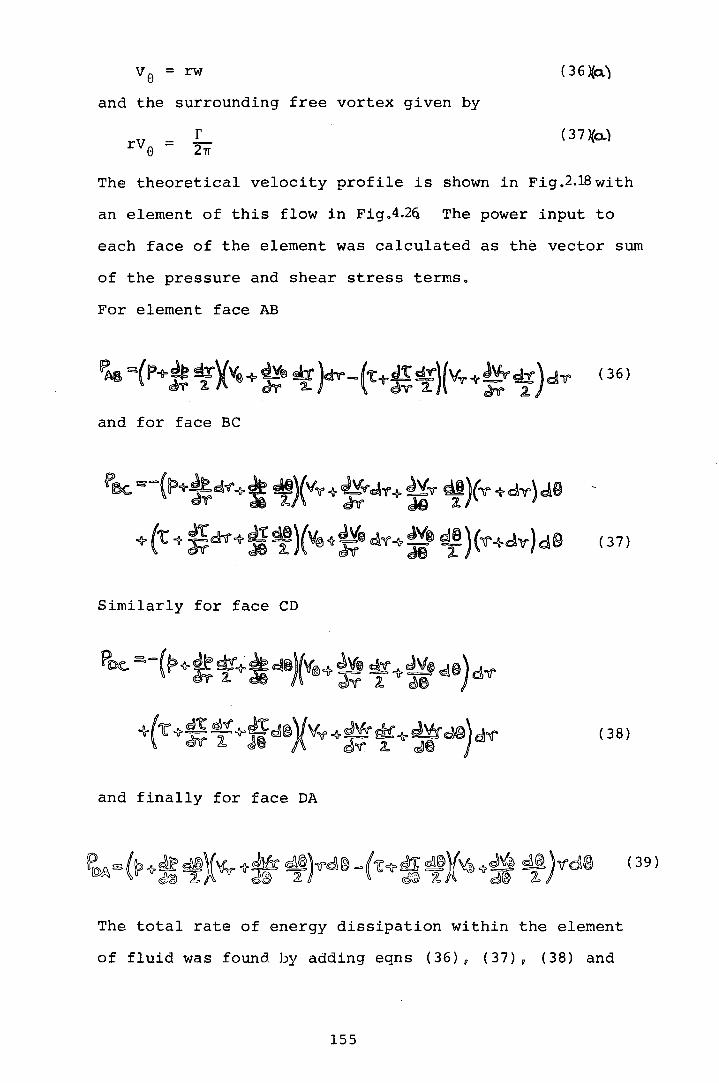
v = rw e and the surrounding free vortex given by
( 3 6 )(a.)
( 37 )(a.)
The theoretical velocity profile is shown in Fig.2.Wwith
an element of this flow in Fig .4.26. The power input to
each face of the element was calculated as the vector sum
of the pressure and shear stress terms.
For element face AB
and for face BC
Similarly for face CD
(38)
and finally for face DA
The total rate of energy dissipation within the element
of fluid 'lf!aS found by adding eqns (36) v (37), (38) and
155
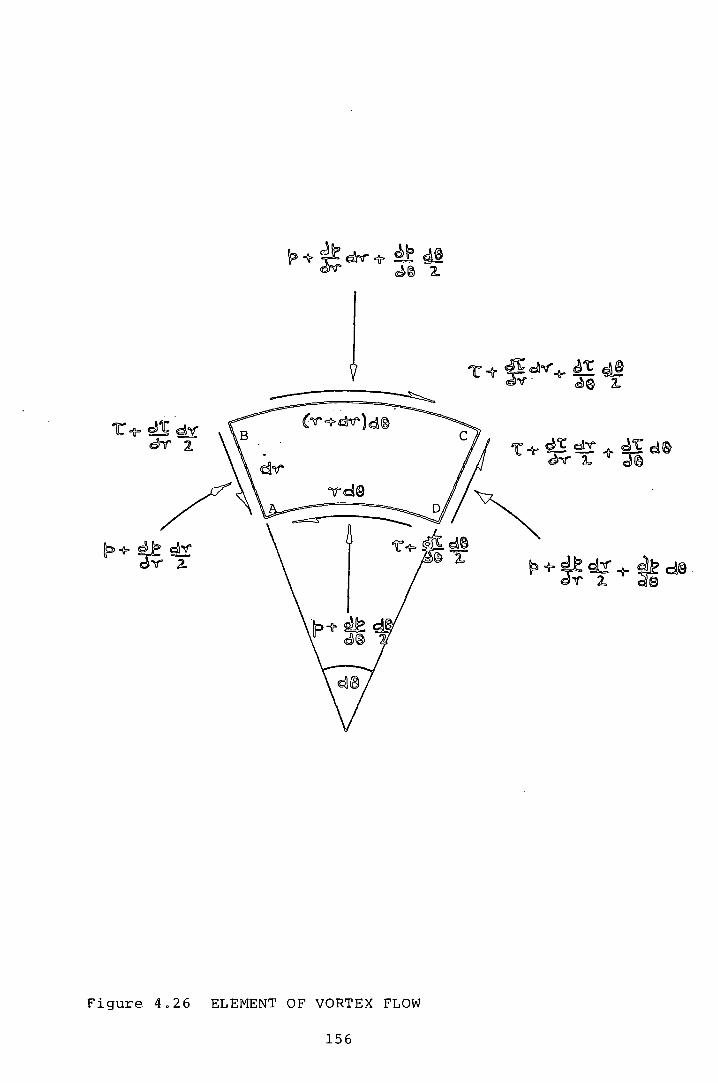
Figure 4.26 ELEMENT OF VORTEX FLOW
156
(39) and dividing by rdr de {unit volume)
per unit volume.
For a Rankine type vortex, continuity of v e must exist
at the boundary. Equations (36~and (37X~then gave
r w =--
21T a·2 { 41)
and hence for the forced vortex
ve (forced) rr
= 21T a2
(42)
The radial pressure variation in a free vortex is given
from eqn ( 37)
!; ~ Pgwt~ and integrating yields
p (free) - - pf L} 2 ~ + constant L2TI 2r
{ 4 3)
(44)
( 40)
Sirnilarlyv eqn (36) yielded the pressure variation across
a forced vortex
~= dr
pr{~}2 21Ta
(45)
157
atld .·integrating
. 2 { r }2 p (forced) =P r --2 2 2TT'a
+ constant (46)
The expression for shear stress in polar co~ordinates
T = l.lr d dr
produced for the free region
and therefore
r -3 TTr
T(free) =- .1!L. 2 TTr
(47)
( 4 8)
( 4 9)
As v 8;r = w, the shear stress terms vanished in the forced
region. According to the initial assumptions, the stream-
lines in both regions are concentric circles and as such
the radial velocity and the peripheral pressure gradient is
zero, i.e vr = 0 and dp/d8 = 0. Equation (40) then became
E g ..L{-rV®) + ~{tV®} , per unit volume. (50) v ~
For the free vortex
and hence
E (free) = ~ TT r
(51)
per unit volume (52)
158
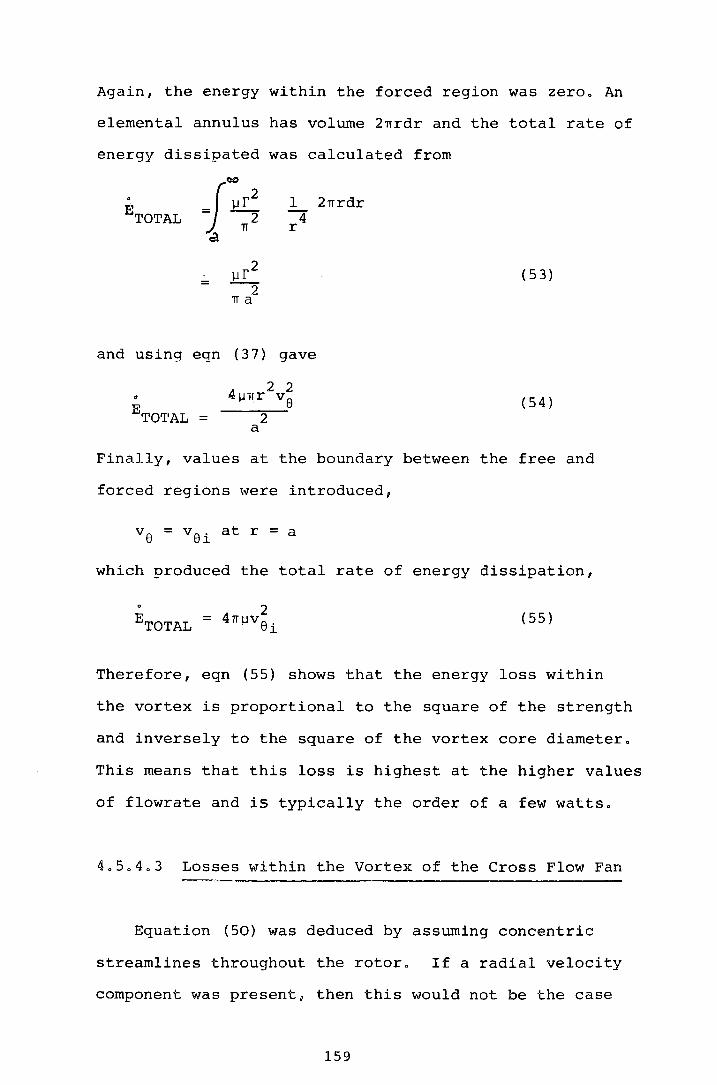
Again, the energy within the forced region was zero. An
elemental annulus has volume 2nrdr and the total rate of
energy dissipated was calculated from
1 2nrdr 4 r
= (53)
and using eqn (37) gave
ETO'I'AL = (54)
Finally, values at the boundary between the free and
forced regions were introduced,
which oroduced the total rate of energy dissipation,
(55)
Therefore, eqn (55) shows that the energy loss within
the vortex is proportional to the square of the strength
and inversely to the square of the vortex core diameter.
This means that this loss is highest at the higher values
of flowrate and is typically the order of a few watts.
4.5.4.3 Losses within the Vortex of the Cross Flow Fan
Equation (50) was deduced by assuming concentric
streamlines throughout the rotor. If a radial velocity
component was present 8 then this would not be the case
159

and pressure terms would appear in the energy equation.
The energy dissipation equation for an element of
fluid,
per unit volume as derived earlier. (Eqn (40)).
A free vortex with a forced vortex core is considered
rotating in an infinite expanse of fluid. The free vortex
has circulation rand the forced region has a radius aa'.
All terms with a superscript 1 ~a refer to the free region.
1. For the free vortex, the balance of cent~ipetal and
pressure forces yields,
.@ PL:r 1 = -dr 3 r
(56)
from which,
12:r 1 + c p = 2r2 1
As r -+ oo, then p -+ 0 cl = o,
p = f J.r }2
2r2 l2n
(57)
At the boundary between the regions 8 the tangential
velocity is continuous.
Ther.efore,
r wa = ~ .c.n ·a
160

r w = --2
2na
and this yields within the forced region,
v _ r r 6 - 2na2
and by a similar consideration,
~ dr = fr{--S:}2
2na
and integration
2 { 2 P = £.E_ _r_} 2 2 2 na
yields,
(58)
(59)
At the boundary between the regions, the static
pressure is continuous,
i.e. when r =a, then p -= p
Hence, ~ {-r-}2 + c 2 2 2 2 na
c = - ..Q_ r _I}2 2 Cl2 l2TI
and the static pressure in the forced vortex is given by,
~ ~ ~· f~ 12 ( ~:2 1 ) 0 < r < a
From eqn.(40) , T is expressed in polar co=ordinates,
T = llr ~ { ve} (61) dr r
As Ve /r = w P for a forced vortex f then T = 0. For the
free vortex,
T = llr d [ r dr 2nr
:r = = l1 r ~2
nr
. ~}
(62)
As the value of any small radial velocity component is
161
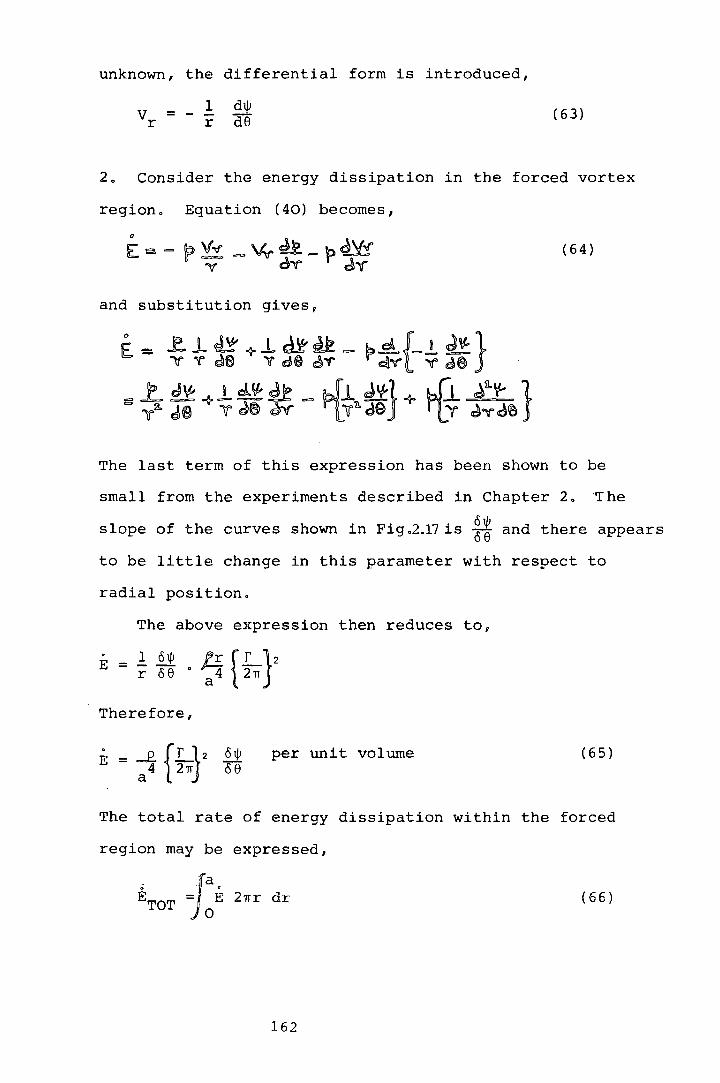
unknown, the differential form is introduced,
1 ( 6 3) --r
2. Consider the energy dissipation in the forced vortex
region. Equation (40) becomes,
(64)
and substitution gives,
The last term of this expression has been shown to be
small from the experiments described in Chapter 2. 'fhe
slope of the curves shown in Fig .2.17 is ~~ and there appears
to be little change in this parameter with respect to
radial position.
The above expression then reduces to,
Therefore,
per unit volume ( 6 5)
The total rate of energy dissipation within the forced
region may be expressed,
(66)
162

and from eqn (65),
a
= {r_}2 2TTJ' oltJI rdr
21r a4 oe 0
= :!!1 {.L}2 ~ 2 21r· oe
The tangential velocity at the regions' boundary,
and so,
r = 27Ta>
( 6 7)
(68)
3. Consider the energy dissipated in the free vortex
region. Equation (40) becomes,
( 6 9)
and substitution yields,
23 4~ r )a~~ s~:tl r ):& ~ per unit volume 0 ( 70) ' ~ l~ vL,J g;g; ~ ::m \ft,)
163

Equation (66) becomes,
i:'TOT ~ r f 2nrdr (71)
Joof 2 2 = B1Tl-l(!:_) 1_3
+21T f .21.(L) a 2TI r 68 2TI
and using eqn (67) yields,
(72)
The total energy dissipated within the combined vortex
system is then given by,
Clearly, with no radial flow component,
.§.1. = 0
68
(73)
and eqn(73) reduces to the viscous losses in the free
vortex region alone,
as derived earlier (eqn(SS)) o
However the major term in eqn(73) is
164
A typical value of v6i for the large fan operating at
-1 ~ = 0.8 is 20 ms , giving
X ~ 3000 ol/J oe
and so, even with ~~ small, this momentum term may account
for the reduced efficiency of the cross flow fan. Clearly,
ensuring (by casing design, for example) ~· is zero, 66
benefits may be achieved.
4.6 Conclusions
The purpose of deriving a theory for the cross flow
fan, like any other machine, is to provide the design
engineer with useable data and to indicate where losses
are likely to occur within the machine. Sensible modi=
fications may then be attempted to improve the performance
and efficiency.
It does seem that a fully predictive analytic theory
is a long way off. However, some clues revealing the
losses involved in such a machine have appeared. Those
associated with the so=called 'shock 1 losses may be dras=
tically reduced by the introduction of inlet guide vanes,
although this introduces additional frictional losses and
complicates the housing geometry. Losses occuring through
energy dissipation within the vortex may overshadow all
others and at this stage, it is unclear how these may be
minimised.
Even so, the pursuit of a theoretical description is
165
paramount, for although empirical theories may produce
better mathematical models, they ultimately limit the
knowledge attainable from such machines and indeed the
fluid dynamic processes present, which may be fundamental.
166

CHAPTER FIVE
CONCLUSIONS
"I can't believe God plays dice".
Albert Einstein 1879-1955
167
5. CONCLUSIONS
The goal of this research programme was to relate per
formance to aspects of aerodynamic behaviour for a large
cross flow fan. Previous research has tended to concen-
trate on rotors of less than 300 mm diameter but there has
been evidence to suggest that large rotors may behave quite
differently (ref. 12).
This study complements and adds additional data to the
previous research by HOLGATE and HAINES (ref. 12) and PORTER
and MARKLAND (ref. 23), which may be compared to reveal
important effects of the scale of cross flow machines.
Quantitative data were obtained from a large rotor
previously installed in a purpose-built wind tunnel (see
Chapter 2) and also from a smaller scale rotor placed in
a water tank (see Chapter 3). This latter facility allowed
the adoption of reliable flow visualization techniques.
A theoretical study (see Chapter 4) was aimed princip
ally at improving the approach adopted by IKEGAMI and MURATA
(ref. 13) and also contains a section detailing losses
occurring in cross flow fans, as prompted by the work of
MOORE (ref. 16).
51. The Aerodynamic Facility
The aerodynamic facility was designed as part of a pre
vious research project and is reported in ref. 12. This
design was a geometric scaling of a previous smaller mach
ine that had given good results and was itself a combination
168 .
of the best designs as indicated from the results of PORTER
and MARKLAND (ref. 23) and PRESZLER and LAJOS (ref. 24).
These researchers generally agree that changes in the det-
ails of the impeller geometry have a far smaller effect
on performance than a change in the geometry of the surroun-
ding casing. Other effects of casing and rotor geometry
are more fully discussed in Chapter 2 with a summary towards
the end of this Chapter.
Tests were carried out to optimise certain casing para-
meters ?nd any departures from previous studies were deemed
to be an effect of scaling, although the design guidelines
suggested in refs. 23 and 24 were broadly met. This com-
bined with results obtained from the hydrodynamic facility,
suggested that an examination of the aerodynamic perform-
ance of a fan operating under non-optimum conditions, would
not reveal any fundamental differences in the flow.
The flow range considered, overlappedthe nomal opera
rn ting region, comensurate with good efficiency.
To completely define the flow field, data were required
related to the velocity and direction of the main flow vee-
tor, together with a distribution of the total pressure
throughout the rotor interior. With these results avail-
able, it was then possible to test the validity of a Rankine
vortex model as the primary flow inducing agent.
The purpose built cranked three-hole probe (fig. 2.7)
had the duded facility of hybrid operution, together with
a miniature hot-wire probe attached to the end of the shaft.
However, it was finally decided to dispense with hot-wire
amemometry for these reasons,
169
(i) Preliminary tests indicated highly turbulent flow
within the rotor, particularly in the vicinity of the vor
tex core, making the use of hot-wire anemometry consider
ably difficult, without large time-constants being imposed
on the DC output signals.
(ii) Close to the vortex core, the determination of flow
direction was often difficult and the possibility of aero
dynamic interference by the sensor support prongs was
deemed to be a problem.
(iii) Without using several probe orientations at a given
r,e coordinate within the flow field, it was not poss-
ible to eliminate the cooling effect on the sensor result
ing from the flow vector parallel to the axis of the rotor
(partially due to secondary flows).
(iv) It is possible to deduce pressure distributions using
a hot-wire probe but the analysis of such data can be diff
icult and~at best, is expressed in terms of a pressure gra
dient distribution.
For these reasons, it was decided to make use of the
standard, proven three-hole probe technique; the calibra
tion and subsequent use being very straightforward and
reliable.
Figures 2.19(a) and (e) show the change in the stream
line patterns over the flow range, ~ = 0.4 to 0.8, which
is generally considered to be the typical operating region
for a cross flow fan. As an example of the changes ob~cr
ved, the streamline ~ = 0.0, passing through the rotor
centre-line, exhibits a clockwise rotation as the flow rate
is reduced. Clearly, this follows the position of the
vortex core, which changes little over the flow range until
170

throttling reduced the flow rate towards ~=0.4, where it
is seen to move radially.
A general acceleration of the flow is seen to occur
across the rotor interior at all flow rates. The flow vel
ocities in the vicinity of the vortex core (as judged by
the radial separation between the streamlines) reduce dram
atically as the flow rate reduces. The streamlines in the
quadrant opposite the vortex core flatten and in some cases
show reflex curvature as the distance away from the vortex
increases. It is from this region that flow escapes back
towards the suction region and over the leading edge of
the rear wall (see visualization study, Chapters 3 and
PELHAM (ref. 21) for confirmation).
The total pressure distributions shown in figs. 2.20(a)
to (c), further confirm the existence of a Rankine type
vortex within the impeller. The boundaries of the pres
sure regions, approximately follow the streamlines; them
selves being lines of constant total pressure. As the flow
rate reduces, the total pressure depression (related to
the vortex strength) within the vortex becomes less intense
as the flow velocities reduce, until at cp= 0.4, a single
region is apparent around the vortex core, with the surr
ounding region becoming less depressed and more extensive.
A second region of depressed total pressure is present
diametrically opposite the vortex, which is most apparent
at higher flow rates. As the flow rate reduces and the
flow from this region begins to pass towards the suction
region, this quadrant becomes energised with a resulting
increase in total pressure.
171

5.2 The Hydrodynamic Facility
Initial investigations were carried out to determine
which changes to the casing geometry caused significant
variations in the observed hydrodynamic performance, in
terms of flow reversal and separation, for example. Satis
factory results were achieved following the guidelines
laid out in Chapter 2 and for the majority of tests, casing
geometries were used where dynamic similarity with the
aerodynamic facility was met.
Studies to date have used visualization techniques to
provide qualitative data yielding a development guide to
the design of full size machines. From the outset, this
research concentrated on photographic techniques suitable
for the extraction of quantitative data, so that a direct
comparison with the aerodynamic study would be made. Alth
ough it was eventually possible to accurately measure local
flow velocities, as judged by streak lengths on the emul
sion, several frames showing the same casing geometry and
throughflow, were needed to fully analyse the various flow
regions (see fig. 3.8). Many of the streaks had to be eli
minated as they were deemed to have been caused by a part
icle passing across the light beam during the open-shutter
period and as such, were comprised of a velocity component
parallel to the rotor axis (see fig. 3.10, for example)
Irnpurte:mt information was revealed about the jet of
fluid passing over the rear wall from within the rotor.
Details of this flow region have been difficult to ascer
tain from direct measurements on the aerodynamic facility
(PELHAM (21)). The visualization study shows how the flow
172
rate associated with this jet, increases as the throttling
increases. Extending the rear wall height,a , attempting 1
to prevent this loss, has little benefit and can generate
a worse situation {see Table 3.2). From this consideration
alone, a 1 = 20° appears a reasonable optimum.
Analysis of photographic records is open to a more aut-
omated approach, rather than the tedious manual method
adopted here. However, flow visualization studies of this
kind, will continue to be a powerful design and analysis
tool when care is taken with accurate modelling and the
correct interpretation of the final photographic records.
5.3 Theory of the Cross Flow Fan
The mathematical model of IKEGAMI and MURATA {13) is one
the only able to predict a fan performance and include a
rudimentary casing. All other theories are for fixed flow
situations and include no effect of casing {7, 15, 16).
The development of an improved theory and the experi-
mental studies on both the aerodynamic and hydrodynamic
rigs, were carried out in parallel. Interesting experimen-
tal results were thus adapted for the mathematical model.
However, a primary feature of the original model is the
relationship between the locus of the vortex over the flow
range and the resulting fan performance curve. As previou-
sly mentioned, a change in the throughflow produced a
change in the total pressure distribution rather than a
significant movement of the vortex. Studies on both rigs
indicated reflex curvature of the streamlines for the flow
region opposite the vortex. Incorporating this in the
173
model, by means of a source and sink, allowed the strength
of the vortex to change as a function of its position with
in the rotor. Figure 4.22 indicates a similar trend as
found by experiment, with large changes in strength occur
ring as the vortex moves away from the inner periphery of
the rotor and in a peripheral sense, away from the vortex
wall.
5.4 Losses Within the Vortex
Losses within a vortex were examined theoretically,
as prompted mainly by the work of MOORE (16), who suggested
that these may account for the low efficiency generally
found in cross flow fans. The vortex was considered to
be of the Rankine type, consisting of a forced vortex core
surrounded by a free vortex region.
Important changes in the final equations were revealed,
when non-concentric streamlines were considered. This
implies a radial flow component, relative to the vortex
core centre, which is to be expected in practice, as the
fluid passing across the rotor interior experiences a deg
ree of acceleration. Terms were developed related to the
momentum of the fluid (having p as a coefficient) which
when compared to the viscous loss, were found to be sev
eral orders of magnitude higher.
Although the Hankine vortex was con~idered to lie in
an infinite expanse of fluid, eqn. 73 indicates the strong
possibility of non-concentric streamlines being respons
ible for large losses in a cross flow rotor. It does seem
therefore that changes in casing geometry, yielding an
174
internal flow field with a tendency towards concentric
streamlines, are likely to produce an overall improved
efficiency.
5.5 The Modern Design of Cross Flow Fans
To clarify the design opinion of modern cross flow
fans, the author has compiled a list of all design para-
meters and features, giving optimum values where relevant.
This is_based on the research by HOLGATE and HAINES (12),
IKEGAMI and MURATA (14), MURATA and NISHIHARA (18), PORTER
and MARKLAND (23), PRESZLER and LAJOS (24) with a more
recent study by ALLEN (1).
5.5.1 The Vortex Wall
This is the most important geometrical parameter. The
location of the vortex wall leading edg3, a 2 (fig. 2.2)
should be in the range , for optimum per-
formance. The results from the visualization study (Chap-
ter 3) indicate a dividing streamline between the inflow
and outflow within this range, for a rotor operating in
unbounded fluid (see fig. 3.5). However quieter operation
occurs at lower values of a 2 , at the expense of aerodyn-
amic performance.
The thickness of the vortex wall will generally be die-
tated by the material stiffness but should not exceed 0.04
of the rotor diameter. A flat wall is recommended with
a rounded leading edge, as shaped walls only assist in
175
obstructing the inflow in what is clearly a high velocity
region of the suction arc.
From performance and manufacturing considerations, the
clearance of the vortex wall leading edge from the rotor
blades, E , should be about 0.03 of the rotor diameter. 2
Although noise levels reduce drastically with increased
clearance, the aerodynamic performance suffers as a result.
5.5.2 The Rear Wall
The location of the rear wall leading edge, a 1 , should
be about 20° but efficiency does not appear to be affected
with values as high as 40°.
The optimum value of the clearance of the rear wall
leading edge from the rotor blades, E , is a function l
of other design parameters. If this cannot be deduced exp-
erimentally, values within the range 0.09~ ~(D2 ' 0.125
should be found to be satisfactory.
It is generally accepted that a logarithmic spiral rear
wall profile produces the best performance. This shape
should be developed from the location a ~ oo to meet the -1
duct base tangentially, directly below the vortex wall
leading edge. Any height extensions to the rear wall
a ) 0°) should be at a constant clearance of E ] l
i.e., circular arc.
176
5.5.3 The Rotor
The length to diameter ratio, L/D2 should be less than
2.3 to prevent the line vortex breaking into segments and
greater than 1.0 to avoid secondary flows within the rotor.
An optimum exists around 1.6.
The diameter ratio, o1;o2 , lies ideally within the
range 0.72 ~ o1;o2 ~ 0.76 but good performance has been
found over the wider range 0.70' o1 ;o2 ~ 0.80.
As a result of the large changes in flow velocity and
deviation around the suction arc, no optimum value for the
outer blade angle, B , exists (see fig. 4.25). 2.
However,
the so called 'shock losses' may be reduced if the devia-
tion is minimised over the portion of the suction arc where
the throughflow is greatest, i.e. near the vortex wall.
This yields an angle 25° ' B ~ 35° with higher perfor-2
mance towards the lower end of this range and 26° represen-
ting an optimum. It is important to maintain this angle
at values greater than 22° for stable operation.
Theoretical studies, based on a simple Rankine vortex
lying within the rotor, for example, require the inner blade
angle, B , to be 90°. Whilst most of these models are l
imperfect, little effect uf changes in this angle within
the range 60 o ~ B ~ 100 o are usually observed. There-1
fore, there appears no reason why this angle should not
be approximately radial.
177

Clearly there exists a trade-off between increasing
the number of blades, giving improved guidance to the flow
and a reduced blade number, lowering the resistance to
flow. ECK (10) suggested 36 but COESTER (7) was most
successful with 24. PORTER (22) experienced unstable flow
conditions using 18 blades because of unsatisfactory flow
guidance. For these reasons, a value within the range
24 ~ N ~ 36, should give good results.
The blade pr~file is generally chosen as a circular
arc camber, since each blade experiences flow reversal on
passing from the suction to the discharge regions. There
may be slight advantage in profiling the blades to suit
the flow present at the first or second pass (as suggested
by MOORE (16)) but the constructional complexity would gen
erally prohibit such a development.
The optimum location and geometry of internal blades
or bodies, is a function of flow rate amongst other fan
design parameters. Elaborations of this kind would greater
complicate the rotor geometry and as there is little evi
dence to support their use in terms of vortex location and
stabilization, internal blades or bodies are not recommended.
Rotor inlet guide vanes would be a benefit if it was
felt that the improved performance, resulting from the red
uction in 'shock losses 0, justified the extra complication
in housing geometry. Vane settings could be calculated
as indicated in section 4.5.4.1 and the number of vanes
refined by experiment.
178
PORTER and MARKLAND (23) improved operating stability
by including a single recirculation vane in the suction
region, towards the rear wall. This probably assisted in
deflecting the flow lost over the rear wall, back towards
the intake (as found in the visualization study, Chapter
3) but was not strictly an inlet guide vane.
Unless inlet guide vanes are to be used, the suction
arc should be unobstructed by ducting, especially close
to the vortex wall and ideally, the rotor should be allowed
to draw fluid from free space.
5.5.4 Fans in Series
This arrangement is supposed to produce a compact,
high-pressure unit. However, stability problems may arise
because of flow distortion on entry to successive rotors,
together with mis-matching of the individual rotors (see
British Patent 816,689).
5.5.5 Fans in Parallel
This novel design by GUNTON and HOLGATE (v) has the
advantage of a simplified casing geometry. However, the
suction flow must be symmetrical about the duct centre-line,
otherwise one of the fans may tend to 0 Windmill 0•
As a general guide to cross flow fan design, it is
found that the simplest casing design is the best to use.
Future designers must be aware that complicated modifica
tions which only marginally improve the performance or
179

efficiency will decrease the commercial competitiveness
of the cross flow fan.
180
REFERENCES
1 ALLEN, D.J. "The Effect of Rotor and Casing Geometry on the performance
of Cross Flow Fans." International Conference on Fan Design and Applic-
ations, Guildford, 1982.
2 ANDERSON, E.L. U.S. Patents nos. 1823 579 (1931), 1838 169 (1932),
1920 952 (1933).
3 ASANUMA, T. and TAKEDA, S. "A study on the Flow Visualization by the
Hydrogen Bubble Method." Bulletin of J.S.M.E., 8, 32, 1965, pp. 599-608.
4 BUCK, C.M. U.S. Patents nos. 1893 857 (1933), 2033 273 (1936).
5 CLAYTON, B.R. "A Review and Appraisal of Cross Flow Fans." Building
Services Engineer (I.H.V.E.), 42, Jan., 1975, pp. 230-247.
6 CLAYTON, B.R. and MASSEY, B.S. "Flow Visualization in Water: a
Review of Techniques." J. Sci. Instrum.,
7 COESTER, R. "Remarks on the Theory of Cross-Flow Fans." H.V.R.A.
Translation No. 39 of "Theoretische und experimentelle untersuchungen an
querstromgeblasen." • II Mitt. aus dem Instltut fUr Aerodyn., E.T.H., Zurich,
No. 28, 1959. U.S. Patent No. 2965 284 (1960).
8 DALIN, H. U.K. Patent No. 291 007 (1928).
9 DXTWYLER, G. U.K. Patent No. 988 712 (1965).
10 ECK, B. "Fans." Oxford, Pergamon Press, 1973,
pp. 156-182.
U.K. Patent No. 757 543 (1954).
11 FAURE, J. Houille Blanche, 18, 1963, pp. 298-306.
181
12 HOLGATE, M.J. and HAINES, P. "Scaling of Cross flow fans - an
Experimental Comparison." Proc. I. Mech. E. Conference on Scaling
for Performance Prediction in Rotodynamic Machines, Stirling, 1977,
13 IKEGAMI, H. and MURATA, S. "A Study of the Cross Flow Fan: Part 1:
A Theoretical Analysis." Technology Rep. Osaka Univ., 16, 1966, No. 731.
14 IKEGAMI, H. and MURATA, S. "Experimental Study of the Cross Flow Fan."
Science of Machine, 18, 3, 1966, pp. 557-566. (In Japanese).
15 ILBERG, H. and SADER, W.Z. "Flow Theory -arid Performance of Tangential
Fans." Proc. Inst. Mech. Engrs., London, 180, 1965-66, pp. 481-496.
16 MOORE, A. "The Tangential fan- analysis and design." Conference
on Fan Technology and Practice, Institute of Mechanical Engineers,
London, Apt"·,\ \97Z..
17 MORTIER, P. U.S. Patent No. 507 445 (1893).
18 MURATA, S. and NISHIHARA, K. "An Experimental Study of Cross Flow
Fan (1st. Report, Effects of housing geometry on the Fan Performance)."
Bulletin of J.S.M.E., 19, March 1976, pp. 314-321.
19 MURATA, S. and NISHIHARA, K. "An Experimental Study of Cross Flow
Fan (2nd Report, Movements of Eccentric Vortex inside impeller)."
Bulletin of J.S.M.E., 19, March 1976, pp. 322-329.
20 MURATA, S., OGAWA, T., SHIMIZU, I., NISHIHARA, K. and KINOSHITA, K.
"A Study of the C1·oss Flo-w Fan with inner guide apparatus." Bulletin
of J.S.M.E., 21, April 1978, pp. 681-688.
21 PELHAM, G. "Inlet Streamlines of the Cross Flow Fan." Final Year
Projec!, Durham University, 1979.
182

22 PORTER, A.M. "A Study of the Tangential Fan." Ph.D. Thesis,
Queens University, Belfast, 1969.
23 PORTER, A.M. and MARKLAND, E. "A Study of the Cross Flow Fan."
Journal of Mechanical Engineering Science, 12, 6, 1970, pp. 421-
431.
24 PRESZLER, L. and LAJOS, T. "Experiments for the development of the
Tangential Flow Fan." Proc. 4th Conf. on Fluid Machinery, (Budapest,
1972), Akademiai Kiado, pp. 1071-1082.
25 ROBERSON, E.C. Report of the National Gas Turbine Establishment
No. R. 181, 1955.
26 TRAMPOSCH, H.
1964.
"Cross Flow Fan." Paper A.S.M.E. No. 64-WA FE-26,
27 TUCKEY, P.R., HOLGATE, M.J. and CLAYTON, B.R. "Performance and
Aerodynamics of a Cross Flow Fan." International Conference on Fan
Design and Applications, Guildford, 1982.
28 YAMAFUJI, K. "Studies on the flow of Cross Flow Impellers (1st
Report, Experimental Study) • " Bull. Jap. Soc. Mech. Engrs. , 18,
Sept. 1975, pp. 1018-1025.
29 YAMAFUJI, K. "Studies on the flow of Cross Flow Impellers (2nd
Report, Analytical Study)." Bull. Jap. Soc. Mech. Engrs., 18, Dec.
1975, pp. 1425-1431.
183
USEFUL REFERENCES (not mentioned 1.n the text)
( i)
(ii)
(iii)
(iv)
( v)
(vi)
(vii)
(viii)
BUSH, E .H.: "Cross Flow Fans." Conference on Fan Technology
and Practice, I. Mech. E., London, April, 1972.
CLUTTER, D. W., and SMITH, A.M. 0.: "Flow visualization
by Electroylsis of Water." Aerospace Engineering, 20, Jan.,
1961, pp. 24-27 and 74-76.
DE-FRIES, J .R.: "66 Jahre Querstrom Ventilator." UDI
Berichte uber betriebswissen scheftliche, Arbeiten, Vol.
38, 1959, pp. 75-86.
GELLER, E. W.: "An Electrochemical Method of visualiz
the Boundary Layer." Journal of Aeronautical Science,
22, 1955, pp. 869-870.
GUNTON, M. and HOLGATE, M.J.: "Research Note - A Twin Rotor
Cross Flow Fan." Journal of Mech. Eng. Science, I. Mech., E.,
1978.
HAMA, F.R. and NUTANT, J.: "Detailed Flow Field Observations
in the Transition Process in a Thick Boundary Layer." Proc.
Heat Transfer Fluid Mech. Inst., 1963 pp. 77-93.
LOCKLEY, D.J.: "The Tangential Fan." M.Sc. Thesis,
Birmingham University, 1966.
SCHRAUB, F.A., KLINE, S.J., HENRY, J., RUNSTADLER Jr.,
P.W. and LITTELL, A.: "Use of Hydrogen Bubbles for
Quantitative Determination of Time-Dependent Velocity Fields
in Low-Speed Water Flows." ~o~rn~l Ba_s~~El]£· , 87, 1965, pp.
429·-444 184
( ix)
(x)
(xi)
SHAPIRO , A .H.: "Design of Tufts for Flow Visual
zation." A.I.A.A. Journal, 1, 1963, pp. 213-214.
SHAPIRO, A.H.: "Educational Films in Fluid Mechanisms."
Nominated Lecture, Proc. Inst. Mech. Engrs., 178, 1, 1963-
64, pp. 1187-1204.
STEPANOFF, A .J.: "Turbo blowers: theory, design and
Application of centrifugal and axial flow compressors and
fans." Published by Wiley, New York, 1955.
185

APPENDICES
186
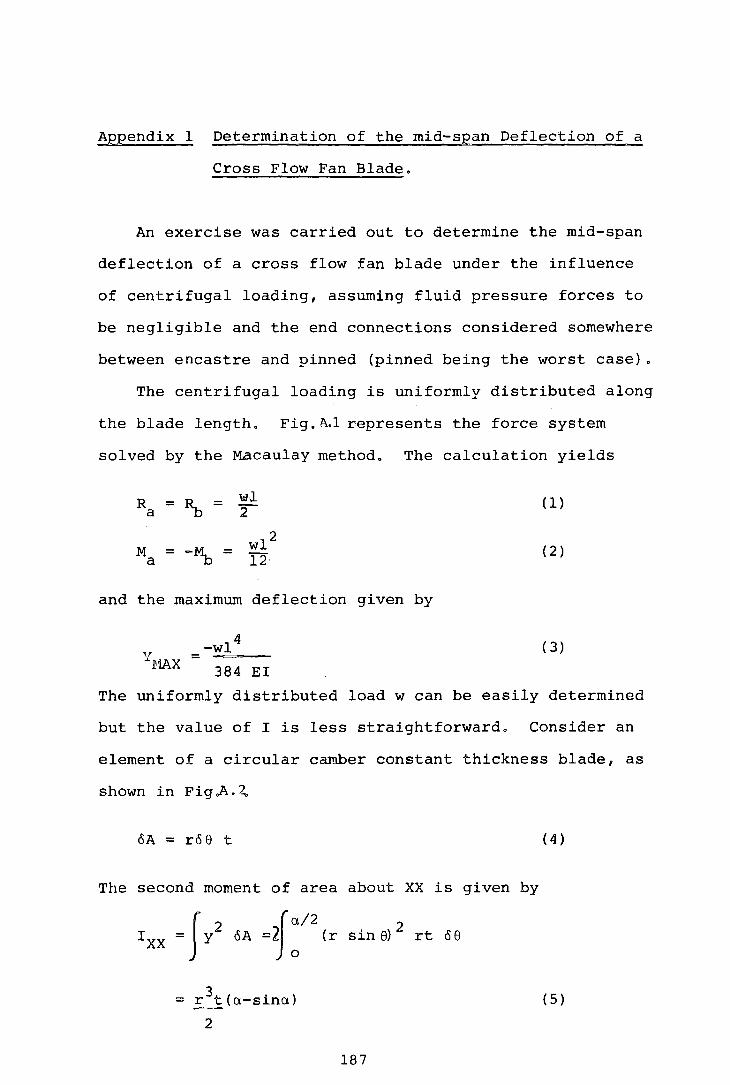
~pendix 1 Determination of the mid-span Deflection of a
Cross Flow Fan Blade.
An exercise was carried out to determine the mid-span
deflection of a cross flow fan blade under the influence
of centrifugal loading, assuming fluid pressure forces to
be negligible and the end connections considered somewhere
between encastre and pinned (pinned being the worst case).
The centrifugal loading is uniformly distributed along
the blade length. Fig. A.l represents the force system
solved by the ~~caulay method. The calculation yields
R = ~ = wJ. a 2 (1)
M = -~ = w1 2
a 12· ( 2)
and the maximum deflection given by
4
YUAX -wl =
384 EI
(3)
The uniformly distributed load w can be easily determined
but the value of I is less straightforward. Consider an
element of a circular camber constant thickness blade, as
shown in Fig .A. 2,
oA = roe t
The second moment of area about XX is given by
= r 3t(a=sina)
2
187
( 4)
(5)
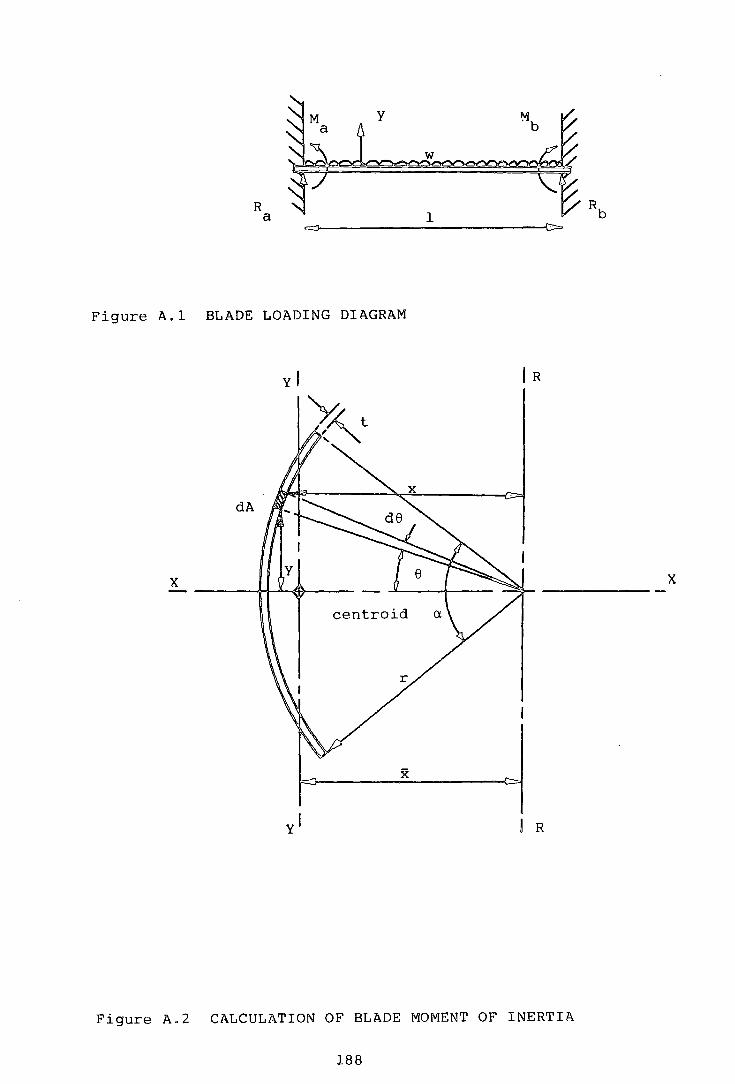
R a
Figure A.l BLADE LOADING DIAGRAM
dA
X
l
! R
Figure A.2 CALCULATION OF BLADE MOMENT OF INERTIA
188
X
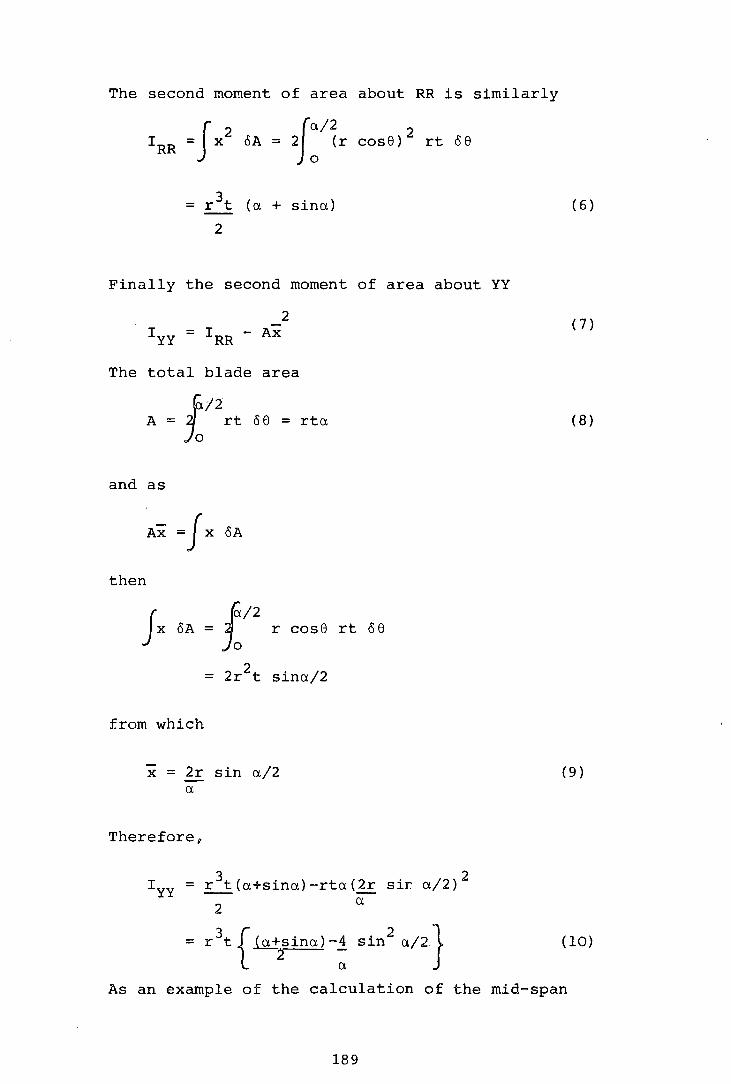
The second moment of area about RR is similarly
{
a./2 8A = 2 (r cose) 2 rt 88
0
( 6)
Finally the second moment of area about YY
2 ( 7)
The total blade area
__ pi" A= Jo ~rt 88 = rta. ( 8)
and as
Ax = J X 8A
then
Jx rA -- jo/2 u Ja r cose rt ce
from which
-x = 2r sin a./2 (9) -a.
Thereforep
= r 3t(a.+sina.)=rta.(2r sir a./2)2
2 a.
= r3
t { (nvinn) -~ sin2
n/2} (10)
As an example of the calculation of the mid-span
189
deflection, the blades parameters are:
r = 21.66 mm, t = 1.22 rnm and a = 55°
with, s1 = 90° (radial), blade mass= 22.7 gms, 1 = 320 mm
the diameter of the rotor = 200 rnm and N = 1000 rev. min=l
substitution into eqns.(5)&(10) yield:
rxx = 872 mm4
4 and Iyy = 13.7 mm
The centrifugal loading is given by
F = mRw2 = 24.89 N
The forces may now be resolved on to the XX and the YY
planes;
Fxx = 22.08 N
and FYY = 11.49 N
Eqn.3 then yields the respective deflections;
3
dxx Fxx 1
= 384EIXX
. -5 = 3xl0 m
F 1 3 dyy
·-yy
'* = 9.9xlo- 4 m 384Eiyy
These deflections are finally resolved into the radial
direction
dr = dxx cose + dyy sine
= 4.Sxlo= 4 rn
For the case with pinned ends
190
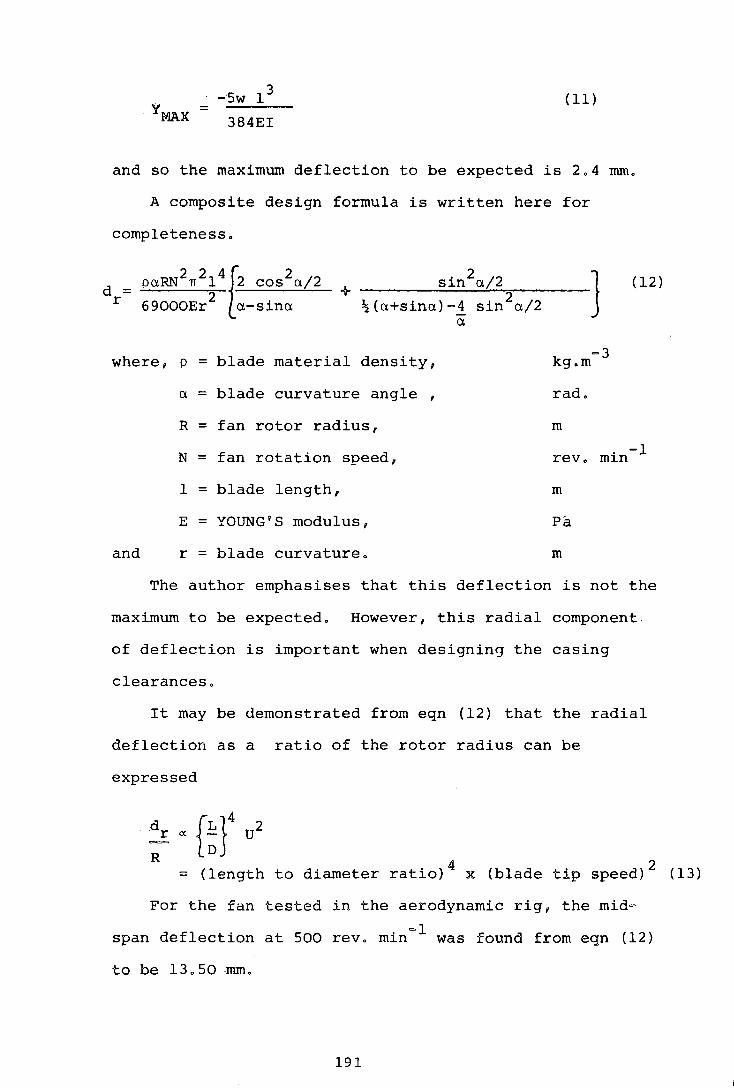
YMAX = . 3 -5w 1
384EI
(11)
and so the maximum deflection to be expected is 2.4 mm.
A composite design formula is written here for
completeness.
d = r 2 2 4f 2 paRN n 1 2 cos a/2
69000Er2
a-sina
+ sin2a/2
~(a+sina)-! sin2a/2
a
where, p = blade material density,
a = blade curvature angle
R = fan rotor radius,
J =3 kg.m
rad.
m
(12)
N = fan rotation speed, . -1 rev. m1n
1 = blade length, m
E = YOUNG 1 S modulus,
and r = blade curvature. m
The author emphasises that this deflection is not the
maximum to be expected. However, this radial component
of deflection is important when designing the casing
clearances.
It may be demonstrated from eqn (12) that the radial
deflection as a ratio of the rotor radius can be
expressed
r~r u2 R
= (length to diameter ratio)4
x (blade tip speed) 2 (13)
For the fan tested in the aerodynamic rig, the mid=
=1 span deflection at 500 rev. min was found from eqn (12)
to be 13.50 mm.
191
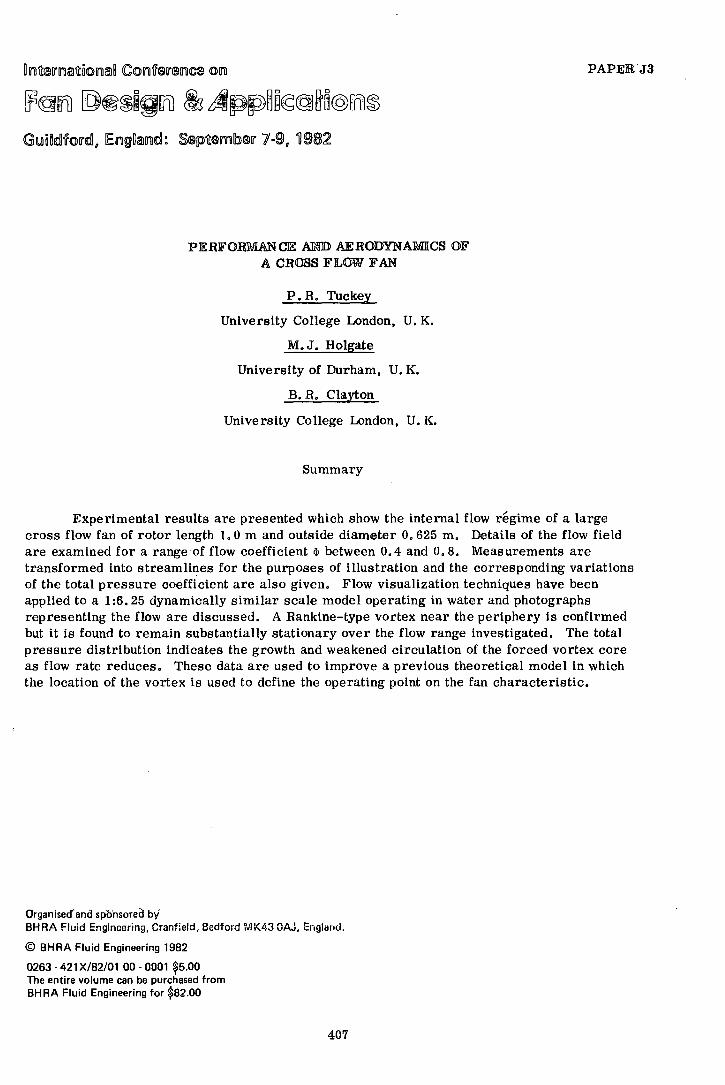
lP'ERFORI\.IIANCE AmiD AEROD'YNAMJ[CS OF A CROSS FLOW FAN
P.R. Tuckey
University College London, U.K.
M.J. Holgate
University of Durham, U.K.
B. R. Clayton
University College London, U.K.
Summary
PAPERJ3
Experimental results are presented which show the internal flow regime of a large cross flow fan of rotor length 1. 0 m and outside diameter 0. 625 m. Details of the flow field are examined for a range of flow coefficient ci> between 0.4 and o. 8. Measurements are transformed into streamlines for the purposes of illustration and the corresponding variations of the total pressure coefficient are also given. Flow visualization techniques have been applied to a 1:6.25 dynamically similar scale model operating in water and photographs representing the flow are discussed. A Rankine-type vortex near the periphery is confirmed but it is found to remain substantially stationary over the flow range investigated. The total pressure distribution indicates the growth and weakened circulation of the forced vortex core as flow rate reduces. These data are used to improve a previous theoretical model in which the location of the vortex is used to define the operating point on the fan characteristic.
Organisec:f and spcinsoreil b•o/ BHRA Fluid Engineering, Cranfleld, Bedfo;d MK43 OA.J, Englcmd.
© BHRA Fluid Engineering 1982
0263 - 421 X/82/01 00 - 0001 ~5.00 The entire volume can be purchased from BHRA Fluid Engineering for $82.00
407
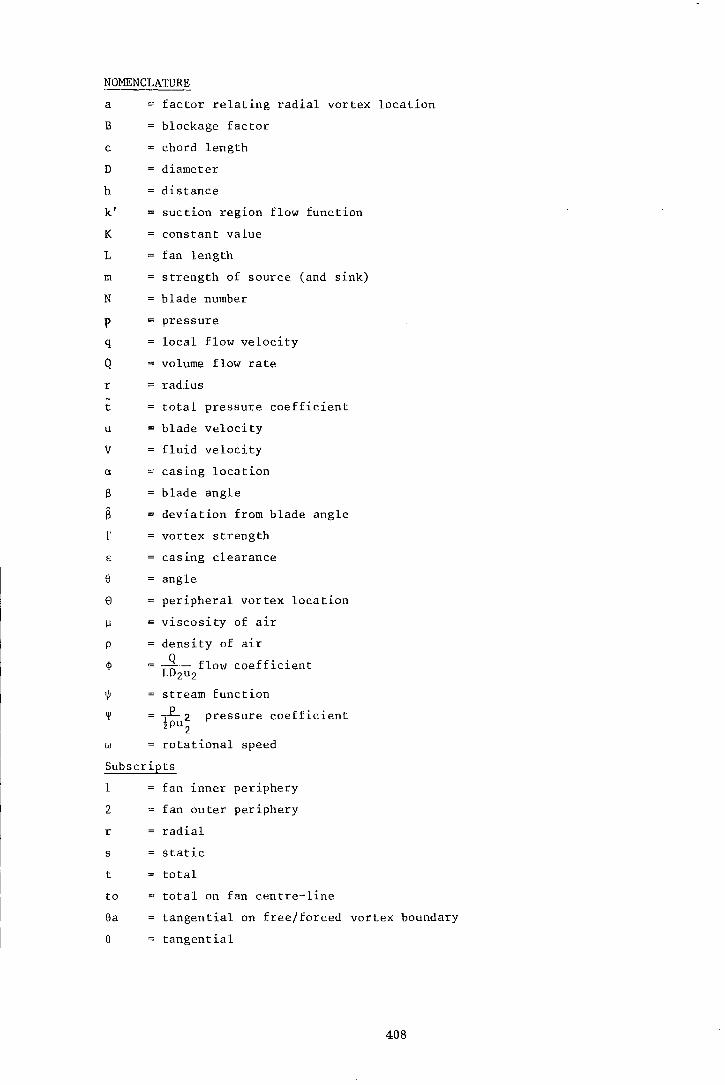
NOMENCLATURE
a factor relating radial vortex location
B blockage factor
c chord length
D diameter
h distance
k' suction region flow function
K constant value
L fan length
m strength of source (and sink)
N blade number
p - pressure
q local flow velocity
Q volume flow rate
r radius
t total pressure coefficient
u blade velocity
V fluid velocity
a casing location
S blade angle
B deviation from blade angle
r vortex strength
E casing clearance
e angle
e peripheral vortex location
~ viscosity of air
p density of air
~ LQD - flow coefficient 2u2
~ stream function
'¥ ~ 2 pressure coefficient 2Pu 2
w rotational speed
Subscripts
1 fan inner periphery
2 fan outer periphery
r radial
s static
t total
to total on fan centre-line
ea tangential on free/forced vortex boundary
e tangential
408
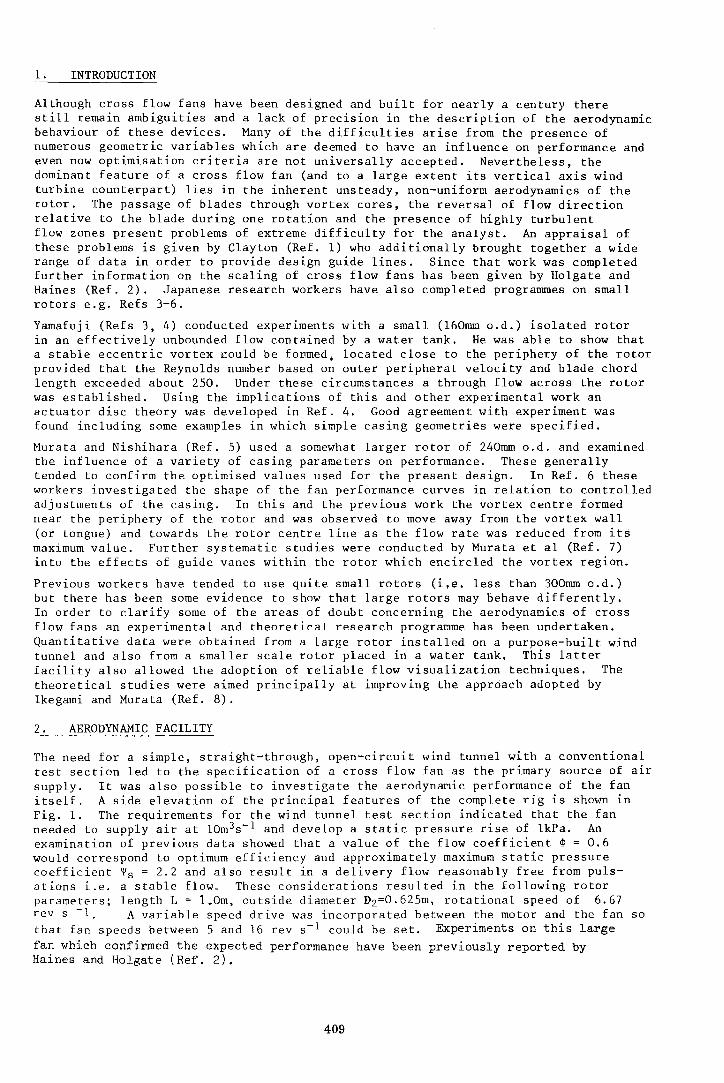
1. INTRODUCTION
Although cross flow fans have been designed and built for nearly a century there still remain ambiguities and a lack of precision in the description of the aerodynamic behaviour of these devices. Many of the difficulties arise from the presence of numerous geometric variables which are deemed to have an influence on performance and even now optimisation criteria are not universally accepted. Nevertheless, the dominant feature of a cross flow fan (and to a large extent its vertical axis wind turbine counterpart) lies in the inherent unsteady, non-uniform aerodynamics of the rotor. The passage of blades through vortex cores, the reversal of flow direction relative to the blade during one rotation and the presence of highly turbulent flow zones present problems of extreme difficulty for the analyst. An appraisal of these problems is given by Clayton (Ref. 1) who additionally brought together a wide range of data in order to provide design guide lines. Since that work was completed further information on the scaling of cross flow fans has been given by Holgate and Haines (Ref. 2). Japanese research workers have also completed programmes on small rotors e.g. Refs 3-6.
Yamafuji (Refs 3, 4) conducted experiments with a small (160mm o.d.) isolated rotor in an effectively unbounded flow contained by a water tank. He was able to show that a stable eccentric vortex could be fonmed; located close to the periphery of the rotor provided that the Reynolds number based on outer peripheral velocity and blade chord length exceeded about 250. Under these circumstances a through flow across the rotor was established. Using the implications of this and other experimental work an actuator disc theory was developed in Ref. 4. Good agreement with experiment was found including some examples in which simple casing geometries were specified.
Murata and Nishihara (Ref. 5) used a somewhat larger rotor of 240mm o.d. and examined the influence of a variety of casing parameters on performance. These generally tended to confirm the optimised values used for the present design. In Ref. 6 these workers investigated the shape of the fan performance curves in relation to controlled adjustments of the casing. In this and the previous work the vortex centre formed near the periphery of the rotor and was observed to move away from the vortex wall (or tongue) and towards the rotor centre line as the flow rate was reduced from its maximum value. Further systematic studies were conducted by Murata et al (Ref. 7) into the effects of guide vanes within the rotor which encircled the vortex region.
Previous workers have tended to use quite small rotors (i,e. less than 300mm o.d.) but there has been some evidence to show that large rotors may behave differently. In order to clarify some of the areas of doubt concerning the aerodyna1:1ies of cross flow fans an experimental and theoretical research programme has been undertaken. Quantitative data were obtained from a large rotor installed on a purpose-built wind tunnel and also from a smaller scale rotor placed in a water tank. This latter facility also allowed the adoption of reliable flow visualization techniques. The theoretical studies were aimed principally at improving the approach adopted by Ikegami and Murata (Ref. 8).
2. AERODYNAMIC FACILITY
The need for a simple, straight-through, open-circuit wind tunnel with a conventional test section led to the specification of a cross flow fan as the primary source of air supply. It was also possible to investigate the aerodynamic performance of the fan itself. A side elevation of the principal features of the complete rig is shown in Fig. 1. The requirements for the wind tunnel test section indicated that the fan needed to supply air at 10m3s- 1 and develop a static pressure rise of lkPa. An examination of previous data showed that a value of the flow coefficient ~ = 0.6 would correspond to optimum efficiency and approximately maximum static pressure coefficient •s = 2.2 and also result in a delivery flow reasonably free from pulsations i.e. a stable flow. These considerations resulted in the following rotor parameters; length L = l.Om, outside diameter D2=0.625m, rotational speed of 6.67 revs -1. A variable speed drive was incorporated between the motor and the fan so that fan speeds between 5 and 16 rev s- 1 could be set. Experiments on this large fan which confirmed the expected performance have been previously reported by Haines and Holgate (Ref. 2).
409
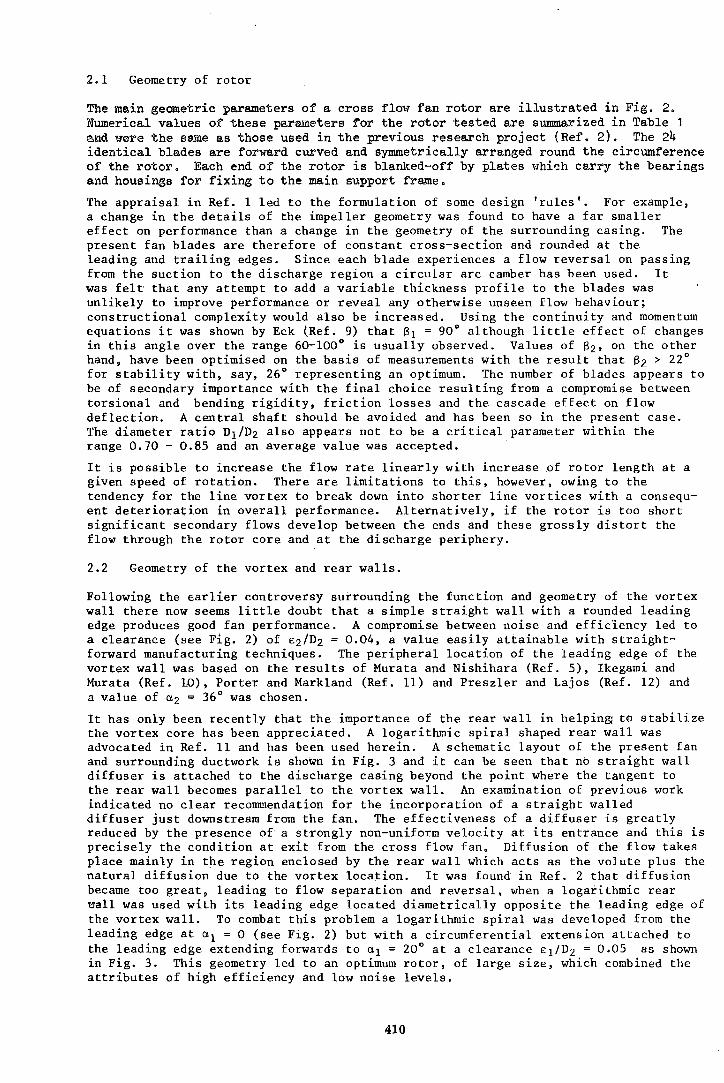
2.1 Geometry of rotor
The main geometric parameters of a cross flow fan rotor are illustrated in Fig, 2. Numerical values of these parameters for the rotor tested are summarized in Table 1 and were the same as those used in the previous research project (Ref. 2). The 24 identical blades are forward curved and symmetrically arranged round the circumference of the rotor. Each end of the rotor is blanked-off by plates whi~h carry the bearings and housings for fixing to the main support frame.
The appraisal in Ref. 1 led to the formulation of some design 'rules'. For example, a change in the details of the impeller geometry was found to have a far smaller effect on performance than a change in the geometry of the surrounding casing. The present fan blades are therefore of constant cross-section and rounded at the leading and trailing edges. Since each blade experiences a flow reversal on passing from the suction to the discharge region a circular arc camber has been used. It was felt that any attempt to add a variable thickness profile to the blades was unlikely to improve performance or reveal any otherwise unseen flow behaviour; constructional complexity would also be increased. Using the continuity and momentum equations it was shown by Eck (Ref. 9) that 81 = 90Q although little effect of changes in this angle over the range 60-100° is usually observed. Values of 82, on the other hand. have been optimised on the basis of measurements with the result that 82 > 22° for stability with, say, 26° representing an optimum. The number of blades appears to be of secondary importance with the final choice resulting from a compromise between torsional and bending rigidity, friction losses and the cascade effect on flow deflection. A central shaft should be avoided and has been so in the present case. The diameter ratio D1 /D2 also appears not to be a critical parameter within the range 0.70- 0.85 and an average value was accepted.
It is possible to increase the flow rate linearly with increase of rotor length at a given speed of rotation. There are limitations to this'· however, owing to the tendency for the line vortex to break down into shorter line vortices with a consequent deterioration in overall performance. Alternatively, if the rotor is too short significant secondary flows develop between the ends and these grossly distort the flow through the rotor core and at the discharge periphery.
2.2 Geometry of the vortex and rear walls.
Following the Earlier controversy surrounding the function and geometry of the vortex wall there now seems little doubt that a simple straight wall with a rounded leading edge produces good fan performance. A compromise between noise and efficiency led to a clearance {see Fig. 2) of E2/D2 = 0.04, a value easily attainable with straightforward manufacturing techniques. The peripheral location of the leading edge of the vortex wall was based on the results of Murata and Nishihara (Ref. 5), Ikegami and Murata (Ref. 10), Porter and Markland (Ref. 11) and Preszler and Lajos (Ref. 12) and a value of a 2 = 36° was chosen.
It has only been recently that the importance of the rear wall in helping t@ stabilize the vortex core has been appreciated. A logarithmic spiral shaped rear wall was advocated in Ref. 11 and has been used herein. A schematic layout of the present fan and surrounding ductwork is shown in Fig. 3 and it can be seen that no straight wall diffuser is attached to the discharge casing beyond the point where the tangent to the rear wall becomes parallel to the vortex wall. An examination of previous work indicated no clear recommendation for the incorporation of a straight walled diffuser just downstream from the fan. The effectiveness of a diffuser is greatly reduced by the presence of a st-rongly non-uniform velocity at its entrance and this is precisely the condition at exit from the cross flow fan, Diffusion of the flow takes place mainly in the region enclosed by the rear wall which acts as the volute plus the natural diffusion due to the vortex location. It was found in Ref. 2 that diffusion became too great 9 leading to flow separation and reversal, when a logarithmic rear ~all was used with its leading edge located diametrically opposite the leading edge of the vortex wall. To combat this problem a logarithmic spiral was developed from the leading edge at a 1 = 0 (see Fig. 2) but with a circumferential extension attached to the leading edge extending forwards to a 1 = 20° at a clearance E1/D 2 = 0.05 as shown in Fig. 3. This geometry led to an optimum rotor, of large size, which combined the attributes of high efficiency and low noise levels.
410
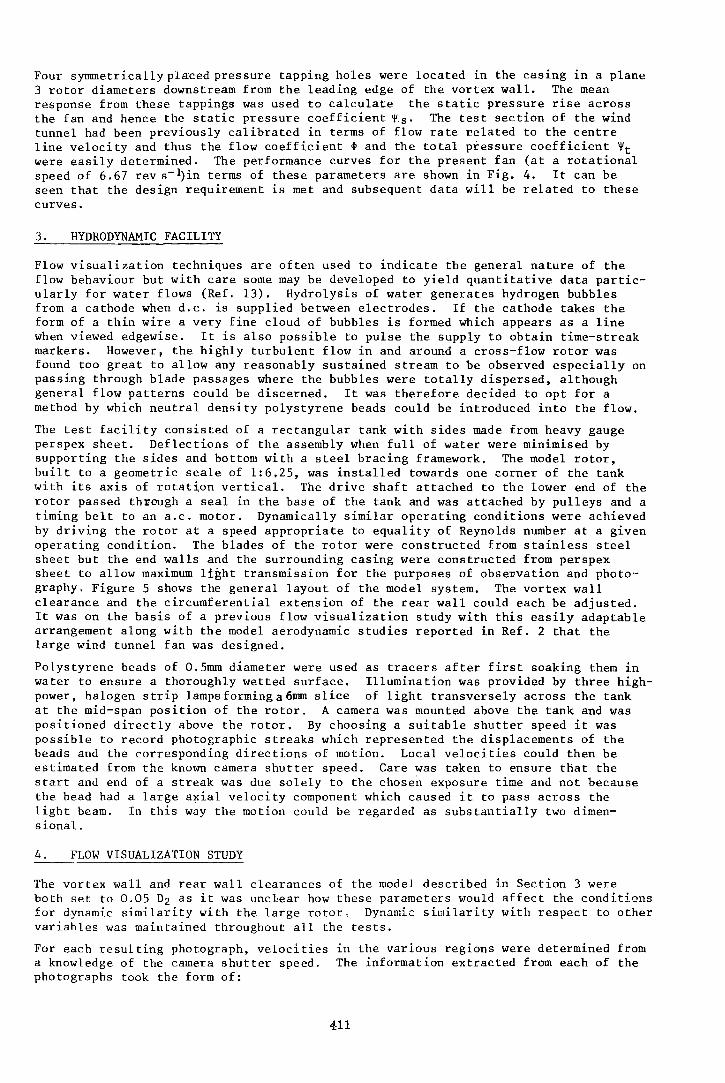
Four symmetrically plac.ed pressure tapping holes were located in the casing in a plane 3 rotor diameters downstream from the leading edge of the vortex wall. The mean response from these tappings was used to calculate the static pressure rise across the fan and hence the static pressure coefficient ~s· The test section of the wind tunnel had been previously calibrated in terms of flow rate related to the centre line velocity and thus the flow coefficient ~ and the total pressure coefficient ~t were easily determined. The performance curves for the present fan (at a rotational speed of 6.67 rev s-l)in terms of these parameters are shown in Fig. 4. It can be seen that the design requirement is met and subsequent data will be related to these curves.
3. HYDRODYNAMIC FACILITY
Flow visualization techniques are often used to indicate the general nature of the flow behaviour but with care some may be developed to yield quantitative data particularly for water flows (Ref. 13). Hydrolysis of water generates hydrogen bubbles from a cathode when d.c. is supplied between electrodes. If the cathode takes the form of a thin wire a very fine cloud of bubbles is formed which appears as a line when viewed edgewise. It is also possible to pulse the supply to obtain time-streak markers. However, the highly turbulent flow in and around a cross-flow rotor was found too great to allow any reasonably sustained stream to be observed especially on passing through blade passages where the bubbles were totally dispersed, although general flow patterns could be discerned. It was therefore decided to opt for a method by which neutral density polystyrene beads could be introduced into the flow.
The test facility consisted of a rectangular tank with sides made from heavy gauge perspex sheet. Deflections of the assembly when full of water were minimised by supporting the sides and bottom with a steel bracing framework. The model rotor, built to a geometric scale of 1:6,25, was installed towards one corner of the tank with its axis of rotation vertical. The drive shaft attached to the lower end of the rotor passed through a seal in the base of the tank and was attached by pulleys and a timing belt to an a.c. motor. Dynamically similar operating conditions were achieved by driving the rotor at a speed appropriate to equality of Reynolds number at a given operating condition. The blades of the rotor were constructed from stainless steel sheet but the end walls and the surrounding casing were constructed from perspex sheet to allow maximum light transmission for the purposes of obsenvation and photography. Figure 5 shows the general layout of the model system. The vortex wall clearance and the circumferential extension of the rear wall could each be adjusted. It was on the basis of a previous flow visualization study with this easily adaptable arrangement along with the model aerodynamic studies reported in Ref. 2 that the large wind tunnel fan was designed.
Polystyrene beads of 0.5mm diameter were used as tracers after first soaking them in water to ensure a thoroughly wetted surface. Illumination was provided by three highpower, halogen strip lampsforminga6mm slice of light transversely across the tank at the mid-span position of the rotor, A camera was mounted above the tank and was positioned directly above the rotor, By choosing a suitable shutter speed it was possible to record photographic streaks which represented the displacements of the beads and the corresponding directions of motion. Local velocities could then be estimated from the known camera shutter speed. Care was taken to ensure that the start and end of a streak was due solely to the chosen exposure time and not because the bead had a large a~ial velocity component which caused it to pass across the light beam. In this way the motion could be regarded as substantially two dimensional,
4. FLOW VISUALIZATION STUDY
The vortex wall and rear wall clearances of the model described in Section 3 were both set to 0.05 D2 as it was uncl·ear how these parameters would affect the conditions for dynamic similarity with the large rotor, Dynamic similarity with respect to other variahles was maintained throughout all the tests.
For each resulting photograph, velocities in the various regions were determined from a knowledge of the camera shutter speed. The information extracted from each of the photographs took the form of:
411

( i) (ii) (iii) (iv) (v) (vi) (vii) (viii) (ix) (x)
the effective inflow arc, the general behaviour of the floVT in the suction region, the flow velocities in the suction region, the size and velocity of the discharge jet over the rear wall, the general behaviour of the floVT in the interior region, the flow velocities in the interior region, the position of the vortex core, the effective outflow arc, the general behaviour of the flow in the discharge region, and the flow velocities in the discharge region.
From the resulting data it was possible to identify discrete zones of flow within the suction, interior and discharge regions as shown in Fig. 6.
The (a) (b)
(c)
zones identified within the suction region were: an inflow zone covering an arc beginning at the vortex wall, a discharge jet from the rotor interior covering an arc beginning leading edge of the rear wall, and a zone of entrained flow resulting from (b).
The zones identified in the interior region were: (d) a forced vortex core, (e) a recirculating floVT return path from the discharge region,
at the
(f) a return flow path from the discharge region below the vortex wall, (g) a throughflow path, (h) a throughflow path from the suction region to the discharge jet over the rear
wall, and (i) a low energy random zone.
The zones identified in the discharge region were: (j) a turbulent recirculation zone from the fan interior, (k) a diffusing throughflow zone, and (l) a flow path under the vortex wall returning essentially laminar flow to the
fan.
The size of these zones and the associated velocities were found to be entirely dependent on the flow rate passing through the fan. Several casing configurations were examined but here we shall deal primarily with the geometry relating to the full scale wind tunnel fan having the 20°, constant radius extension above the rear wall.
For the fan operating under medium throttle conditions the flow in the suction region exhibited the three regions mentioned previously. Figure 7 shows the high velocity region close to the vortex wall where the majority of the flow enters the fan (region a), with velocities in this region estimated at O.Su2. The geometric suction arc consists of 80% inflow VTith the remainder comprising the jet region b and its associated entrainment c. The velocity of the flow within the jet region is the order of the blade speed, showing clearly that the origin of the flow lies within the fan interior. The interior floVT clearly shows the vortex core (region d) and the turbulent low energy region diametrically opposite (region i).In Fig.7 the outflow arc covers 65% of the geometric arc before meeting the recirculatiou region (region j) where vortices are seen to be shed from the main vortex core. The flow under the vortex wall is returning towards bhe fan (region~). The velocities in the discharge region are about 3.0u2 (region k). As the fan outflow was throttled, the vortex moved by about 15° peripherally towards the rear wall but did not move significantly in a radial direction. Figure 8 is a high contrast, slow shutter speed photograph which shows the vortex core and a surrounding fainter region which corresponds to the flow returning from the discharge region below the vortex Hall (region e).
Figure 9 illustrates the 'zero' flow criterion and shoVTs the large recirculating region in the fan discharge (region j). It should be understood that zero floVT relative to the fan cannot exist by throttling the outlet duct, as flow is always maintained through the fan owing to recirculation within the duct. A true zero flow condition can be imposed with a damper installed adjacent to the fan outlet. The vortex then moves to the centre of the rotor and becomes a forced vortex. The suction region velocities for a throttled fan are little different from those of the full flow condition. However, the inflow arc then diminishes~o 50% of the geometric
412
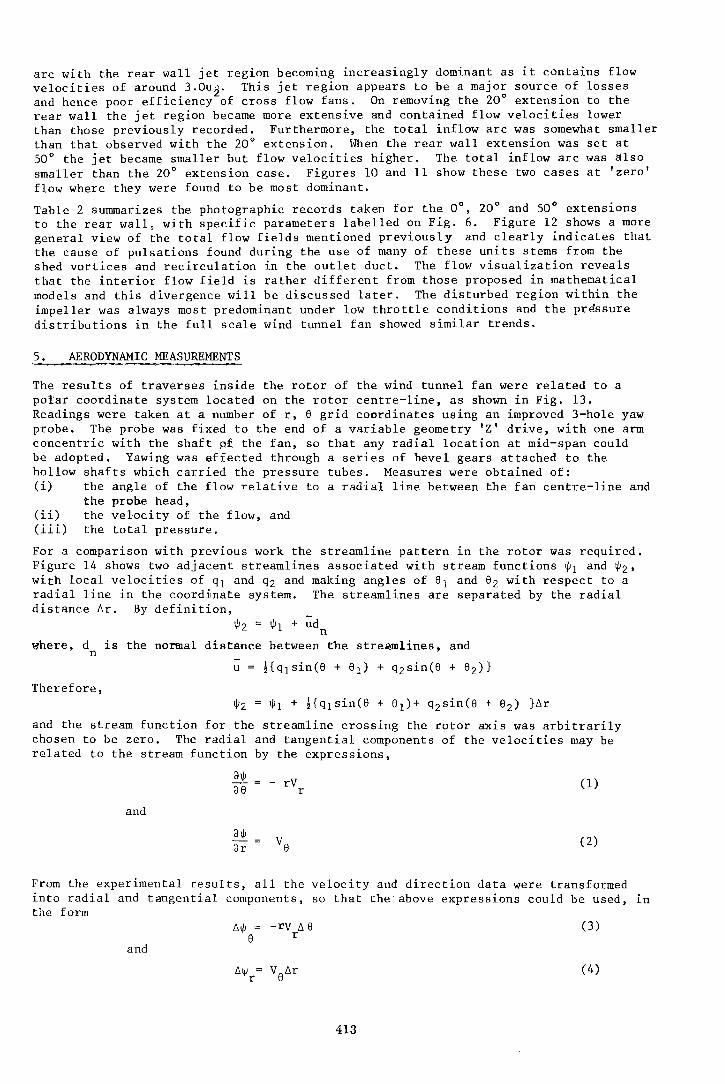
arc with the rear wall jet region becoming increasingly dominant as it contains flow velocities of around 3.0u2. This jet region appears to be a major source of losses and hence poor efficiency of cross flow fans. On removing the 20° extension to the rear wall the jet region became more extensive and contained flow velocities lower than those previously recorded. Furthermore, the total inflow arc was somewhat smaller than that observed with the 20° extension. ~\Then the rear wall extension was set at 50° the jet became smaller but flow velocities higher. Tite total inflow arc was glso smaller than the 20° extension case. Figures 10 and 11 show these two cases at 'zero' flow where they were found to be most dominant.
Table 2 summarizes the photographic records taken for the 0°, 20° and 50° extensions to the rear wall, with specific parameters labelled on Fig. 6. Figure 12 shows a more general view of the total flow fields mentioned previously and clearly indicates that the cause of pulsations found during the use of many of these units sterns from the shed vortices and recirculation in the outlet duct. The flow visualization reveals that the interior flow field is rather different from those proposed in mathematical models and this divergence will be discussed later. The disturbed region within the impeller was always most predominant under low throttle conditions and the pressure distributions in the full scale wind tunnel fan showed similar trends.
5. AERODYNAMIC MEASUREMENTS
The results of traverses inside the rotor of the wind tunnel fan were related to a potar coordinate system located on the rotor centre-line, as shown in Fig. 13. Readings were taken at a number of r, 8 grid coordinates using an improved 3-hole yaw probe. The probe was fixed to the end of a variable geometry 'Z' drive, with one arm concentric with the shaft pf the fan, so that any radial location at mid-span could be adopted. Yawing was effected through a series of bevel gears attached to the hollow shafts which carried the pressure tubes. Measures were obtained of: (i) the angle of the flow relative to a radial line between the fan centre-line and
(ii) (iii)
the prohe head, the velocity of the flow, and the total pressure.
For a comparison with previous work the streamline pattern in the rotor was required. Figure 14 shows two adjacent streamlines associated with stream functions ~ 1 and ~2 , with local velocities of q1 and q2 and making angles of 81 and 82 with respect to a radial line in the coord~nate system. The streamlines are separated by the radial distance ~r. By definition,
~2 = ~ 1 + ud n
where, d is the normal distance between the stre~lines, n
Therefore,
and
~2 = ~1 + ~{q1sin(8 + 6 1)+ q2 sin(e + 82 ) }~r
and the stream function for the streamline crossing the rotor axis was arbitrarily chosen to be zero. The radial and tangential components of the velocities may be related to the stream function by the expressions,
and
~ Clr
- rV r
(1)
(2)
From the experimental results, all the velocity and direction data were transformed into radial and tangential components, so that the'above expressions could be used, in the form
and
~~ = -rv ~ e 8 r
413
(3)
(4)
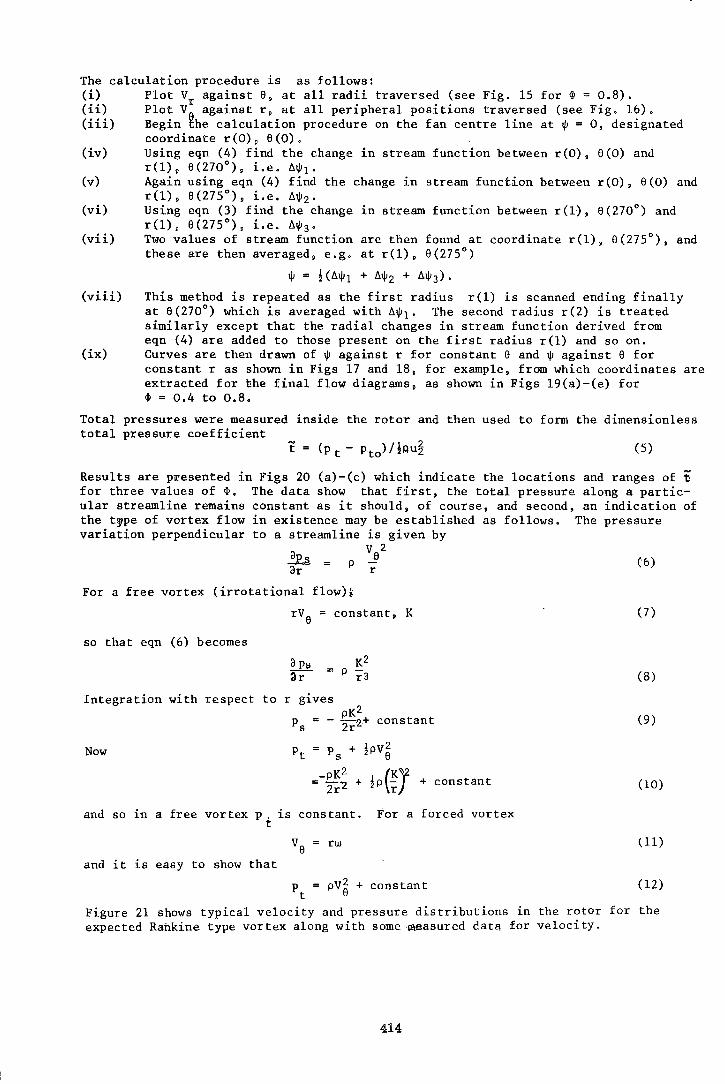
The calculation procedure is as follows: (i) Plot Vr against a, at all radii traversed (see Fig. 15 for~= 0.8). (ii) Plot V against r, at all peripheral positions traversed (see Fig. 16). (iii) Begin ~he calculation procedure on the fan centre line at ¢ = O, designated
coordinate r(O), a(O). (iv) Using eqn (4) find the change in stream function between r(O). 6(0) and
r(l). a(270°). i.e. ~WI· (v) Again using eqn (4) find the change in stream function between r(O), 6(0) and
r(l), a(275°). i.e. ~¢ 2 • (vi) Using eqn (3) find the change in stream function between r(l), 6(270°) and
r(l). a(275°) 0 i.e. ~W3· (vii) Two values of stream function are then found at coordinate r(l), a(275°), and
these are then averaged, e.g. at r(l), a(275°)
(viii)
(ix)
w = ~(~w1 + ~W2 + ~W3).
This method is repeated as the first radius r(l) is scanned ending finally at a(270°) which is averaged with ~Wl· The second radius r(2) is treated similarly except that the radial changes in stream function derived from eqn (4) are added to those present on the first radius r(l) and so on. Curves are then drawn of ¢ against r for constant 6 and w against a for constant r as shown in Figs 17 and 18, for example, from which coordinates are extracted for the final flow diagrams, as shown in Figs 19(a)-(e) for 41 = 0.4 to 0.8.
Total pressures were measured inside the rotor and then used to form the dimensionless total pressure coefficient
t = (p t- Pt0)/blu~ (5)
Results are p~esented in Figs 20 (a)-(c) which indicate the locations and ranges of ~ for three values of 4!. The data show that first, the total pressure along a particular streamline remains constant as it should, of course, and second, an indication of the t'pe of vortex flow in existence may be established as follows. The pressure variation perpendicular to a streamline is given by
v 2 ~ = P a {6) ar r
For a free vortex (irrotational flow)~
rV6 = constant, K
so that eqn (6) becomes
Integration with respect to r gives pK2
p8
- 2r2+ constant
Now
+ constant
and so in a free vortex p, is constant. For a forced vortex t
(7)
(8)
(9)
(10)
va = rw (11)
and it is easy to show that
pt = pV~ + constant (12)
Figure 21 shows typical velocity and pressure distributions in the rotor for the expected Rankine type vortex along with some ~asured data for velocity.
414
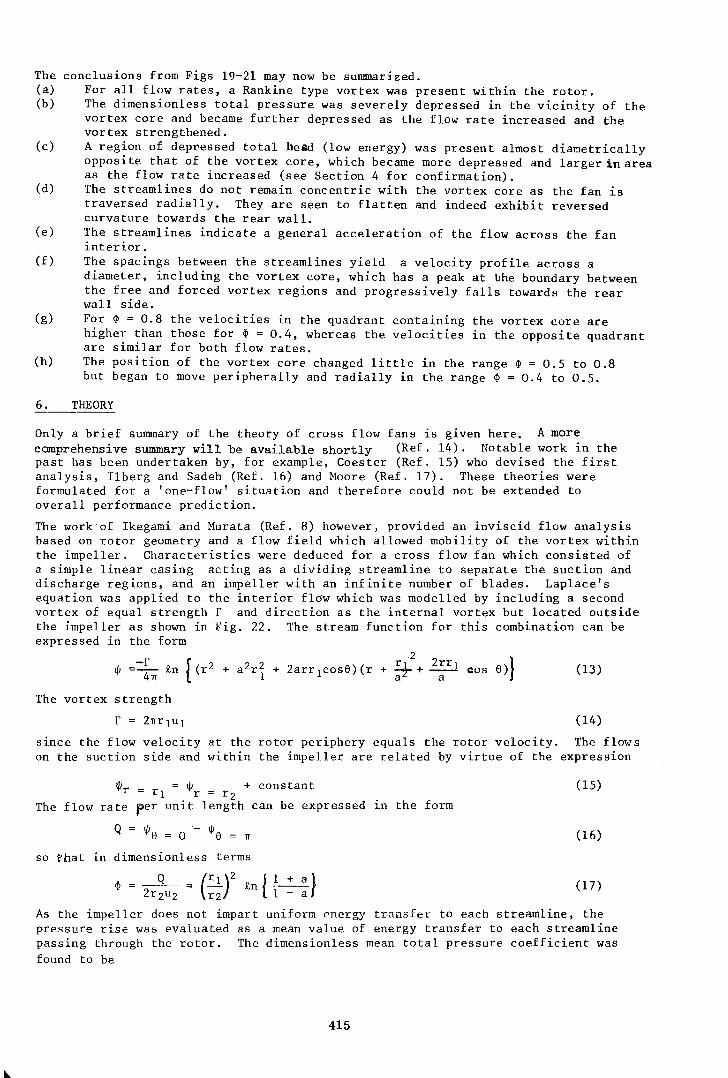
The conclusions from Figs 19-21 may now be summarized. (a) For all flow rates, a Rankine type vortex was present within the rotor. (b) The dimensionless total pressure was severely depressed in the vicinity of the
vortex core and became further depressed as the flow rate increased and the vortex strengthened.
(c) A region of depressed total .head (low energy) was present almost diametrically opposite that of the vortex core, which became more depressed and larger in area as the flow rate increased (see Section 4 for confirmation).
(d) The streamlines do not remain concentric with the vortex core as the fan is traversed radially. They are seen to flatten and indeed exhibit reversed curvature towards the rear wall.
(e) The streamlines indicate a general acceleration of the flow across the fan interior.
(f) The spacings between the streamlines yield a velocity profile across a diameter, including the vortex core, which has a peak at bhe boundary between the free and forced vortex regions and progressively falls towards the rear wall side.
(g) For ~ = 0.8 the velocities in the quadrant containing the vortex core are higher than those for ~ = 0.4, whereas the velocities in the opposite quadrant are similar for both flow rates.
(h) The pos1t1on of the vortex core changed little in the range ~ = 0.5 to 0.8 but began to move peripherally and radially in the range ~ = 0.4 to 0.5.
6. THEORY
Only a brief summary of the theory of cross flow fans is given here. A more comprehensive summary will be available shortly (Ref. 14). Notable work in the past has been undertaken by, for example, Coester (Ref. 15) who devised the first analysis, Ilberg and Sadeh (Ref. 16) and Moore (Ref. 17). These theories were formulated for a 'one-flow' situation and therefore could not be extended to overall performance prediction.
The work of Ikegami and Murata (Ref. 8) however, provided an inviscid flow analysis based on rotor geometry and a flow field which allowed mobility of the vortex within the impeller. Characteristics were deduced for a cross flow fan which consisted of a simple linear casing acting as a dividing streamline to separate the suction and discharge regions, and an impeller with an infinite number of blades. Laplace's equation was applied to the interior flow which was modelled by including a second vortex of equal strength r and direction as the internal vortex but located outside the impeller as shown in Fig. 22. The stream function for this combination can be expressed in the form
-r { r 2
2rr } ljJ =-- R-n (r2 + a2r 2 + 2arr 1 cos6) (r + :+ + ~ cos 6) 41T l a a
(13)
The vortex strength
r = 21Trlul (14)
since the flow velocity at the rotor periphery equals the rotor velocity. The flows on the suction side and within the impeller are related by virtue of the expression
l/Jr = rl = lj!r = r2
+ constant (15)
The flow rate per unit length can be expressed 1n the form
Q = l/Je = o ~ l/Je = 1r (16)
so that in dimensionless terms
Q (r 1 )2 ll + a} <!> = 2r2u2 = -;;- R-n r-=-a (17)
As the impeller does not impart uniform Pnergy transfer to each streamline, the prP.ssure rise was eva.luated as a mean value of energy transfer to each streamline passing through the rotor. The dimensionless mean total pressure coefficient was found to be
415
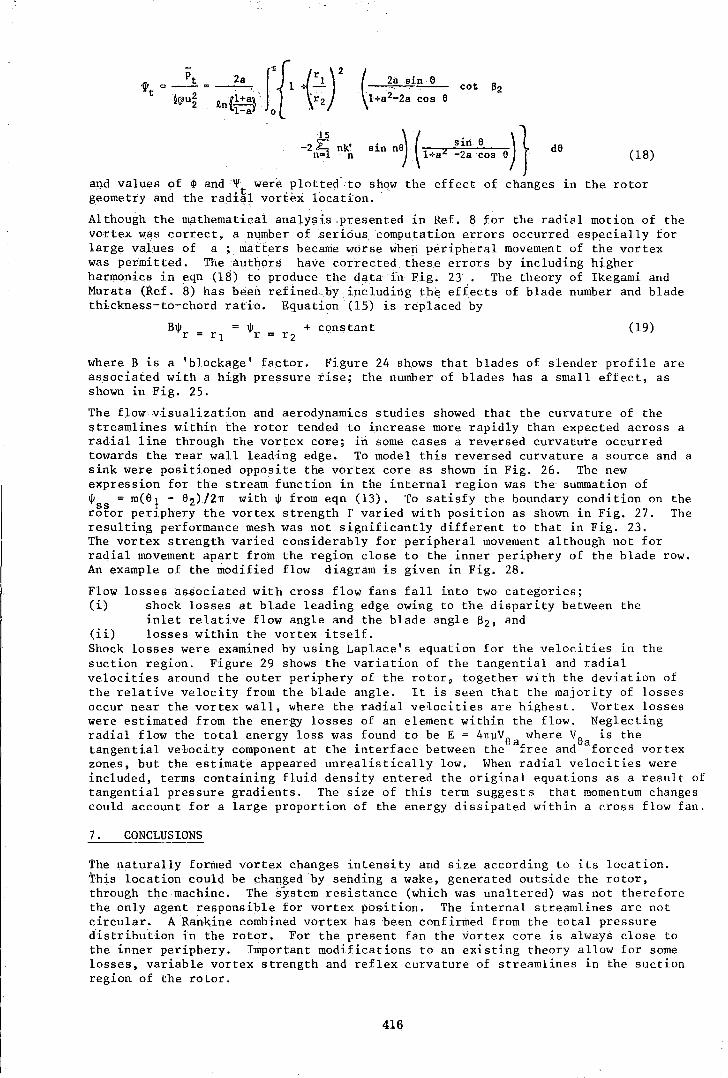
i't Pt 2a I{ {::r ( '"'" 6 cot 82 c--=---"
l+a2-2a !(flu~ tn{l+a} cos 6 1-a
15
sin ne) "" ( l+a2 sin e .)1 -2E nk' de n=l n -2a cos (18)
and values of q> and 'l' were plotted to show the effect of changes in the rotor geometry and the radi~l vortex location.
Although the mathematical analysis .presented in Ref. 8 for the radial motion of the vortex ,._,as correct, a number of serious computation errors occurred esp~cially for large values of a ; matters became worse when peripheral movement of the vortex was permitted. The autho"rs have corrected these errors by including higher harmonics in eqn (18) to produce the data in Fig. 23 . The theory of Ikegami and Murata (Ref. 8) has been refined_oy including the effects of blade number and blade thickness-to-chord ratio. Equation (lS) is replaced by
(19)
where B is a 'blockage' factor. Figure 24 shows that blades of slender profile are associated with a high pressure rise; the number of blades has a small effect, as shown in Fig. 25.
The flowvisualization and aerodynamics studies showed that the curvature of the streamlines within the rotor tended to increase more rapidly than expected across a radial line through the vortex core; ih some cases a reversed curvature occurred towards the rear wall leading edge. To model this reversed curvature a source and a sink were positioned opposite the vortex core as shown in Fig. 26. The new expression for the stream function in the internal region was the summation of ~ = m(e 1 - e2)/2w with~ from eqn (13). To satisfy the boundary condition on the rg~or periphery the vortex strength r varied with position as shown in Fig. 27. The resulting performance mesh was not significantly different to that in Fig. 23. The vortex strength varied considerably for peripheral movement although not for radial movement apart from the region close to the inner periphery of the blade row, An example of the modified flow diagram is given in Fig. 28.
Flow losses associated with cross flow fans fall into two categories; (i) shock losses at blade leading edge owing to the disparity between the
inlet relative flow angle and the blade angle 829 and (ii) losses within the vortex itself. Shock losses were examined by using Laplace's equation for the velocities in the suction region. Figure 29 shows the variation of the tangential and radial velocities around the outer periphery of the rotor 0 together with the deviation of the relative velocity from the blade angle. It is seen that the majority of losses occur near the vortex wall, where the radial velocities are highest. Vortex losses were estimated from the energy losses of an element within the flow. Neglecting radial flow the total energy loss was found to be E = 4n~V6 where v6 is the tangential veJmcity component at the interface between the afree and aforced vortex zones, but the estimate appeared unrealistically low. When radial velocities were included, terms containing fluid density entered the original equations as a result of tangential pressure gradients. The size of this term suggests that momentum changes could account for a large proportion of the energy dissipated within a cross flow fan.
7. CONCLUSIONS
The naturally formed vortex changes intensity and size according to its location. This location could be changed by sending a wake, generated outside the rotor, through the machine. The system resistance (which was unaltered) was not therefore the only agent responsible for vortex ppsition. The internal streamlines are not circular. A Rankine combined vortex has been confirmed from the total pressure distribution in the rotor. For the present fan the vortex core is always close to the inner periphery. Important modifications to an existing theory allow for some losses, variable vortex strength and reflex curvature of streamlines in the suction region of the rotor.
416
ACKNOWLEDGEMENTS
The work reported here was carried out in the Department of Engineering, University of Durham, under a grant from the Science (and Engineering) Research Council. The grantholder, M.J. Holgate and P.R. Tuckey, who was supported by the grant, gratefully acknowledge that assistance.
REFERENCES
1. Clayton, B.R.: "A review and appraisal of cross flow fans". Building Services Engineer (I.H.V.E.), 42, Jan. 1975, pp 230-247.
2. Holgate, M.J. and Haines, P.: "Scaling of cross flow fans- an experimental ~c~o~m~p~a~r~i~s~o~n~"~.~~--~P~r-o-c--.~I. Mech. E. Conference on Scaling for Performance Prediction in Rotodynamic Machines, Stirling, 1977.
3. Yamafuji, K.: "Studies on the flow of cross-flow impellers (1st Report, Experimental study)". Bull. Jap. Soc. Mech. Engrs, 18, Sept. 1975, pp 1018-1025.
4. Yamafuji, K.:"Studies on the flow of cross-flow impellers (2nd Report 9
Analytical study)". Bull. Jap. Soc. Mech. Engrs, 18, Dec. 1975, pp 1425-1431.
5.
6.
Murata, S. and Nishihara, K.: "An experimental study of cross flow (1st Report, Effects of housing geometry on the fan performance)". Jap. Soc. Mech, Engrs, 19, Mar. 1976, pp 314-321.
fan Bull.
Murata, S. and Nishihara, K. "An experimental study of cross (2nd Report, Movements of eccentric vortex inside impeller)".
flow fan Bull. Jap. Soc.
Mech. Engrs, 19, Mar. 1976, pp 322-329.
7. Murata, S., Ogawa, T., Shimizu, I., Nishihara, K. and Kinoshita, K.: "A study of cross flow fan with inner guide apparatus". Bull. Jap. Soc. Mech. Engrs, 21, Apr. 1978, pp 681-688.
8. Ikegami, H. and Murata, S.: "A study of the cross flow fan: Part 1, A theoretical analysis". Technology Rep. Osaka Univ., 16, 1966, No. 731.
9. Eck, B.: " Fans". Oxford, Pergamon Press, 1973, pp 156-182.
10. Ikegami, H. and Murata, S.: "Experimental study of the cross flow fan". Science of Machine, 18, 3, 1966, pp 557-566. (In Japanese)
11. Porter, A.M. and Markland, E.: "A study of the cross flmv fan". Jour. Mech. Eng. Sci., 12, 6, 1970, pp 421-431.
12. Preszler, L. and Lajos, T.: "Experiments for the development of the tangential flow fan". Proc. 4th. Conf. on Fluid Machinery (Budapest, 1972), Akademiai Kiad6, pp 1071-1082.
13. Clayton, B.R. and Massey, B.S.: "Flow visualization in water: a review of techniques". J. Sci. Instrum., 44, 1967, pp 2-11.
14. Tuckey, P.R. and Clayton, B.R.r Ph.D Thesis, University of Durham, in preparation.
15. Coester, R.: "Theoretische und experimentelle untersuchungen an querstromgeblasen''. Mitt. aus dem Institut fUr Aerodyn., E.T.H., Zurich, No. 28, 1959. (In German)
16. Ilberg, H. and Sadeh, W.Z.: "Flow theory and performance of t€1ngential fans". Proc. Inst. Mech. Engrs, London. 180, 1965-66, pp 481-496.
17. Moore, A.: "The tangential fan - analysis and de-sign". Conference on Fan Technology and Practice, Institution of Mechanical Engineers, London, April 1972.
417
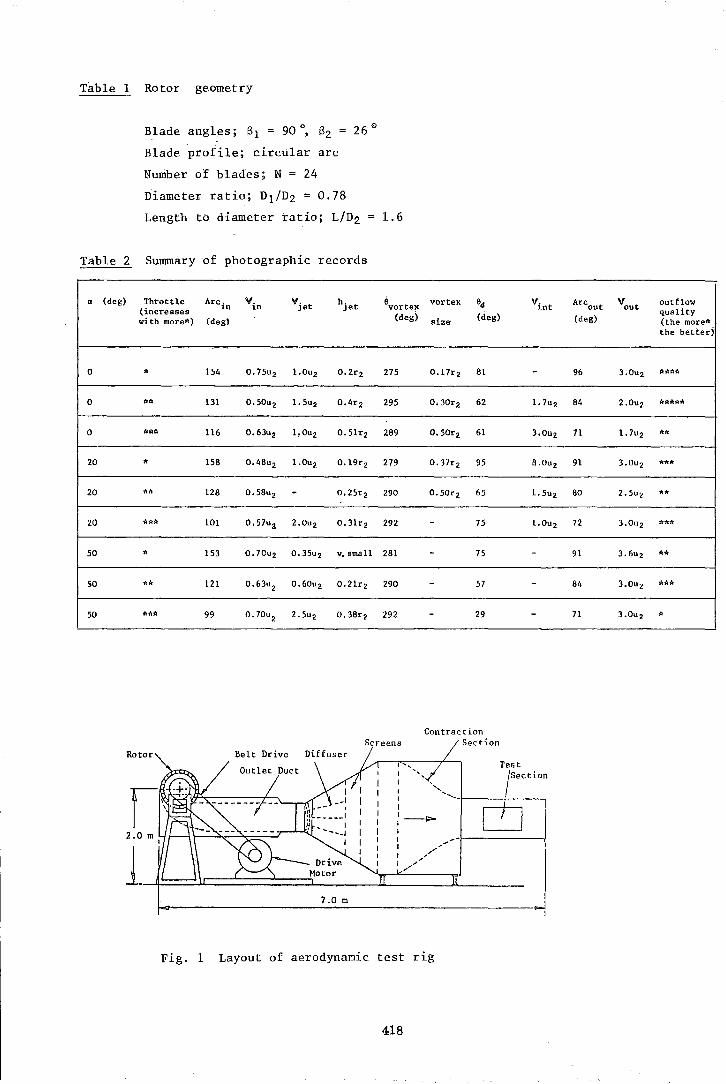
Table 1 Rotor geometry
Blade angles; 13 1 = 90 °, 132 = 26 ° Blade profile; circular arc
Number of blades; N = 24
Diameter ratio; D1/D2 = 0.78
Length to diameter ratio; L/D2 1. 6
Table 2 Summary of photographic records
a (de g) Throttle Arc. 'II. vjet hjet e (increases 1n m vortex
with more") (deg) (deg)
0 " 154 0.75u2 l.Ou2 0.2r2 275
0 "" 131 0.50u 2 1.5u2 0.4r2 295
0 "*" 116 0.63u2 l.Ou2 0.51r2 289
20 #r 158 0.48u2 l.Ou2 0.19r2 279
20 .... 128 0.58u2 - 0.25r2 290
20 ...... 101 0. 57uz 2.0u 2 0.31r2 292
50 .. 153 0. 70u2 0. 35u2 v. small 281
so .... 121 0.63u2 0.60u2 0.21r 2 290
50 ...... 99 0. 70u2 2.5uz o.38rz 292
Screens
7.0 m
vortex ed
size (deg)
O.l7r 2 81
o. 30r 2 62
0.50r2 61
0.37r 2 95
0.50r 2 65
- 75
- 75
- 57
- 29
Contraction Section
Fig. 1 Layout of aerodynanic test rig
418
vint Arc vout outflow out quality (deg) (the more"
the better}
- 96 3.0u2 f!f'fit'Atf
l. 7u2 84 2.0u2 ARicRI\
3.0u2 7l 1.7u2 "" 3.0u2 91 3.0uz "**
1.5u2 80 2.5u2 ....
l.Ou2 72 3.0uz ......
- 91 3.6uz .. ..
- 84 3.0u2 .. ....
- 7l 3.0u 2 ..
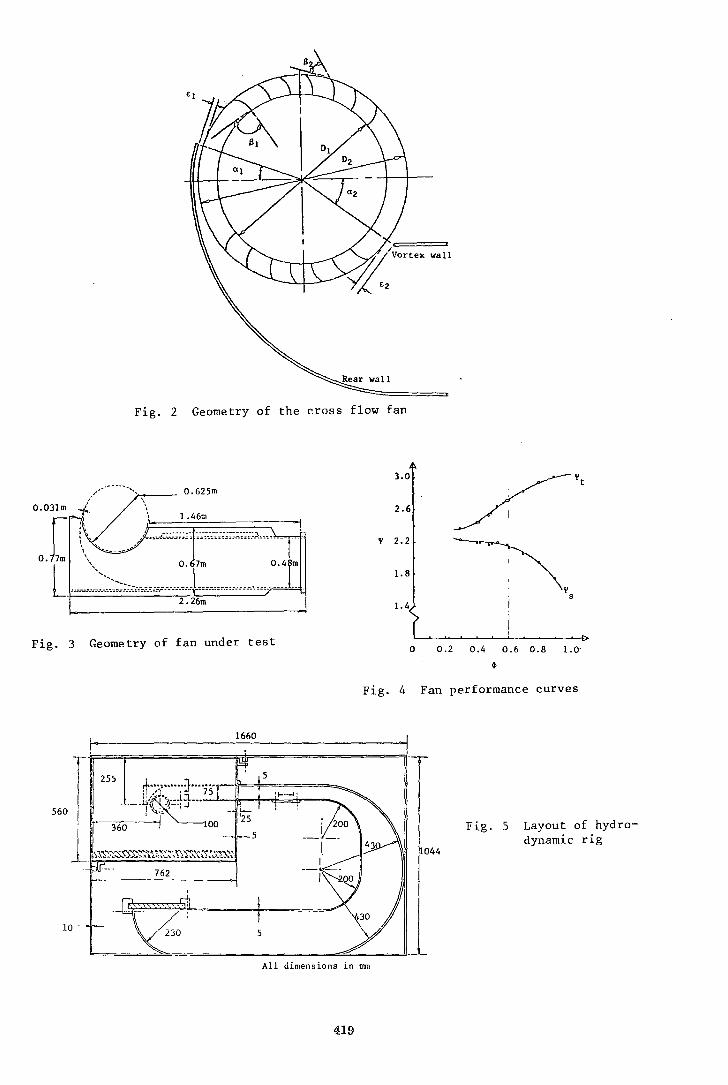
Fig. 2 Geometry of the cross flow fan
3.0
2.6
'l' 2.2
1.8
· 2.26m 1.4
Fig. 3 Geometry of fan under test 0
/'' ~.
s
0.2 0.4 0.6 0.8 l.O·
~
Fig. 4 Fan performance curves
1660 ~------------~~------------~
10
All dimensions in mm
419
044
Fig. 5 Layout of hydrodynamic rig
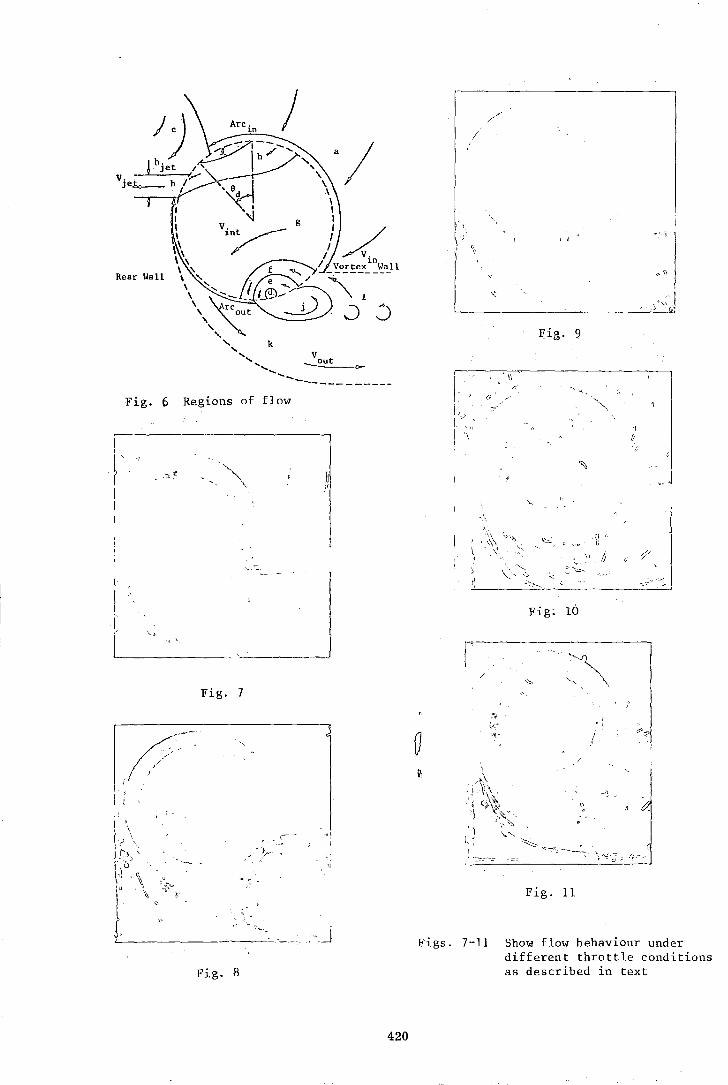
v ~
------------Fig. 6 Regions rif flow
l
f : '~
/I \,
I I
Fig. 7
.~.J
Fig. 8
420
r
0 '!'
9>
Figs. 7-11
Fig; 10
""' ~-~
c~
! ~
'
Fig. 11
Show flow behaviour under different throttle conditions as described in text
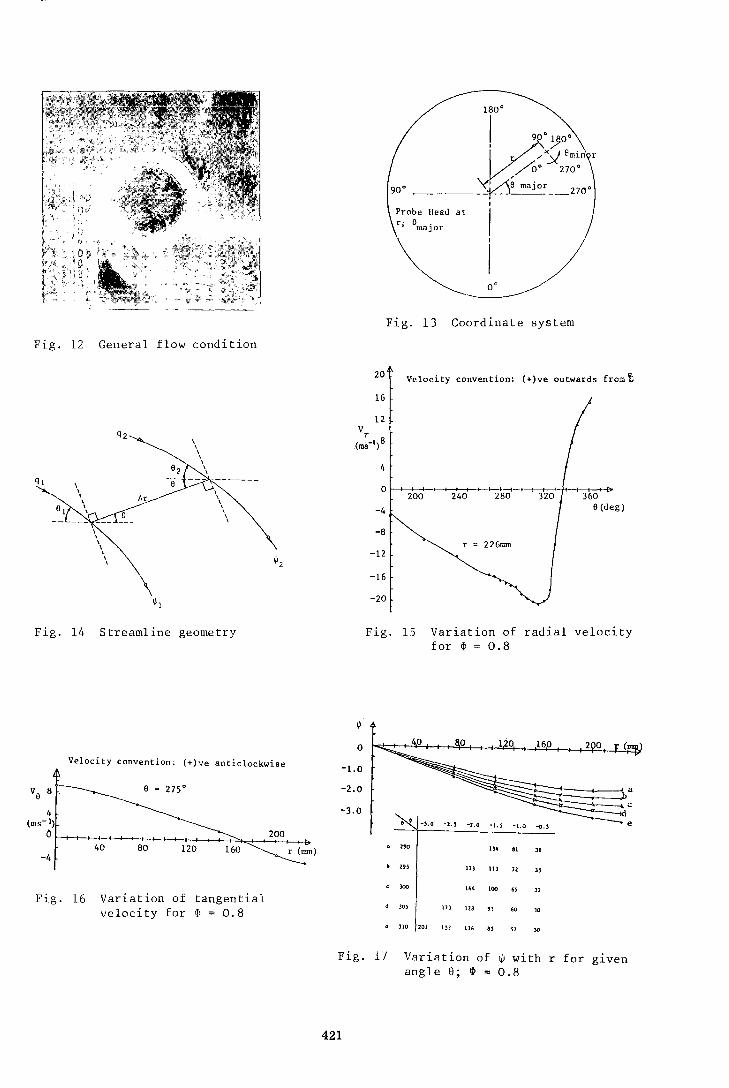
Fig. 12 General flow condition
Fig. 14 Streamline geometry
v8
a
4 (ms-1)
Velocity convention" (+)ve anticlockwise
e = 21s•
or+~~~~~~~~~~.-+~~ 40 80
-4
Fig. 16 Variation of tangential velocity for ~ = 0.8
0
-Lo
-2.0
-3.0
go• ~o· .,.Y 9min r
/o• 270°
<'l /'\e major 2700 -- --- - T - ...t____:___ -
I
I ~'
Fig. 13 Coordinate system
20
16
12
4
-4
-8
-12
-16
-20
Velocity convention: (+)ve outwards from 't
r = 226nnn
360 S(deg)
Fig. 15 Variation of radial velocity for ~ = 0. 8
160
•• ~:
-l.O -z.s -z.o -a.s -Lo -o.s ~ e
. 290 134 81 38
• ,., 173 Ill " "
' 100 144 100 " 32
• 105 '" 128 " 60 10
. 110 201 "' 116 85 51 lO
Fig. 17 Variation of ~ with r for given angle 8; ~ = 0.8
421
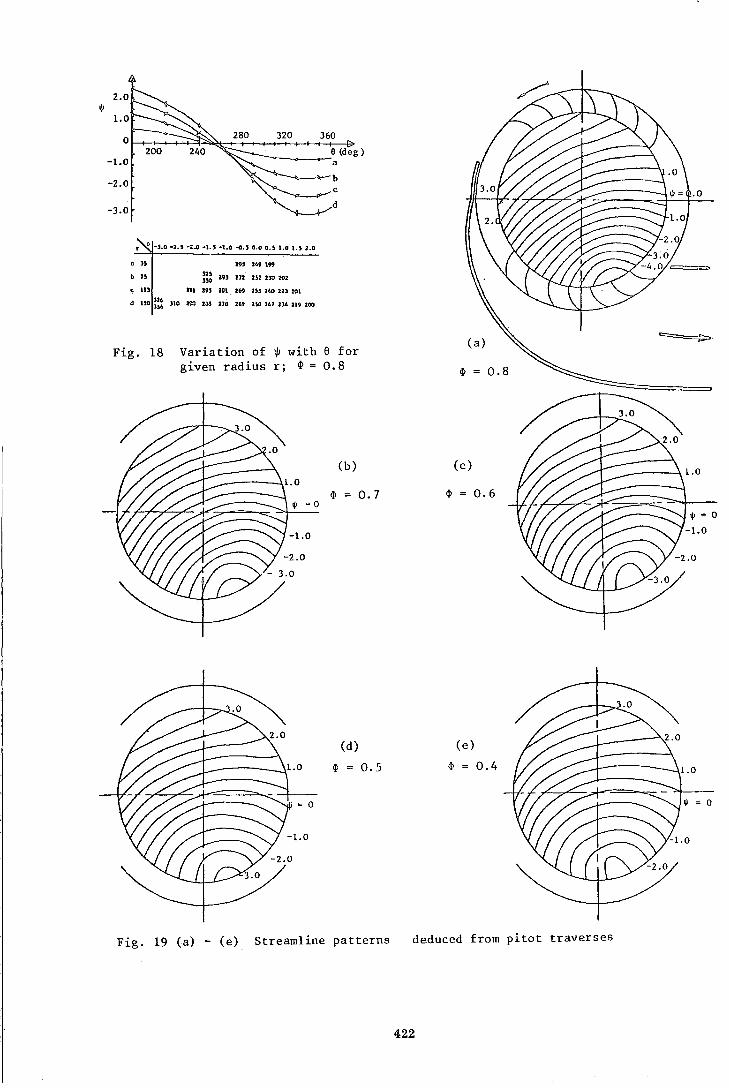
I' O -J.o •J.S -2.0 *l.S --1.0 --G.J O.o O.S 1.0 l.J 2.0
a , .. , 149199
b 75 ns .. , 212 zsz :no zo2 ,, llJ m 29> 201 269 us 240 22] %01
d lll> U6 310 10<) ... 21B llA ... 2SO 24J ll4 U9 200
Fig. 18 Variation of ~ with 9 for given radius r; <I>= 0.8
(b)
<I>= 0.7
(d)
4> = 0.5
(a)
4> = 0.8
(c)
4> = 0.6
(e)
4> = 0.4
Fig. 19 (a) - (e) Streamline patterns deduced from pitot traverses
422
.0
~-
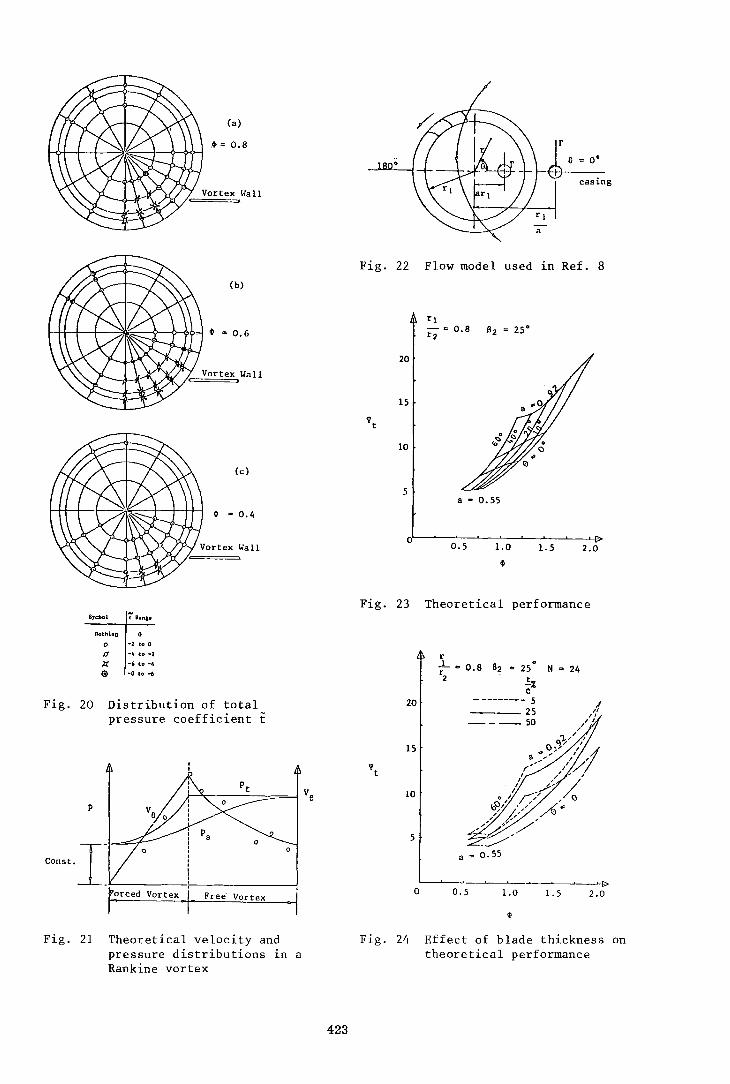
(a)
¢ = 0.8
Vortex Hall
(c)
¢ = 0.4
Vortex Wall
.,...,, t R.-n&l'
£1othino
0 -2 to 0
t:/ -4 to -2 J:( -6 co -4
e -o co --6
Fig. 20 Distribution of total pressure coefficient t
p
0
Vortex, I Free· Vortex
0
Fig. 21 Theoretical velocity and pressure distributions in a Rankine vortex
423
Fig. 22 Flow model used in Ref. 8
0.8 25°
20
15
10
5 a = 0.55
OIL-~~--~~--~~--~~~ 0.5 1.0 1.5 2.0
¢
Fig. 23 Theoretical performance
r ..L= 0.8 62
0
r 25 N = 24 2 !.%
(!
20 --------- 5 25
----SO
15
'ft
10
5
a = o. 55
0 0.5 1.0 1.5 2.0
¢
Fig. 24 Effect of blade thickness on theoretical performance
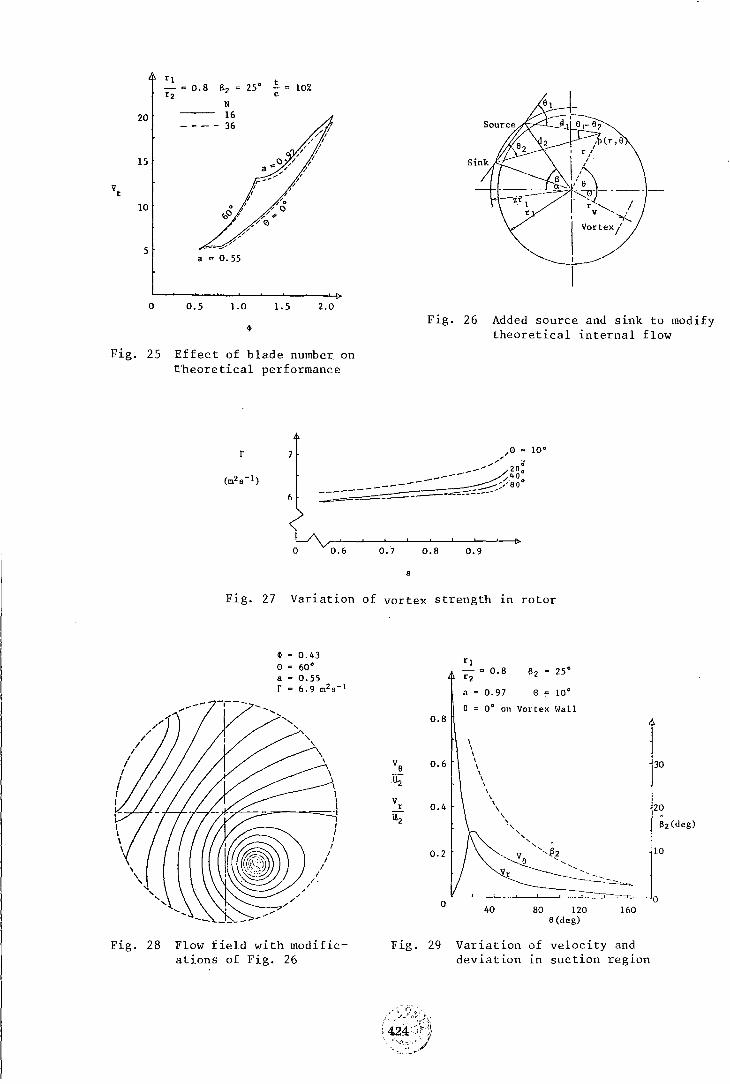
rl != - = 0.8 a.2 = zs• 10%
r2 c N
20 16 ---- 36
15
"t 10
5 a = 0. 55
0 0.5 1.0 1.5 2.0
~
Fig. 25 Effect of blade number on e'heoretical performance
r
-------6
Fig. 26 Added source and sink to modify theoretical internal flow
o~-0~ .. 6--~--o~.-7--~-o~.-8--~-o~.-9--~~~
a
Fig. 27 Variation of vortex strength ~n rotor
I I
I I
I
I I I
/
,./ /
~ = 0.43 0 60° a ~ 0.55 r c 6.9 m2s-l
/
/ /
/
I /.
/
I
I I I I
I I
Fig. 28 Flow field with modifications of Fig. 26
0.8
ve 0.6
Uz
v 0.4 r
Uz
0.2
0
Fig. 29
rl 0.8 Bz zs•
rz
a = 0.97 0 to• e = o• on Vortex !~all
40 80 120 160 e (de g)
Variation of velocity and deviation ~n suction region
30
10
0