dust depletion, chemical uniformity and environment of ca
TRANSCRIPT

Swinburne University of Technology | CRICOS Provider 00111D | swinburne.edu.au
Swinburne Research Bank http://researchbank.swinburne.edu.au
Zych, B. J., Murphy, M. T., Hewett, P. C., & Prochaska, J. X. (2009). Dust depletion, chemical uniformity and environment of Ca II H&K quasar absorbers.
Originally published in Monthly Notices of the Royal Astronomical Society, 392(4), 1429–1450.
Available from: http://dx.doi.org/10.1111/j.1365-2966.2008.14157.x
Copyright © 2009 The authors.
This is the author’s version of the work, posted here with the permission of the publisher for your personal use. No further distribution is permitted. You may also be able to access the published version from your library. The definitive version is available at www.interscience.wiley.com.

arX
iv:0
810.
5131
v2 [
astr
o-ph
] 14
Jan
200
9
Mon. Not. R. Astron. Soc.000, 1–16 (2008) Printed 14 January 2009 (MN LATEX style file v2.2)
Dust depletion, chemical uniformity and environment of Ca ii H&Kquasar absorbers
Berkeley J. Zych,1,2⋆ Michael T. Murphy,2 Paul C. Hewett1 and Jason X. Prochaska31Institute of Astronomy, University of Cambridge, Madingley Road, Cambridge CB3 0HA2Centre for Astrophysics& Supercomputing, Swinburne University of Technology, P.O.Box 218, Victoria 3122, Australia3Department of Astronomy and Astrophysics, UCO/Lick Observatory, University of California, 1156 High Street, Santa Cruz, CA 95064
Accepted —. Received —; in original form —
ABSTRACTCaii λλ3934, 3969 absorbers, which are likely to be a subset of damped Lymanα systems, arethe most dusty quasar absorbers known, with an order of magnitude more extinction inE(B−V)than other absorption systems. There is also evidence that Caii absorbers trace galaxies withmore ongoing star-formation than the average quasar absorber. Despite this, relatively littleis known in detail about these unusual absorption systems. Here we present the first highresolution spectroscopic study of 19 Caii quasar absorbers, in the range 0.6 6 zabs 6 1.2,with Caii λ3934 equivalent widths,W3934
0 > 0.2 Å. Their general elemental depletion patternsare found to be similar to measurements in the warm halo phaseof the Milky Way (MW) andMagellanic Clouds interstellar medium. Dust depletions and α-enrichments profiles of sub-samples of 7 and 3 absorbers, respectively, are measured using a combination of Voigt profilefitting and apparent optical depth techniques. Deviations in [Cr/Zn] ∼ 0.3 ± 0.1 dex and in[Si/Fe] & 0.8 ± 0.1 dex are detected across the profile of one absorber, which weattributeto differential dust depletion. The remaining absorbers have< 0.3 dex (3σ limit) variation in[Cr/Zn], much like the general DLA population, though the dustiest Caii absorbers, those withW3934
0 > 0.7 Å, remain relatively unprobed in our sample. A limit on electron densities in Caiiabsorbers,ne < 0.1 cm−3, is derived using the ratio of neutral and singly ionised species andassuming a MW-like radiation field. These electron densities may imply hydrogen densitiessufficient for the presence of molecular hydrogen in the absorbers. The Caii absorber samplecomprises a wide range of velocity widths,∆v90 = 50− 470 kms−1, and velocity structures,thus a range of physical models for their origin, from simplediscs to galactic outflows andmergers, would be required to explain the observations.
Key words: galaxies: ISM – quasars: absorption lines
1 INTRODUCTION
Quasar absorption line systems are understood to be probes ofgalaxies not subject to the luminosity bias of traditional surveys,being instead biased by their gas content and galaxy cross-section.Despite this, our exact understanding of how absorbers and galax-ies are related is uncertain due to the difficulty of interpreting ab-sorption line characteristics in the context of the associated galaxy.Damped Lymanα systems (DLAs), defined by virtue of havingneutral hydrogen column densitiesNHi > 2 × 10²⁰ atoms cm−2,are some of the best studied absorption systems. In particular, itwas postulated that DLAs may be the reservoirs of neutral gasin the Universe from which stars form because the amount ofneutral gas in DLAs atz ∼ 3 is similar to the amount of gaslocked up in stars today (Wolfe 1993; Wolfe, Gawiser & Prochaska2005). Attempts to measure the star-formation associated with
⋆ E-mail: [email protected] (BJZ)
DLAs through a variety of direct and indirect techniques (e.g.Wolfe, Prochaska & Gawiser 2003; Chen, Kennicutt Jr. & Rauch2005; Wolfe & Chen 2006) have met with limited success, gener-ally finding low star-formation rates.
Recently, Wild & Hewett (2005) used the statistical power ofthe Sloan Digital Sky Survey (SDSS) to study the rare, so-calledstrong Caii absorbers (those with rest-frame equivalent widths,W3934
0 > 0.2 Å). Wild & Hewett (2005) postulated that Caii ab-sorbers were an unusual sub-class of DLAs because lines of sightthrough our own Galaxy with similar strengths of Caii absorbershave neutral hydrogen column densities consistent with DLAs.Furthermore, Wild & Hewett (2005) found that the Mgii equiv-alent widths of Caii absorbers are large (W2796
0 & 1.0 Å), thusthey have a high probability of being DLAs (Rao & Turnshek2000). The observed sample of Caii absorbers has also been foundto be much more dusty than either the general DLA popula-tion or strong Mgii absorbers, with averageE(B−V) ∼ 0.1 mag(Wild, Hewett & Pettini 2006, henceforth WHP06), compared to
2 B. J. Zych et al.
E(B−V) ≃ 0.013 mag for Mgii absorbers (WHP06; York et al.2006) andE(B−V) < 0.02 mag for DLAs (Murphy & Liske 2004;Vladilo et al. 2008). The low levels of dust in DLAs are con-firmed by studies of radio-selected quasars, which find little evi-dence for optical quasar drop-outs due to dusty DLAs (Ellison et al.2001; Ellison, Hall & Lira 2005). Nonetheless, the presenceof dustdetected by WHP06 means that Caii absorbers are significantlyunder-represented in existing samples of DLAs, a conclusion con-sistent with those of Nestor et al. (2008), who find that only∼10 percent of DLAs possess very strong,W3934
0 > 0.5 Å, Caii absorption.The suggested number of optical quasar drop-outs due to dusty Caiiabsorbers is still consistent with the statistics of the Ellison et al.(2001) radio-selected quasar sample. Nestor et al. (2008) also findindirect indications from photo-ionisation modeling, constrainedby their observations, that Caii absorbers host molecular hydrogen.
In addition to these indirect indicators of star-formationac-tivity, such as dust and molecular hydrogen, direct studiesat bothintermediate and low redshift have shown Caii absorbers to be as-sociated more strongly with star formation than other absorbers.At z ∼ 1 Caii absorbers are found to have meanin situ star for-mation rates (SFRs) from 0.11 − 0.48 M⊙ yr−1 compared to just0.11−0.14 M⊙ yr−1 for DLAs (Wild, Hewett & Pettini 2007). TheseSFRs are as measured inside the 3′′ diameter SDSS fibre centred oneach quasar and thus do not account for star-formation in theab-sorber host galaxy if it falls outside this radius. At lower redshifts,z . 0.4, direct measurements from the host galaxies of Caii ab-sorbers give SFRs in the range 0.3− 30 M⊙ yr−1, though it is likelythe work is biased towardsL∗ galaxies (Zych et al. 2007).
Thus, there is now much evidence to suggest Caii absorbersare associated with star-formation, at least to some extent, both withdirect measurements of the star formation rate and through sig-natures generally associated with star formation such as dust andmolecular hydrogen. However, few details of why Caii absorbersmight trace star-formation more readily than other absorbers areunderstood. Nor do we know much about the physical environ-ment of the absorbers themselves (rather than their host galaxies).In this paper we present the first results of a high resolutionstudy ofthe absorbing gas using observations from the Ultra-VioletEchelleSpectrograph (UVES) at the VLT and the HIgh Resolution EchelleSpectrograph (HIRES) at Keck. With these data we are able tostudy the dust depletion and chemical uniformity (α enhancement)of individual absorbers as well as constrain the physical environ-ment giving rise to the absorbing gas based on the velocity structureof the absorber.
The paper is structured as follows: in Section 2 we present thesample selection, observations, data reduction and analysis tech-niques used in the rest of the paper. Section 3 contains the resultsof our analysis, divided into dust depletion, enrichment and envi-ronment sub-sections. Section 4 places these results into contextwith more general results from the literature and finally, Section 5summarizes the main points from the paper.
2 SAMPLE SELECTION, OBSERVATIONS, DATAREDUCTION AND ANALYSIS
2.1 Selection
The Caii λλ3934,3969 absorption lines are relatively weak andthus detection of the Mgii λλ2796, 2803 absorption lines at thesame redshift are required to confirm that the absorption sys-tem is real. In practice no real Caii absorbers are detected with
W27960 < 0.5 Å, thus this can be used as a constraint to weed out
false-positive detections (Wild & Hewett 2005; Wild et al. 2006).Absorbers were identified by searching for features with rest frameequivalent width,W3934
0 > 0.2 Å at 4σ significance in the sampleof all 58835 SDSS DR4 quasars classified by having ‘specClass’= 3 or 4 in the SDSS. To confirm a detection as real, it was alsorequired that the Caii λ3969 line equivalent width had a signifi-cance> 1σ and that Mgii λ2796 was detected at> 6σ significancewith W2796
0 > 0.5 Å. This requirement implies a minimum velocitywidth∼ 50 km s−1 for our absorbers, which being at the lower limitof the velocity width distribution for DLAs will not strongly biasany comparison between Caii absorbers and DLAs (See Section4.4). Absorbers separated by less than 500 km s−1 were classifiedas a single absorption system. For the purposes of this project thesample was restricted tozabs > 0.73 so that Znii λ2026 was above3500 Å, below which the efficiency of UVES (and HIRES) beginsto drop more rapidly. Finally, suitable candidates for follow-up highresolution observations required the Zn and Cr transitionsto lie out-side the Lyα forest.
Targets with g-band magnitudes6 18.5 mag were se-lected to achieve signal-to-noise ratio (SNR)∼ 10 per pix inthe continuum at the wavelength of Znii λλ2026, 2062 andCr ii λ2056, 2062, 2066. Declination was restricted to allow obser-vations from the VLT at Paranal in Chile (except for the one targetobserved with Keck in Hawaii) and R.A. was scheduling depen-dant.
These SDSS-selected absorbers were complemented by asearch through the ESO/UVES science archive for any absorberswhich also exhibited strong Caii absorption at the limits definedabove.
2.2 Observations
The new UVES data were taken in service mode during the period2007 May 18− July 25 as part of ESO observing programme 79.A-0656. The programme was not completed, so we only have partialdata on some absorbers, therefore we will highlight in each sectionwhich absorbers have data which contributed to the respective anal-yses. We observed J0334−0711 on 2008 January 12 for one 2700 sexposure with the C1 decker on Keck/HIRESb (Vogt et al. 1994).The observations are summarised in Table 1. The emission redshiftsare as given by SDSS and the absorber redshifts are as measuredfrom the SDSS Caii detections. For all UVES observations the slitwidth was 1.2′′, which was comparable to the seeing in all cases.The data were binned, 2× 2, to improve the SNR. All observationswere taken with the slit at the parallactic angle to compensate foratmospheric dispersion.
To supplement these newly observed data we include 12 Caii
absorbers detected in quasar spectra from the ESO/UVES sci-ence archive (See Table 2). Equivalent width measurements ofCaii λ3934 and Mgii λ2796 for all the absorbers are available inTable 4.
2.3 Data reduction
The UVES data were reduced using the new UVES CommonPipeline Language (CPL) pipeline from ESO. The Keck/HIRESbdata were reduced using the HIRedux software package1 bundled
1 http://www.ucolick.org/∼xavier/HIRedux/index.html

Caii absorber environments 3
Table 1. A summary of the observations taken with UVES during ESO Period 79 and HIRES for this work. We define the resolving power,R≡ ∆λ/λ, whereλ is the UVES dichroic central wavelength measured innm.
Object SDSS name g-band mag. zem zabs Dichroic R Total exposure time [s]
J0334−07111 SDSSJ033438.28−071149.0 17.25 0.635 0.59760 − 54000 2700J0846+0529 SDSSJ084650.44+052946.0 17.65 1.052 0.74294 390 54256 2930
564 54256 1465760 54256 1465
J0953+0801 SDSSJ095352.69+080103.6 17.89 1.720 1.02316 390 54240 2930437 54240 2930580 54240 2930760 54240 2930
J1005+1157 SDSSJ100523.73+115712.4 18.20 1.657 0.83460 390 54259 2930564 54259 2930
J1129+0204 SDSSJ112932.71+020422.7 17.65 1.193 0.96497 390 54260 2930437 54256 2930564 54260 2930760 54256 2930
J1203+1028 SDSSJ120342.24+102831.7 17.88 1.888 0.74630 390 54280 9805564 54313 4395760 54277 5411
J1430+0149 SDSSJ143040.83+014939.9 17.79 2.113 1.24180 437 54252 12147760 54252 12146
1 HIRESb target which used the C1 decker with FWHM∼7 km s−1 spectral resolution
Table 2. A summary of spectra taken from the ESO/UVES Science Archive for this work, with an indication of howthe data is used. Magnitudes are SDSSg-band values unless otherwise referenced. B1950 names are included for convenience.
Object α (J2000) δ (J2000) B1950 magnitude zem zabs Notes1
J0004−4157 00 04 48.07 -41 57 27.7 Q0002−4214 17.2 V2 2.760 0.83663 VJ0256+0110 02 56 07.24 +01 10 38.6 Q0253+0058 18.95 g 1.348 0.72578 VJ0407−4410 04 07 18.08 -44 10 14.6 Q0405−4418 17.6 B3 3.000 0.81841 VJ0517−4410 05 17 07.82 -44 10 55.4 Q0515−4414 14.9 V4 1.710 1.14955 V, D, AJ0830+2410 08 30 52.09 +24 10 59.8 Q0827+243 17.4 g 0.940 0.52477 VJ1028−0100 10 28 37.02 -01 00 27.6 Q1026−0045 17.2 g 1.531 0.63214 VJ1107+0048 11 07 29.04 +00 48 11.2 Q1104−0104 17.7 g 1.392 0.74030 V, DJ1130−1449 11 30 07.05 -14 49 27.4 Q1127−145 16.9 V2 1.184 0.31272 VJ1211+1030 12 11 40.60 +10 30 02.0 Q1209+1046 18.1 g 2.192 0.62962 VJ1232−0224 12 32 00.01 -02 24 04.3 Q1229−021 17.2 g 1.043 0.39544 VJ1323−0021 13 23 23.79 -00 21 55.3 Q1320−0006 18.5 g 1.388 0.71608 VJ2328+0022 23 28 20.37 +00 22 38.2 Q2325+0006 18.0 g 1.308 0.65200 V
1 Letters denote the following: (V)elocity structure analysis, (D)epletion profile analysis, (A)lpha enhancement analysis2 Rao, Turnshek & Nestor (2006)3 Maza et al. (1993)4 Reimers et al. (1998)
within the XIDL software package2. The algorithms calibrate, skysubtract and optimally extract the echelle orders of the spectrum(Bernstein, Burles & Prochaska 2008).
The individual orders and exposures were then air−vacuumand heliocentric corrected and combined usinguves popler.3 Dur-ing combination all spectra were rebinned to a 2.5 km s−1 pixelscale. Both instruments have FWHM (Full-Width Half-Maximum)∼7 km s−1 spectral resolution, thereby giving∼3 pixel sampling forunresolved features.
2 http://www.ucolick.org/∼xavier/IDL /index.html3uves popler is available from
http://www.astronomy.swin.edu.au/∼mmurphy/UVES popler.html
2.4 Analysis
The analysis of the final spectra involves two main approaches.Firstly, abundance profile analysis based on Voigt profile fits to thevarious ionic transitions4 in the absorber and secondly a compari-son of the velocity structure of these absorbers to data and modelsin the literature. The first approach allows us to make a quantitativeanalysis of chemical and dust-depletion uniformity and, inprinci-ple, chemical enrichment history via models of relative abundancesof α and Fe-peak elements. Unfortunately, the wavelength coverageand SNR of the spectra are not sufficient for a full decompositionof the star-formation history (e.g. Dessauges-Zavadsky etal. 2007).Nonetheless non-uniformity in theα enrichment and dust depletion
4 Transition wavelengths and oscillator strengths were taken fromMorton (2003).

4 B. J. Zych et al.
of the absorbers will provide clues as to the physical environmentof the absorbing gas (See Sections 3.2 & 4.2). Furthermore, theelectron density of the absorbing cloud can be constrained frommeasured limits from theN (Fei) /N (Feii) and N
(
Mgi)
/N(
Mgii)
ratios. The second approach involves study of the velocity profilesand widths of each absorber, allowing qualitative assessment of thephysical models able to explain the velocity structure of the gas,such as simple galaxy discs, haloes, inflows or outflows.
2.4.1 Column densities and equivalent widths
We usedvpfit5 to fit multiple velocity component Voigt profiles toeach unsaturated metal ion transition of interest in each absorber.The transitions of interest for our analysis were Feii, Mg i, Si ii,Zn ii, Cr ii, Mn ii, Ti ii and Aliii. An initial guess for the fit was con-structed from Feii as multiple Feii transitions at a variety of wave-lengths were usually observed, which allowsvpfit to constrain thevelocity structure more accurately. For the remaining transitions fit-ted, the redshifts and Doppler parameters,b, of individual compo-nents were tied to Feii (or Mg i λ2852 when Feii was unavailable),whilst column densities for each component were allowed to varyfreely. At the resolution and SNR of the spectra we saw no evi-dence for these transitions requiring independent redshifts andbparameters.
The total column densities were reported directly fromvpfit,which allows for a more accurate estimate of the formal errorbe-cause it alleviates the problem of blending between neighbouringcomponents, which produces degeneracies between column densi-ties andb parameters for those components (seevpfit documenta-tion). Upper limits were taken at 3σ using the error reported fromvpfit.
Both the Mgi λ2026 and Znii λ2026 and Znii λ2062 andCr ii λ2062 lines are usually blended due to the velocity width ofthe absorption system. Despite this blending the fits to these linesare not degenerate;vpfit simultaneously fits these lines, along withunblended lines such as Crii λ2056 and Mgiλ2852, using the pre-determined velocity structure. The spectra are always of sufficientwavelength coverage with high enough SNR for a non-degeneratefit to be reached. For example the Znii velocity structure mayappear uncertain if the absorption profile is sufficiently wide toblend together the Znii λ2026 and Mgi λ2026 profiles6 and alsothe Znii λ2062 and Crii λ2062 profiles. However, since the Crii ve-locity structure is independently determined by Crii λ2056 and/orCr ii λ2066, and since fitting the Mgi λ2852 profile determines theMg i λ2026 profile, the Znii velocity structure can be recovered re-liably.
When all transitions of a given ionic species are saturated (e.g.Mg ii) the column density of the species is unconstrained by Voigtprofile fitting. Instead, for Mgii λ2796, 2803 we measure the equiv-alent width of the profile, which gives an indication of the velocityspread in the absorber. The equivalent widths were calculated bysumming across each pixel,i, in the profile
W =∑
i
(1− fi)∆λi (1)
where fi is the normalised flux and∆λi is the width of theith pixel
5vpfit is available from http://www.ast.cam.ac.uk/∼rfc/vpfit.html.
6 Note that whilst Crii λ2026 also contributes to the flux decrement it isgenerally too weak to confuse the deblending process.
in rest-frame wavelength space. The associated errors are the for-mal errors in the sum and thus do not account for errors associatedwith continuum fitting.
2.4.2 Measuring velocity profile uniformity
The apparent optical depth (AOD) method, as first described bySavage & Sembach (1991), offered an alternative way of measur-ing the column densities of velocity components in an absorber tomore traditional Voigt profile analyses. The reader is referred toProchaska (2003) for a discussion of the merits of each technique.Prochaska (2003) conducted a velocity bin based analysis ofthechemical uniformitywithin DLAs by calculating the column den-sity in each velocity bin using the AOD method. Here we will usethe same technique to measure variation across the velocityprofileof the absorber in both dust depletion (via Zn and Cr) and chemicaluniformity (via Fe and Si) where possible. In particular we hopeto show whether the dust depletion profiles are relatively uniform,or whether the dust is concentrated in one or two velocity compo-nents as this may indicate the presence of molecular hydrogen inthe absorber (e.g. Ledoux et al. 2003).
Prochaska (2003) use unsaturated, unblended transitions suchas Fe and Si and convert the flux pixels to optical depth pixels, bin-ning the result in velocity space. These bins are not componentsin the traditional sense, but just velocity bins across the profile,as such they may contain one or more real velocity components.Nonetheless, if there is any non-uniformity across the absorptionprofile, it will still be reflected in the constructed velocity bins. Un-like Prochaska (2003) we will be applying this technique to blendedtransitions such as Znii and Crii. We circumvent the problem ofline blending by binning the Voigt profile fits to the data, ratherthan the spectra themselves. The error in each pixel is stilldrawnfrom the actual spectral error array. This technique utilises the factthat we have multiple transitions of each blended element, whicha straight-forward analysis of the data cannot account for.Usingthe error array corresponding to the flux in each pixel, rather thanadapting thevpfit code to return the error associated with each pixelin the fit, will not underestimate the real error too greatly.This as-sertion can be verified by applying the technique to transitions suchas Feii and Siii which do not suffer from blending. A further ad-vantage of using the Voigt profile fits to the spectra is that takingaccount of multiple transitions at different wavelengths makes thesubsequent analysis more resilient to changes in bin size. That is,the effect of Root Mean Square (RMS) fluctuations in the data ofan individual transition is reduced.
We will use 20 km s−1 bins for our analysis, corresponding toeight 2.5 km s−1 pixels per velocity bin; this gives reasonable SNRin each bin, whilst still providing enough bins to discuss the ab-sorbers’ depletion properties. In practice the size of the bin doesnot alter our conclusions as the component-to-component dust de-pletions are resilient to changes in bin size; binning mainly effectsthe error bars in our analysis. We also performed the same analysiswith the velocity bins offset by half a bin from the initial analysisto test whether the results were resilient to shifts in velocity space.We found this made no difference to our conclusions.
2.4.3 Electron densities
The electron density of the gas can be constrained by the relativecolumn densities of the neutral and singly ionised transitions ofan element (e.g. Prochaska et al. 2006). For instance, understeady

Caii absorber environments 5
state conditions and photoionization equilibrium the balance ofphotoionisation and recombination for Mgi and Mgii gives
ne =N(
Mgi)
N(
Mgii)
Γ(
Mgi)
α(
Mgii,T) (2)
where N are the measured column densities of the named tran-sitions, α
(
Mgii,T)
is the total recombination coefficient (radia-tive and dielectric) dependent on temperature, T, andΓ
(
Mgi)
=
Const. × σph(
Mgi)
× G/G0 represents the photoionisation rate ofMg i. σph
(
Mgi)
is cross-section to ionisation integrated over the in-cident radiation field andG0 = 2.72 × 10⁻³ erg cm−2 s−1 is 1.7×Habing’s constant (Habing 1968; Gondhalekar et al. 1980), wherethe factor of 1.7 is required to normaliseG to the value of theMilky Way UV radiation field strength. A similar relationshipcan be derived for Fei & Fe ii. Thus observations of the ratio ofthe column densities of a neutral and singly ionised speciescanconstrain the electron density,ne, for a given strength of radia-tion field, G/G0. See Prochaska et al. (2006) Section 4.2 & Ap-pendix for details of the calculations. For our analysis we use theFei λ2484, Feii λλ2260,2374, Mgi λ2852 and Mgii λ2803 transi-tions. Note that for the ionisation of Fei, Hi charge transfer candominate the transition, dependent on the exact ratio ofnHi tone (Kingdon & Ferland 1999). If Hi charge transfer does domi-nate then equation 2 will underestimate the true electron density.The results and conclusions drawn from observed limits on elec-tron densities are dominated by measurements of Mgi and Mgii(See Fig. 5). Thus, the increased uncertainty in measurements ofne
based on Fe due to Hi charge transfer will not effect any conclu-sions.
2.4.4 Constraints on absorber environment from velocity profiles
There have been extensive studies of the velocity profile structure inboth DLAs and Mgii absorbers. Early work focused on modelingDLAs as rotating discs of gas extending out from the associatedgalaxy (Steidel et al. 2002). Later, more complex models includ-ing hot and cold rotational components, haloes and spherical accre-tion (Prochaska & Wolfe 1997; Charlton & Churchill 1998) or out-flows, such as super-bubbles expanding out into the Inter-GalacticMedium (IGM) (Bond et al. 2001) were called upon to explainthe increasingly complex Mgii absorption profiles being observedand their sometimes highly symmetric velocity profiles. Given thepaucity of strong Caii absorbers we do not have a statistical sampleof absorbers required for a quantitative analysis, therefore we willrestrict ourselves to a qualitative comparison with modelsfrom theliterature. It will, nonetheless, be possible to place constraints onthe physical environment of these absorbers such as whethertheycan be reproduced using simple disc models, outflows, etc.
3 RESULTS
Voigt profile fits for each absorber are shown in Appendix A, whilstthe unfitted Mgii and Caii profiles are presented in Appendix B.
The measured column densities for all the absorbers in thesample are given in Table 3, whilst measured equivalent widthsof Mg ii and Caii and the velocity width, as measured by∆v90
(Prochaska & Wolfe 1997), are given in Table 4. The Caii transi-tion in J1203+1028 is contaminated by sky absorption, but becausethe absorption features are not flat bottomed (i.e. not all the flux isabsorbed) we are able to make a correction to theW3934
0 measure-ment for the sky absorption as follows. The first step was to find
Table 4. Equivalent width and∆v90 measurements from high resolutionspectra for each absorber in this work. The 1σ error in∆v90 is . 10 km s−1,which is dominated by uncertainty in continuum fitting. Where no high res-olution data exists the measurement from SDSS spectra are given in paren-theses when available.
Rest-frame equivalent width [Å]Object Mgii λ2796 Caii λ3934 ∆v90 [km s−1]
J0004−4157 4.424± 0.003 0.966± 0.005 400J0256+0110 3.27± 0.01 0.39± 0.041 350J0334−0711 3.49–4.652 (0.31± 0.05) 410J0407−4410 1.668± 0.002 0.282± 0.009 200J0517−4410 2.336± 0.002 0.346± 0.002 470J0830+2410 − 0.284± 0.007 190J0846+0529 2.22± 0.03 0.50± 0.03 160J0953+0801 0.468± 0.0083 0.34± 0.02 50J1005+1157 2.58± 0.02 (0.78± 0.08) 210J1028−0100 (1.47± 0.08) 0.29± 0.02 100J1107+0048 2.766± 0.009 0.34± 0.011 190J1129+0204 2.11± 0.01 0.69± 0.03 170J1130−1449 1.794± 0.007 0.374± 0.005 120J1203+1028 2.58± 0.02 0.630± 0.0064 270J1211+1030 − 0.24± 0.01 330J1232−0224 2.071± 0.005 0.203± 0.007 120J1323−0021 2.156± 0.009 0.82± 0.021 120J1430+0149 2.898± 0.009 0.30± 0.01 220J2328+0022 (1.98± 0.07) 0.250± 0.008 200
1 Reported measurement from Nestor et al. (2008)2 Velocity structure too complex to separate Mgii λ2796 and Mgii λ2803.Therefore we measured the total equivalent width over both lines and as-sumed doublet ratios of 1:1 and 2:1 to calculate the range of possibleW2796
0 .3 W2796
0 = 0.88±0.05 Å when measured in the SDSS DR4 spectrum of thisquasar, thus it is included in the sample.4 Corrected for sky absorption contamination, as discussed in Section 3, theassociated error only includes the formal statistical error and is therefore anunderestimate.
exposures with uncontaminated sky absorption of similar air-mass,date and time to the J1203+1028 exposures. For each uncontam-inated sky exposure the equivalent width of absorption due to thesky,Wsky, was measured. We then apply a correction to the match-ing exposure from J1203+1028 such that,W3934
real = W3934obs −Wsky,
whereW3934obs is measured across the same wavelength range asWsky.
The errors are propagated formally, so will not include any system-atic error such as that due to continuum fitting.
3.1 Depletions
3.1.1 Total depletions
The total column densities derived for Znii and Crii in Section 3were used to calculate the depletion level in each of the absorbers.In high NHi systems self-shielding ensures that the metallic ele-ments considered here are predominantly in the lowest ionizationstate with an ionization potential less than 13.6 eV. Thus we mayassume that the ratio ofNCrii/NZnii ∼ NCr/NZn, i.e. no correctionfor ionization is required. Measured [Cr/Zn] ratios are given in Ta-ble 5. Fig. 1 shows the depletion in each of the systems versusW3934
0 for each absorber. Included in the plot are the DLAs withknown Znii, Cr ii and Caii absorption from Nestor et al. (2008) andKhare et al. (2004). For comparison we show the mean values of[Cr/Zn] vs. W3934
0 measured statistically by WHP06 from SDSSquasar spectra with Caii absorbers. The highW3934
0 regime re-

6 B. J. Zych et al.
Table 3. The ionic total column densities measured for each absorberin this work. Upper limits are quoted at 3σ significance. Systematic errors due tocontinuum level and component fitting are estimated at 0.03 dex. Quoted errors include random and systematic contributions added in quadrature.
log N [atom cm−2]Object Caii Feii Mgi Znii Crii Siii Al iii Mnii Tiii
J0334 − 14.94± 0.04 12.84± 0.07 12.58± 0.09 13.19± 0.08 − − 12.65± 0.04 11.9± 0.1J0517 12.74± 0.03 14.31± 0.031 12.74± 0.03 12.22± 0.04 12.53± 0.06 14.77± 0.032 12.76± 0.03 12.21± 0.03 <10.6J0846 13.06± 0.06 15.21± 0.04 12.96± 0.05 <12.8 <13.4 − − 13.21± 0.06 13.00± 0.05J0953 13.57± 0.04 15.09± 0.04 13.24± 0.03 12.25± 0.06 13.17± 0.04 15.61± 0.07 15.31± 0.03 13.0± 0.7 12.1± 0.1J1005 − 15.30± 0.05 13.10± 0.03 <12.8 <13.3 − <13.5 13.03± 0.05 <12.4J1107 − 15.52± 0.03 13.00± 0.07 13.23± 0.04 13.83± 0.09 − − 13.37± 0.04 13.12± 0.03J1129 13.11± 0.04 15.35± 0.03 13.14± 0.093 12.80± 0.05 13.66± 0.04 16.0± 0.5 13.81± 0.09 13.13± 0.04 12.79± 0.04J1203 13.05± 0.03 14.83± 0.03 12.99± 0.03 12.63± 0.06 13.38± 0.05 − − 12.77± 0.05 <11.2J1430 12.85± 0.04 − 13.07± 0.05 12.94± 0.04 13.45± 0.04 15.75± 0.03 13.72± 0.03 − 12.79± 0.04
1 Feii measured over full∼ 800 km s−1 range of absorber.NFeii = 14.25± 0.03 over∼ 100 km s−1 region which other elements could be measured.2 Si ii constrained by simultaneous fit to Siii λ1526, 1808 and intervening Lyα forest.3 Mg i λ2852 not covered by spectrum. Mgi column density derived from residual from Znii and Crii profile fits.
Figure 1. [Cr/Zn] vs.W3934r for each of the absorbers. The black diamonds
show [Cr/Zn] measured in the UVES or HIRES spectra vs.W3934r measured
from the SDSS spectra. An indication of the typical error is shown at thecentre-top of the plot. The dashed grey regions show the average relationfound by WHP06. Other measurements of [Cr/Zn] for Caii absorbers inthe literature are shown as black squares and asterisks (Nestor et al. 2008;Khare et al. 2004). The horizontal dashed black line shows the level of solardepletion. The vertical dashed grey line shows theW3934
0 equivalent widthlimit of our sample selection.
mains relatively unexplored for measurements from high resolutionspectroscopy. Similarly, Fig. 2 shows [Cr/Zn] vs. redshift for theCaii absorbers with the compilation of measurements of [Cr/Zn]in DLAs given by Akerman et al. (2005) included for comparison.We note that the measurements from the observed Caii absorbersample seem consistent with those observed in other DLAs, beingneither particularly dusty nor dust-free. Performing a Kolmogorov-Smirnov (KS) test of the measured [Cr/Zn] ratios indicates an 87per cent likelihood that the Caii and DLA samples are drawn fromthe same underlying population.
Table 5 also shows several abundance ratios sensitive to dustdepletion. It is evident that the depletion properties of these ab-sorbers differ slightly from local measurements of the MW, LMCand SMC (Savage & Sembach 1996; Welty et al. 1999, 2001);whilst the [Zn/Fe] ratios in these Caii absorbers are similar to the
Figure 2. [Cr/Zn] vs. zabs for the DLAs from Akerman et al. (2005) andeach of the absorbers. The black diamonds show [Cr/Zn] measured in theUVES or HIRES spectra. The blue crosses show the DLA measurementsof [Cr/Zn] whilst the blue triangles show upper limits to the depletion. Thedashed black line shows the level of solar depletion.
warm halo phase in either the MW, LMC or SMC, the [Si/Zn] ratiosare∼ 0.5 dex higher than typically observed locally.
3.1.2 Depletion uniformity
Using the apparent optical depth method detailed in Section2.4.2,we calculate the variation in [Cr/Zn] across the velocity profile ineach absorber for which both Znii and Crii are detectable. The re-sults are shown in Fig. 3.
There is little evidence for any significant (> 0.3 dex) devia-tion from uniform depletion across the velocity profile in each ofthe absorbers, even for those absorbers with reasonably broad ve-locity profiles (> 50 km s−1; the exception is J0517−4410, to bediscussed later). It is not necessarily surprising that an absorberwith complex velocity structure might appear well mixed becausevelocity components do necessarily not reflect the spatial structureof the absorbing gas. 0.3 dex variation has 3σ significance at theSNRs of the spectra, thus the results in Fig. 3 restricts the range ofdust depletion models which may apply to these Caii absorbers. In

Caii absorber environments 7
Table 5. A table of abundance ratios in the absorber sample, relativeto solar, traditionally used for assessingdust-depletion and chemical enrichment history. Solar abundances are taken from Lodders (2003).
Object [Cr/Zn] [Mn/Fe] [Ti/Fe] [Zn/Fe] [Si/Fe] [Si/Zn] [Si/Ti]
J0334−0711 −0.4± 0.1 −0.33± 0.06 −0.5± 0.1 0.5± 0.1 − − −
J0517−44101 −0.71± 0.07 −0.08± 0.04 < −0.70 0.81± 0.05 0.44± 0.04 −0.36± 0.05 > 1.14J0846+0529 − −0.02± 0.07 0.35± 0.06 < 0.62 − − −
J0953+0801 −0.10± 0.08 −0.2± 0.7 −0.5± 0.1 0.00± 0.07 0.45± 0.08 0.45± 0.09 0.9± 0.1J1005+1157 − −0.30± 0.06 < −0.39 < 0.32 − − −
J1107+0048 −0.4± 0.1 −0.17± 0.06 0.17± 0.05 0.53± 0.06 − − −
J1129+0204 −0.16± 0.06 −0.26± 0.05 −0.01± 0.05 0.29± 0.06 0.5± 0.5 0.2± 0.5 0.5± 0.5J1203+1028 −0.27± 0.06 −0.08± 0.06 < −1.08 0.64± 0.07 − − −
J1430+0149 −0.51± 0.06 − − − − −0.11± 0.05 0.34± 0.05
1 Abundance ratios for this absorber based only on regions in velocity space where both transitions are de-tectable; in particular the Feii transitions cover a much broader region of velocity space than most other transi-tions.
many cases it is possible to restrict the variation to< 0.2 dex varia-tion in [Cr/Zn], i.e. there is no variation with significance> 2σ formost absorbers. See Section 4.1 for further discussion. We note thatthe velocity width of J0953+0801 is too narrow for any assessmentof variation across its profile with the bin size necessary for theanalysis (See Fig. 3(b)). In addition, the Mgiλ2026 contribution tothe flux decrement in the region of Znii λ2026 for J1129+0204 isuncertain. The uncertainty arises because the Mgi contribution tothe flux decrement in the blended part of the spectrum could notbe constrained from the Mgi λ2852 line, which is not observed.Instead the Mgi λ2026 line is constrained as the residual from fit-ting the Znii and Crii lines alone. As can be seen from Fig. 3(d),the variation in [Cr/Zn] traces regions with the most contamina-tion from Mgi. Hence, the possible signature of variation acrossthe J1129+0204 profile in Fig. 3(d) cannot be considered robust.
Fig. 3 presents two different velocity binnings, each with thesame bin size but offset from each other by 10 km s−1. The similar-ity between the two binnings shows that the analysis is resilient toshifts in the bin centres. Moderate changes, of order 10−20 km s−1,to the size of bins also has little effect on the results, other than al-tering the magnitude of the associated error bars.
J0517−4410 has substantial variation in [Cr/Zn] across its∼ 800 km s−1 profile. J0517−4410 is also a known sub-DLA witha high UV ionising field (Quast et al. 2008), thus much of the ob-served variation is likely due to differential ionisation of the gas,rather than being purely due to differential depletion of the gasonto dust grains. Most transitions are only detected in the central∼ 100 km s−1, the strongest part of the absorber, thus we will con-centrate our analysis in this region (See Fig. 3(c)). The advantageof restricting the analysis is that the gas may exhibit less variationdue to ionisation on smaller scales and over this velocity range theabsorption profile is relatively uniform, except for a few velocitybins near−25 km s−1, which exhibit∼ 0.3 dex (3σ significant) de-viation.
3.2 Chemical history
3.2.1 Enrichment history
We have detected bothα-capture elements and Fe-peak elementsin high resolution spectra of these Caii absorbers.α elements
such as Si, Ca and Ti7 are created by type II supernovae on atimescale of< 2 × 10⁷ yr after a star formation event, whereasthe Fe-peak elements are created by type Ia supernovae, which oc-cur on a timescale of 108 − 109 yr. Thus, the ratio ofα to Fe-peakelements can reveal something about the enrichment historyandprevious star-formation in the absorber (e.g. Wheeler et al. 1989;Dessauges-Zavadsky et al. 2007). Unfortunately the same elementratios are also affected by dust-depletion and disentangling the twoeffects is not trivial. However, if one observes enough differenttransitions it is possible to begin to separate the two effects (e.g.Herbert-Fort et al. 2006). Without a measurement of the metallicityof the absorber, a full deconstruction of the star-formation historyof the absorber is not possible. Therefore, we follow the exampleof Herbert-Fort et al. (2006), presenting various abundance ratioswhich are instrumental in constraining the effects of dust-depletionand enrichment history in Table 5.
The abundance ratios measured in the sample of Caii
absorbers are generally consistent with the DLA population(Prochaska et al. 2003). Furthermore, up to 0.33 dex variation isto be expected purely from differential dust depletion in the sam-ple, particularly for elements strongly affected by dust such as Ti(Savage & Sembach 1996; Dessauges-Zavadsky et al. 2006).
The Metal-Strong DLAs (MSDLAs) studied byHerbert-Fort et al. (2006) represent an unusual subset of DLAs andso we consider whether Caii absorbers overlap at all with these raresystems, as similarities between the populations may provide cluesas to the physical origin of the absorbers. To classify an absorberas a MSDLA, as defined by Herbert-Fort et al. (2006), requiresN (Znii) > 13.15 or N (Siii) > 15.95. Under this definition onlytwo of the absorbers (J1107+0048 and J1129+0204) marginallyclassify as MSDLAs. Similarly, Nestor et al. (2008) measurefiveof nine Caii absorbers to be MSDLAs, although they are also allmarginal cases. Therefore, with the caveat that the highestW3934
0systems remain unprobed, the two populations are obviouslynotidentical. Rather, it seems that the tail end of the Caiimetal columndensity distribution overlaps with the definition of MSDLAs. Ifsome strong Caii absorbers arise, not because of sputtering ofdust grains or weak ionisation backgrounds (see introductions of
7 Ti is not strictly speaking anα element, but it exhibits abundance pat-terns similar to otherα-elements in Galactic stars (Edvardsson et al. 1995;Francois et al. 2004).

8 B. J. Zych et al.
(a) The depletion profile across thez= 0.59760 absorber towards J0334−0711. (b) The depletion profile across thez = 1.02316 absorber towards J0953+0801.The velocity profile for this absorber is too narrow to measure variation in[Cr/Zn].
(c) The depletion profile across thez = 1.14955 absorber towards J0517−4410.There is evidence for significant variation,∼ 0.3 dex(3σ), in the absorber’s[Cr/Zn] profile, consistent with findings of previous works (e.g.Quast et al.2008).
(d) The depletion profile across thez = 0.96497 absorber towards J1129+0204.Mg i λ2852 was not observed so the profile fits for Znii and Crii are less certain,making it difficult to assess profile uniformity.
Figure 3. Each top panel shows the Crii λ2056 transition, each middle panel shows the blended Znii λ2026 and Mgi λ2026 transitions. The flux is shown asblack histograms, the continuum as a dashed line (blue) and the fit to the Crii or Znii transition is shown as a solid line (blue). The dashed line (red) throughthe data shows the combined fit to Mgi and Znii. Each bottom panel shows the value of [Cr/Zn] across the profile. The short-dashed line (blue) represents thesolar depletion level whilst the dot-dashed line (red) shows the total depletion measured in this absorber as referenced in Table 5 and Section 3.1.1. The blackpoints are one set of 20 km s−1 bins and the blue crosses are a different set of similarly sized bins, offset by 10 km s−1 from the first. The value ofχ2 given inthe top left-hand corner of the panel is theχ2 per degree of freedom for the fit of the red dot-dashed line to the black points. That is,χ2 represents how wellthe profile is fit by a single depletion value.
WHP06; Zych et al. 2007) but simply because of large columndensities of metals, this would be expected.
3.2.2 Chemical uniformity
Given the relative uniformity of the depletion profiles, as presentedin Section 3.1.2, any variation in the [Fe/α] ratio (whereα is anyα-capture element, such as Si, Ti or Ca) should be indicative ofchemical non-uniformity in the absorbers, rather than variation indust depletion. For the absorbers in our sample where we can mea-sure [Fe/α] the results are presented in Fig. 4. Even without metal-licity measures it is possible to see abundance variations across the
profile, which may indicate that different components of the gashave different enrichment histories. In the case that there is no sim-ilar variation in the [Cr/Zn] ratio at the same velocities then thevariation is most likely due toα-enhancement.
The use of the unsaturated, unblended Feii and Siii lines inthis analysis also allows us to test the validity of using thefit-ted absorption profile, rather than the data themselves, to calcu-late the blended [Cr/Zn] depletion profiles. We observe no signifi-cant≪ 0.1 dex difference to the derived [Fe/Si] ratios either whenanalysing the Voigt profiles fits or when analysing the data directly.
Only three absorbers have sufficient wavelength coverageto study their [Fe/Si] ratios and we comment on each in turn.J0953+0801 is not broad enough in velocity space to show signif-

Caii absorber environments 9
(e) The depletion profile across thez= 0.74030 absorber towards J1107+0048
(f) The depletion profile across thez= 0.74630 absorber towards J1203+1028. There is a blend with az= 1.322 Civ absorber at−110 and−130 km s−1.
(g) The depletion profile across thez= 1.24180 absorber towards J1430+0149. There is a blend with az= 1.933 Civ absorber at−120 km s−1.
Figure 3 – continued
icant variation across its profile. J1129+0204 shows a∼ 0.4 dex(3σ) deficit of Si toward the left hand side of its profile (SeeFig. 4(b)), however it has questionable significance; see discussionin Section 4.2. J0517−4410 also shows& 0.8 dex (8σ) variation inits [Fe/Si] profile, but this variation is mirrored by its [Cr/Zn] pro-
file (See Fig. 3(c)), which makes it likely the variation is a furthersignature of differential dust depletion, rather thanα enhancement.

10 B. J. Zych et al.
(a) The [Fe/Si] profile across thez= 1.02316 absorber towards J0953+0801. (b) The [Fe/Si] profile across thez= 0.74030 absorber towards J1129+0204.
(c) The [Fe/Si] profile across thez = 1.14955 absorbers towards J0517−4410.Note that the leftmost velocity feature seems to have a different chemical historyto the rest of the profile. Given the [Cr/Zn] profile (see Fig. 3(c)) shows similarvariation, the [Fe/Si] variation is likely an effect of dust depletion, rather thandifferential enrichment history.
Figure 4. Each top panel shows the Feii λ2250 transition, each middle panel shows the Siii λ1808 transition. The flux is shown as black histograms, thecontinuum as a dashed line (blue) and the fit to the Feii or Siii transition is shown as a solid line (blue). Each bottom panelshows the value of [Fe/Si] acrossthe profile. The short-dashed line (blue) represents the solar abundance ratio whilst the dot-dashed line (red) shows the total abundance ratio measured in thisabsorber as referenced in Table 5 and Section 3.2. The black points are one set of 20 km s−1 bins and the blue crosses are a different set of similarly sized bins,offset by 10 km s−1 from the first. The value ofχ2 given in the top left-hand corner of the panel is theχ2 per degree of freedom for the fit of the red dot-dashedline to the black points. That is,χ2 represents how well fit the profile is by a single abundance ratio value. This absorption profile is too narrow to assess anysignature of chemical non-uniformity.
3.3 Electron densities
Given the wavelength coverage of the spectra in our sample,there are two sets of transitions which can be used to con-strain the electron density in each of our absorbers: Feiλ2484 &Feii λλ2260, 2374 and Mgiλ2852 & Mgii λ2803. It is not possibleto measure an exact ratio for either set of transitions, justlimits.Fei is not detected at the SNR of the spectra, thus the measuredN (Fei)/N (Feii) ratio is an upper limit. Mgii is saturated, thus themeasuredN
(
Mgi)
/N(
Mgii)
ratio is also an upper limit. Both ratiosare derived using column densities measured via the AOD method(See Table 6 for results).
Using the AOD method ensures that the column densities foreach transition are measured over the same velocity range, provid-
ing robust limits. For saturated pixels a minimum normalised flux isassumed of 0.05 orσ (flux) /5, whichever is greater; this providesa conservative lower limit to the optical depth. For each absorberwe derive the productne (G/G0)
−1 using a conservative estimatefor the temperature,T = 8000 K, which maximises the recombina-tion rates. Fig. 5 showsne (G/G0)
−1 versusW39340 for each absorber.
We take the limit from Fe or Mg, whichever provides the greatestconstraint onne in each case. Fig. 5 indicates thatne < 0.1 cm−3
in Caii absorbers if we assumeG/G0 ∼ 1, as in the Milky Way.Thus, Caii absorbers are not comprised of extremely dense mate-rial sincenH ∼ 1 atom cm−3, unless the gas is extremely neutral(nH+/nH . 0.01). Here we assume that the free electrons balancethe ionized hydrogen,ne/ (nH+/nH) = nH.

Caii absorber environments 11
Figure 6. The velocity structure in each of the absorbers, as represented by an unsaturated, unblended absorption line, identified in the top right-hand cornerof each plot. The absorber’s quasar is identified in the top left-hand corner of each plot. The black histograms are the data and the red histograms are the error,whilst the continuum is the green short-dashed line. For thehighly complex absorbers towards J0334−0711 and J0517−4410 we show a second transition witha different f -value in grey to reveal more of the structure.
3.4 Absorber environment
As detailed in Section 2.4.4, modelling absorbers as rotation discsor outflows, etc. allows us to predict the velocity structureof suchgas. Thus, it is possible to constrain the physical environment ofthe absorber by ruling out mechanisms which cannot reproduceobserved velocity structures. The velocity profiles of the Caii ab-sorbers are shown in Fig. 6. Here we present any unsaturated tran-sition with high SNR, such as Mgi λ2852 or Feii λ2374 from eachabsorber for comparison. There are a wide range of different pro-files associated with Caii absorbers, so it is unlikely that a single
physical process gives rise to the strong absorption; see Section 4.4for further discussion.
4 DISCUSSION
4.1 Depletions
The Caii absorbers observed appear to have very similar deple-tion properties to the general DLA population (See Fig. 2). Whilstthis similarity may at first seem contrary to the results of WHP06,

12 B. J. Zych et al.
Table 6. The column density ratios of neutral-to-singly ionised species inthe Caii absorber sample.
Object N (Fei)/N (Feii) N(
Mgi)
/N(
Mgii)
J0004−4157 <0.0004 <0.0003J0256+0110 <0.0008 <0.0012J0334−0711 − <0.0018J0407−4410 <0.0003 <0.0008J0517−4410 <0.0007 <0.0003J0830+2410 <0.0010 −
J0846+0529 <0.0041 <0.0103J0953+0801 <0.0013 <0.2063J1005+1157 − <0.0037J1028−0100 <0.0018 −
J1107+0048 <0.0009 <0.0013J1129+0204 <0.0005 −
J1130−1449 <0.0007 <0.0016J1203+1028 <0.0159 <0.0023J1211+1030 <0.0009 −
J1232−0224 <0.0029 <0.0017J1323−0021 <0.0006 <0.0088J1430+0149 − <0.0015J2328+0022 <0.0011 <0.0017
Figure 5. Upper limits on the product of the electron densityne and thenear-UV radiation fieldG scaled to 1.7× Habing’s constantG0 = 2.72×10⁻³ erg cm−2 s−1, which roughly corresponds to the Galactic far-UV in-tensity (Habing 1968; Gondhalekar et al. 1980). The limits are establishedby our observed upper limits to theN (Fei)/N (Feii) andN
(
Mgi)
/N(
Mgii)
ratios under the conservative assumption that the electrontemperature isTe = 8000K. Limits based on Mg are black, whilst those based on Fe aregrey. The results indicate the Caii absorbers are not comprised of extremelydense material.
who find Caii absorbers to be amongst the most dusty absorbersknown, Fig. 1 shows the results are consistent. Our observationsonly probed the lowerW3934
0 regime, which WHP06 find have muchsmaller levels of depletion. The distribution of points in Fig. 1 maysuggest that the average depletions measured by WHP06 definealower envelope to the dust depletions of Caii absorbers, rather thana simple linear correlation. That is, lowW3934
0 absorbers may com-prise both weakly and strongly dust depleted systems, whilehighW3934
0 absorbers may all be strongly dust depleted. Such a situationmay point to two distinct mechanisms producing Caii absorbers.
The seven Caii absorbers for which we were able to measure
the dust depletion properties across the velocity profile have varia-tion . 0.3 dex (corresponding to 3σ) in [Cr/Zn]. Once again, thesedust depletion properties are consistent with results fromthe gen-eral DLA population (Prochaska 2003). Given the uniformityofthe dust depletion it is unlikely that any of these absorbersharbourmolecular hydrogen since we would expect the dust depletionto beconcentrated into one or two components (Ledoux et al. 2003).
J0517−4410 is exceptional in its depletion variation, evidentin both the [Cr/Zn] and [Fe/Si] profiles (See Figs. 3(c) & 4(c)).Molecular hydrogen has been detected in this absorber atz =1.15079 and 1.15085 (Reimers et al. 2003), which matches withthe velocity bins exhibiting increased dust depletion. Note that nar-row Ci absorption lines have also been detected at the same red-shifts (Levshakov et al. 2006). It is possible that H2 traces theseneutral components, rather than dust as measured using Znii andCr ii. Given that the AOD velocity bins would smear out the de-pletion signature, particularly in very narrow, cold components, theaccuracy with which [Cr/Zn] traces H2 or Ci cannot be assessedmore precisely here. The abundance ratios from our analysisofJ0517−4410 agree with the more detailed analysis of Quast et al.(2008). The abundance ratios relative to Zn in this absorbermatchvery closely the SMC abundances towards Sk 155 (group A) whichare consistent with MW halo cloud abundance ratios (Welty etal.2001), except for [Si/Zn] ∼ −0.36 dex and [Ti/Zn] < −1.9, whichare somewhat depleted. The significance of these differences is dif-ficult to determine because analysis of the [Si/S] ratio along the lineof sight to Sk 155 has shown that Si is more depleted toward Sk 155than was apparent (Sofia et al. 2006).
The lack of evidence for molecular hydrogen from non-uniform dust depletion is seemingly at odds with the recent re-sults from Nestor et al. (2008) who use photo-ionisation model-ing to show that Caii absorbers probably have total gas densi-ties > 1 atom cm−3 – the regime where we would expect molec-ular hydrogen to be present (Srianand et al. 2005). There is tenta-tive evidence that strongerW3934
0 systems should have larger totalgas densities (Nestor et al. 2008), therefore the results presentedhere may just reflect the fact we have only probed the lowerW3934
0regime and that it is the strongerW3934
0 systems which are associ-ated with molecular hydrogen. Another possibility is that we needto reassess some of the assumptions in the photo-ionisationmodel-ing of Nestor et al. (2008). For instance Nestor et al. (2008)assumethat the UV radiation field in the vicinity of their absorbersis simi-lar to that of the solar neighbourhood; perhaps a more general rangeof UV fields needs to be considered (see Section 4.3).
4.2 Chemical history
Detailed analysis of the star formation history in Caii absorbers isnot appropriate given the limitations of the spectra; a wider rangeof transitions, both Fe-peak andα elements, spanning a range ofionisation potentials, as well as observations of the Hi column den-sity to measure metallicities are required to conduct a fullanal-ysis of the star formation history. It is, nonetheless, possible touse the [α/Fe] ratio across the velocity profile to infer whetherthe gas in the absorber has multiple star-formation histories. Onlytwo absorbers, J1129+0204 and J0517−4410, showed any varia-tion in [Si/Fe]& 0.3 dex (3σ significance) across their profiles (seeFigs. 4(b) & 4(c)). Given that dust depletion can also cause vari-ation in [Si/Fe] as well as differential enrichment history it is im-portant to compare the [Si/Fe] and [Cr/Zn] profiles to break thisdegeneracy.
Recall that the dust depletion profile of J1129+0204

Caii absorber environments 13
(Fig. 3(d)) has∼ 1σ significant variations at the velocities wherethe [Fe/Si] profile has∼ 3σ significant deviation at−25 km s−1.It appears that the components from−100 to−25 km s−1 may beoffset in [Fe/Si] from the components from−5 to 110 km s−1. Theapparent deviation is not significant given the a posteriorinatureof the statistic. Only higher SNR data where all the individual binsbetween−100 and−25 km s−1 are> 3σ from the mean can con-firm whether this deviation is real. Such a deviation would beofinterest because it is indicative of the gas having different star-formation histories. Possible explanations would includethat theabsorbing gas arises from the merging of two galaxies with differ-ent star-formation histories. Or we could be observing chemical in-homogeneities within a single galaxy; certainly our own Milky Wayis observed to have variations inα-enhancement (e.g. Cunha et al.2007). Alternatively, we could be witnessing the building blocks ofa galaxy coming together atz ∼ 1. Such assessment must wait forhigher SNR data however.
The [Fe/Si] profile for J0517−4410 has& 0.8 dex (8σ) devia-tion near−25 km s−1 from an otherwise relatively uniform profile.Note, however, that a similar∼ 0.3 dex (3σ) deviation is seen inthe [Cr/Zn] profile. Thus it is likely that this is purely a signatureof dust depletion, rather thanα-enhancement in the absorber. Notethat J0517−4410 is a sub-DLA with a strong ionising background(Quast et al. 2008) thus it is possible thatNFeii/NSiii , NFe/NSi andsome of the observed deviation in [Fe/Si] and [Cr/Zn] could be dueto variable ionisation. In addition, the trend in [Fe/Si] with N (Siii)follows what one would expect if photo-ionisation were causing thevariation. Nonetheless, across the region we have analysedhere, thefraction of highly ionised to lowly ionised gas appears relativelyconstant (Quast et al. 2008, on-line material), thus it is likely thevariation is due to dust depletion, rather than ionisation.This argu-ment is strengthened by the fact that molecular hydrogen andC iare detected at the same velocities (See Section 4.1).
4.3 Electron densities
In Section 3.3 we show that the Caii absorbers in our sample havene < 0.1 cm−3. This relies on the assumption that the radiation fieldin these absorbers is similar to or weaker than the radiationfieldof the Milky Way. Whilst in a few cases the radiation field may begreater than this, it seems unlikely to be the case in most absorbersas a stronger radiation field would lead to more highly ionized gas,thus this remains a robust upper limit. Note that the extragalacticUV background is about 10× weaker in the far UV than the Galac-tic value (Sujatha et al. 2008) thus absorbers experiencingstrongUV radiation fields must be associated with galaxies emitting a lotof energy in the far UV.
The electron densities and gas densities derived in Sec-tion 3.3 are within the range predicted by Nestor et al. (2008).Srianand et al. (2005) find molecular hydrogen to be associatedwith absorbers whose gas densities arenH & 1 atom cm−3, whichis similar to the probable gas densities in the Caii absorber sam-ple derived in Section 3.3,nH ∼ 1 atom cm−3. Fig. 5 provides lit-tle evidence for greater gas densities at strongerW3934
0 , as found byNestor et al. (2008). However, we can only place limits onne, ratherthan direct measurements so a detailed comparison is not possi-ble. For instance, if strongerW3934
0 absorbers preferentially arise instronger radiation fields for a given ionisation fraction, then Fig. 5would imply greaternH at higherW3934
0 .Three absorbers in our sample, those towards J0256+0110,
J1107+0048 and J1323−0021, overlap with the absorbers mod-elled by Nestor et al. (2008). Thecloudy models predict spe-
cific electron densities for each absorber: 0.050, 0.035, and0.058 cm−3 for J0256+0110, J1107+0048 and J1323−0021, re-spectively (D. B. Nestor, private communication). Combining theelectron densities measured by Nestor et al. with the limitsonne (G/G0)
−1 derived in this paper we place lower limits on the radi-ation field strengths of 2.6×, 1.6× and 0.5× (G/G0) in the absorberstowards J0256+0110, J1107+0048 and J1323−0021, respectively.Further measurements would be required to comment on whetherthere is a trend withW3934
0 and radiation field strength, though it isinteresting to note that the weakest field is associated withthe ab-sorber with the highestW3934
0 of the three. Note that these are onlyrough estimates of the field strength as the electron densities mea-sured by Nestor et al. depend on the strength of the radiationfieldused in thecloudy modelling. That is, running thecloudy modelsagain with a different value forG/G0 will result in a different valueof ne returned from the model, which in turn will lead to a newdetermination ofG/G0.
Generally Mg places stronger constraints onne than Fe inthe spectra and, in any case, all the constraints are limits,so it isdifficult to compare them with the measurements of Nestor et al.(2008). Constrainingne and hencenH more accurately might beachieved by spectral observations of the Cii∗ and Siii∗ fine structurelines. However, note that these transitions constrainne more tightlyif the gas is predominantly ionised (Prochaska 1999). Higher ion-isation state lines such as Civ, may arise in distinct regions andtherefore not bear too directly on the Caii absorbing gas.
4.4 Environment
Velocity structure by itself gives us limited insight into the truephysical environments hosting Caii absorption as we can repro-duce the velocity profiles of all absorbers via various models inthe literature (Recall Section 2.4.4). A further consequence of suchmodels is that it is possible for multiple physical processes to pro-duce similar velocity profiles. It is even possible to take a patho-logical line of sight through an outflow or inflow to reproducewhatlooks like a simple disc profile (e.g. Charlton & Churchill 1998).However, it is not possible for a pure disc model to reproducean outflow-like profile because not enough high-velocity compo-nents are recovered from the model (e.g. Kacprzak et al. 2008). Ata cursory glance it seems that the Caii absorber sample has muchgreater velocity widths than the general DLA population; that is,they are less disk-like than general DLAs. Taking a sample of95DLAs with z > 1.6 based on observations from ESI8, HIRES andUVES as described in Prochaska et al. (2003) we can measure theirvelocity widths using∆v90, as described by Prochaska & Wolfe(1997). We find that the median velocity width of such as sam-ple is〈∆v〉DLA
≃ 75 km s−1, whereas the Caii absorber sample pre-sented here has a median velocity width,〈∆v〉Caii ≃ 200 km s−1 (SeeTable 4 for∆v90 measurements). Although we made no consciousdecision to select high velocity width absorbers the Caii sampleis, in fact, biased due to the limit of detecting a 0.2 Å equivalentwidth feature at 4σ significance in SDSS spectra. The exact ve-locity cut this implies depends on the depth of the Caii absorptionand because we do not have this information for the DLA sam-ple it is non-trivial to apply a cut to those data. For instance, a0.6 Å equivalent width feature in a spectrum with SNR∼ 20, wouldrequire∆v90 ∼ 120 km s−1 to be detectable. Furthermore, if one
8 Echelle Spectrograph and Imager on the Keck-II telescope inHawaii

14 B. J. Zych et al.
Figure 7. The measured∆v90 distribution for the DLA sample ofProchaska et al. (2003), shown as the black histogram. The∆v90 distribu-tion for our sample of Caii absorbers is also shown as the hashed-grey his-togram. The number of observed Caii absorbers is too small for a meaning-ful statistical comparison of the two populations. Given theW3934
0 detectionlimit for Ca ii absorbers implies a cut in∆v90, the two absorber populationscould have the same intrinsic∆v90 distributions. The approximate cut im-plied in∆v90 at 150 km s−1 is shown as a dotted vertical line (See discussionin Section 4.4).
compares the distribution of∆v90 measurements of the two sam-ples (See Fig. 7) it is evident that the number of DLAs dramaticallyincreases at∆v90 . 120 km s−1. Given theW3934
0 detection limit forCaii absorbers implies a cut in∆v90 and the small sample size, thetwo absorber populations could have the same intrinsic∆v90 dis-tributions. Above 150 km s−1, where velocity-selection effects areless important, there is a 78 per cent chance the two∆v90 distribu-tions are drawn from the same underlying distribution, based on aKS-test.
Note that the selection criterion,W27960 > 0.5 Å implies a ve-
locity cut on the Caii sample. If we conservatively assume that theMg ii absorption is completely saturated, then the minimum veloc-ity width is ∆v90 ∼ 50 km s−1, for our SDSS selected sample. OurCaii absorber sample includes systems down to this limit. This se-lection effect will not be as important as the selection effect due totheW3934
0 limit of any larger sample studied in the future becausethe bulk of DLAs observed have∆v90 greater than 50 km s−1.
Irrespective of velocity-selection effects, it is clear there are amixture of narrow and wide velocity profiles in the Caii absorbersample (See Fig 6). The above result is suggestive that strong Caiiabsorbers consist of two populations, one which is due to a line-of-sight passing at low impact parameter through a quiescent galaxydisc and the other due to a line-of-sight passing through a complexoutflow, merger or galaxy cluster. As a further point, Caii absorp-tion has been detected in many High Velocity Clouds (HVCs) inthe Milky Way (e.g. Welty et al. 1996; Ben Bekhti et al. 2008).Ifone modelled a galaxy as a disc+ HVCs, one would still not beable to reproduce the high velocity components of the extragalacticCaii absorbers because theW3934
0 of HVCs are too small.Simulations of DLAs in a cosmological setting (e.g.
Pontzen et al. 2008) significantly under-predict the relative num-ber of complex absorber profiles compared to simple disc-like pro-files, suggesting that we do not fully understand the relative impor-tance of different physical mechanisms for producing absorbers.Nonetheless, most, if not all, Caii absorbers studied here arenot
simple disc-like systems as their Feii absorption line profiles aretoo complex (See Fig. 6).
5 CONCLUSIONS
In this work we present the first high resolution study of Caii-selected absorption systems, using spectra from the UVES andHIRES echelle spectrographs. We divided our analysis into threeparts, examining the properties of dust,α-enhancement and envi-ronment of the absorbers in turn, finding the following:
(i) We demonstrate for the first time the feasibility of usingAOD methods on blended absorption profiles, such as Znii λ2062and Crii λ2062, by utilising the Voigt profile fits, rather than theflux, which enables the assessment of velocity profile uniformity.We find, as previous authors (e.g. Prochaska 2003), that the AODmethod is robust against binning size and positioning. Furthermore,we show there is little difference in applying the AOD to the fluxescompared to an absorption profile fit to the spectra, thus allowing usto use the method on blended lines. The Voigt profile AOD methodallows us to combine the power of the more traditional Voigt profilefitting and the AOD methods when studying the absorber.
(ii) From a study of dust depletion across the absorber profile us-ing the Znii and Crii transitions we conclude that the depletion inthese absorbers is uniform at the 0.3 dex level, which correspondsto deviations< 3σ in relative abundances at the SNR of the spec-tra. It is, therefore, unlikely that these absorbers harbour molecularhydrogen, as when H2 is present the depletion is concentrated inone or two velocity components. The absorbers studied here havelow W3934
0
(
< 0.7 Å)
, thus higherW39340 absorbers may still trace H2.
These results are consistent with Nestor et al. (2008), whose photo-ionisation modeling implied that only highW3934
0 Caii absorbersshould be associated with molecular hydrogen. If echelle observa-tions of higherW3934
0 systems fail to show evidence for molecularhydrogen then it may be necessary to reevaluate the assumptionsbehind the modeling of Nestor et al. (2008), such as the strength ofthe ionising UV background and the assumption of solar abundanceratios.
(iii) J0517−4410 stands out from the remainder of the absorbersample, exhibiting variation in dust depletion which may map tothe detection of molecular hydrogen or Ci in this absorber. Thedisadvantage of the AOD method is that binning in velocity spacesmears out the signal of dust depletion, precluding identification ofthe velocity components responsible. Thus it may be that thenar-row Ci and H2 lines occur at the same velocities, whilst the broaderZn ii and Crii lines do not correspond to the same gas. Narrow com-ponents of Znii or Crii would be hidden by the broader absorptionprofile, so even a detailed Voigt profile analysis of this absorberwould not illuminate the situation further. Furthermore, ionizationeffects on the measured variation in dust depletion across the profilemay be important (Quast et al. 2008).
(iv) There are only a few systems where we can study the chem-ical uniformity of the absorbers by examining their [Fe/Si] ratios.J1129+0204 shows∼ 0.3 dex (3σ significance) variation in its[Fe/Si] profile that is unlikely be explained by variable dust de-pletion, though at the SNR of the data this cannot be certain.
(v) The Caii absorbers studied here are not comprised of ex-tremely dense material. Assuming a Milky Way-like radiation fieldthere electron densities are,ne < 0.1 cm−3. Thus, unless the gasis very neutral (nH+/nH . 0.01), nH ∼ 1 atom cm−3. Comparingthe three absorbers which overlap between our sample and that ofNestor et al. (2008), we find a range of UV radiation field strengths
Caii absorber environments 15
are likely in these Caii absorbers, from 0.5× to 2.6× the meanGalactic field strength.
(vi) We conclude that most, if not all, Caii absorbers studiedhere arenot simple disc-like systems because they have complex,broad velocity profiles. Simulations only partially constrain the as-trophysics of the observed velocity profiles of absorbers asmultiplemechanisms can produce similar velocity profiles.
Whilst this work offers the first opportunity to examine Caiiabsorbers at high resolution, many questions as to the origin ofthese rare absorbers and the environments of their host galaxiesremain unanswered. For further ground to be made in our under-standing of Caii absorption systems, future studies will requireechelle observations of larger samples, including the, as yet un-probed, higherW3934
0 systems as well as host galaxy Integral FieldUnit (IFU) observations.
ACKNOWLEDGMENTS
BJZ is supported by the UK Science and Technology FacilitiesCouncil (STFC, formerly PPARC). BJZ thanks the Centre for As-trophysics & Supercomputing, Swinburne University of Technol-ogy, Melbourne for their support during his visit. MTM thanksthe Australian Research Council for a QEII Research Fellowship(DP0877998). PCH acknowledges support from the STFC-fundedGalaxy Formation and Evolution programme at the Institute of As-tronomy. JXP acknowledges funding through an NSF CAREERgrant (AST-0548180) and NSF grant (AST-0709235). Thanks toBob Carswell (RFC), Gary Ferland, Daniel Nestor and Max Pettini(MP) for useful discussion. Thanks also to RFC for aid withvpfitand MP for the DLA depletions data for Fig. 2.
We thank our anonymous referee for helpful feedback, whichimproved the flow and consistency of the paper.
This work was based on observations collected at the Euro-pean Southern Observatory, Chile, as part of program 79.A-0656and from data in the ESO Science Archive.
Some of the data presented herein were obtained at the W.M.Keck Observatory, which is operated as a scientific partnershipamong the California Institute of Technology, the University ofCalifornia and the National Aeronautics and Space Administration.The Observatory was made possible by the generous financial sup-port of the W.M. Keck Foundation. The authors wish to recognizeand acknowledge the very significant cultural role and reverencethat the summit of Mauna Kea has always had within the indige-nous Hawaiian community. We are most fortunate to have the op-portunity to conduct observations from this mountain.
Funding for the SDSS and SDSS-II has been provided bythe Alfred P. Sloan Foundation, the Participating Institutions, theNational Science Foundation, the U.S. Department of Energy,the National Aeronautics and Space Administration, the JapaneseMonbukagakusho, the Max Planck Society, and the Higher Ed-ucation Funding Council for England. The SDSS Web Site ishttp://www.sdss.org/.
REFERENCES
Akerman C. J., Ellison S. L., Pettini M., Steidel C. C., 2005,A&A, 440,499
Ben Bekhti N., Richter P., Westmeier T., Murphy M. T., 2008,ArXiv:0806.3204
Bernstein R., Burles S., Prochaska J. X., 2008, in prep.
Bond N. A., Churchill C. W., Charlton J. C., Vogt S. S., 2001, ApJ, 557,761
Charlton J. C., Churchill C. W., 1998, ApJ, 499, 181Chen H.-W., Kennicutt Jr. R. C., Rauch M., 2005, ApJ, 620, 703Cunha K., Smith V., Sellgren K., Blum R., Ramirez S., Terndrup D., 2007,
ArXiv:0710.0866Dessauges-Zavadsky M., Calura F., Prochaska J. X., D’Odorico S., Mat-
teucci F., 2007, A&A, 470, 431Dessauges-Zavadsky M., Prochaska J. X., D’Odorico S., Calura F., Mat-
teucci F., 2006, A&A, 445, 93Edvardsson B., Pettersson B., Kharrazi M., Westerlund B., 1995, A&A,
293, 75Ellison S. L., Hall P. B., Lira P., 2005, AJ, 130, 1345Ellison S. L., Yan L., Hook I. M., Pettini M., Wall J. V., Shaver P., 2001,
A&A, 379, 393Francois P., Matteucci F., Cayrel R., Spite M., Spite F., Chiappini C., 2004,
A&A, 421, 613Gondhalekar P. M., Phillips A. P., Wilson R., 1980, A&A, 85, 272Habing H. J., 1968, Bull. Astron. Inst. Netherlands, 19, 421Herbert-Fort S., Prochaska J. X., Dessauges-Zavadsky M., Ellison S. L.,
Howk J. C., Wolfe A. M., Prochter G. E., 2006, PASP, 118, 1077Kacprzak G. G., Churchill C. W., Steidel C. C., Murphy M. T., 2008, AJ,
135, 922Khare P., Kulkarni V. P., Lauroesch J. T., York D. G., Crotts A. P. S., Naka-
mura O., 2004, ApJ, 616, 86Kingdon J. B., Ferland G. J., 1999, ApJ, 516, L107Ledoux C., Petitjean P., Srianand R., 2003, MNRAS, 346, 209Levshakov S. A., Centurion M., Molaro P., Kostina M. V., 2006, A&A, 447,
L21Lodders K., 2003, ApJ, 591, 1220Maza J., Ruiz M. T., Gonzalez L. E., Wischnjewsky M., Antezana R., 1993,
Revista Mexicana de Astronomia y Astrofisica, 25, 51Morton D. C., 2003, ApJs, 149, 205Murphy M. T., Liske J., 2004, MNRAS, 354, L31Nestor D. B., Pettini M., Hewett P. C., Rao S., Wild V., 2008, MNRAS,
submittedPontzen A. et al., 2008, ArXiv:0804.4474Prochaska J. X., 1999, ApJl, 511, L71Prochaska J. X., 2003, ApJ, 582, 49Prochaska J. X., Chen H.-W., Bloom J. S., 2006, ApJ, 648, 95Prochaska J. X., Gawiser E., Wolfe A. M., Cooke J., Gelino D.,2003, ApJs,
147, 227Prochaska J. X., Wolfe A. M., 1997, ApJ, 487, 73Quast R., Reimers D., Baade R., 2008, A&A, 477, 443Rao S. M., Turnshek D. A., 2000, ApJs, 130, 1Rao S. M., Turnshek D. A., Nestor D. B., 2006, ApJ, 636, 610Reimers D., Baade R., Quast R., Levshakov S. A., 2003, A&A, 410, 785Reimers D., Hagen H.-J., Rodriguez-Pascual P., Wisotzki L., 1998, A&A,
334, 96Savage B. D., Sembach K. R., 1991, ApJ, 379, 245Savage B. D., Sembach K. R., 1996, ARA&A, 34, 279Sofia U. J., Gordon K. D., Clayton G. C., Misselt K., Wolff M. J., Cox
N. L. J., Ehrenfreund P., 2006, ApJ, 636, 753Srianand R., Petitjean P., Ledoux C., Ferland G., Shaw G., 2005, MNRAS,
362, 549Steidel C. C., Kollmeier J. A., Shapley A. E., Churchill C. W., Dickinson
M., Pettini M., 2002, ApJ, 570, 526Sujatha N. V., Murthy J., Karnataki A., Conn Henry R., Bianchi L., 2008,
ArXiv:0807.0189Vladilo G., Prochaska J. X., Wolfe A. M., 2008, A&A, 478, 701Vogt S. S. et al., 1994, Proc. SPIE Instrumentation in Astronomy VIII, 2198,
362Welty D. E., Frisch P. C., Sonneborn G., York D. G., 1999, ApJ,512, 636Welty D. E., Lauroesch J. T., Blades J. C., Hobbs L. M., York D.G., 2001,
ApJl, 554, L75Welty D. E., Morton D. C., Hobbs L. M., 1996, ApJs, 106, 533Wheeler J. C., Sneden C., Truran Jr. J. W., 1989, ARA&A, 27, 279Wild V., Hewett P. C., 2005, MNRAS, 361, L30
16 B. J. Zych et al.
Wild V., Hewett P. C., Pettini M., 2006, MNRAS, 367, 211 (WHP06)Wild V., Hewett P. C., Pettini M., 2007, MNRAS, 374, 292Wolfe A. M., 1993, in Akerlof C. W., Srednicki M. A., eds, New York
Academy Sciences Annals Vol. 688, Texas/PASCOS ’92: RelativisticAstrophysics and Particle Cosmology. p. 281
Wolfe A. M., Chen H.-W., 2006, ApJ, 652, 981Wolfe A. M., Gawiser E., Prochaska J. X., 2005, ARA&A, 43, 861Wolfe A. M., Prochaska J. X., Gawiser E., 2003, ApJ, 593, 215York D. G. et al., 2006, MNRAS, 367, 945Zych B. J., Murphy M. T., Pettini M., Hewett P. C., Ryan-WeberE. V.,
Ellison S. L., 2007, MNRAS, 379, 1409
APPENDIX A: ABSORBER VOIGT PROFILE FITS
Here we present the Voigt profile fits to our absorption profiles forthe absorbers and species listed in Table 3.
APPENDIX B: UNFITTED DATA
Here we present the Mgii absorption line profiles which were notfitted (See Fig. B1). We also collate the observed Caii profiles intoone figure as a comparative aid (See Fig. B2).
This paper has been typeset from a TEX/LATEX file prepared by the author.

Caii absorber environments 17
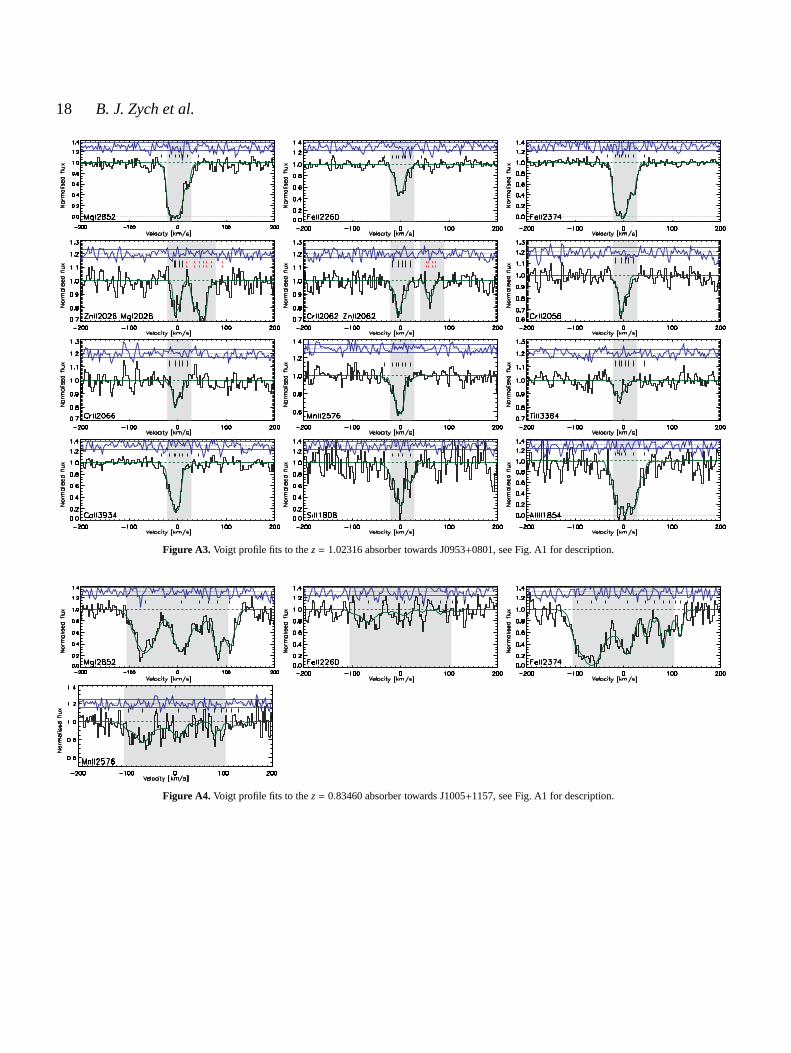
Figure A1. Voigt profile fits to thez = 0.59760 absorber towards J0334−0711. A label (bottom-left) in each panel specifies the transitions incorporated inthe profile fits to the spectral segment shown. The data are represented by the black histograms, whilst the continuum is the dashed line. The fit is shown as asolid line through the data. The residuals between the spectra and the fits, normalised by the 1σ error, are plotted above the spectra. Individual Voigt profilecomponents are marked with ticks. In regions with blends thehigher wavelength transition is marked with dashed ticks. The region representing∆v90 is lightlyshaded behind the data.
Figure A2. Voigt profile fits to thez= 0.74294 absorber towards J0846+0529, see Fig. A1 for description.
18 B. J. Zych et al.
Figure A3. Voigt profile fits to thez= 1.02316 absorber towards J0953+0801, see Fig. A1 for description.
Figure A4. Voigt profile fits to thez= 0.83460 absorber towards J1005+1157, see Fig. A1 for description.
Caii absorber environments 19
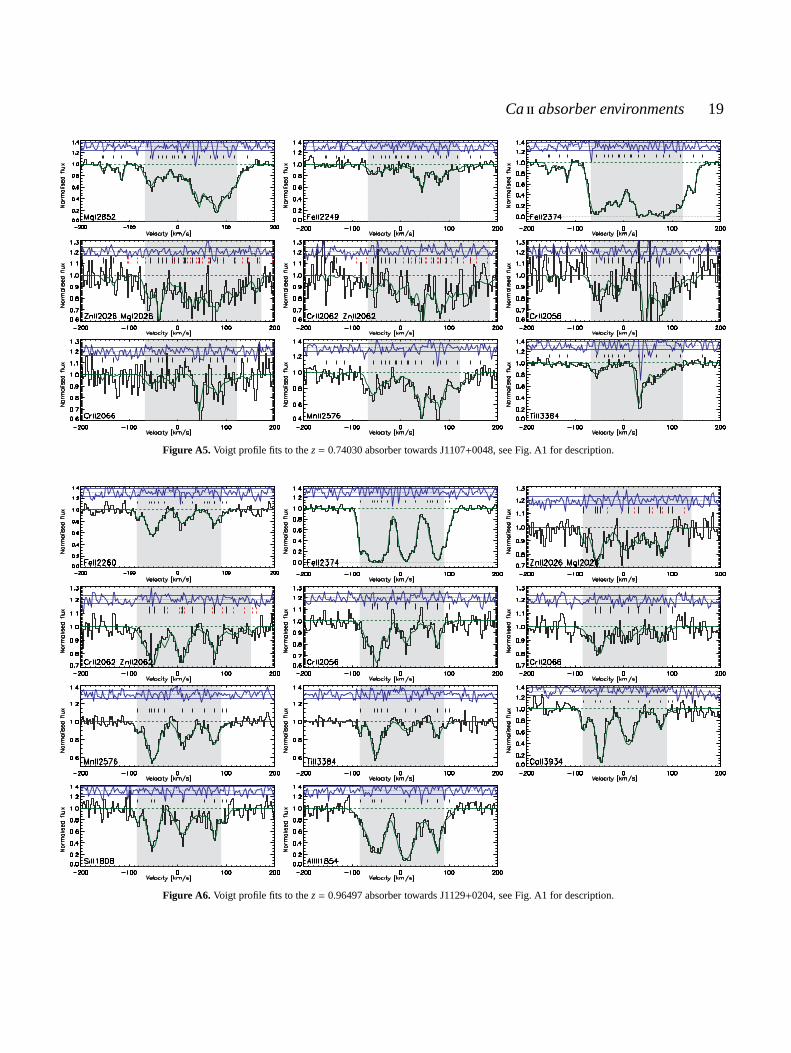
Figure A5. Voigt profile fits to thez= 0.74030 absorber towards J1107+0048, see Fig. A1 for description.
Figure A6. Voigt profile fits to thez= 0.96497 absorber towards J1129+0204, see Fig. A1 for description.
20 B. J. Zych et al.
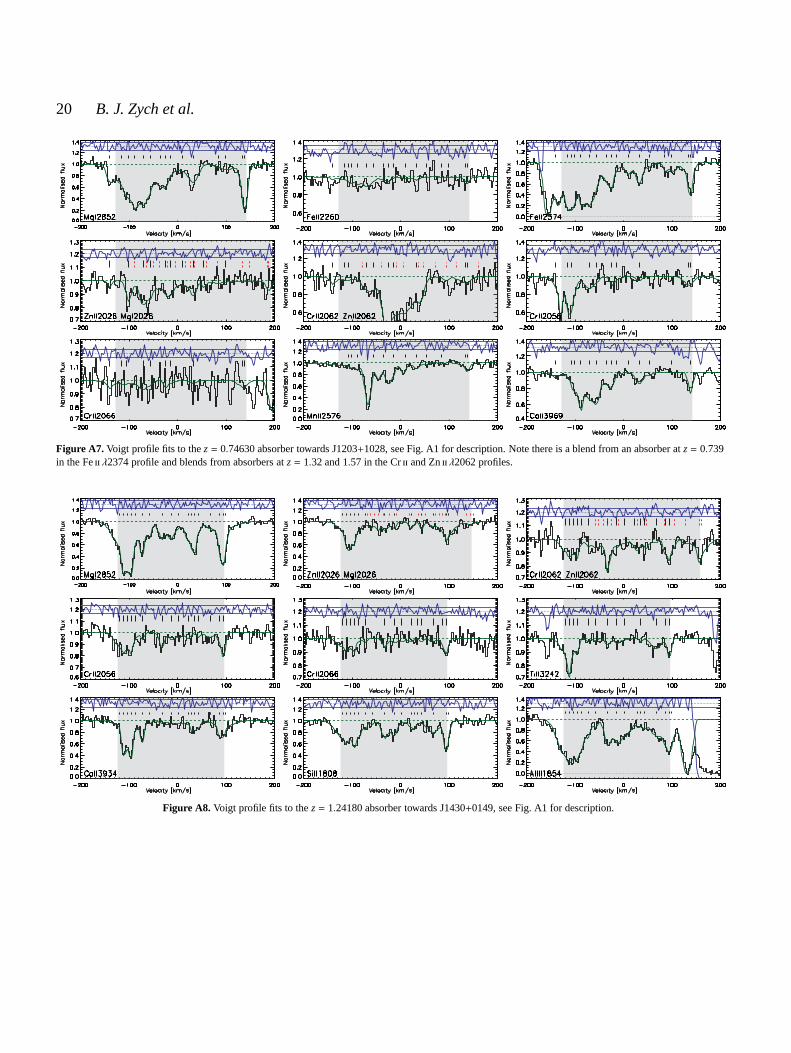
Figure A7. Voigt profile fits to thez= 0.74630 absorber towards J1203+1028, see Fig. A1 for description. Note there is a blend from an absorber atz= 0.739in the Feii λ2374 profile and blends from absorbers atz= 1.32 and 1.57 in the Crii and Znii λ2062 profiles.
Figure A8. Voigt profile fits to thez= 1.24180 absorber towards J1430+0149, see Fig. A1 for description.

Caii absorber environments 21
Figure A9. Voigt profile fits to thez= 1.14955 absorber towards J0517−4410, see Fig. A1 for description.

22 B. J. Zych et al.
Figure B1. The Mgii absorption line structure in each of our absorbers with UVESor HIRES data with sufficient spectral coverage. The absorber’s quasaris identified in the top left-hand corner of each panel. The black histograms are the data and the red histograms are the associated error, whilst the adoptedcontinuum is shown by the dashed line.
Figure B2. The Caii absorption line structure in each of our absorbers with UVESor HIRES data with sufficient spectral coverage. The absorber’s quasaris identified in the top left-hand corner of each panel. The black histograms are the data and the red histograms are the associated error, whilst the adoptedcontinuum is shown by the dashed line.