dutch labour market shortages and potential labour supply ... · roetersstraat 29 -1018 wb...
TRANSCRIPT

Dutch labour market shortages and potential labour
supply from Africa and the Middle East:
Is there a Match?


Roetersstraat 29 - 1018 WB Amsterdam - T (+31) 20 525 1630 - F (+31) 020 525 1686 - www.seo.nl - [email protected] ABN-AMRO IBAN: NL14ABNA0411744356 BIC: ABNANL2A - ING: IBAN: NL96INGB0004641100 BIC: INGBNL2A
KvK Amsterdam 41197444 - BTW NL 003023965 B
Amsterdam, 23 May 2019
Commissioned by the Dutch Ministry of Foreign Affairs
Dutch labour market shortages and potential labour supply from Africa and the Middle East:
Is there a Match?
Executive Summary and Main Report
SEO Amsterdam Economics (SEO) African Studies Centre Leiden (ASCL)
University of Oxford, Centre on Migration, Policy and Society (COMPAS)

SEO AMSTERDAM ECONOMICS
“Solid research, Sound advice” SEO Amsterdam Economics carries out independent applied economic research on behalf of national and international clients – both public institutions and private sector clients. Our research aims to make a major contribution to the decision-making processes of our clients. Originally founded by, and still affiliated with, the University of Amsterdam, SEO Amsterdam Economics is now an independent research group but retains a strong academic component. Operating on a nonprofit basis, SEO continually invests in the intellectual capital of its staff by granting them time to pursue continuing education, publish in academic journals, and participate in academic networks and conferences. As a result, our staff is fully up to date on the latest economic theories and econometric techniques. Full list of authors: SEO Amsterdam Economics Nienke Oomes (main author and editor) Arjan Heyma Thierry Belt Nicolas Berthiaume Paul Bisschop Dario Jongerius Viera Spanikova African Studies Centre Leiden Ton Dietz (ASCL coordinator) Akinyinka Akinyoade Tycho van der Hoog Mayke Kaag External consultants Franck Düvell, University of Oxford and German Institute for Integration and Migration Research Tesseltje de Lange, University of Amsterdam Dajani Consulting Françoise de Bel-Air Alexandra Flayols Nathalie Gons
SEO-report nr. 2019-24
Information & disclaimer SEO Amsterdam Economics has not performed any research on the obtained information and data that would constitute an audit or due diligence. SEO is not responsible for errors or omissions in the obtained information and data.
Copyright © 2019 SEO Amsterdam. All rights reserved. Data from this report may be used in articles, studies and syllabi, provided that the source is clearly and accurately mentioned. Data in this report may not be used for commercial purposes without prior permission of the author(s). Permission can be obtained by contacting: [email protected]

DUTCH LABOUR MARKET SHORTAGES AND POTENTIAL LABOUR SUPPLY FROM AFRICA AND THE MIDDLE EAST: IS THERE A MATCH? i
SEOAMSTERDAM ECONOMICS
Executive Summary
In the Netherlands and many other European countries, demographic developments and structural change are increasingly giving rise to labour market shortages. High tech companies, hospitals and schools are having a hard time filling their vacancies. Young graduates with the right technical, medical, or ICT skills are in high demand. At the same time, around one third of young people in countries near Europe are unemployed. Many countries in Africa and the Middle East are dealing with record high and still rising unemployment rates, especially for youth, women, and those with higher education. It is not surprising, therefore, that many of them increasingly aspire to migrate to Europe for job opportunities. As part of a collective effort to ensure that migration is safe, orderly, regular and to the benefit of all concerned (SDG 10.7), EU member states and African countries have repeatedly committed themselves to an integrated agenda which includes facilitation of legal migration and mobility as well as return and reintegration. There is agreement among EU and African countries that least progress has been made on these two pillars of the Valletta Action Plan (2015) and AU-EU Declaration (2017), where both sides are waiting for the other to do more. In the eyes of many people in Africa and the Middle East, the solution to irregular (boat) migration to Europe is simple: allow their youth to fill the growing number of vacancies in Europe. In order to have a more informed, evidence-based debate on international migration, the Dutch Ministry of Foreign Affairs requested a report to investigate the extent to which there is a potential match between labour demand in Europe (with a focus on the Netherlands) and the supply of potential labour migrants from countries near Europe. The Ministry asked for a comprehensive overview of existing studies, evaluations and other information on (1) labour shortages in the Netherlands and the EU, (2) the extent to which labour migrants from countries near the EU possess the right skills to fill gaps, and (3) recent experiences with labour migrants from these countries in other EU member states. In addition to exploring general trends, the report analyses various case studies and has compiled a list of relevant databases and literature. Three separate reports describe the education systems, labour market characteristics, and migration experiences of Nigeria, Jordan and Tunisia (Annex A,B, and C). Another separate report discusses the existing legal and non-legal barriers and opportunities for labour migration and labour market integration (Annex D). Two final annexes explore lessons learned from recent migration policies in Germany and Sweden (Annex E and F). Finally, Annex G contains the list of compiled migration databases and an extensive bibliography on the determinants of labour migration, with a focus on countries near Europe.
ii
SEO AMSTERDAM ECONOMICS
1. Where do we face labour market shortages and what skills are required? Current labour market shortages in the Netherlands arise from a combination of an ageing population, structural economic change and high economic growth. The demographic trend of ageing populations is an important reason for labour market shortages, as the working population declines compared to the total population size. Other reasons are structural changes in the economy that result from changing preferences and technological developments. In the short run, the business cycle has a large influence on labour shortages, even for sectors and occupations that become less important in the long run. Qualitative mismatches are stable over time. In a market economy, the existence of labour market shortages tends to provoke adjustment mechanisms that reduce these shortages. The main adjustment mechanisms that can be distinguished are adjustments in wages, the quality of labour, labour force participation rates, technology, outsourcing, and migration. While each of these mechanisms can be expected to help reduce labour shortages over time, these adjustment mechanisms take time to realise. In the short run, it is therefore possible for certain shortages to exist. In the medium term (until 2022), the largest labour market bottlenecks in the Netherlands are projected to occur in ICT, education, technical jobs, managerial jobs, creative and linguistic jobs, health and wellbeing, and public administration. It is also expected that the highest rate of job creation will take place in healthcare, wholesale trade, and construction. The latter two, however, are expected to be largely cyclical, and driven by the current economic boom period. There are generally no reliable predictions of labour market shortages beyond a horizon of 3-5 years. The projected ‘shortage’ occupations require mostly medium-skilled and high-skilled workers. Graduates with the best labour market perspectives are those holding technical degrees (at medium, higher, and academic levels), education degrees (higher vocational level), medical degrees (academic level); social and behavioural degrees (academic level) and health-related degrees (higher vocational level). Other important skills that are required in most ‘shortage occupations’ include (Dutch) language proficiency, problem solving abilities in a digital environment and numeracy. Dutch language skills are important for some, but not all, shortage occupations. In a number of sectors experiencing labour shortages, knowledge of the Dutch language and culture is of great importance for most employees. This is the case, for example, for many jobs in primary or secondary education and in healthcare. For some other shortage occupations, especially ICT and technical jobs, Dutch language skills are less essential, especially if migrants know the English language.

EXECUTIVE SUMMARY iii
SEO AMSTERDAM ECONOMICS
2. Do prospective migrants from Africa and the Middle East possess the skills needed to fill our shortages?
To what extent are migrants from Africa and the Middle East likely to possess the skills to fill vacancies in the Netherlands? In order to answer this question, we looked at overall trends, and focused on three case study countries: Nigeria, Jordan and Tunisia. We analysed not only (a) the quantity of potential labour supply, but also the quality, as expressed in terms of (b) the general quality of education, (c) technical skills, and (d) ‘soft’ skills. A. Are they willing and able to migrate? In terms of the quantity of labour supply available from Africa and the Middle East, it seems clear that the number of people interested in (labour) migration to Europe will grow. This occurs for three main reasons: 1. Opposite demographic trends between Africa and Europe. Unlike populations in Europe,
African populations are still growing rapidly and getting younger. This means that the potential pool of labour supply from this region is growing in numbers.
2. Positive relation between economic development and outward migration. Recent empirical evidence suggests that migration aspirations increase, rather than decrease, as a country grows richer (up to a certain level of economic development, after which they start to decrease). Moreover, migration capabilities generally increase when migrants earn better incomes, obtain better access to finance, and become better informed.
3. High youth unemployment. Many countries in Africa and the Middle East do not offer sufficient job opportunities for their growing numbers of youth. Unemployment rates in many of these countries are soaring, particularly among youth, women, and higher educated graduates. Youth unemployment is around 15% in Sub-Saharan Africa and exceeds 30 percent in Northern Africa. In Jordan, 23% of Jordanians with a bachelor’s degree are unemployed, and as many as 54% of women with a university degree were unemployed in 2017.
B. Do they have the right quality of education? The quality of education remains a challenge in all three case study countries studied. In all three countries, enrolment rates for all levels of education increased substantially over the past decades, but indicators of education quality have generally lagged behind as the rapid expansion of the education system was not matched by a comparable increase in funding. • In Tunisia, secondary enrolment more than doubled since 1990, while tertiary
enrolment grew by six times. However, quality indicators show a high number of repeaters in secondary and tertiary education, and a high dropout rate in secondary education. On the positive side, the student-teacher ratio improved significantly and the dropout rate in tertiary education is low. In international math and science test scores taken in grade 8, Tunisia scores higher than other countries in the region.
• Jordanians are generally highly educated, but the quality of secondary education is a concern. Nearly 18% of the population and as much as 63% of migrants have a university degree. However, there are indications that the quality of education deteriorated during 2007-2015. In particular, high school mathematics test scores have decreased.

iv
SEO AMSTERDAM ECONOMICS
• In Nigeria, gross enrolment rates in secondary education more than doubled since 1999, but they remain low at around 55%. Key challenges are (a) the lack of qualified trained teachers in public schools; (b) the substandard performance of students at the secondary level, and (c) low completion rates. Pupil-teacher ratios remain high in primary schools, but have improved significantly in secondary schools. Moreover, the quality of education appears to be much better in private schools, which now account for more than half of all secondary schools but are not captured yet by official education statistics. While gross enrolment in tertiary education is only 10%, many Nigerian students undertake tertiary education abroad, particularly in the UK and the US.
C. Do they have the right technical skills? In terms of technical skills, it is noteworthy that students from all three case study countries tend to specialise in a number of fields in which Europe needs more workers. These include studies as engineering, mathematics, business, ICT, and health related fields. • Tunisian students tend to prefer technical fields. In secondary education, more than half
of all A-level students choose to study experimental science or technical studies. In tertiary education, technical fields such as engineering, ICT and natural sciences together account for more than 40 percent. Based on one ICT survey, Tunisian software developers rank highest among others in Maghreb countries. Germany has aimed to attract Tunisian engineers.
• Jordanians tend to study in a variety of fields. The most popular fields of study are trade & business, education, social science, medical studies, humanities, natural science, engineering and mathematics/ICT. Jordanian students who obtain higher education degrees abroad tend to study medicine or engineering.
• Nigerian students abroad mostly study engineering, business, and medical fields (health and life sciences). Nigerian polytechnics offered 143 different programmes in the 2014/15 academic session. In that academic year, nearly 300,000 students were enrolled in polytechnics. In the United States, Nigerians have a strong reputation in health-related fields.
D. Do they have the right soft skills? With regard to ‘soft’ skills, there is often the perception among Dutch employers that expatriates from the Middle East or Africa are culturally so different that it is difficult and risky to employ them. In surveys and interviews, Dutch and other European employers often refer to problems such as language barriers, cultural differences, and differences in ‘work ethic’. This is likely the result of the fairly limited and very specific experience that the Netherlands has had with traditional groups of migrants from these regions, most notably guest workers and refugees. These specific groups have historically tended to be lower educated (sometimes even illiterate), socially and religiously more conservative, and statistically more likely to be unemployed than their Dutch counterparts. It is therefore not surprising that cultural differences are seen as a barrier to labour market integration for these groups of migrants. However, these groups are likely not representative of the types of labour migrants that are needed in the future. International research suggests that cultural differences need not be a key barrier to labour market integration in the long term. Extensive migration research carried out in the United States and Europe shows that both the first and second generations of migrants in the US tend to

EXECUTIVE SUMMARY v
SEO AMSTERDAM ECONOMICS
assimilate faster and achieve parity in labour market outcomes more quickly than in Europe. In fact, migrants in the US often perform better than ‘natives’, including migrants from the Middle East and from Africa. While the US has a history that is very different from Europe, the US experience does illustrate that cultural differences need not stand in the way of successful labour market integration, particularly if the term ‘migrant’ is no longer associated with being low educated, as still is the case in Europe. When countries start to attract a larger variety of migrants of various backgrounds, education levels, and careers, one would therefore expect the negative stigma attached to the term ‘migrant’ to disappear over time. One suggestion to speed up this process would be to use the term ‘expat’ instead of ‘migrant’, as is already done in some countries. E. Is there a match between demand and supply? Taking into account all of the above, the best opportunities for (new) matches between Dutch labour demand and potential labour supply from Africa or the Middle East appear to lie in the medium and higher vocational professions. For professions that require academic qualifications, it seems less likely that a good match can be made for those trained locally, due to concerns over the quality of local tertiary education. There are pockets of excellence, however: for example, Jordan hosts a couple of top universities with international rankings. For medium and higher vocational professions, however, there seem to be larger opportunities for matches, as graduates from this region tend to obtain their education in fields such as engineering, ICT, health, and other professions for which there is high demand in Europe. As of yet, however, there is insufficient detailed research available to ascertain whether there is a qualitative match between the supply side and the demand side for particular professions. Syrian refugees could also be considered as a potential source of (temporary) labour supply. At first sight, it is less likely that Syrian refugees based in Jordan (or Lebanon or Turkey) are a good match for the Dutch labour market. As our research showed, these Syrian refugees tend to be mostly lower educated and low skilled, while Dutch employers mostly demand higher education or higher vocational training. The majority of male Syrian refugees in Jordan with employment work in agriculture, mechanics, or construction. However, given the large numbers of Syrian refugees involved, it is very well possible that a smaller subset of Syrian refugees in the Middle East have skills that could be useful to the Dutch or European labour market. The same holds for Syrian refugees in Europe, which tend to be more highly educated.

vi
SEO AMSTERDAM ECONOMICS
3. What can the Netherlands learn from experiences in Germany and Sweden with recruiting labour migrants from countries near Europe?
Both Germany and Sweden have relevant recent experience with the recruitment of labour migrants from Africa and the Middle East. The most relevant migration policies surveyed here were the following: 1. The German Tunisia Mobility Pact was set up by the German Ministry for Foreign Affairs from
2012 to 2016 to facilitate labour migration of highly skilled Tunisians, in particular young engineers. Participants were offered an intensive German language course in Tunisia; a three-month internship in Germany; and the possibility to subsequently be employed by German employers.
2. Germany also conducted a pilot project from 2016 aimed at ‘Supporting Young Moroccans in Employment and Training Opportunities in Scarcity Jobs in Germany’ funded by the World Bank. Both programmes were implemented by GIZ.
3. In Sweden, a migration policy reform took place in 2008 as a result of which individual employers became largely free to decide which migrants to recruit, from which countries and for what jobs.
4. In addition, Sweden introduced in 2015 a fast track programme for attracting migrants into labour ‘shortage occupations’, which included Swedish language training. The aim of this is to (a) more quickly integrate asylum seekers with a residence permit in the labour market; (b) find jobs for newly arrived asylum seekers that correspond to their skills; and (c) support sectors that face shortages of labour for specific occupations or skills.
The German programmes to attract skilled Tunisians and Moroccans into scarcity jobs appear to have had positive results but remained limited in scale. First, the German Tunisia Mobility Pact was generally well received by both employers and employees and appeared to fill a gap: 73% of participants found employment and employers seemed satisfied with these placements. Second, due to funding restrictions, only around 200 participants could be placed, although there was more demand from employers. Third, there were some tensions between (1) the government’s interest in facilitating temporary migration and (2) employer interests in longer-term immigration, due to the need to maximise returns on their training investment. This suggests that public-private partnerships, notably employers taking over existing legal migration channels, may only work for large employers or employer associations and not for smaller employers who lack the resources to invest in training. With regard to the programme with Morocco, there are early indications that the programme is a success in that it has high retention rates, but it is too early to draw conclusions. The Swedish experience with migration policy reform also provides several useful lessons for the Netherlands. It suggests that abolishing work permits altogether does not necessarily lead to a sudden large demand from employers to hire labour migrants for filling ‘shortage occupations’. Another lesson learned is that a ‘fast track program’ to integrate asylum seekers into the labour market does not necessarily result in large numbers of labour migrants either. At least in Sweden, the number of experienced asylum seekers who made the transition to becoming a formal labour migrant has remained low.

DUTCH LABOUR MARKET SHORTAGES AND POTENTIAL LABOUR SUPPLY FROM AFRICA AND THE MIDDLE EAST: IS THERE A MATCH?
SEOAMSTERDAM ECONOMICS
Table of contents
Executive Summary ............................................................................................................. i
1 Introduction ............................................................................................................... 1
2 Labour market shortages .......................................................................................... 3 2.1 Introduction ........................................................................................................................... 3
2.2 Labour market shortages: theory ........................................................................................ 4
2.3 Main reasons for labour market shortages ........................................................................ 6
2.4 Projections of labour market shortages ........................................................................... 19
2.5 Changes in required skills ................................................................................................... 24
2.6 Conclusions .......................................................................................................................... 27
3 Migration Trends and Aspirations ........................................................................... 31 3.1 Global and European migration trends ........................................................................... 32
3.2 Syrian refugees ..................................................................................................................... 44
3.3 Migration to the Netherlands ............................................................................................ 46
3.4 Migration aspirations .......................................................................................................... 62
4 Labour supply of potential migrants from Africa ....................................................69 4.1 Demographic developments .............................................................................................. 69
4.2 Education trends in Africa ................................................................................................. 72
4.3 Labour market trends ......................................................................................................... 78
4.4 Migration flows from Africa .............................................................................................. 81
5 Conclusions ............................................................................................................. 91 5.1 Labour market shortages in the Netherlands ................................................................. 91
5.2 Labour supply in Nigeria, Tunisia and Jordan ................................................................ 93
5.3 Is there a match? .................................................................................................................. 95
5.4 Barriers and opportunities related to migration policies ............................................... 96
5.5 Barriers and opportunities related to labour market integration of migrants ........... 97
Appendix A Migration statistics: definitions .................................................................99


DUTCH LABOUR MARKET SHORTAGES AND POTENTIAL LABOUR SUPPLY FROM AFRICA AND THE MIDDLE EAST: IS THERE A MATCH? 1
SEOAMSTERDAM ECONOMICS
1 Introduction
In May 2018, the Dutch Ministry of Foreign Affairs selected SEO Amsterdam Economics and its partners to carry out a study on the expected labour market shortages in the Netherlands and the wider EU, and “the extent to which there is a match between demand and supply of labour migration from countries near Europe”. As part of a collective effort to ensure that migration is safe, orderly, regular and to the benefit of all concerned (SDG 10.7), EU member states and African countries have repeatedly committed themselves to an integrated agenda which includes facilitation of legal migration and mobility as well as return and reintegration.1 There is agreement among EU and African countries that least progress has been made on these two pillars of the Valletta Action Plan (2015) and AU-EU Declaration (2017), where both sides are waiting for the other side to do more. In the eyes of many people in Africa and the Middle East, the solution to irregular (boat) migration to Europe is simple: allow their youth to fill the growing number of vacancies in Europe. The main objective of this study is to research the extent to which labour migrants from Africa and the Middle East could potentially reduce labour market shortages in the Netherlands. In addition, the study discusses the barriers to and opportunities for migration and integration for these groups. Jordan, Nigeria and Tunisia were selected by the Ministry for an in-depth analysis of potential labour supply. The study was carried out by researchers from SEO Amsterdam Economics (lead party), supported by international experts from the African Studies Centre Leiden (ASCL), the University of Oxford and the University of Amsterdam, as well as by local experts from Jordan, Nigeria and Tunisia. The report is organised as follows: • Chapter 2 investigates and summarises the available information about labour demand in the
Netherlands and Europe, and particularly the extent to which there are shortages in specific sectors and for specific professions.
• Chapter 3 provides an overview of past migration flows. • Chapter 4 reviews available information about potential migrant flows and the characteristics
of potential labour supply from Africa. • Chapter 5 concludes.
In addition, the report includes the following Annexes: • Annex A contains a background report on Nigeria (education, labour market, and migration). • Annex B contains a background report on Jordan (education, labour market, and migration). • Annex C contains a background report on Tunisia (education, labour market, and migration). • Annex D contains a summary of available information on the barriers to migration and barriers
to integration in the Netherlands. • Annex E contains a summary of recent migration policies in Germany. • Annex F contains a summary of recent migration policies in Sweden. • Annex G provides a list of relevant migration databases and an extensive bibliography.
1 A.o. Valletta Action Plan (2015), AU-EU summit (Nov. 2017), Valletta progress report (November 2018)


DUTCH LABOUR MARKET SHORTAGES AND POTENTIAL LABOUR SUPPLY FROM AFRICA AND THE MIDDLE EAST: IS THERE A MATCH? 3
SEOAMSTERDAM ECONOMICS
2 Labour market shortages
2.1 Introduction Mismatches between labour demand and labour supply can occur. A labour market mismatch typically expresses itself as a situation where a substantial number of people are unemployed, while there also a substantial number of unfilled vacancies. A mismatch is predominantly qualitative in nature and can exist both during periods of economic growth and economic downturns. However, mismatches tend to be larger and more noticeable during business cycle upswings (booms). Excess demand for specific types of labour is often interpreted as a sign that there are labour market shortages, even when in quantitative terms total labour supply outnumbers total labour demand. The Dutch Ministry of Foreign Affairs (MFA) has requested to examine the importance of demographic trends as one possible explanation for labour market shortages. When populations age, as they do throughout Europe, the size of the working population2 declines compared to the total population size. Since labour supply is mainly determined by the size of the working population, while labour demand is affected by total population size, ageing populations can give rise to labour shortages. Moreover, an ageing population influences the types of goods and services that are demanded, and therefore the type of labour or types of jobs that are required. An example is the higher need for health care and elderly care when a larger part of the population becomes older. While the population of Europe is ageing, demographic trends in less developed countries near Europe show higher fertility rates and lower life expectancies. This results in relatively young populations with a large share of adults in the working age segment. Relatively high labour supply and low labour demand in these countries tends to cause high unemployment rates and limited labour market opportunities, particularly for younger workers. The combination of (a) existing labour shortages in European countries and (b) high unemployment in countries near Europe creates potential opportunities. This is partly because of opposing demographic developments, but there are also other reasons why international labour market matches could potentially be made or improved between the two sides. To explore these opportunities, more information is needed on the size and type of labour shortages in Europe and the Netherlands in particular. This chapter summarises the main trends in labour supply, labour demand and labour shortages that are assessed in the academic and policy-oriented literature on labour market developments in the Netherlands and Europe. MFA has asked SEO Amsterdam Economics to research the following questions:
2 The working population is typically defined as people in the population between the ages of 15 and 65 that
are able and willing to work. Depending on the definition, this group could be broadened to include people up to the age of 75 or, alternatively, up to the age of retirement.

4 CHAPTER 2
SEO AMSTERDAM ECONOMICS
1. Will demographic developments potentially lead to shortages on the labour market in the Netherlands and the European Union in the next 2, 5, 10 and 20 years, and if so, is it possible to give an indication of the size and kind of shortages, specified by sector and occupation?
2. What are the required skills for occupations/sectors in the Netherlands where increasing shortages are expected: education, diplomas, experience, language skills?
The chapter is organised as follows. First, a short introduction is given on the economic theory behind labour market shortages and the mechanisms that are expected to reduce such shortages in the long term. Next, the main reasons for labour shortages are explored, including the specific demographic trends in Europe and in the Netherlands in particular. Since demographic trends are not the only reason for labour shortages to exist, the above research questions are assessed in the context of more general economic and labour market developments that could give rise to labour market shortages. Third, we provide a summary of the existing estimates of the size and types of labour shortages over the short and medium term. Finally, the chapter ends by summarising the main conclusions from this literature study.
2.2 Labour market shortages: theory Labour market shortages in Europe are mainly due to excess demand for specific types of labour, rather than a quantitative mismatch between total labour supply and total labour demand. However, an increase in labour demand compared to labour supply, for example as a result of ageing, also increases the number of sectors or professions for which mismatches may arise. At the same time, several mechanisms are expected to reduce these mismatches on the labour market once they occur. A short introduction about these mechanisms on the labour market may help to understand how that works.
2.2.1 The labour market
The labour market is the (virtual) place where labour supply meets labour demand. Labour supply is the provision of labour by workers. Labour demand is the need for labour input by employers. Employment occurs when both workers and employers agree on a certain price: the equilibrium wage at which demand equals supply. Let us first discuss how wages would normally be expected to adjust in a fully competitive (non-regulated) labour market to reduce unemployment. If wages in a certain labour market are higher than the equilibrium wage, this means that more people are willing to give up leisure to provide (additional) labour, while fewer employers are willing or able to hire labour at that wage. Such an excess supply of labour (labour supply exceeding labour demand) results in unemployment. Unemployment in turn induces some unemployed workers to offer labour at a lower price, reducing the average price of labour towards the equilibrium price and increasing labour demand. The opposite situation would occur if the wage in a certain labour market is below the equilibrium wage. In that case, less people are willing to give up leisure to provide labour, while more employers would like to hire labour at that price. This excess demand results in unfilled vacancies and labour shortages. In a competitive labour market, such shortages would typically induce some employers to pay more for additional labour supply, increasing the average price of labour towards the equilibrium wage. This in turn would encourage workers to increase their labour

LABOUR MARKET SHORTAGES 5
SEO AMSTERDAM ECONOMICS
supply. The market mechanism would be expected to continue until labour supply equals labour demand. In a competitive labour market without regulations or restrictions, total employment would – in the long run - be determined by the size of the labour force in combination with preferences for leisure versus income among the working population. As long as the population and preferences are fixed (static), there is a static equilibrium where supply meets demand with no labour shortages. Actual labour markets, of course, are not fully competitive and tend to be in constant flux. Population sizes and compositions are continually changing, and people have dynamically changing preferences for leisure, income and consumption (among other dynamics). This implies that the supply and demand for labour constantly changes, causing temporary mismatches in the labour market. Labour market shortages may thus arise at any time. Actual labour markets are not only dynamic instead of static; they are also segmented. There are many types of labour that can be specified by job, sector, education level, skill, etc. - each of which can be seen as a segment of the labour market. In each segment, competition would be expected to create pressures for wages to adjust so as to equate supply and demand. For that reason, labour shortages in some segments of the labour market may coexist with unemployment in other segments of the labour market. Solving labour market shortages is therefore not only an issue of increasing labour supply or decreasing labour demand, but often an issue of adjusting the type of labour supply and type of labour demand.
2.2.2 Adjustment mechanisms
While the description above focused on wages as the key adjustment mechanisms, there are in fact several adjustment mechanisms that eventually can lead to equilibrium between labour supply and labour demand. The main mechanisms that can be distinguished are: • Adjustments in the price of labour: rising or declining wages. • Adjustments in the quality of labour: higher or lower quality, less or more variety in products. • Adjustments in the labour force participation rate: more or less people can work more or less
hours. • Adjustments in the contribution of labour to the production process: technological change. • Adjustments in the size of the labour force via emigration or immigration. • Adjustments in the demand for domestic labour via outsourcing or foreign investment. • Adjustments in transaction costs to reduce information mismatches. Each of these mechanisms can be expected to help reduce labour shortages over time. They can cause labour supply and labour demand to move into the direction of a new equilibrium, with adjusted wages and/or employment levels. Shortages on any market are typically not there forever, but mainly a reason for change. In that sense, labour market shortages are only a short-term phenomenon. In the short run it is possible for certain shortages to exist, as a consequence of the fact that these adjustment mechanisms take time to realize (CPB, 2013). In the long run, dynamics on the labour market may cause a continuum of new types of shortages, giving the impression that shortages may be persistent.

6 CHAPTER 2
SEO AMSTERDAM ECONOMICS
In facilitating and speeding up adjustment mechanisms with policy, it is therefore important to assess the type of shortages that have arisen and when they have arisen. For example, technological development may increase the demand for technicians structurally, while the business cycle may increase the demand for technicians only temporarily. An ageing population increases the demand for health care personnel, but limited budgets will reduce the growth in the demand for this personnel as a result of technological change that may provide cost reductions in health care. Both examples show that it is important to know the reason for the existence of labour shortages in order to help solving them. The main reasons for expected labour shortages in the Netherlands and Europe are therefore described next.
2.3 Main reasons for labour market shortages This section reviews the four most important reasons for labour market shortages. These are (1) demographic developments; (2) labour force participation rates; (3) business cycles and (4) structural change. First, demographic developments are an important reason, since demographics both determine labour demand (by the size of the total population) and labour supply (by the size of the working population). Second, what matters is not only the size of the labour force, but also the extent to which the labour force is willing to supply their labour. Third, labour shortages can be cyclical: a booming business cycle leads to increased income, consumption and investments, leading to higher production and higher labour demand that may temporarily exceed labour supply. Finally, labour shortages can arise due to ‘structural change’, in which both technological developments and changing preferences play a role. A change in preferences for products and services, and a change in production possibilities will lead to changes in the type and amount of labour that is demanded. These four important reasons for labour market shortages and their current state of affair are treated in more detail below.
2.3.1 Demographic developments
There are two driving forces of population growth: natural population growth and migration. The former is determined by the death rate and the birth rate. The latter is determined by immigration and emigration. Both these driving forces are dependent on socio-cultural, economic and political developments. This section discusses the key demographic developments in the Netherlands and Europe. The total size and structure of the population has an impact on both labour supply and labour demand. The supply of labour depends strongly on the composition of the workforce in terms of age, health, education level, and skills. Due to various reasons (such as retirement, childcare, education, disability) not everyone participates in the labour market. The subset of the population that does participate in the labour market is referred to as the working population. The working population constitutes the supply of labour. The demand for labour is also affected by the size and structure of the population, since this affects the demand for goods and services and thereby also influences the demand for labour.
The Netherlands The Dutch population is expected to increase only slightly in the foreseeable future. Statistics Netherlands (in Dutch: CBS) regularly publishes reports in which they set out their

LABOUR MARKET SHORTAGES 7
SEO AMSTERDAM ECONOMICS
forecast of the Dutch population growth. In the latest available report, projections are made of the Dutch population from 2017 up to 2060 (Van Duin, Huisman & Stoeldraijer, 2017). It is expected that the Dutch population will continue to grow from 17.1 million inhabitants at present to around 18 million inhabitants in 2031. From around 2040, the Dutch population is expected to stagnate at around 18.4 million inhabitants (see Figure 2.1). From 2018 onwards, a slowdown in the growth of around 62 thousand people per year will take place. From 2028 onward, a renewed, stronger decline in natural population growth rate is expected due to increasing mortality. As discussed, population growth is determined by the natural population growth and migration. According to the CBS population forecast, the number of births rises up until 2025, after which it is expected to fluctuate, which is a reflection of the number of women of childbearing age. Despite the rising lifespan, the number of deaths is expected to increase sharply in the coming decades as a result of the aging population. The resulting decline in the population is offset by an expected increase in the number of net migrants, totaling 527 thousand in between 2017-2060 (Van Duin, Huisman & Stoeldraijer, 2017). The projections for migration are however much less certain than those for natural population growth.
Figure 2.1 Population projections 2017-2060 and actual population size 2060-2017 for the Netherlands
Source: CBS (2017)
The slow population growth in the Netherlands, mainly due to migration, combined with an increased life expectancy, comes with an ageing of the Dutch population. This can be illustrated by the expected increase in the proportion of the population that is older than age 65. In 2017 this proportion equaled 19 percent, but is expected to increase to 26 percent in 2040. This is mainly a consequence of the high birth rate of the period following the Second World War (1950s and 1960s) and the much lower birth rate from the 1970s onwards. Increasing life expectancy also increases the proportion of over-65s in the total population and is expected to continue. The proportion of the population between the age of 20-65 is expected to remain constant up until 2030, after which it is expected to decrease slightly from around 10 million to 9.6 million around 2040. The fact that it will not decrease in the near future is a consequence of immigration, as those who immigrate tend to belong to this age-group. The proportion of the population between the age of 0-20 is expected to fluctuate. Around 2025 this age-group is expected to reach a minimum of 3.7 million people, then rise to 3.9 million people around 2040.
10
11
12
13
14
15
16
17
18
19
1960 1970 1980 1990 2000 2010 2020 2030 2040 2050 2060
Mill
ion

8 CHAPTER 2
SEO AMSTERDAM ECONOMICS
Europe Demographic developments in the EU-28 are similar to that of the Netherlands. Like the Netherlands, the population of the EU-28 has seen a continuous, albeit gradually diminishing, increase over the last 50 years (see Figure 2.2). However, natural population growth in the EU has become slightly negative in recent years, meaning that the increase in population of the last few years is almost entirely due to positive net migration. In 2016, 18 out of the 29 Member States realised an increase in their populations. 14 of these recorded both a positive natural population increase and positive net migration, whilst the remaining 4 (Finland, Germany, Spain and Poland) realised a negative natural population change and positive net migration. Out of the 10 Member states that realised a negative population growth, 3 recorded a decline largely due to negative net migration (Croatie, Latvia and Lithuania). In contrast, 5 recorded a decline largely due to a negative natural population change supplemented by a relatively low negative rate of net migration (Bulgaria, Greece, Hungary, Portugal and Romania). In the remaining two Member States (Italy and Estonia), the negative population growth was solely due to the negative natural population change, as the net migration rate was positive.
Figure 2.2 Population development since 1960 in Europe (EU-28)
Source: Eurostat
Different institutions have made wildly different projections of EU population growth. As Figure 2.3 shows, the average projection is the CEPAM ‘medium scenario’, according to which the EU-28 population will remain at a constant level (around 510 million) up until 2060. The sum of the national projections (called ‘National’ in Figure 2.3) reaches the same level by 2060, but with a more concave trajectory. In this sum, a more steep increase up until 2035 is expected to slightly above 520 million people, after which a similar decrease in total population size is projected to slightly less than 510 million. Eurostat, on the other hand, expects the population to increase by around 16 million to 2060, with a peak around 2045. The other scenarios in the graph are based on varying and more extreme assumptions concerning migration and therefore result in somewhat more extreme developments.
300
350
400
450
500
550
1960 1965 1970 1975 1980 1985 1990 1995 2000 2005 2010 2015
Mill
ion
LABOUR MARKET SHORTAGES 9
SEO AMSTERDAM ECONOMICS
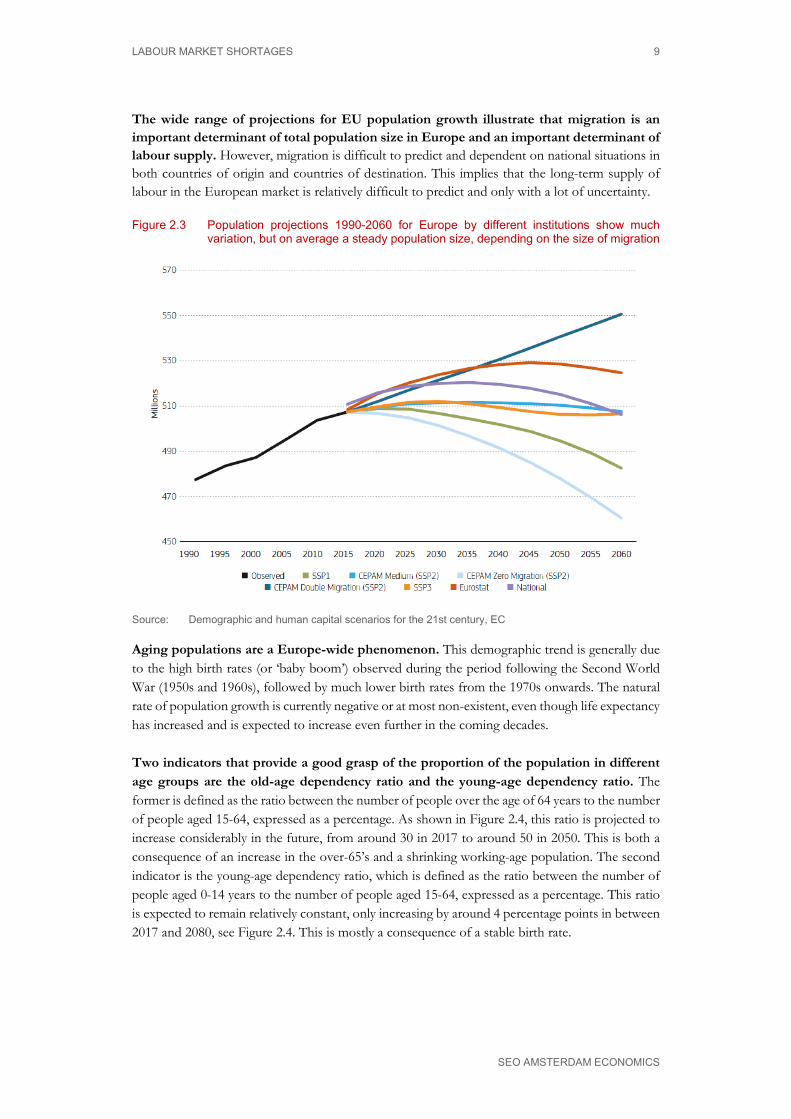
The wide range of projections for EU population growth illustrate that migration is an important determinant of total population size in Europe and an important determinant of labour supply. However, migration is difficult to predict and dependent on national situations in both countries of origin and countries of destination. This implies that the long-term supply of labour in the European market is relatively difficult to predict and only with a lot of uncertainty.
Figure 2.3 Population projections 1990-2060 for Europe by different institutions show much variation, but on average a steady population size, depending on the size of migration
Source: Demographic and human capital scenarios for the 21st century, EC
Aging populations are a Europe-wide phenomenon. This demographic trend is generally due to the high birth rates (or ‘baby boom’) observed during the period following the Second World War (1950s and 1960s), followed by much lower birth rates from the 1970s onwards. The natural rate of population growth is currently negative or at most non-existent, even though life expectancy has increased and is expected to increase even further in the coming decades. Two indicators that provide a good grasp of the proportion of the population in different age groups are the old-age dependency ratio and the young-age dependency ratio. The former is defined as the ratio between the number of people over the age of 64 years to the number of people aged 15-64, expressed as a percentage. As shown in Figure 2.4, this ratio is projected to increase considerably in the future, from around 30 in 2017 to around 50 in 2050. This is both a consequence of an increase in the over-65’s and a shrinking working-age population. The second indicator is the young-age dependency ratio, which is defined as the ratio between the number of people aged 0-14 years to the number of people aged 15-64, expressed as a percentage. This ratio is expected to remain relatively constant, only increasing by around 4 percentage points in between 2017 and 2080, see Figure 2.4. This is mostly a consequence of a stable birth rate.

10 CHAPTER 2
SEO AMSTERDAM ECONOMICS
Figure 2.4 The old-age and young-age dependency ratios illustrate the ageing of the European population between now and 50 years in time
Source: http://ec.europa.eu/eurostat/statistics-explained/index.php/People_in_the_EU_-
_population_projections
2.3.2 Labour force participation
The size of the labour force not only depends on the size of the population of working age, but also on the labour force participation rate within this population. This rate measures the proportion of a country’s working age population that is employed or actively looking for a job. There may be several reasons for people not to supply labour on the labour market (extensive labour supply) apart from the price of labour, due to health, abilities, family situation and personal preferences. The same reasons may also affect the number of hours that people supply their labour for (intensive labour supply). In this paragraph, information is given on the developments in labour participation in the Netherlands and Europe respectively.
The Netherlands The labour force participation rate for people between the ages of 15 and 74 has increased substantially over the last fifty years, but is unlikely to increase much further. As Figure 2.5 shows, it increased from around 60 to around 70 percent during this period. This is mainly due to a strong increase in the participation rate for older (55+) workers since the 1990s, when generous early retirement schemes were abolished and early retirement through unemployment and disability insurance became more difficult.3 Participation rates of women also increased substantially during this period, from around 35 percent in 1969 to over 65 percent in 2017 (Figure 2.6). However, this was partly compensated by a decline in labour participation by men up to the 1990s. Since 2008, the increase in the overall participation rate has leveled off, but could be expected to increase somewhat further as a result of the higher retirement ages in the coming decades. At the same time,
3 The decreasing trend during the 1970s and 1980s is related to the increase in the total labour force, due to
the baby boom and the increase in labour force participation by women, combined with an extensive use of pre-pension schemes as well as an extensive use of disability regulations for the 45-65 category. Since the end of the 1990s, the labour force participation rate of the 45-75 group increased substantially. An important reason is that the large group of ‘baby boomers’ started to join this category. By now, this group has gradually been retiring, as a result of which labour force participation rates are stabilising again.
0%
10%
20%
30%
40%
50%
60%
2015 2020 2025 2030 2035 2040 2045 2050 2055 2060 2065 2070 2075 2080
Old-age dependency ratio (population 65 and over to population 15-64 years)
Young-age dependency ratio (population aged 0-14 to population 15-64 years)

LABOUR MARKET SHORTAGES 11
SEO AMSTERDAM ECONOMICS
labour force participation rates are historically high and cannot be expected to increase much further, at least not in terms of the total number of people (the ‘extensive margin’).
Figure 2.5 Gross labour force participation in the Netherlands by age, 1969-2017
Source: CBS Statline
The amount of time worked per person – the intensive margin of labour participation – has decreased slightly in the Netherlands, from 32 hours on average in 2003 to 31 hours in 2017. This is because of the sharp increase in the number of people (especially women) that work part time. In 2017, women on average worked 26 hours per week while men worked 36 hours per week.
0
10
20
30
40
50
60
70
80
90
100
1969 1972 1975 1978 1981 1984 1987 1990 1993 1996 1999 2002 2005 2008 2011 2014 2017
%
Total Age 15-25 Age 25-45 Age 45-75
12 CHAPTER 2
SEO AMSTERDAM ECONOMICS
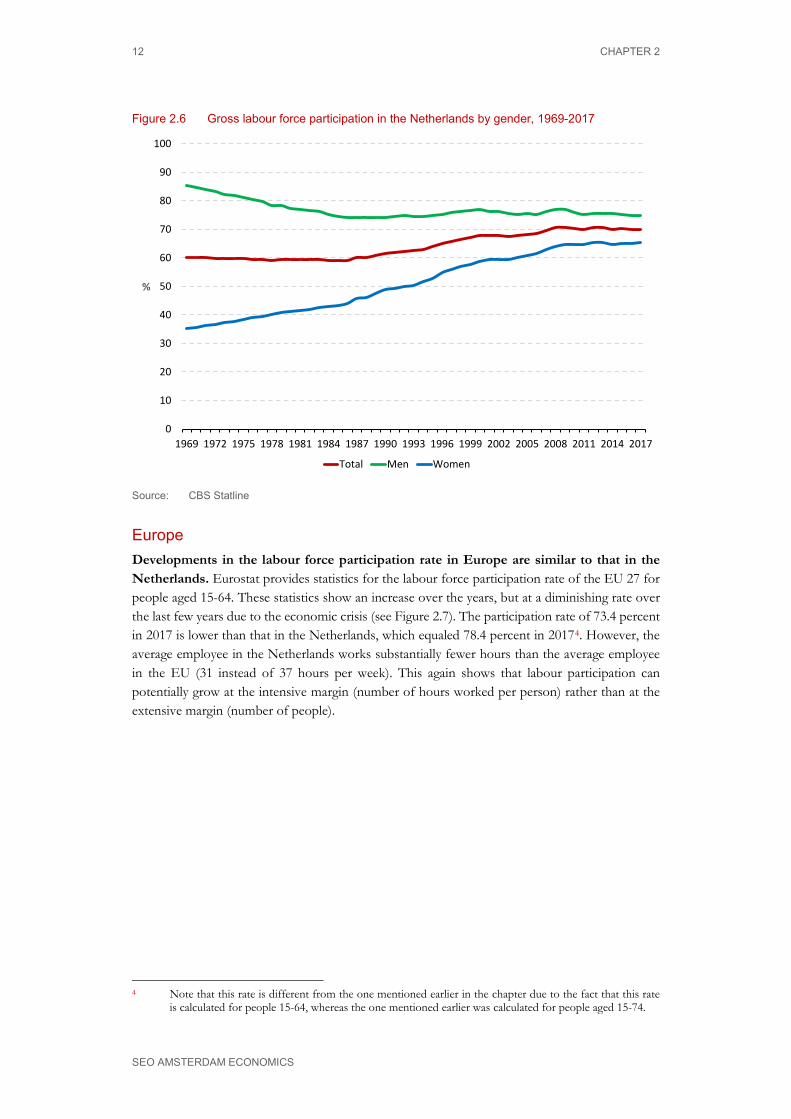
Figure 2.6 Gross labour force participation in the Netherlands by gender, 1969-2017
Source: CBS Statline
Europe Developments in the labour force participation rate in Europe are similar to that in the Netherlands. Eurostat provides statistics for the labour force participation rate of the EU 27 for people aged 15-64. These statistics show an increase over the years, but at a diminishing rate over the last few years due to the economic crisis (see Figure 2.7). The participation rate of 73.4 percent in 2017 is lower than that in the Netherlands, which equaled 78.4 percent in 20174. However, the average employee in the Netherlands works substantially fewer hours than the average employee in the EU (31 instead of 37 hours per week). This again shows that labour participation can potentially grow at the intensive margin (number of hours worked per person) rather than at the extensive margin (number of people).
4 Note that this rate is different from the one mentioned earlier in the chapter due to the fact that this rate
is calculated for people 15-64, whereas the one mentioned earlier was calculated for people aged 15-74.
0
10
20
30
40
50
60
70
80
90
100
1969 1972 1975 1978 1981 1984 1987 1990 1993 1996 1999 2002 2005 2008 2011 2014 2017
%
Total Men Women

LABOUR MARKET SHORTAGES 13
SEO AMSTERDAM ECONOMICS
Figure 2.7 Gross labour force participation in the EU-27, 2000-2017
Source: https://ec.europa.eu/eurostat/statistics-
explained/index.php/Labour_market_and_Labour_force_survey_(LFS)_statistics
2.3.3 Business cycles
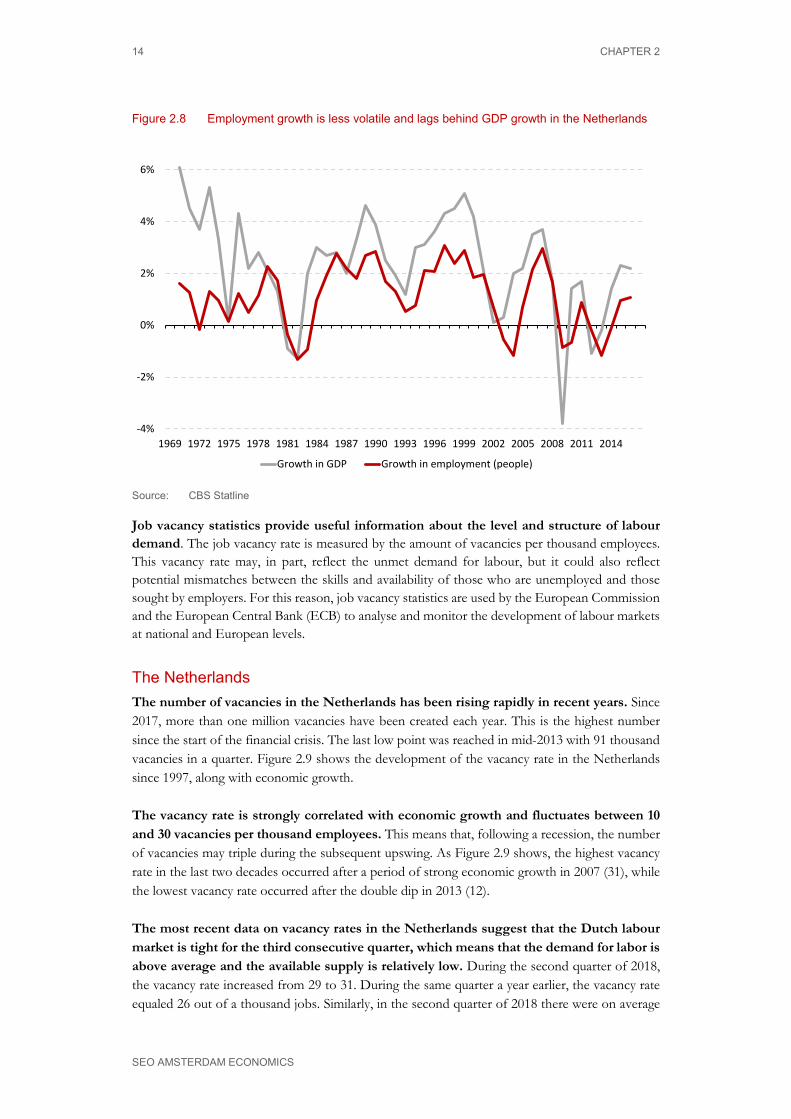
Labour shortages are generally larger during upswings in the business cycle, but most of these short-term shortages are temporary. Upswings in the business cycle typically lead to temporary shortages, due to cyclical increases in consumption and investment such as increased demand for construction services. The current economic boom, which followed the long 2008-2014 recession, has indeed sharply increased labour market tightness. However, the extent of labour market tightness should not necessarily be interpreted as structural changes in the demand and supply of labour. The difference between short-term and longer-term factors is illustrated in Figure 2.8. This figure shows for the Netherlands that growth in employment is generally correlated with GDP growth, but also that it lags behind economic growth and fluctuates less than economic growth. With limited fluctuations in the size of the potential working population, the business cycle constantly leads to either unemployment or labour shortages as time evolves.
66%
67%
68%
69%
70%
71%
72%
73%
74%
2000 2002 2004 2006 2008 2010 2012 2014 2016
14 CHAPTER 2
SEO AMSTERDAM ECONOMICS
Figure 2.8 Employment growth is less volatile and lags behind GDP growth in the Netherlands
Source: CBS Statline
Job vacancy statistics provide useful information about the level and structure of labour demand. The job vacancy rate is measured by the amount of vacancies per thousand employees. This vacancy rate may, in part, reflect the unmet demand for labour, but it could also reflect potential mismatches between the skills and availability of those who are unemployed and those sought by employers. For this reason, job vacancy statistics are used by the European Commission and the European Central Bank (ECB) to analyse and monitor the development of labour markets at national and European levels.
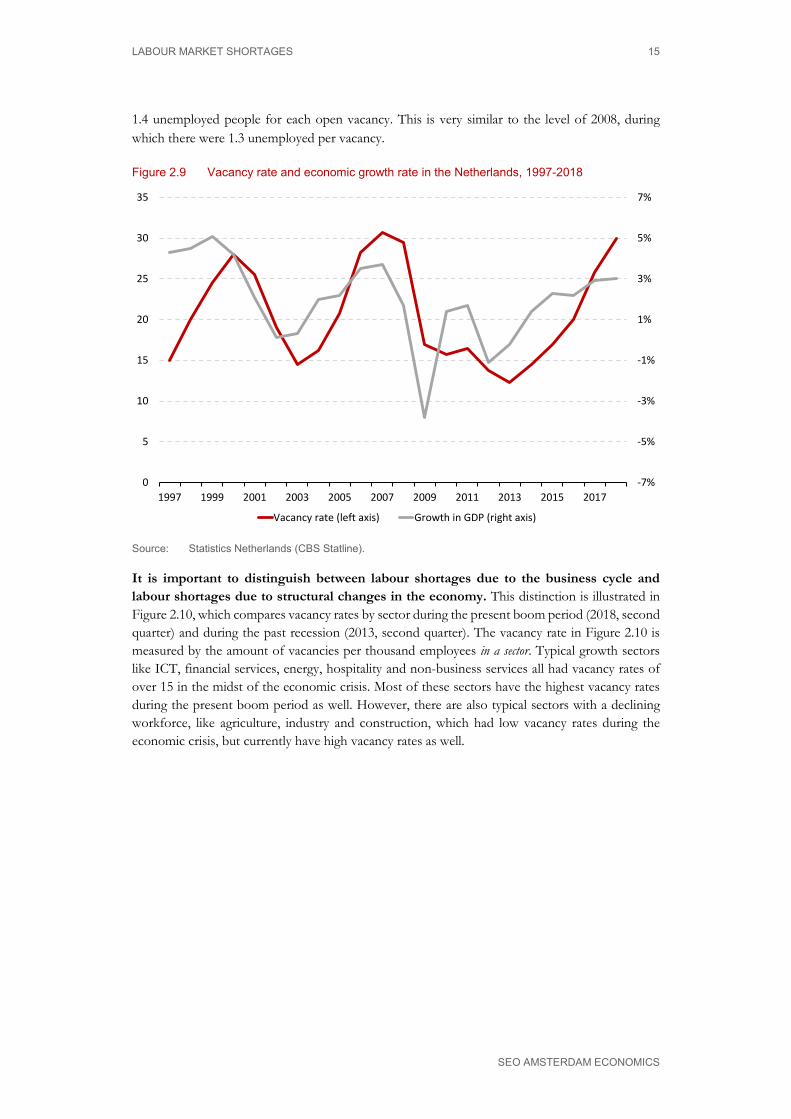
The Netherlands The number of vacancies in the Netherlands has been rising rapidly in recent years. Since 2017, more than one million vacancies have been created each year. This is the highest number since the start of the financial crisis. The last low point was reached in mid-2013 with 91 thousand vacancies in a quarter. Figure 2.9 shows the development of the vacancy rate in the Netherlands since 1997, along with economic growth. The vacancy rate is strongly correlated with economic growth and fluctuates between 10 and 30 vacancies per thousand employees. This means that, following a recession, the number of vacancies may triple during the subsequent upswing. As Figure 2.9 shows, the highest vacancy rate in the last two decades occurred after a period of strong economic growth in 2007 (31), while the lowest vacancy rate occurred after the double dip in 2013 (12). The most recent data on vacancy rates in the Netherlands suggest that the Dutch labour market is tight for the third consecutive quarter, which means that the demand for labor is above average and the available supply is relatively low. During the second quarter of 2018, the vacancy rate increased from 29 to 31. During the same quarter a year earlier, the vacancy rate equaled 26 out of a thousand jobs. Similarly, in the second quarter of 2018 there were on average
-4%
-2%
0%
2%
4%
6%
1969 1972 1975 1978 1981 1984 1987 1990 1993 1996 1999 2002 2005 2008 2011 2014
Growth in GDP Growth in employment (people)
LABOUR MARKET SHORTAGES 15
SEO AMSTERDAM ECONOMICS
1.4 unemployed people for each open vacancy. This is very similar to the level of 2008, during which there were 1.3 unemployed per vacancy.
Figure 2.9 Vacancy rate and economic growth rate in the Netherlands, 1997-2018
Source: Statistics Netherlands (CBS Statline).
It is important to distinguish between labour shortages due to the business cycle and labour shortages due to structural changes in the economy. This distinction is illustrated in Figure 2.10, which compares vacancy rates by sector during the present boom period (2018, second quarter) and during the past recession (2013, second quarter). The vacancy rate in Figure 2.10 is measured by the amount of vacancies per thousand employees in a sector. Typical growth sectors like ICT, financial services, energy, hospitality and non-business services all had vacancy rates of over 15 in the midst of the economic crisis. Most of these sectors have the highest vacancy rates during the present boom period as well. However, there are also typical sectors with a declining workforce, like agriculture, industry and construction, which had low vacancy rates during the economic crisis, but currently have high vacancy rates as well.
-7%
-5%
-3%
-1%
1%
3%
5%
7%
0
5
10
15
20
25
30
35
1997 1999 2001 2003 2005 2007 2009 2011 2013 2015 2017
Vacancy rate (left axis) Growth in GDP (right axis)

16 CHAPTER 2
SEO AMSTERDAM ECONOMICS
Figure 2.10 Vacancy rates by sector in the Netherlands, comparison between high economic growth (2018-II) and low economic growth (2013-II)
Source: CBS Statline (per 1000 workers in the sector)
Europe Similar to the Netherlands, the job vacancy rate for the EU-28 is currently also at its highest point since the crisis, currently up 2.2 percent (Figure 2.11). Nonetheless, there are only four countries within the EU with a higher vacancy rate than the Netherlands (Czech Republic, Belgium, Germany and the UK), indicating that the Dutch labour market is relatively tight compared to its EU’s counterparts.
Figure 2.11 Quarterly job vacancy rates for the European Union, 2008-2018
Source: Eurostat (https://ec.europa.eu/eurostat/statistics-
explained/index.php/Job_vacancy_statistics#Job_vacancies_between_2008_and_2018)
0 10 20 30 40 50 60 70
Offshore and miningICT
Financial servicesEnergy
HospitalityNon-business services
TradeBusiness services
AgricultureIndustry
Public sectorConstruction
Water and waste managementHealth
Transport and logisticsCulture and sports
EducationReal estate
2013-II 2018-II
0,0
0,5
1,0
1,5
2,0
2,5
2007 2008 2009 2010 2011 2012 2013 2014 2015 2016 2017 2018

LABOUR MARKET SHORTAGES 17
SEO AMSTERDAM ECONOMICS
2.3.4 Structural change
Changing preferences and technological developments cause structural changes that affect labour demand. The demand for labour in industry has declined for decades, not because less is produced by industry, but more is produced by machines instead of workers. This type of technological development causes labour productivity to increase as more production is realised per worker. Similar increases in labour productivity can be found in agriculture and construction, and more recently in retail, distribution and financial services. This could lead to declining labour demand in these sectors, which could be compensated by an increase in the demand for labour in other sectors, like the ICT sector, hospitality and non-business services. Rising incomes and ageing populations are other structural changes that affect the type of demand for labour. An increase in income levels has influence on the demand for personal services, like catering, cleaning, private transport services and wholesale. In addition, ageing increases the demand for health services. Figure 2.12 shows these trends in terms of the changing distribution of labour among sectors of the economy in the Netherlands.
Figure 2.12 Growing and declining sectors in the Netherlands, 1969-2016
Source: CBS Statline
Sectors that have shown the highest increases in employment shares over time are business services, health, ICT, culture, and sports and education. This is shown in Figure 2.12, where sectors are ranked by the growth in their share in total employment (expressed in labour years) between 1969 and 2016. All sectors that have increased their share in total employment are marked as green, while all sectors that have decreased their share in total employment are orange. Financial services has long been a growing sector, but suffered from the recent economic crisis. Declining sectors in terms of employment are mainly the industry sector, construction, agriculture and the public sector.
0%
10%
20%
30%
40%
50%
60%
70%
80%
90%
100%
1969
1972
1975
1978
1981
1984
1987
1990
1993
1996
1999
2002
2005
2008
2011
2014
Business services
Health
IT
Culture and sports
Education
Real estate
Financial services
Hospitality
Transport and logistics
Trade
Public sector
Agriculture
Construction
Industry and energy
18 CHAPTER 2
SEO AMSTERDAM ECONOMICS
These trends are expected to continue for most sectors. This means that structural growth in labour demand is expected for business services, health (due to ageing population and technological change) and ICT (technological change), while structural decline in labour demand is expected for industry (as technological change leads to higher labour productivity), construction (ageing population and slower population growth) and agriculture (due to technological change and a restriction of available land). A special note must be made with regard to the energy sector, for which a growth in employment is expected due to the trend towards energy transition. In the long run, growth sectors are confronted with labour shortages, declining sectors are confronted with layoffs and unemployment. Adjustment processes that move labour from declining to growing sectors need time to take place. This structural change does not prevent labour market shortages to arise in declining sectors during periods of high economic growth, as was noticed in section 2.3.3.
2.3.5 Does the qualitative mismatch increase?
There may be one more reason for shortages to arise or become larger as time evolves: the qualitative mismatch between the demand and supply of labour. This mismatch may become larger when for example the education system can or does not provide adequate education to prepare people for jobs for which the requirement change more rapidly due to technological development. Or when the transition between jobs or the transition between labour market states becomes more difficult due to market failure. When the qualitative mismatch between the demand and supply of labour grows, the long term level of unemployment and vacancies both rise, meaning that more people become unemployed at the same time that more vacancies remain unfilled. The vacancy unemployment (VU) curve is an often used tool in discussions about the (mismatch in) the labour market. It shows how the vacancy rate and unemployment are related (see Figure 2.13). During an economic downturn, the amount of available vacancies decreases and the rate of unemployment starts to increase (see for example the period 2008-2013). As soon as the economy starts recovering, the vacancy rate starts to increase, followed by a decrease in the unemployment rate (see for example the period from 2004-2007). The latter is also a description of the state of the economy since 2014, as the vacancy rate has risen from around 1.25 percent to 2.25 percent, and the unemployment rate has decreased considerably from 7.8 percent to 3.9 percent. All of these movements have more or less been along the average curve.

LABOUR MARKET SHORTAGES 19
SEO AMSTERDAM ECONOMICS
Figure 2.13 Vacancy unemployment curve shows stable mismatch in the Netherlands (2003-2019)
Source: UWV, Labour market projections 2018-2019
The UV curve for the Netherlands does not suggest an increase in qualitative labour market mismatches. If that were the case, the curve would have shifted to the right (more unemployment and the same number of vacancies) or upwards (more vacancies and the same rate of unemployment. The OECD (2012) concluded that the Dutch labor market has adapted well to globalisation, resulting in relatively high employment and little structural mismatch. Two other international studies5 looked into the question of whether and to what extent the VU curve has shifted since the large global recession. Both studies found that there was a shift to the right for a number of countries (the United States, Spain and Portugal and the United Kingdom) indicating an increasing mismatch. In the Netherlands and several other countries, the recession mainly caused shifts along the curve, indicating there had not been an increase in mismatches. Willemse-Jacobson (2018) recently concluded that mismatches had, in fact, decreased.
2.4 Projections of labour market shortages The current labour market shortages arise from a combination of an ageing population, structural economic changes and high economic growth, while mismatches are stable over time. For the next 2 to 20 years, labour shortages may become larger when economic growth continues or structural changes intensify, or may slowly disappear due to adjustment mechanisms over time. Since labour shortages stem from different reasons, each with their own dynamics in the labour market, projections of labour shortages are difficult to make, particularly for the long run.
5 Hobijn and Sahin (2013) and Destafanis and Mastromatteo (2015)

20 CHAPTER 2
SEO AMSTERDAM ECONOMICS
Demographic changes are long-term in nature and easier to predict than other factors. As a result, adjustment mechanisms are likely to reduce shortages from demographic developments in the long run. Instead, structural changes in the economy could well arise continuously, provoking new adjustment mechanisms as well as new shortages all of the time, causing shortages over a longer period of time. Labour shortages from business cycle development are typically temporary in nature and may provoke economic growth to slow down, eventually leading to a new economic slowdown and a reduction in labour shortages as a result. Together, these mechanisms may result both in larger and smaller labour market shortages in the long run. This section summarises the existing projections of labour shortages for both the Netherlands and Europe.
Netherlands The Research Centre for Education and the Labour Market (ROA) publishes a bi-annual report in which they set out their 5-year prognosis of the Dutch labour market (2017). Given the positive economic growth is projected to continue in the years to come (see for example CPB Forecast Central Economic Plan, 2018), they foresee a positive job creation in the period up to 2022 (expansion demand), of on average 1 percent per year. This amounts to 520 thousand employees over six years (2017-2022). In total, 2.1 million job openings are expected in these six years. Out of these job openings, 1.5 million are expected due to the demand for replacement as a consequence of people changing jobs, retirements, and people temporarily leaving the labour market (replacement demand). Often, replacement demand provides more job opportunities than expansion demand, which means that there will still be job opportunities even if the overall level of employment falls. UWV and ROA have both made projections for sectorial developments on the labour market. In these projections, they take into consideration all developments related to the labour market. UWV made sectorial projections up until 2019. It expects the most amount of jobs within the next year to be created (due to expansion demand) in the sectors ‘temporary employment agencies and job placement services’, ‘health and wellbeing’, ‘construction’, ‘catering industry’, and ‘information and communication’, see Figure 2.14. Contrarily, it expects that the sectors ‘financial services’, ‘agriculture, forestry and fishing’ and ‘cleaning companies and gardeners’ will realize negative employment changes.

LABOUR MARKET SHORTAGES 21
SEO AMSTERDAM ECONOMICS
Figure 2.14 Projected change in number of jobs in the Netherlands (x1000) in 2018-2019
Source: UWV Labour market projections 2018-2019
ROA’s sectorial growth projections go up to 2022. It expects that the highest rate of job creation will take place in the ‘health’ sector, with an average yearly increase of 3.1 percent, followed by wholesale (1.9 percent) and construction (1.7 percent). On the other side of the spectrum, ROA expects that the sectors ‘agriculture, forestry and fishing’ and ‘chemical industry’ will realize an average yearly decline of 1.1 and 0.3 percent, respectively. These projections are similar to the predictions made by the UWV, which also predicted the health and constructions sectors to expand considerably and the agricultural sectors to do less well. Of the 21 sectors identified by ROA, up to 2022 16 sectors are expected to realize an increase in employment (due to expansion demand), 3 sectors are expected to remain stagnant, and 2 sectors are expected to realize a decrease. The sectors with an above average increase in employment are (in order of growth rate): 1. Health 2. Wholesale 3. Specialist business services 4. Construction 5. Information and communication (ICT) 6. Transport and storage 7. Catering industry These statistics provide a good grasp of the sectors in which shortages are likely to arise, although they do not include any information of the supply of labour in these sectors. In Table 2.1, ROA provides similar type of statistics for a comprehensive list of 12 occupational groups. The occupational groups with the highest number of job openings are ‘business economics and administrative occupations’, ‘technical occupations’, ‘health and wellbeing occupations’ and ‘transport and logistics occupations’.
-20 -10 0 10 20 30 40 50 60 70 80
Financial servicesAgriculture, forestry and fishing
Cleaning companies and gardenersRental and trade of real estate
Other services (incl. households)Industry
Transport and storagePublic administration
Rental and other business servicesCulture, sport and recreation
WholesaleRetail
EducationSpecialist business services
Information and communicationCatering industry
ConstructionHealth care and well-being
Employment agencies and job placement services
Employees Self-employed
22 CHAPTER 2
SEO AMSTERDAM ECONOMICS
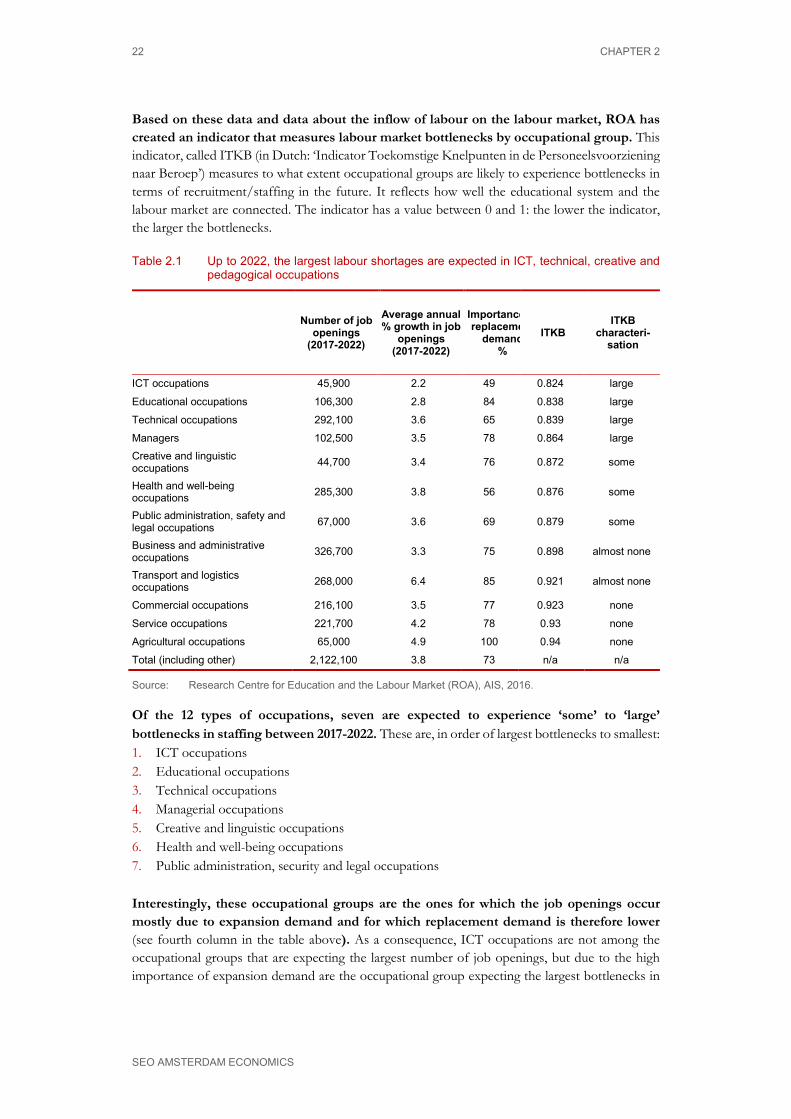
Based on these data and data about the inflow of labour on the labour market, ROA has created an indicator that measures labour market bottlenecks by occupational group. This indicator, called ITKB (in Dutch: ‘Indicator Toekomstige Knelpunten in de Personeelsvoorziening naar Beroep’) measures to what extent occupational groups are likely to experience bottlenecks in terms of recruitment/staffing in the future. It reflects how well the educational system and the labour market are connected. The indicator has a value between 0 and 1: the lower the indicator, the larger the bottlenecks.
Table 2.1 Up to 2022, the largest labour shortages are expected in ICT, technical, creative and pedagogical occupations
Number of job openings
(2017-2022)
Average annual % growth in job
openings (2017-2022)
Importance replaceme
demand %
ITKB ITKB
characteri-sation
ICT occupations 45,900 2.2 49 0.824 large
Educational occupations 106,300 2.8 84 0.838 large Technical occupations 292,100 3.6 65 0.839 large Managers 102,500 3.5 78 0.864 large Creative and linguistic occupations 44,700 3.4 76 0.872 some
Health and well-being occupations 285,300 3.8 56 0.876 some
Public administration, safety and legal occupations 67,000 3.6 69 0.879 some
Business and administrative occupations 326,700 3.3 75 0.898 almost none
Transport and logistics occupations 268,000 6.4 85 0.921 almost none
Commercial occupations 216,100 3.5 77 0.923 none
Service occupations 221,700 4.2 78 0.93 none Agricultural occupations 65,000 4.9 100 0.94 none Total (including other) 2,122,100 3.8 73 n/a n/a
Source: Research Centre for Education and the Labour Market (ROA), AIS, 2016.
Of the 12 types of occupations, seven are expected to experience ‘some’ to ‘large’ bottlenecks in staffing between 2017-2022. These are, in order of largest bottlenecks to smallest: 1. ICT occupations 2. Educational occupations 3. Technical occupations 4. Managerial occupations 5. Creative and linguistic occupations 6. Health and well-being occupations 7. Public administration, security and legal occupations
Interestingly, these occupational groups are the ones for which the job openings occur mostly due to expansion demand and for which replacement demand is therefore lower (see fourth column in the table above). As a consequence, ICT occupations are not among the occupational groups that are expecting the largest number of job openings, but due to the high importance of expansion demand are the occupational group expecting the largest bottlenecks in

LABOUR MARKET SHORTAGES 23
SEO AMSTERDAM ECONOMICS
future recruitment. This occupational group belongs to a sector that is expected to increase due to the technological changes occurring on the labour market.
Europe The European Centre for the Development of Vocational Training (Cedefop) foresees that all job opportunities between 2015 and 2025 created through expansion demand will require high-level qualifications (ISCED 97 levels 5 and 6) (2015). They make the same projection for most job opportunities overall in the Netherlands. However, because of high replacement demand, a significant share of job opportunities will require medium-level qualifications. Compared to the Netherlands, the job opportunities created in the EU-28 will be more skewed towards lower-skilled occupations (Figure 2.15).
Figure 2.15 The Dutch distribution of total job opportunities is more skewed towards high-skilled occupations than that of the EU-28 (2013-2025)
Source: Cedefop (2015)
For the longer run, there are no systematic projections available for labour shortages or for labour demand and supply from which they result. The main reason is that projections longer than 10 years ahead are too uncertain to be informative. Current trends may continue, which means that digital and technical occupations may become more important, just like health, business and service occupations. At the same time, the demand for occupations in agriculture, industry and construction are expected to further decline, but by how much is difficult to project. At the same time, labour supply is strongly affected by migration, which varies strongly over time and is therefore also difficult to project. Because both labour supply and labour demand are uncertain in the long run, labour shortages are even more uncertain to predict. One of the reasons for that uncertainty in the long run, is that mismatches between demand and supply provoke adjustment mechanisms that diminish labour shortages in the long run (as described in Section 1.2). At the same time, new developments at the supply or demand side may induce new labour market shortages. One of the aspects in which the labour market changes constantly is in required skills. The next section elaborates on this.
8% 13%2%4%
4%
5%2%
6%17%
16%14%
9%10%
13%
34%25%
9% 9%
N L E U - 2 8
Elementary occupations
Plant and machine operators, and assemblers
Craft and related trades workers
Skilled agriculutural, forestry and fishery workers
Service and sales workers
Clerical support workers
Technicians and associate professionals
Professionals
Managers
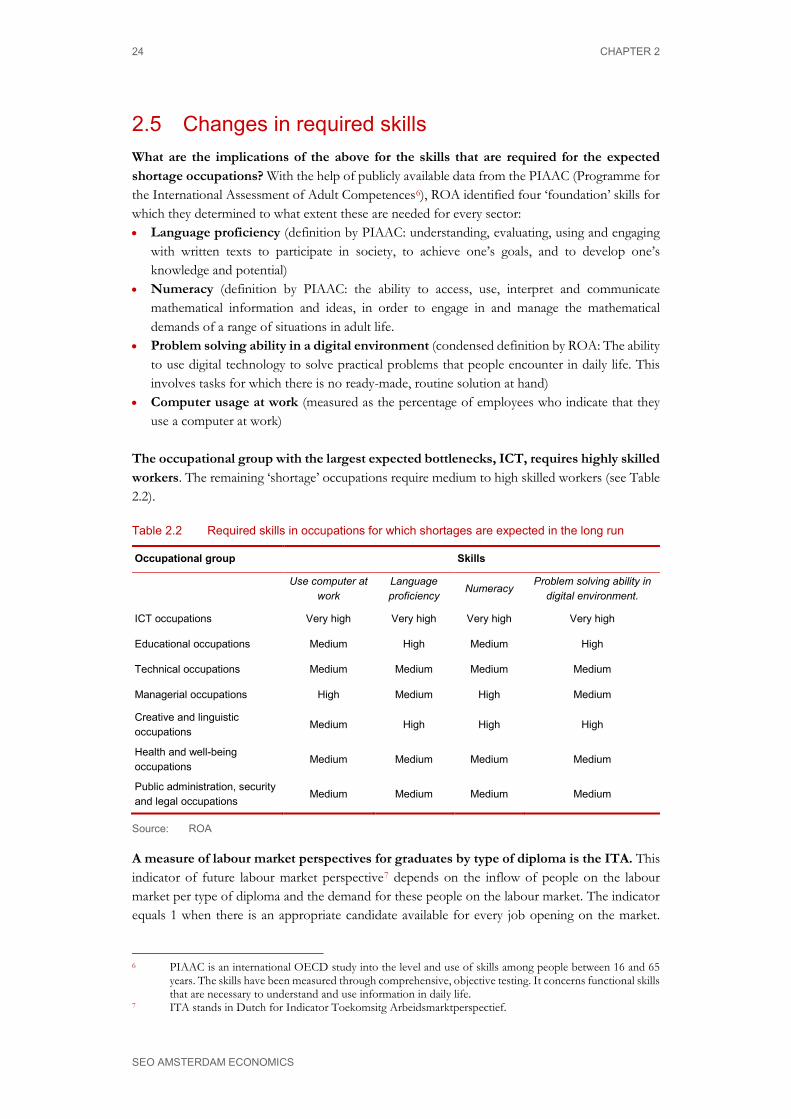
24 CHAPTER 2
SEO AMSTERDAM ECONOMICS
2.5 Changes in required skills What are the implications of the above for the skills that are required for the expected shortage occupations? With the help of publicly available data from the PIAAC (Programme for the International Assessment of Adult Competences6), ROA identified four ‘foundation’ skills for which they determined to what extent these are needed for every sector: • Language proficiency (definition by PIAAC: understanding, evaluating, using and engaging
with written texts to participate in society, to achieve one’s goals, and to develop one’s knowledge and potential)
• Numeracy (definition by PIAAC: the ability to access, use, interpret and communicate mathematical information and ideas, in order to engage in and manage the mathematical demands of a range of situations in adult life.
• Problem solving ability in a digital environment (condensed definition by ROA: The ability to use digital technology to solve practical problems that people encounter in daily life. This involves tasks for which there is no ready-made, routine solution at hand)
• Computer usage at work (measured as the percentage of employees who indicate that they use a computer at work)
The occupational group with the largest expected bottlenecks, ICT, requires highly skilled workers. The remaining ‘shortage’ occupations require medium to high skilled workers (see Table 2.2).
Table 2.2 Required skills in occupations for which shortages are expected in the long run
Occupational group Skills
Use computer at work
Language proficiency
Numeracy Problem solving ability in
digital environment.
ICT occupations Very high Very high Very high Very high
Educational occupations Medium High Medium High
Technical occupations Medium Medium Medium Medium
Managerial occupations High Medium High Medium
Creative and linguistic occupations
Medium High High High
Health and well-being occupations
Medium Medium Medium Medium
Public administration, security and legal occupations
Medium Medium Medium Medium
Source: ROA
A measure of labour market perspectives for graduates by type of diploma is the ITA. This indicator of future labour market perspective7 depends on the inflow of people on the labour market per type of diploma and the demand for these people on the labour market. The indicator equals 1 when there is an appropriate candidate available for every job opening on the market.
6 PIAAC is an international OECD study into the level and use of skills among people between 16 and 65
years. The skills have been measured through comprehensive, objective testing. It concerns functional skills that are necessary to understand and use information in daily life.
7 ITA stands in Dutch for Indicator Toekomsitg Arbeidsmarktperspectief.

LABOUR MARKET SHORTAGES 25
SEO AMSTERDAM ECONOMICS
Values smaller than 1 indicate that the people with those diplomas will have little trouble finding a job, whilst values larger than 1 indicate that the supply of graduates of a particular degree exceeds the demand, and that therefore their labour market prospects are less favourable. In light of this study, diplomas with an ITA smaller than 1 are the most interesting, as these are the ones for which demand is higher than supply. The diplomas for which is the case are presented in Table 2.3. Categorised by educational level, these are the following: MBO (medium educated – vocational): • Technical diplomas • ‘Green’ diplomas
HBO (higher educated – vocational): • Technical diplomas • Educational diplomas • Health diplomas
WO (academically educated): • Technical diplomas • Medical diplomas • Behavioural and societal diplomas • Educational diplomas
Graduates with higher education diplomas have the best labour market opportunities. For four such diplomas, demand exceeds supply. The same is the case for three types of diplomas in higher vocational education, whilst it is only the case for two diplomas in medium level education. Interestingly, the demand for graduates that obtained technical diplomas exceeds their supply for every skills level. The demand for graduates with educational diplomas exceeds supply for the higher and academically educated.

26 CHAPTER 2
SEO AMSTERDAM ECONOMICS
Table 2.3 Technical, health-related, and education-related diplomas are viewed as having the best labour market perspectives in the Netherlands during 2017-2022
ITA Characterization labour market perspectives
mbo 4 technical 0.97 good
mbo 4 'green' 0.99 good
mbo 2/3 technical 1.01 moderate
mbo 4 health and well-being 1.08 moderate
hbo technical 0.87 good
hbo education 0.90 good
hbo health 0.97 good
hbo agriculture and 'nature' 1.00 good
wo technical 0.95 very good
wo medical 0.96 good
wo behavioural and societal 0.96 good
wo educational 0.99 good
Source: ROA (AIS) * ITA = Future labour market perspective by occupation (see text for explanation)
Specific professional knowledge and a diploma or a certificate appear to be major reasons for why some vacancies are harder to fill than others. Other important requirements are relevant work-experience, the possession of a driver’s license, Dutch language skills and foreign language skills. These are the conclusion of the UWV in their latest report (2018), where they set out what the job requirements are for both difficult and easily fillable vacancies. As shown in Figure 2.16, the requirements for vacancies that are more difficult to fill are more extensive.

LABOUR MARKET SHORTAGES 27
SEO AMSTERDAM ECONOMICS
Figure 2.16 Vacancies that are more difficult to fill require more and different skills
Note: Multiple answers were possible per respondent. Source: UWV (2018)
2.6 Conclusions There are a number of reasons why European labour markets can be expected to face certain shortages, or increased labour market tightness. The demographic trend of ageing European populations is one important reason. Other reasons are structural changes in the economy that result from chancing preferences and technological developments. In the short run, the business cycle has a large influence on labour shortages, even for sectors and occupations that become less important in the long run. However, labour shortages tend to provoke adjustment mechanisms that reduce these shortages in the long run. It is therefore very difficult to project the exact size of the supply and demand of labour in the long run, let alone labour shortages that result from a mismatch between the two. For that reason, there are no projections of long-term shortages in the literature that go beyond a horizon of 10 years, and even medium-term projections are difficult to make. Projected labour shortages for the Netherlands differ depending on the time horizon. In the short run, the high economic growth at this moment leads to labour shortages in health, construction, hospitality, ICT, business services, education and trade. In the medium run, the largest labour shortages are expected in business services, health, ICT, hospitality, wholesale and transport and logistics. These projections become more uncertain as time evolves. Typical occupations that are needed in the long run and already show low supply, are ICT occupations, pedagogical occupations, technical occupations, managerial occupations, creative and linguistic occupations, and health and well-being occupations. Typical skills needed for these occupations are computer skills, (Dutch) language proficiency, numeracy and problem solving abilities in a digital environment. This becomes even more important when the
0% 10% 20% 30% 40% 50% 60% 70%
No, no job requirements
Yes, other job requirements
Yes, (professional) diploma or certificate
Yes, specific professional knowlegde
Yes, relevant work experience
Yes, driver's licence BE
Yes, Dutch language skills
Yes, language skills in other language
(very) difficult-to-fill vacancies (very) easily fillable vacancies

28 CHAPTER 2
SEO AMSTERDAM ECONOMICS
educational requirements of jobs increase, as has already been taking place and is expected to continue in the future. With respect to the specific research questions, the literature study provides the following answers: 1. Will the demographic developments potentially lead to shortages on the labour market in the Netherlands and
the European Union in the next 2, 5, 10 and 20 years, and if so, is it possible to give an indication of the size and kind of shortages, specified by sector and occupation?
The demographic trend of ageing populations will lead to labour market shortages throughout Europe, but the size of these shortages will decline over time. This is because adjustment mechanisms are expected to be provoked to solve these shortages: higher wages, technological change and labour migration, among others. In the short run (2 to 5 years), labour shortages are mainly caused by high economic growth, while in the medium run (5 to 10 years) labour market shortages mainly arise from structural changes to the economy due to technological progress and changing preferences. In the long run (20 years), the size and type of labour shortages becomes uncertain, due to ongoing adjustment mechanisms in the labour market. 2. What are the required skills for occupations/sectors in the Netherlands where an increasing shortages is
expected: education, diplomas, experience, language skills? Skills that are typical for occupations in which shortages are expected are computer skills, problem solving in a digital environment, language proficiency, and numeracy. In a number of ‘shortage sectors’ in the Netherlands (notably, education and healthcare), knowledge of the Dutch language is a requirement for many jobs. For some other shortage occupations, especially ICT and technical jobs, English language skills may be more important.

DUTCH LABOUR MARKET SHORTAGES AND POTENTIAL LABOUR SUPPLY FROM AFRICA AND THE MIDDLE EAST: IS THERE A MATCH? 29
SEOAMSTERDAM ECONOMICS
References to chapter 2 CBS Statline (https://statline.cbs.nl/) Cedefop (2015), Country forecasts: the Netherlands. Skill supply and demand up to 2025.
http://www.cedefop.europa.eu/en/publications-and-resources/country-reports/skills-forecasts
CPB (2013). Economische analyse van korte en lange termijn knelpunten op de arbeidsmarkt, CPB
Notitie 31 Mei, 2013. CPB (2018). Forecast: Central Economic Plan 2018. CPB Policy Brief June 2018.
https://www.cpb.nl/en/publication/forecast-central-economic-plan-2018 Destafanis, S. & Mastromatteo, G. (2015). The Beveridge Curve in the OECD Before and After
the Great Recession. Discussion Papers4_2015, CRISEI, University of Naples "Parthenope"
Van Duin, Huisman & Stoeldraijer (2017). Bevolkingsprognose 2017–2060: 18,4 miljoen inwoners
in 2060. CBS European Commission, Joint Research Centre (2018) Demographic and Human Capital Scenarios
for the 21st Century: 2018 assessment for 201 countries, Wolfgang Lutz, Anne Goujon, Samir KC, Marcin Stonawski, Nikolaos Stilianakis (Eds.), Publications Office of the European Union, Luxembourg, 2018, ISBN 978-92-79-78024-0, doi:10.2760/41776, EUR 29113.
Eurostat database (https://ec.europa.eu/eurostat) Hobijn, B. & Sahin, A. (2013). Beveridge Curve Shifts across Countries since theGreat Recession.
Federal Reserve Bank of San Francisco Working Paper Series. OECD (2012), OECD Economic Surveys: Netherlands 2012, OECD Publishing.
http://dx.doi.org/10.1787/eco_surveys-nld-2012-en UWV (2018). UWV arbeidsmarktprognose 2018-2019. https://www.uwv.nl/overuwv/kennis-
cijfers-en-onderzoek/arbeidsmarktinformatie/uwv-arbeidsmarktprognose-2018-2019.aspx ROA (AIS), 2016. (https://roastatistics.maastrichtuniversity.nl/) ROA (2017), De arbeidsmarkt naar opleiding en beroep tot 2022. ROA-R-2017/10, Maastricht
(http://roa.sbe.maastrichtuniversity.nl/?page_id=789) Willemse-Jacobson, M. (2018), Mismatch op de Nederlandse arbeidsmarkt is afgenomen.
Economisch Statistische Berichten , 11 October 2018: https://esb.nu/kort/20045402/mismatch-op-de-nederlandse-arbeidsmarkt-is-afgenomen

DUTCH LABOUR MARKET SHORTAGES AND POTENTIAL LABOUR SUPPLY FROM AFRICA AND THE MIDDLE EAST: IS THERE A MATCH? 31
SEOAMSTERDAM ECONOMICS
3 Migration Trends and Aspirations
This chapter provides an overview of past migration flows and current migration stocks. The following definitions are used: • Migrants. While there is no formal legal definition of the term ‘migrant’, the United Nations
Department of Economic and Social Affairs (UNDESA 1998) has defined an international migrant as “any person who changes his or her country of usual residence”, irrespective of the reason for migration or legal status. 8
• Immigrants. The term ‘immigrants’ is often used in statistical publications to denote the stock of people in a population born outside the country.9 In European publications, the term ‘migrant’ is typically preferred to ‘immigrant’. In the United States, the term ‘immigrant’ is more often used.
• Labour migrants are migrants that have entered the country of destination on a special labour migrant visa. (So not all ‘migrant workers’ are labour migrants).
• Family migrants are migrants who are admitted for family formation or reunification. • Refugees are migrants who entered the country as asylum seekers and who were subsequently
provided with official refugee status. The United Nations High Commissioner for Refugees (UNHCR) defines refugees as “persons who are outside their country of origin for reasons of feared persecution, conflict, generalised violence, or other circumstances that have seriously disturbed public order and, as a result, require international protection.”10
• Refugee status holders / asylum status holders. In the Netherlands, asylum seekers can, if their claim is evaluated positively, obtain the status of ‘asylum status holder’ on either individual grounds or subsidiary protection. Dutch law does not differentiate between these two statuses, and they are addressed together as ‘asylum status holders’ (in Dutch: ‘asiel-statushouders’. However, since this is a term specific to the Netherlands we will use the more commonly accepted term of ‘refugees,’ which includes those who obtained that status on subsidiary protection grounds.
• Asylum seekers are migrants that are seeking asylum but do not yet have refugee status. • Highly skilled migrants are a special type of labour migrants who in some countries can
obtain a special labour migrant visa (‘kennismigranten’ in the Netherlands). • Migrant workers are any types of migrants (labour migrants, refugees, or family migrants) who
are working. The UN Convention on the Rights of Migrants defines a migrant worker as a
8 UNDESA (1998), Recommendations on Statistics of International Migration, United Nations Statistical
Papers, Series M, No. 58, Rev. 1: https://unstats.un.org/unsd/publication/SeriesM/SeriesM_58rev1E.pdf A distinction is also made here between short-term or temporary migration, covering movements with a duration between three and 12 months, and long-term or permanent migration, referring to a change of country of usual residence for a duration of one year or more. See UNDESA (1998) for definitions of “country of usual residence”, “long-term migrant” and “short-term migrant”. In this report, we typically refer to long-term migrants. See also Appendix A for further definitions.
9 Eurostat defines an “immigrant” as “a person undertaking an immigration,” where “immigration is the action by which a person establishes his or her usual residence in the territory of a Member State for a period that is, or is expected to be, of at least 12 months, having previously been usually resident in another Member State or a third country (Regulation (EC) No 862/2007 on Migration and international protection).”
10 The refugee definition can be found in the 1951 Convention and regional refugee instruments, as well as UNHCR’s Statute. See also https://refugeesmigrants.un.org/definitions
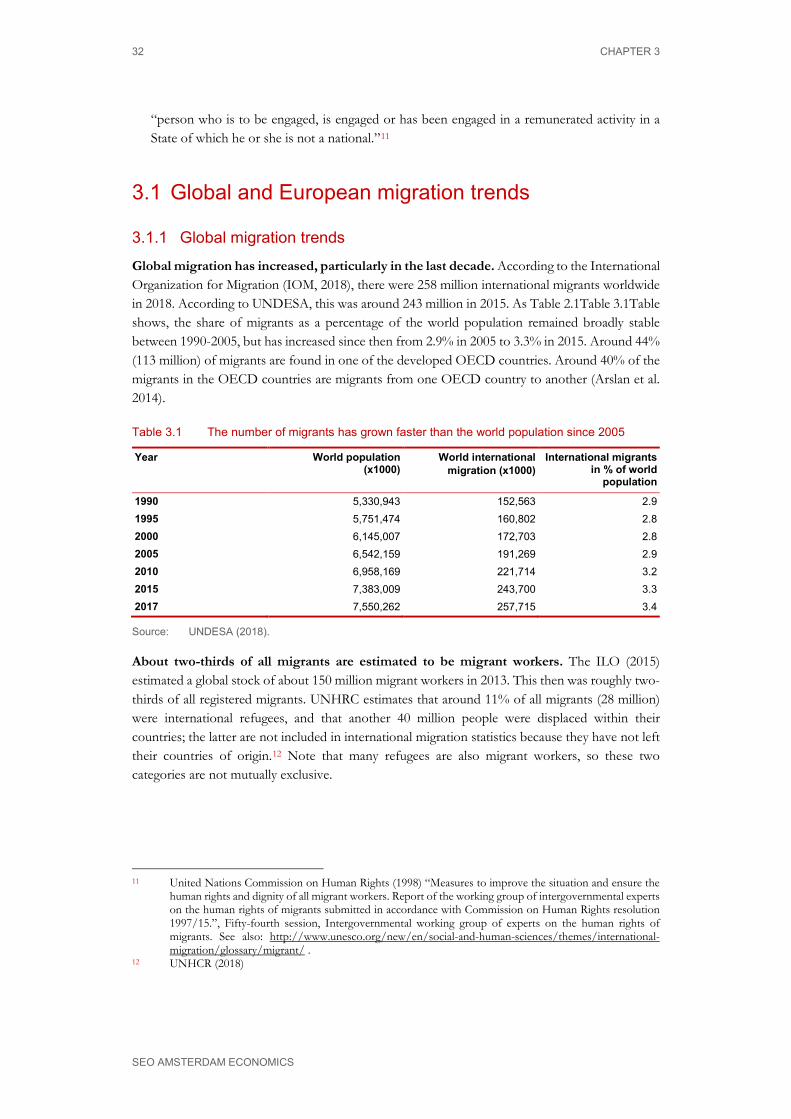
32 CHAPTER 3
SEO AMSTERDAM ECONOMICS
“person who is to be engaged, is engaged or has been engaged in a remunerated activity in a State of which he or she is not a national.”11
3.1 Global and European migration trends
3.1.1 Global migration trends
Global migration has increased, particularly in the last decade. According to the International Organization for Migration (IOM, 2018), there were 258 million international migrants worldwide in 2018. According to UNDESA, this was around 243 million in 2015. As Table 2.1Table 3.1Table shows, the share of migrants as a percentage of the world population remained broadly stable between 1990-2005, but has increased since then from 2.9% in 2005 to 3.3% in 2015. Around 44% (113 million) of migrants are found in one of the developed OECD countries. Around 40% of the migrants in the OECD countries are migrants from one OECD country to another (Arslan et al. 2014).
Table 3.1 The number of migrants has grown faster than the world population since 2005
Year World population (x1000)
World international migration (x1000)
International migrants in % of world
population
1990 5,330,943 152,563 2.9 1995 5,751,474 160,802 2.8 2000 6,145,007 172,703 2.8 2005 6,542,159 191,269 2.9 2010 6,958,169 221,714 3.2 2015 7,383,009 243,700 3.3 2017 7,550,262 257,715 3.4
Source: UNDESA (2018).
About two-thirds of all migrants are estimated to be migrant workers. The ILO (2015) estimated a global stock of about 150 million migrant workers in 2013. This then was roughly two-thirds of all registered migrants. UNHRC estimates that around 11% of all migrants (28 million) were international refugees, and that another 40 million people were displaced within their countries; the latter are not included in international migration statistics because they have not left their countries of origin.12 Note that many refugees are also migrant workers, so these two categories are not mutually exclusive.
11 United Nations Commission on Human Rights (1998) “Measures to improve the situation and ensure the
human rights and dignity of all migrant workers. Report of the working group of intergovernmental experts on the human rights of migrants submitted in accordance with Commission on Human Rights resolution 1997/15.”, Fifty-fourth session, Intergovernmental working group of experts on the human rights of migrants. See also: http://www.unesco.org/new/en/social-and-human-sciences/themes/international-migration/glossary/migrant/ .
12 UNHCR (2018)

MIGRATION TRENDS AND ASPIRATIONS 33
SEO AMSTERDAM ECONOMICS
3.1.2 Migration flows in Europe
The majority of the flow of migrants arriving in the EU13 originate from outside the EU, followed by migrants from other EU states and returning citizens (Figure 3.1). In 2016 (the year for which the latest harmonised Eurostat data are available), a total of 4.3 million migrants arrived in the EU. Out of these, around 2 million were non-EU, around 1.3 million were EU, and nearly a million were returning citizens. Germany received the largest number of these migrants (more than a million, or almost a quarter), followed by the UK, Spain, France and Italy (Eurostat 2018a). The Netherlands ranked 7th with around 190,000 migrants arriving in 2016, of which around 64,000 from the EU-28, 77,000 outside the EU-28, and 42,500 returning citizens (the rest are stateless or unknown citizens). Relative to the number of inhabitants (immigrants per capita), the Netherlands ranked 10th, still ahead of the UK, Spain and Italy.14
Figure 3.1 Most migrants in the EU-28 have arrived from outside the EU-28
Source: Eurostat (2018a), Immigration by citizenship, in millions.
In 2017, around 16.2 million Schengen visa applications were filed of which 14.7 million were approved (EU Commission 2018)15. This is up from 11.9 million in 2010 (European Commission 2011). In 2017, France received the most applications, followed by Germany, Italy, Spain and the Netherlands (Figure 3.2).
13 Henceforth, whenever the term ‘EU’ is used, we generally mean EU-28. 14 In per capita terms, the top 3 consists of Luxembourg, Malta, and Cyprus, all of which have relatively small
native populations. See https://ec.europa.eu/eurostat/statistics-explained/pdfscache/1275.pdf 15 A Schengen visa is a short-stay visa that allows a person to travel to any members of the Schengen Area,
per stays up to 90 days for tourism or business purposes, for more information see https://www.schengenvisainfo.com/
0
0,5
1
1,5
2
2,5
3
3,5
4
4,5
5
Total Non-EU Other Member State Returning Citizens

34 CHAPTER 3
SEO AMSTERDAM ECONOMICS
Figure 3.2 Approved Schengen Visa applications, 2017
Source: European Commission (2018), in millions.
Thus far, Germany and the Netherlands issued the most visas to Tunisian and Jordanian migrants. In Figure 3.3, the total number of issued Schengen Visas is shown. 170,996 and 47,448 visa were issued for Tunisian and Jordanian migrants respectively. However, the rejection rate for both countries is still well above the global average of 6.9%, at 16.5% and 15.6% respectively.
Figure 3.3 Issued Schengen Visas, 2017
Source: European Commission (2018)
0
2
4
6
8
10
12
14
16
Total France Germany Italy Spain Netherlands
0
20000
40000
60000
80000
100000
120000
140000
160000
180000
Tunisia Jordan
Total Germany Netherlands Rejected

MIGRATION TRENDS AND ASPIRATIONS 35
SEO AMSTERDAM ECONOMICS
3.1.3 Migration stocks in Europe
Most migrants in the EU hold a passport or were born outside the EU-28 (Table 3.2). In 2016 (latest year for which harmonised EU data are available), there were 38.5 million non-nationals in the EU-28, of which 56% (21.6 million) held a non-EU citizenship (4.2% of the EU population). In addition, there were 16.9 million persons living in one of the EU Member States with the citizenship of another member state. In total, around 10% of EU residents were born abroad (57.3 million people), of which two-third were born in a non-EU country and around one-third in another EU member state. The difference between the total of those born abroad and non-nationals (36.9-21.6 million) means that 18.8 million migrants who were born abroad were naturalised.
Table 3.2 Most migrants in the EU hold a passport from, or were born outside the EU-28
Non-EU (millions)
EU (millions)
Total (millions)
Non-nationals 21.6 16.9 38.5
Born abroad 36.9 20.4 57.3
Source: Eurostat (2018a)
Among the 21.6 non-EU non-nationals that lived in the EU in 2016, around 3 million came from Africa and 1.4 million from West Asia (Figure 3.4). More than half (over 860,000) of migrants from West Asia were Syrians, of which around two-thirds resided in Germany. Among the 3 million non-nationals of African descent, around 300,000 came from Nigeria, one-third of whom resided in the UK, and around 140,000 were Tunisians. The number of Jordanians in the EU-28 in 2016 was around 170,000, around one half of which resided in Germany.
Figure 3.4 Country distribution of non-nationals in the EU
Source: Eurostat (2018a)
0
0,5
1
1,5
2
2,5
3
3,5
Africa West Asia Nigerians Jordanians Tunisians

36 CHAPTER 3
SEO AMSTERDAM ECONOMICS
Most permits issued by EU member states in 2016 were for remunerated activities. As can be seen in Figure 3.5, EU member states issued more than two million permits for educational purposes, family reunification and remunerated activities in 2016. Most permits were issued for remunerated activities, but the differences are rather small. Most of the people holding family or education permits are likely to also enter the labour market in some capacity, they are thus only implicitly included in the immigrant integration data as discussed below. The ILO (2015) estimates that in 2015, there were around 36 million migrant workers in Southern, Northern and Western Europe.16
Figure 3.5 Most permits issued by EU member states in 2016 were for remunerated activities
Source: Eurostat (2018c)
The vast majority of permits for remunerated activities issued in 2016 were issued by Poland. These are overwhelmingly issued to Ukrainians who fill the gaps on the labour market created by large numbers of Polish workers in other EU countries. Figure 3.6 shows that Poland issued the most permits for remunerated activities, followed at distance by the UK. Other EU member states have a small and equal share approximately.
16 Note that this is only an estimate, which also includes non-EU countries. Further to this, the definition of
a migrant worker differs from that of a migrant in one important aspect: whilst a person is only recorded as a temporary migrant after a stay longer than 3 months or as migrants after a stay of more than 12 months, any foreigner working in another country is recorded as migrant worker, no matter how short or long the stay.
0
100.000
200.000
300.000
400.000
500.000
600.000
700.000
800.000
900.000
Education Family reunification Remunerated Activities
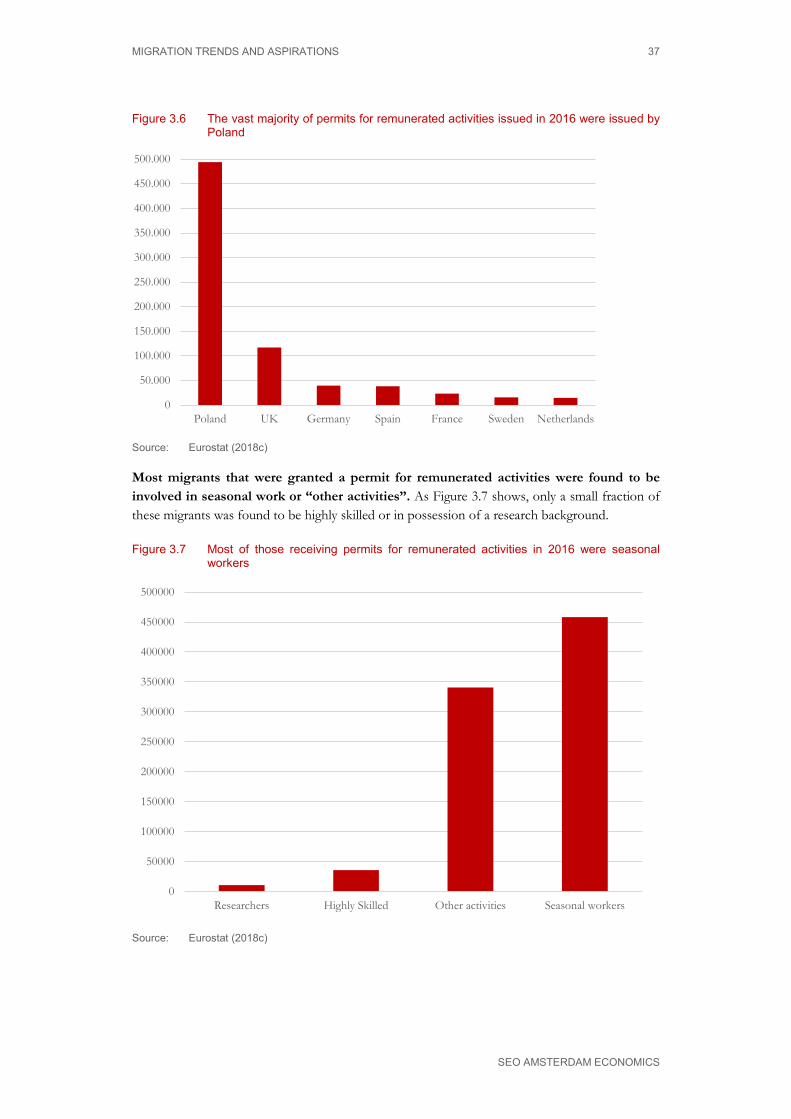
MIGRATION TRENDS AND ASPIRATIONS 37
SEO AMSTERDAM ECONOMICS
Figure 3.6 The vast majority of permits for remunerated activities issued in 2016 were issued by Poland
Source: Eurostat (2018c)
Most migrants that were granted a permit for remunerated activities were found to be involved in seasonal work or “other activities”. As Figure 3.7 shows, only a small fraction of these migrants was found to be highly skilled or in possession of a research background.
Figure 3.7 Most of those receiving permits for remunerated activities in 2016 were seasonal workers
Source: Eurostat (2018c)
0
50.000
100.000
150.000
200.000
250.000
300.000
350.000
400.000
450.000
500.000
Poland UK Germany Spain France Sweden Netherlands
0
50000
100000
150000
200000
250000
300000
350000
400000
450000
500000
Researchers Highly Skilled Other activities Seasonal workers

38 CHAPTER 3
SEO AMSTERDAM ECONOMICS
3.1.4 Characteristics of migrants
It is often suggested, but not always confirmed, that people with more education and more work experience are more likely to migrate. The older 2000 Eurostat/NIDI project surveying Turkey, Morocco, Ghana, Senegal and Egypt found that in Egypt, Turkey and Ghana, individuals with secondary or higher education were far more likely to migrate, and that migrants were generally better educated than non-migrants. In Senegal and Morocco, on the other hand, no differences in educational levels of the population were found (Eurostat 2000). In Turkey and Egypt, migrants were found to have more work experience (and therefore skills) before migration than non-migrants. However, in Morocco and Senegal, migrants were less likely than non-migrants to have any work experience (ibid.). For African migrants, the tendency to migrate seems to increase with education but not necessarily with work experience. Figure 3.8, Figure 3.9 andFigure 3.10 provide an overview of the educational background and work experience of Senegalese, Ghanaian, and Congolese migrants to various European countries. Data availability prevents a perfect comparison, but the general conclusion is that migrants from countries such as Ghana and Nigera tend to be higher educated, but have somewhat less work experience than their counterparts. Moreover, Congolese inhabitants with tertiary education were eight times more likely to migrate than those who are illiterate or only had primary education (Schoumaker et al., 2013).
Figure 3.8 Senegalese migrants in France, Italy and Spain tend to be low educated
Source: Baizán et al. (2013), based on data for 2010.
0%
10%
20%
30%
40%
50%
60%
70%
80%
90%
Primary Secondary Higher
Migrant Non-migrant

MIGRATION TRENDS AND ASPIRATIONS 39
SEO AMSTERDAM ECONOMICS
Figure 3.9 Ghanaian migrants in the Netherlands and the UK tend to have at least secondary education and significant work experience
Source: Black et al. (2013), based on data for 2010.
Figure 3.10 Congolese migrants in Belgium tend to be highly educated
Source: Flahaux et al. (2014), based on data for 2010
Based on OECD data, it appears that education levels of migrants in the OECD have remarkably improved, as the share of those with tertiary education rose by 70% in a decade. The OECD’s Databases on Immigrants in OECD Countries (DIOC) provide a comprehensive data on some key characteristics including the education of immigrants covering most OECD and
0%
10%
20%
30%
40%
50%
60%
70%
80%
90%
100%
Primary Secondary Tertiary Work experience
Migrant Non-migrant
0%
10%
20%
30%
40%
50%
60%
70%
Tertiary Work experience
Migrant Non-migrant

40 CHAPTER 3
SEO AMSTERDAM ECONOMICS
some other countries. DIOC data are available for 2000, 2005/6 and 2010/11. The most recent database (OECD-UNDESA, 2011) finds that, in 2010/11, there were about 35 million migrants with tertiary education, a third of which came from Asia. This level represents an unprecedented increase of 70% over the past ten years. This growth is mainly driven by migrants originating from Asia (79%), Africa (80%) and Latin America (84%). The number of tertiary educated migrant women increased by 79% between 2000/01 and 2010/11, much faster than the increase in the number of tertiary educated migrant men (Arslan et al. 2014). Of these highly-skilled migrants, 2.9 million were from Africa (OECD-UNDESA 2013, p. 1). The OECD DIOC data also suggest that highly skilled people are more likely to migrate. Generally, “for virtually all countries of origin, the emigration rate of the highly-skilled exceeds the total emigration rate reflecting the selectivity of migration by educational attainment” (OECD 2013, p. 4). In some countries, the rate of highly skilled women migration was particularly high. The share of highly-skilled migrants has increased across all regions, but has increased more in the US and Asia than in Europe. According to the OECD study, “international migrants are more highly educated than their native-born counterparts. In OECD countries, the number of migrants aged 15 and older with tertiary education is 31 million in 2010/11. The share of tertiary educated among migrants is 30%, compared to 24% for the native-born.” (OECD 2013, p. 15) One third of migrants in OECD countries, around 35 million, are still low educated, but much of this is driven by demand for low-skilled workers, notably in agriculture and the service sector. The share of highly-skilled foreign born immigrants in the Netherlands of 11.5% is lower than the OECD average of 13.7 and lower than in Germany (12.8%) or Sweden (16.6%).
Table 3.3 Characteristics of migrants in OECD countries, 2010/11
Immigrants in OECD 113 million
Highly-skilled immigrants 35 million
Highly-skilled from Africa 2.9 million, increase 80%
Increase in number of highly-skilled 70%
Increase of highly-skilled women 79%
Low-skilled immigrants 35 million, 33%
Source: OECD (2013).
The above suggests that there is a trend towards skilled and highly-skilled migration, notably to OECD countries. It also suggests that self-selected low-skilled migration is decreasing but that European countries are faring less well compared to the US and Asia. For instance, according to the DIOC database, there were in 2010/11 5,236 immigrants from Tunisia in the Netherlands, of which 18% had tertiary education. None of these was a recent arrival (one year or less of stay) and 55% arrived 1-5 years ago. This suggests that some may have acquired their tertiary education in the Netherlands. There are several lessons to be learned from the above: • In countries with higher levels of education, the better educated are more likely to migrate than
the lower educated. This has implications for the design of labour migration programmes and in particular for the choice of countries in which such programmes are implemented.
• While the trend points toward a global increase in highly-skilled migration, this type of migration grows faster in the US and Asia, which implies that there is scope for improvements with regards to enhancing competitiveness of Europe.

MIGRATION TRENDS AND ASPIRATIONS 41
SEO AMSTERDAM ECONOMICS
• Providing further education in countries of origin raises the skills level of potential future migrants.
3.1.5 Irregular migration
The number of irregular migrants17 is very difficult to estimate. The only years for which there are estimates of the stock of irregular immigrants in the EU are 2002, 2005 and 2008. Due to lack of funding, an update has not been generated. In 2008, there were an estimated 1.9 to 3.8 million irregular immigrants in the EU. In the Netherlands, a high-quality estimate suggested that there were 62,320 to 113,912 irregular migrants in 2005,18 whereas in Germany in 2008, there were an estimated 120,000 to 480,000.19 This was updated in 120,000 to 580,000 in 2014 (Vogel 2015). Some recent estimates suggest that there has been a decrease in the number of irregular migrants. Figure 3.16 shows that 435,786 persons staying irregularly on the territory of the EU were recorded in 2017, a decrease of 10% compared to a year earlier. However, this number does allow for people being detected more than once (Frontex 2018). Only a rough 35% of these recordings lead to a return to the country of origin. Half of these people have left the country on a voluntary basis, where the other half needed to be forced. Key obstacles to a successful return are usually humanitarian considerations, lack of travel documents or health issues. The most recorded nationality of irregular migrants was Ukrainian. As Figure 3.11 shows, besides Albania, the top ten is completed by Asian and African countries. The most frequent visa overstayers are Ukrainians, Albanians, Pakistanis, Algerians, Tunisians and partly Moroccans. The most often rejected asylum seekers are Iraqis, Afghans and Eritreans.20 Little further statistical information, apart from nationality, is available on the characteristics of irregular immigrants. However, a recent study conducted in the UK from 2014-2018 implies that in the UK a large proportion, 68%, had tertiary and another 26% at least secondary education; 13% even worked as professionals, meaning in jobs that required at least vocational training or a university degree (Düvell et al 2018). One measure of the flow of irregular migration is the number of illegal crossings detected at the external borders of the EU. These data, available from Frontex (2018), are shown in Table 3.4. They suggest that irregular migration has averaged between 70,000-150,000 detections per year, with peaks in 2015 and 2016 (related to the displacement crisis in Syria and Iraq). However, the Frontex data are likely substantially overstated as they include many instances of double counting. For example, there are many duplicate recordings for migrants that crossed into Greece, an EU country, then moved through the non-EU countries of Serbia or Bosnia and then re-entered the EU again through Hungary or Croatia. Furthermore, most of those individuals apply for asylum
17 Irregular migrants are individuals who due to their behaviour have no right to stay in their country of
residence, and who are therefore removable. 18 Irregular Migration Net, http://irregular-
migration.net/typo3_upload/groups/31/3.Database_on_IrregMig/3.2.Stock_Tables/Netherlands_Estimates_IrregularMigration_Oct09.pdf
19 Irregular Migration Net, http://irregular-migration.net/fileadmin/irregular-migration/dateien/3.Database_on_IrregMig/3.2.Stock_Tables/Germany_Estimates_IrregularMigration_Jul12.pdf
20 Visa overstayers are people that do not leave a country after their visa has expired.

42 CHAPTER 3
SEO AMSTERDAM ECONOMICS
and thus regularise their status. As a result, the number of irregular migrants is likely well below those recorded in the Frontex data. According to one source, the number for 2015 is likely to be closer to 1 million rather than the reported 1.8 million.
Table 3.4 Estimated irregular immigration flow, 2008-2017
2008 2009 2010 2011 2012 2013 2014 2015 2016 2017 151,000 104,599 104,060 141,051 72,437 107,365 283,538 1,822,117 511,047 204,718
Source: Frontex (2018)
Figure 3.11 Procedural handling of irregular immigrants in 2017
Note: The share of voluntary- versus forced returns is a rough fifty-fifty estimation. Source: Frontex (2018)
Finally, there is a coincidence between the availability of legal migration channels and irregular migration: notably between the visa rejection rate and irregular immigrants apprehended. The top nationalities of irregular immigrant sea arrivals in 2017 are more or less the same as the top nationalities with the highest visa rejection rates, amongst them Nigeria, Guinea and Senegal. And whereas the average Schengen visa rejection rate stands at 8.2% in 2017, it was twice as high for Tunisians and six times as high for Nigerians. This illustrates significant discrepancy between individuals who aspire to travel or migrate and those who are given permission to do so. It can be assumed that these high rejection rates impact well beyond the concerned individuals as they signal to a much broader community that regular migration is not a solution to all. This can have two outcomes: either people abandon their aspiration to migrate or they turn to irregular forms of migration.
0
50000
100000
150000
200000
250000
300000
350000
400000
450000
500000
Irregular immigrantresidents
Return decisions Effective decisions Voluntary return

MIGRATION TRENDS AND ASPIRATIONS 43
SEO AMSTERDAM ECONOMICS
Figure 3.12 Country of origin irregular immigrants apprehended on the territory of the EU in 2017
Source: Frontex (2018). The total number is estimated at 435,786 in 2017.
Table 3.5 Among African nationalities, Nigerians are the ones most frequently rejected for Schengen visa, while Tunisians have the lowest rejection rate****
Nationality Visas issued 2010
Visas issued 2017 Rejected 2017 Rejection rate
(2017) in %*
Irregular migrants
apprehended 2017**
Nigeria 50,616 37,531 43,901 52.5 18,262 Cote d’Ivoire 21,805 38,294 16,906 30.0 12,759 Guinea 9,266 7,418 5,837 43.5 12,161 Gambia*** n/a n/a n/a 37.9 8,220 Mali 13,125 13,462 5,017 26.0 7,686 Eritrea 2,233 1,206 1,114 47.8 7,272 Tunisia 94,533 179,996 34,621 16.5 6.415 Sudan 8,209 5,793 2,486 23.3 6,221 Senegal 33,598 40,714 26,225 37.9 6,000 Cameroon 20,921 24,446 11,168 30.4 2,584
* Eurostat (2018) ** Frontex (2018) *** Because Gambian citizens have to apply to the Schengen visa application centre in Dakar, Senegal,
their applications are subsumed under Senegalese applications. **** Numbers denoted in red are cases where the number of visas issued has dropped since 2010.
3.1.6 Global migration outlook
Apart from the aftermath of the Middle Eastern refugee crisis of 2014/15 there is little reason to believe that the general trend as observed over the past decade is going to change. On the one hand, the withdrawal of the UK from the EU could divert some flows from the UK to the EU. Migration for the purpose of education has been constantly increasing and is likely to
0%
1%
2%
3%
4%
5%
6%
7%
8%

44 CHAPTER 3
SEO AMSTERDAM ECONOMICS
continue to increase. Family reunification was relatively stable, but is likely to increase due to applications of the 2015/16 influx of refugees but should then stabilise again. Labour migration is largely demand driven and subject to migration policies, will probably continue to grow as long as the EU displays overall economic growth. Also, the level of the educational attainments of migrants has been continuously increasing and there are few reasons to suggest this long-term trend could change. On the other hand, refugee migration has already been decreasing significantly from 2016.
3.2 Syrian refugees Of all global (internal and international) refugees, an estimated 23% are Syrians. Since the outbreak of the conflict in Syria, 13.2 million Syrians refugees have been forcefully displaced. The displacement of these Syrian refugees is shown in Figure 3.13. Most refugees have been displaced within Syria itself (around 6.7 million), or fled to neighboring countries—in particular Turkey (3.5 million), Lebanon (around 1 million), and Jordan (around 670,000).
An estimated 15% of Syrian refugees fled to the EU, of which more than half (550,000) fled to Germany. Within the EU-28, Germany is the country that hosts the most Syrian refugees (UNHCR, 2018ab; Pew, 2018; Deloitte, 2017).
There are two caveats to these figures. First, several countries do not de-register Syrians who have returned or moved on. The actual numbers may therefore be lower, notably in Turkey. Second, not all Syrians register with the authorities but stay irregularly. The actual numbers could therefore also be higher, notably in Jordan.
Figure 3.13 Forceful displacement of Syrian refugees (total = 13.2 million), 2017
Source: UNHCR (2018ab); Pew (2018); Deloitte (2017)
0
1
2
3
4
5
6
7

MIGRATION TRENDS AND ASPIRATIONS 45
SEO AMSTERDAM ECONOMICS
Figure 3.14 Number of asylum applications in the EU from Syrian refugees
Source: Eurostat (2018)
There are various indications that Syrians in Europe are relatively highly educated. The general consensus in the literature is that Syrian refugees are relatively highly educated compared to refugees with other nationalities (Duvell, 2018; Karyotis et al., 2018; Deloitte, 2017). Syrian asylum seekers in Germany are found to generally have an education well above the average for Syria. Of the Syrian refugees in Germany, 26% had higher education and 73% of the men and 30% of the women had been in employment prior to migration, suggesting professional skills (see Annex D on Germany for more information). A study in the UK found that of the mostly resettled Syrian refugees, 27% were university graduates and 28% had at least an intermediate level education, while 27% were in employment, 36% were students and 19% said they were unemployed and searching for a job (Karyotis et al. 2018). Another non-representative (snowball sampling) survey of 308 Syrian refugees in Austria, the Netherlands and the UK found that 38% had a university degree whilst 82% where nevertheless unemployed (Deloitte 2017).
Syrian refugees in Turkey, Lebanon and Jordan, however, appear to be lower educated than those who moved on to the EU. In Jordan, Syrians are mostly low educated and tend to work in low skilled jobs (see Annex B on Jordan). Ceritoglu et al. (2017) found that Syrian refugees and Turkish natives have similar educational characteristics and are on average low educated. In contrast, AFAD (2013) concluded from a survey that the levels of education were actually higher than those for Turkish citizens in the main refugee receiving provinces in the South East. Meanwhile, in the year 2016/2017, 14,740 Syrians enrolled in universities in Turkey (Erdogan, 2017). Nevertheless, it appears that better educated Syrians who envisaged better opportunities quickly moved on to the EU, whereas the lower educated Syrians stayed in Turkey, possibly to make use of the informal employment offered to the low-skilled by the Turkish labour market.
0
50000
100000
150000
200000
250000
300000
350000
400000
2014 2015 2016 2017
Title

46 CHAPTER 3
SEO AMSTERDAM ECONOMICS
3.3 Migration to the Netherlands
3.3.1 General migration trends in the Netherlands
Based on formal UN data, the stock of immigrants in the Netherlands increased from 7.9% of the Dutch population in 1990 to 12% in 2017.21 This increase occurred because the number of formally registered immigrants grew faster than the existing population.22 The stock of immigrants from outside the EU28 increased from 6.1% of the Dutch population in 1990 to 8.1% in 2017. The stock of emigrants has grown to a lesser extent in the Netherlands, with an increase from 4.6% to 5.6% during the same time period. With a very low fertility rate among non-immigrants, most population growth in the Netherlands in recent years was the result of immigration population growth. The growth of the Dutch fertility rate from 1.55% in 1990 to 1.78% in 2017 can be attributed to the higher fertility rate among migrant families.
Figure 3.15 The share of immigrants in the Dutch population has increased faster than the share of emigrants
Source: UNDESA (2018), gross immigration stocks
Based on national CBS data, the gross inflow of migrants to the Netherlands has doubled from less than a hundred thousand to almost 250,000. Relative to the Dutch population, the annual gross inflow of migrants increased from 0.6% per year in 1995 to 1.4% in 2017. Emigration rates (expressed as a share of the total Dutch population including emigrants) increased at a slower rate over the same period, from 0.6% in 1995 to 0.9% in 2017. Only during the period 2003-2007, emigration rates exceeded the immigration rates, leading to net outflows of migrants. Both
21 Sources for this chapter are taken from www.worldometers.info , based on UN Department of
Economic and Social Affairs (UNDESA), Population Division, World Population Prospects, the 2017 revision, and www.un.org/en/development/desa/population/migration/data/estimates2/estimates15.shtml
22 Formally registered immigrants include registered refugees and asylum seekers, but do not include irregular (non-registered) immigrants and immigrants who obtained a Dutch passport.
0
2
4
6
8
10
12
14
1990 1995 2000 2005 2010 2015 2017
Immigrants (in % ofpopulation)
Immigration from outsidethe EU28 as % of Pop.
Emigrants (in % ofpopulation + emigrants)

MIGRATION TRENDS AND ASPIRATIONS 47
SEO AMSTERDAM ECONOMICS
immigration and emigration rates are increasing, but the gap is widening in favor of the former. This is line with the observations from the UN stock data in Figure 3.15.
Figure 3.16 The inflow of immigrants in the Dutch population has increased faster than the outflow of emigrants, both in relative and absolute terms.
Source: CBS (2018), gross migration flows
Worldwide migration to the Netherlands The regions Northern Africa, Western Africa and Western Asia together have provided in total around 25-37% of the total stock of immigrants in the Netherlands. The countries that are included in the aforementioned regions according to the UN definitions of regions are listed in Table 3.6. In 2017, the total share of immigrants in the Netherlands, in percent of the total immigration, was 10% for Northern Africa (driven by Morocco), 15% for Western Asia (driven by Turkey, and here excluding Iran and Afghanistan) and 2.4% for Western Africa (driven by Ghana). However, Figure 3.17 shows that the majority of the flow of immigrants to the Netherlands originates from the EU28, followed by Western Asia and Northern Africa respectively. Not included in Figure 3.17 are relatively high immigration stock figures for Surinam, and the Dutch Caribbean (since 1975), Indonesia (since 1945), China (gradual increase), and recently also Russia (since 2000).
0,00%
0,20%
0,40%
0,60%
0,80%
1,00%
1,20%
1,40%
1,60%
0
50000
100000
150000
200000
250000
1995
1996
1997
1998
1999
2000
2001
2002
2003
2004
2005
2006
2007
2008
2009
2010
2011
2012
2013
2014
2015
2016
2017
Immigration Emigration
Immigration as a % of the population Emigration as a % of the population

48 CHAPTER 3
SEO AMSTERDAM ECONOMICS
Table 3.6 Countries included in the UN definition of regions
Northern Africa Western Africa Western Asia Algeria Benin Armenia
Egypt Burkina Faso Azerbaijan
Libya Cabo Verde Bahrain
Morocco Côte d’Ivoire Cyprus
Sudan Gambia Georgia
Tunisia Ghana Iraq
Western Sahara Guinea Israel
Guinea-Bissau Jordan
Liberia Kuwait
Mali Lebanon
Mauritania Oman
Niger Qatar
Nigeria Saudi Arabia
Saint Helena, Ascension and Tristan da Cunha State of Palestine
Senegal Syria
Sierra Leone Turkey
Togo United Arab Emirates
Yemen
Note: The UN definition of “Western Asia” includes the Caucasus region as well as Cyprus and Turkey, while it does not include Afghanistan and Iran (these are included as part of Southern Asia).
Figure 3.17 Northern Africa and Western Asia are the main regions of origin outside the EU28 in the Dutch gross immigration stock (x1000)
Source: UNDESA (2018), gross immigration stocks
0
100
200
300
400
500
600
700
1990 1995 2000 2005 2010 2015 2017
EU28
Northern Africa
Western Africa
Western Asia

MIGRATION TRENDS AND ASPIRATIONS 49
SEO AMSTERDAM ECONOMICS
International migration stocks from outside the EU28 into the Netherlands mainly originated from Turkey, Surinam, and Morocco. Each of these countries experienced a rough 30% increase from 1990 to 2017 in the total number of migrants represented in the Dutch gross immigrant stock. In 2017 the stock of migrants in the Netherlands equaled two hundred thousand for each of these countries approximately. At some distance, the top-5 is completed with China and Curacao representing each approximately sixty thousand migrants in the Dutch gross migration stock (see Figure 3.18).
Figure 3.18 Surinam, Turkey and Morocco have the largest share among immigrants from the top-5 non-EU28 countries in the Netherlands
Source: UNDESA (2018), gross immigrant stock (x1000); for 2017 the very low figure for Curacao must be a mistake. New immigrants into the Netherlands have increasingly arrived from both within and outside the European Union. From 1995 to 2003, Asia, Europe, Africa and the America’s had an equal share in the gross migration inflow to the Netherlands (Figure 3.19). Between 2008 and 2014, European immigrants constituted the majority of new arrivals, but from 2015 non-European immigrants have dominated the flows. This was largely the result of increased immigration from ‘Asia’, which to a large extent comprises Syrian refugees. Immigration flows from sub-Sahara Africa and (North and South) America have been fairly small since the early 2000s.
0
50
100
150
200
250
1990 1995 2000 2005 2010 2015 2017
Turkey
Surinam
Morocco
China
Curacao

50 CHAPTER 3
SEO AMSTERDAM ECONOMICS
Figure 3.19 Net migration flows into the Netherlands have arrived from various continents
Source: CBS (2018), net migration flows
Immigration from Europe In terms of immigrant stocks in the Netherlands, Germany remains the most important country of origin (with 132,000 migrants in 2017), followed by Poland (126,000), Russia (61,000)23, and Belgium (59,000) (see Figure 3.20) Historically, Germany has always been the dominant country of origin24, but from 2010 and onwards, the stock of Polish migrants originating has increased significantly. This is mainly the result of a high level of labour migration from Poland to the Netherlands, due to less strict regulation. The stock of migrants with a Russian origin has also increased strongly in the 2000s, whereas the total number of migrants with a Serbian origin decreased after 2010. The stock of migrants with a different European origin remained fairly stable from 1990 to 2017.
23 https://www.cbs.nl/nl-nl/nieuws/2013/05/immigratie-uit-de-voormalige-sovjet-unie-sterk-toegenomen. 24 This included Polish and Russian immigrants with a German passport.
-20000
0
20000
40000
60000
80000
100000
Africa Europe America Asia

MIGRATION TRENDS AND ASPIRATIONS 51
SEO AMSTERDAM ECONOMICS
Figure 3.20 EU migrants in the Netherlands are mostly from Germany, but increasingly also from Poland
Source: UNDESA (2018), gross immigrant stock (x 1000) Within the group of new European immigrants to the Netherlands, both old and new EU member states have contributed to their net growth. The Polish immigrant population in particular has grown by some 10,000 additional (formally registered) migrants per year since 2009 (Figure 3.21). Note that these are net numbers, i.e., the total number of new Polish immigrants minus the total number of Poles that emigrate back to Poland (or move on to elsewhere).
0
20
40
60
80
100
120
140
1990 1995 2000 2005 2010 2015 2017
Belgium
France
Germany
Italy
Poland
Spain
UK
Russia
Serbia

52 CHAPTER 3
SEO AMSTERDAM ECONOMICS
Figure 3.21 Net migration flows to the Netherlands has mostly come from Poland and EU member states
Source: CBS (2018), net migration flows
3.3.2 Immigration from Western Asia to the Netherlands
Turkey dominates the Immigration from Western Asia in the Netherlands, but recently Iraq and later Syria have become important as well. However, the Western Asia region as a whole has always attracted more immigrants than that it provided emigrants, and a considerable part of the international migrants stay within the region (from 34% in 1990 to 53% in 2015). Emigrants to areas beyond Western Asia have been between 5.3% (in 1990) and 3.6% (in 2015) of the region’s total population. If we exclude Turkey, Cyprus and the Caucasus from the official UNDESA definition of the region, these figures are lower: between 3.4% in 1990 and 2.1% in 2010. The turmoil in the region is very visible in migration statistics, with first Iraq’s and then Syria’s emigration exploding, and countries like Jordan (and Turkey) experiencing massive immigration. For Jordan this is a continuation of being a major host country for Palestinians. For Western Asia as a whole, Europe has always been an important destination of its non-regional international migrants, but this is particularly true for Turkey. Although still high, the Turkish share in immigration to the Netherlands from Western Asia dropped during the last two decades. In 1990 the Turkish share of migrants in the Dutch gross immigration stock with an Western Asian background exceeded 90% (204 thousand in absolute terms). In 2017, this share decreased to below 70%, but remained considerable. This has mainly to do with the increase of migrants with an Iraqi background, and to a lesser extent with recent developments in Syria. From 1990 to 2017, the number of migrants originating from the
-4000
-2000
0
2000
4000
6000
8000
10000
12000
14000
16000
1995 1997 1999 2001 2003 2005 2007 2009 2011 2013 2015 2017
Poland
Old EUMember States
New EUMember States(excl. Poland)Other Europe(incl. formerSoviet Union)

MIGRATION TRENDS AND ASPIRATIONS 53
SEO AMSTERDAM ECONOMICS
other Western Asian countries has increased from 10- to 44 thousand. However, spread over the total amount of countries, this effect is of minor importance (see Figure 3.22).
Figure 3.22 Turkey is Western Asia’s main country of origin among immigrants in the Netherlands
Source: UNDESA (2018), gross immigration stock (x 1000)
During the past 5 years, developments in Syria resulted in a significant inflow of migrants to the Netherlands (see Figure 3.23). Syrians accounted for the majority of the recent net inflow from Western Asia and the MENA countries. Before the recent Syrian developments, in the late 1990s, and again in the late 2000s, Iraq had a leading role in the net inflow of migrants to the Netherlands from the MENA region. It should be noted here that also the inflow from Iran and Afghanistan has been considerable during some years, but these two countries are not seen as part of Western Asia (or the MENA region) in UN statistics, but as part of South Asia.
0
50
100
150
200
250
1990 1995 2000 2005 2010 2015 2017
Other Western Africancountries
Iraq
Jordan
Syria
Turkey
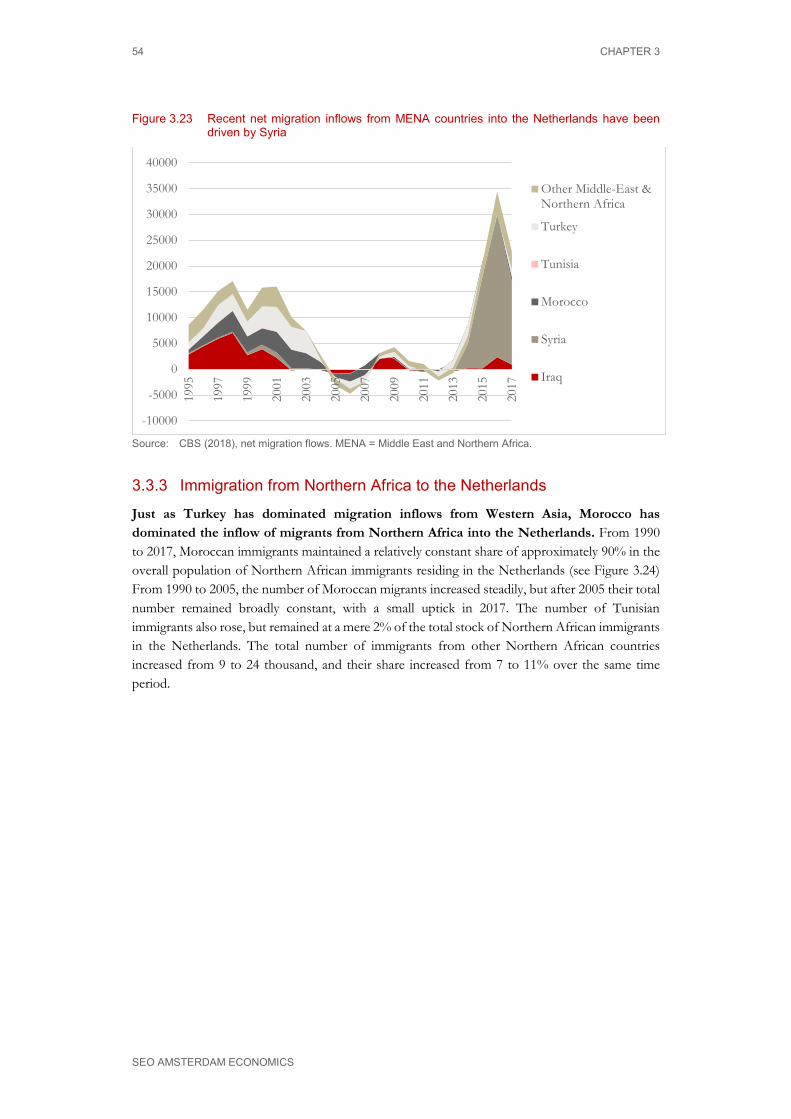
54 CHAPTER 3
SEO AMSTERDAM ECONOMICS
Figure 3.23 Recent net migration inflows from MENA countries into the Netherlands have been driven by Syria
Source: CBS (2018), net migration flows. MENA = Middle East and Northern Africa.
3.3.3 Immigration from Northern Africa to the Netherlands
Just as Turkey has dominated migration inflows from Western Asia, Morocco has dominated the inflow of migrants from Northern Africa into the Netherlands. From 1990 to 2017, Moroccan immigrants maintained a relatively constant share of approximately 90% in the overall population of Northern African immigrants residing in the Netherlands (see Figure 3.24) From 1990 to 2005, the number of Moroccan migrants increased steadily, but after 2005 their total number remained broadly constant, with a small uptick in 2017. The number of Tunisian immigrants also rose, but remained at a mere 2% of the total stock of Northern African immigrants in the Netherlands. The total number of immigrants from other Northern African countries increased from 9 to 24 thousand, and their share increased from 7 to 11% over the same time period.
-10000
-5000
0
5000
10000
15000
20000
25000
30000
35000
40000
1995
1997
1999
2001
2003
2005
2007
2009
2011
2013
2015
2017
Other Middle-East &Northern Africa
Turkey
Tunisia
Morocco
Syria
Iraq

MIGRATION TRENDS AND ASPIRATIONS 55
SEO AMSTERDAM ECONOMICS
Figure 3.24 Morocco is the main country of origin among immigrants from Northern Africa who reside in the Netherlands
Source: UNDESA (2018), gross immigration stock (x 1000)
The data on net inflow of Northern African migrants also show that Moroccan net migration took mainly place before 2005. Similar to all net inflow figures, the net inflow of Moroccan migrants was found to be negative for a few years starting in 2005. From 2009 to 2017, the net inflow of Moroccan migrants was often found to be positive, but significantly lower than the period before 2005. Moreover, Egypt has taken a moderate but increasing role in the net inflow of migrants to the Netherlands from 2009 to 2017 (see Figure 3.25).
0
20
40
60
80
100
120
140
160
180
200
1990 1995 2000 2005 2010 2015 2017
Morocco
Tunisia
Other Northern Africancountries

56 CHAPTER 3
SEO AMSTERDAM ECONOMICS
Figure 3.25 The largest net inflows of migrants from Northern Africa to the Netherlands used to come from Morocco, but more recently net migration from Morocco has declined significantly
Source: CBS (2018), net immigration flows The Northern African region as a whole can be characterised as an expulsion zone, with emigration always much more important than immigration. Migration within the region is limited, and emigration beyond the region has increased from 3.3% of total population in 1990 to 4.4% in 2015. Most emigrants (particularly from Morocco and Algeria) went to Europe, but Western Asia was an important destination as well.25 In general, the western part of Northern Africa has been mostly oriented towards Europe (particularly France), while the eastern part of the region has been more oriented to Western Asia. If we look at the emigration data for Tunisia it is clear that Europe is the most important destination. Within Europe, the main destination is France, followed by Italy and Germany. The Netherlands was thus far a relatively unimportant destination for Tunisians. From the point of view of Europe, Morocco and Algeria have been the most important countries of origin from North Africa.
3.3.4 Immigration from Western Africa to the Netherlands
The origin of the Western African migrants in the Dutch immigration stock is less one-sided compared with Western Asia and Northern Africa. The most important group of Western African migrants in the Dutch immigration stock originate from Ghana, but Nigeria has played a significant
25 Recently, the migration from Northern African to Sub-Sahara Africa also increased. However, this is to a
large extent due to the fact that Sudan was included in the definition of the Northern Africa region, and a lot of people from Southern Sudan (who lived in the northern part of what used to be united Sudan) migrated to South Sudan after that country’s independence in 2011.
-3000
-2000
-1000
0
1000
2000
3000
4000
5000
6000
700019
9519
9619
9719
9819
9920
0020
0120
0220
0320
0420
0520
0620
0720
0820
0920
1020
1120
1220
1320
1420
1520
1620
17
Tunisia
Sudan
Morocco
Libia
Egypt
Algeria

MIGRATION TRENDS AND ASPIRATIONS 57
SEO AMSTERDAM ECONOMICS
role since 1995. Moreover, immigration from Western Africa is more widespread, as can be seen from the relative importance of the group of “other Western African countries” (see Figure 3.26).
Figure 3.26 Nigeria and Ghana are Western Africa’s main countries of origin in the Dutch gross immigration stock
Source: UNDESA (2018), gross immigration stock (x 1000) Western Africa is the global region with the most impressive figures for population growth between 1990 and 2015, and expectations are that that will further grow, due to high (although diminishing) fertility rates, and with the result that the population is very young, with a median age still below 18 for the region as a whole. The population of Western Africa is on the move, with massive migration movements within the countries (and a general tendency of movements form the north to the south in these countries, and from the countryside to the cities), and within the region. Extra-regional migration is still very limited, although relatively growing: from 0.5% of the total population in 1990, to 0.8% in 2015. With increasing wealth levels, increasing aspirations, and increasing migration capabilities it can be expected that this percentage will grow to world average levels (around 3%). If that happens towards 2050 it would mean that total extra-regional migration would have grown from 2.8 million (of which 1.6 million to Europe) in 2015 to 24 million. Recent trends show a growing orientation towards Asia and the Americas, but Europe is and will remain important as a major area of (intended) destination. Nigeria is the giant within Western Africa, and the recent data for Nigeria show a trend in this direction: from 88,000 migrants towards Europe in 1990, to 398,000 in 2015. Within Europe the UK still dominates, but Italy and Spain have become important as well. Migration to the Netherlands has been rapidly growing as well, but is still relatively insignificant. For Nigeria it is important to say that North America (the USA and Canada) have always been important destination areas as well, and contrary to almost all international migration data the Nigerian migration to the USA shows a female dominance recently. For Western Africa (and particularly Nigeria) all figures should be treated with caution, as statistics do not seem to be very reliable, and informality is high (and identities can be ‘negotiated’). .
0
5
10
15
20
25
30
1990 1995 2000 2005 2010 2015 2017
Nigeria
Ghana
Other Western Africancountries

58 CHAPTER 3
SEO AMSTERDAM ECONOMICS
3.3.5 Gender composition of migrants from Jordan, Tunisia and Nigeria to the Netherlands
If we look at the gender composition of migrants in the Netherlands from Jordan, females have always been underrepresented. However, their relative importance increased over the years. The amount of female Jordanian migrants in the Dutch migration stock has not only increased at a faster pace compared to the male migration rates, but has also continued to grow after the stagnation of the male migration rates in 2005. The female share in the Jordanian migrants in the Netherlands has increased from 36% in 1990 to 45% in 2015 (see Figure 3.27).
Figure 3.27 The majority of Jordanian immigrants in the Netherlands has been male, but the share of women has increased steadily
Source: UNDESA (2018), gross immigration stock. When looking at the migration flows from Jordan to the Netherlands, a similar pattern can be observed. In 1995, 34% of the inflow of Jordanian migrants was found to be female, whereas in 2017 this has increased to 48% (see Figure 3.28).
32%
34%
36%
38%
40%
42%
44%
0
100
200
300
400
500
600
1990 1995 2000 2005 2010 2015
Female
Male
Female Share (Right axis)

MIGRATION TRENDS AND ASPIRATIONS 59
SEO AMSTERDAM ECONOMICS
Figure 3.28 The share of women is increasing among Jordanian migrants to the Netherlands
Source: CBS (2018), annual gross immigration flows.
If we look at the gender composition of migrants in the Netherlands from Tunisia, females have always been underrepresented, but their relative importance has increased over the years as well. Also in the case of Tunisia, the number of female migrants increased at a faster pace and has not stagnated yet, compared with male migrants. The female share of the Jordanian migrants stock in the Netherland is lower than the share in Jordan, but has increased from 30% in 1990 to 36% in 2015 (see Figure 3.29).
0%
10%
20%
30%
40%
50%
60%
0
20
40
60
80
100
120
1995 1997 1999 2001 2003 2005 2007 2009 2011 2013 2015
Female
Male
Female share(right axis)

60 CHAPTER 3
SEO AMSTERDAM ECONOMICS
Figure 3.29 The majority of Tunisian immigrants in the Netherlands has been male, but the share of women has increased, especially since 2000
Source: UNDESA (2018), gross immigration stock. Looking at the gross inflow of Tunisian migrants, a similar pattern cannot be observed. From 1990 to 2005, the female share remained fairly stable, and actually decreased from 2009 to 2017 (Figure 3.30).
Figure 3.30 The inflow of Tunisian migrants to the Netherlands has remained relatively constant across males and females.
Source: CBS (2018), annual gross immigration flows. The share of women among Nigerian migrants to the Netherlands has also increased over time, and has nearly reached 50%. Both the stock of Nigerian female and male migrants in the Netherland has increased from 1990 to 2015, and the share of the female migrants has increased from 35% to 46% (Figure 3.31).
26%
27%
28%
29%
30%
31%
32%
33%
34%
35%
36%
37%
0
500
1000
1500
2000
2500
3000
3500
1990 1995 2000 2005 2010 2015
Female
Male
Female Share (Right axis)
0%
5%
10%
15%
20%
25%
30%
35%
40%
45%
50%
0
20
40
60
80
100
120
140
160
180
1995 1997 1999 2001 2003 2005 2007 2009 2011 2013 2015
Female
Male
Female share (right axis)

MIGRATION TRENDS AND ASPIRATIONS 61
SEO AMSTERDAM ECONOMICS
Figure 3.31 The female share of Nigerian immigrants in the Netherlands has increased since 2000
Source: UNDESA (2018), gross immigration stock. A slight increase of the female share in the gross inflow of Nigerian migrants to the Netherland can be observed from 1995 to 2017 (Figure 3.32). Similar to the Tunisian migrants in the Netherlands, the Nigerian male migrants also experienced higher emigration rates than female migrants (either moving back or moving on), providing an opportunity to grow for the relative importance of the female stock of migrants.
Figure 3.32 The share of females in the Nigerian migration flows to the Netherlands has increased slightly.
Source: CBS (2018), annual gross immigration flows.
0%
5%
10%
15%
20%
25%
30%
35%
40%
45%
50%
0
500
1000
1500
2000
2500
3000
3500
4000
4500
1990 1995 2000 2005 2010 2015
Female
Male
Female Share (Right axis)
0%
10%
20%
30%
40%
50%
60%
0
50
100
150
200
250
300
350
400
450
1995 1997 1999 2001 2003 2005 2007 2009 2011 2013 2015
Female
Male
Female share(right axis)

62 CHAPTER 3
SEO AMSTERDAM ECONOMICS
3.4 Migration aspirations Most of those interested in migration have not migrated yet. As the Gallup World Poll Survey has shown for many years now, a large share of the global population has the desire to migrate permanently.26 Between 2013-2016, the number of people who said they wanted to move to another country if they had the opportunity was estimated at around 14% of the global population, which translates to some 710 million people (Gallup 2017a). However less than 4% tend to actually migrate (3.4 percent in 2017). And only around 1% of Africans aspiring to migrate, actually do so. A recent European Commission analysis of Gallup World Poll survey data intentions to migrate finds that the probability of preparing for international migration is positively associated with being young, male, foreign born, highly educated, unemployed, and having networks abroad (Migali and Scipioni, 2018). On the basis of global Gallup data, the authors find that individuals preparing to move abroad are more likely to do so out of aspiration for a better life, economic opportunities and development of skills, rather than sheer desperation. They also find that share of the population that expressed a desire to migrate is an imperfect measure of what is often portrayed as ‘potential migration’.
Figure 3.33 The desire to migrate permanently is the highest in Sub-Saharan Africa and is twice as high as the global average (2013-2016)
Source: Gallup (2017a); Gallup (2017b)
Gallup data for 2013-2016 suggest that the share of people with a desire to migrate was the highest in Sub-Saharan Africa with 31%. Moreover, in Europe, Latin America and the Caribbean, and Middle- and Northern Africa, the share of people with a desire to migrate was well above the global average in 2016. On the other hand, the fraction of people with a desire to migrate was found to be the lowest in the southern and eastern parts of Asia.
26 Each year, Gallup interviews around 1000 residents per country, of almost every country in the world.
0
5
10
15
20
25
30
35
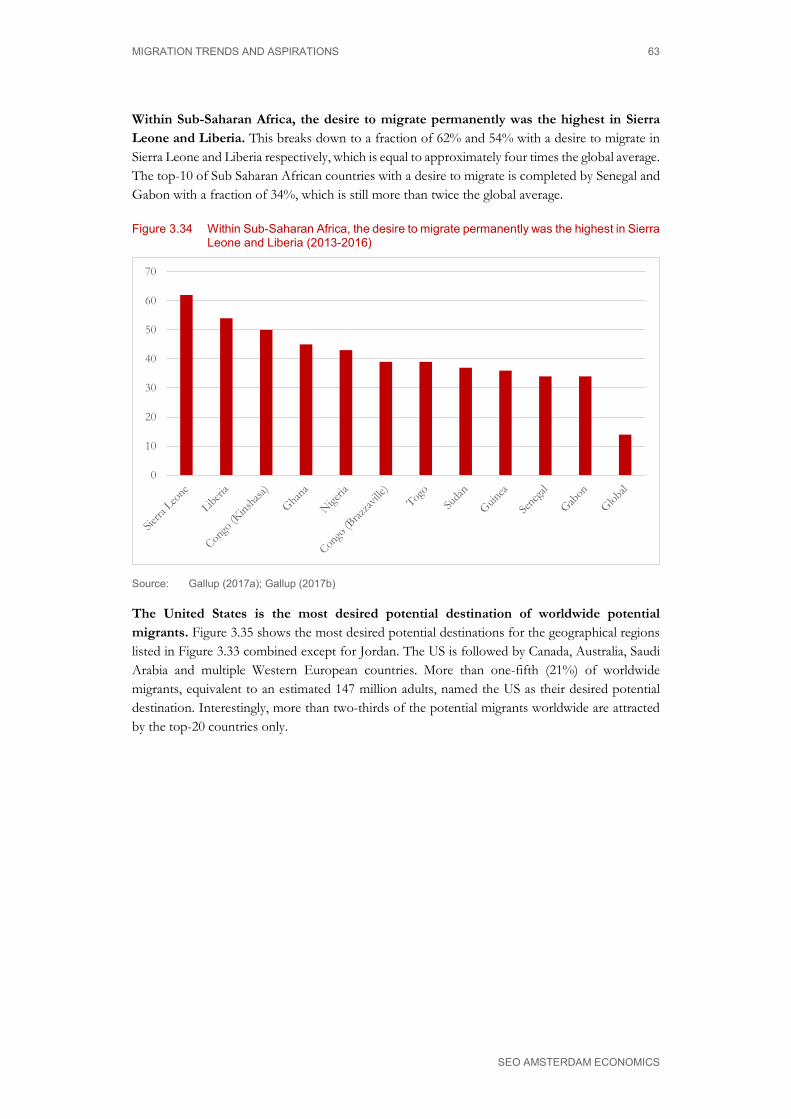
MIGRATION TRENDS AND ASPIRATIONS 63
SEO AMSTERDAM ECONOMICS
Within Sub-Saharan Africa, the desire to migrate permanently was the highest in Sierra Leone and Liberia. This breaks down to a fraction of 62% and 54% with a desire to migrate in Sierra Leone and Liberia respectively, which is equal to approximately four times the global average. The top-10 of Sub Saharan African countries with a desire to migrate is completed by Senegal and Gabon with a fraction of 34%, which is still more than twice the global average.
Figure 3.34 Within Sub-Saharan Africa, the desire to migrate permanently was the highest in Sierra Leone and Liberia (2013-2016)
Source: Gallup (2017a); Gallup (2017b)
The United States is the most desired potential destination of worldwide potential migrants. Figure 3.35 shows the most desired potential destinations for the geographical regions listed in Figure 3.33 combined except for Jordan. The US is followed by Canada, Australia, Saudi Arabia and multiple Western European countries. More than one-fifth (21%) of worldwide migrants, equivalent to an estimated 147 million adults, named the US as their desired potential destination. Interestingly, more than two-thirds of the potential migrants worldwide are attracted by the top-20 countries only.
0
10
20
30
40
50
60
70

64 CHAPTER 3
SEO AMSTERDAM ECONOMICS
Figure 3.35 The US is the most desired destination for global potential migrants (2013-2016)
Source: Gallup (2017a)
0
20
40
60
80
100
120
140
160
US Germany Canada UnitedKingdom
France Australia Saudi Arabia Netherlands

DUTCH LABOUR MARKET SHORTAGES AND POTENTIAL LABOUR SUPPLY FROM AFRICA AND THE MIDDLE EAST: IS THERE A MATCH? 65
SEOAMSTERDAM ECONOMICS
References to chapter 3 Achilli, L., Yassin, N., & Erdogan, M. M. (2017). Neighbouring host-countries' policies for Syrian
refugees: the cases of Jordan, Lebanon, and Turkey.
AFAD (Disaster and Emergency Management Presidency of Turkey) (2013). Syrian Refugees in Turkey, 2013: Field Survey Results. Republic of Turkey Prime Ministry Disaster and Emergency Management Presidency.
Ceritoglu, E., Yunculer, H. B. G., Torun, H., & Tumen, S. (2017). The impact of Syrian refugees on natives’ labor market outcomes in Turkey: evidence from a quasi-experimental design. IZA Journal of Labor Policy, 6(1), 5.
Degler, Eva; Liebig, Thomas; Senner, Anne-Sophie (2017), Integrating Refugees into the Labour Market - Where Does Germany Stand?, IFO DICE Report 3(15): 6, http://www.cesifo-group.de/DocDL/dice-report-2017-3-degler-liebig-senner-october.pdf
Deloitte, 2017, Pilot survey of Syrians in Netherlands, Austria and UK, https://www2.deloitte.com/content/dam/Deloitte/global/Documents/About-Deloitte/talent-displaced-syrian-refugees-europe.pdf
Düvell, Franck; Cherti, Myriam and Lapshyna, Irina (2017), Does immigration enforcement matter? Irregular migration and control policies in the UK, Final Report, Oxford: Centre on Migration, Policy and Society
Economist, The (2018), Can refugees help to plug Europe's skilled-labour gaps? Employing refugees in Germany and Sweden, 16.6.2018
European Commission (2018), Visa statistics: Schengen States receive 15.2 million applications for short-stay visas in 2016, https://ec.europa.eu/home-affairs/news/visa-statistics-schengen-states-receive-152-million-applications-short-stay-visas-2016_en
European Commission (2018), Visa statistics for consulates, https://ec.europa.eu/home-affairs/sites/homeaffairs/files/what-we-do/policies/borders-and-visas/visa-policy/docs/2017-consulates-schengen-visa-stats.xlsx
European Commission (2011), Visa statistics for consulates 2010, https://ec.europa.eu/home-affairs/sites/homeaffairs/files/what-we-do/policies/pdf/synthese_2010_with_filters_en.xls
Eurostat (2018a), http://ec.europa.eu/eurostat/statistics-explained/index.php/Migration_and_ migrant_population_statistics
Eurostat (2018b), Migrant integration statistics – labour market indicators, http://ec.europa.eu/eurostat/statistics-explained/index.php/Migrant_integration_ statistics_%E2%80%93_labour_market_indicators
European Training Foundation (2015): Migrant Support Measures from an Employment and Skills Perspective (MISMES)
Eurostat (2018c), Database, http://ec.europa.eu/eurostat/data/database , migr_resocc, migr_ resedu, and migr_resfam

66 CHAPTER 3
SEO AMSTERDAM ECONOMICS
Eurostat (2017), Labour market and Labour force survey (LFS) statistics, http://ec.europa.eu/eurostat/statistics-explained/index.php/Labour_market_and_ Labour_force_survey_(LFS)_statistics
EU European Migration Network (EMN), surveys and reports, https://ec.europa.eu/home-affairs/what-wedo/networks/european_migration_ network_en
European Parliament (2016), Labour Market Integration of Refugees: Strategies and good practices: http://www.europarl.europa.eu/RegData/etudes/STUD/2016/578956/IPOL_STU(2016)578956_EN.pdf
Fasani, Francesco; Frattini, Tommaso; Minale, Luigi (2018), (The Struggle for) Refugee Integration into the Labour Market: Evidence from Europe, IZA DP No. 11333Bonn: IZA, http://ftp.iza.org/dp11333.pdf
Finotelli, Claudia; Sciortino, Giuseppe (2013), Through the Gates of the Fortress: European Visa Policies and the Limits of Immigration Control, Perspectives on European Politics and Society, 14(1): 80-101
Frontex (2018), Risk analysis for 2018, https://frontex.europa.eu/assets/Publications/Risk_Analysis/Risk_Analysis/Risk_Analysis_for_2018.pdf
Gallup (2017a), Number of Potential Migrants Worldwide Tops 700 Million, https://news.gallup.com/poll/211883/number-potential-migrants-worldwide-tops-700-million.aspx
Gallup (2017b), Potential Net Migration Index Falls in Middle East, Latin America, https://news.gallup.com/poll/212141/potential-net-migration-falls-middle-east-latin-america.aspx
Gallup (2011), One in Four in North Africa Desired to Migrate Before Unrest, https://news.gallup.com/poll/147344/One-Four-North-Africa-Desired-Migrate-Unrest.aspx?g_source=link_NEWSV9&g_medium=TOPIC&g_campaign=item_&g_content=One%2520in%2520Four%2520in%2520North%2520Africa%2520Desired%2520to%2520Migrate%2520Before%2520Unrest
Huddleston, Thomas; Bilgili, Ozge; Joki, Anne-Linde and Vankova, Zvezda (2015), Migrant Integration Policy Index 2015, Barcelona, Brussels: CIDOP, MPG, http://www.mipex.eu/what-is-mipex
ILO (2015), ILO global estimates on migrant workers, http://www.ilo.org/wcmsp5/groups/public/---dgreports/---dcomm/documents/publication/wcms_436343.pdf
IOM (2018), Migration data portal, Geneva: International Organization for Migration https://migrationdataportal.org/?i=stock_abs_&t=2017
IOM (2011), Gallup World Poll: The Many Faces of Global Migration, Geneva: IOM, http://www.migration4development.org/sites/default/files/mrs43.pdf

MIGRATION TRENDS AND ASPIRATIONS 67
SEO AMSTERDAM ECONOMICS
Karyotis, G., Colburn, B., Doyle, L., Hermannsson, K., Mulvey, G., & Skleparis, D. (2018). Building a New Life in Britain: The Skills, Experiences and Aspirations of Young Syrian Refugees.
Migali, S. and M. Scipioni (2018), A Global Analysis of Intentions to Migrate, European Commission Joint Research Centre Technical Report, JRC111207. https://ec.europa.eu/jrc/sites/jrcsh/files/technical_report_on_gallup_v7_finalpubsy.pdf
OECD (2017), Finding their Way. Labour Market Integration of Refugees in Germany, OECD Publishing, Paris, http://www.oecd.org/els/mig/Labour-Market-Integration-Refugees-Germany-2017-de.pdf
OECD, labour migration data base and International Migration Outlook yearbook:
http://www.oecd.org/els/mig/oecdmigrationdatabases.htm,
https://stats.oecd.org/Index.aspx?DataSetCode=MIG,
http://www.oecd.org/migration/international-migration-outlook-1999124x.htm
OECD-UNDESA. (2013). World Migration in Figures.
Schoumaker, B., Flahaux, M. L., Mangalu, M., & Agbada, J. (2013). Changing patterns of Congolese migration (No. UCL-Université Catholique de Louvain). MAFE Working Paper 19. Paris: Institut National d’Études Démographiques (INED).
United Nations, Department of Economic and Social Affairs, Population Division (1998).
Recommendations on Statistics of International Migration, United Nations Statistical Papers, Series M, No. 58, Rev. 1: https://unstats.un.org/unsd/publication/SeriesM/SeriesM_58rev1E.pdf
United Nations, Department of Economic and Social Affairs, Population Division. (2015). Trends
in International Migrant Stocks: the 2015 revision: http://www.un.org/en/development/desa/population/migration/data/estimates2/docs/MigrationStockDocumentation_2015.pdf
United Nations, Department of Economic and Social Affairs, Population Division (2017).
International Migration Report 2017: http://www.un.org/en/development/desa/population/migration/publications/migrationreport/docs/MigrationReport2017.pdf
UNHCR (2018). “Situation Syria Regional Refugee Response”. Retrieved from:
https://data2.unhcr.org/en/situations/syria/location/36. Unicef (2013), Migration profile: Jordan:
https://esa.un.org/miggmgprofiles/indicators/files/Jordan.pdf
Vogel, Dita (2015), Update report Germany: Estimated number of irregular foreign residents in Germany (2014), Irregular Migration Net, http://irregular-migration.net/fileadmin/irregular-
68 CHAPTER 3
SEO AMSTERDAM ECONOMICS
migration/dateien/4.Background_Information/4.5.Update_Reports/Vogel_2015_Update_report_Germany_2014_fin-.pdf
Wahba, Jackline (2014), Immigration, Emigration, and the Labor Market in Jordan. In Assaad, Ragui (ed), The Jordanian Labor Market in the New Millennium, Oxford: Oxford University Press, http://www.oxfordscholarship.com/view/10.1093/acprof:oso/9780198702054.001.0001/acprof-9780198702054-chapter-6

DUTCH LABOUR MARKET SHORTAGES AND POTENTIAL LABOUR SUPPLY FROM AFRICA AND THE MIDDLE EAST: IS THERE A MATCH? 69
SEOAMSTERDAM ECONOMICS
4 Labour supply of potential migrants from Africa
4.1 Demographic developments Africa’s population has grown extremely rapidly over the last fifty years. It grew from about 290 million inhabitants in 1961 to more than 1.3 billion today, which is a growth rate of 450% in less than sixty years.27 The number of urban residents has increased even more quickly: from 65 million in 1960 to 460 million today, or from 20% to 46% of the population as a whole. Demographers predict that soon, more than half of all Africans will be living in cities (ASCL 2014). Demographers also predict that Africa’s total population might grow to between 3.5 and 5.6 billion people in 2100, which would mean that Africa’s share in world population will grow to between 40 and 50% of world population (currently less than 20%). The main reason for this rapid growth is the high fertility rate across most of Africa. As Figure 4.1 shows, between 1950-1980, the average African woman had around 6.5 children during her life time. This number fell to less than 4.5 by 2010, and is predicted to gradually decrease further until 2100, when fertility rates will have become roughly equal to those in the rest of the world, around the replacement level of the population.
Figure 4.1 African populations remain young, due to substantially higher fertility rates (until 2100)
Source: ASCL 2017c
27 http://www.worldometers.info/world-population/africa-population

70 CHAPTER 4
SEO AMSTERDAM ECONOMICS
Most African countries’ populations are dominated by young people As shown in ASCL (2014), the structure of population statistics in most African countries still has a ‘population pyramid’ structure, implying that the size of age groups decreases with age (see Figure 4.2.). This means that most African populations are predominantly young. Currently, around 40% of young Africans fall within the 10-30 age group, compared with around 25% in Europe and 34% for the world as a whole (ASCL 2014). The ‘median age’ in many African countries is around 20 years. For countries like Niger and Burkina Faso, half of all inhabitants are even younger than 17 years. The number of young Africans, particularly those between 10-30 year old, is rapidly increasing. Only in Southern African countries, population statistics show a ‘youth bulge’, where the age group of 10-30 year olds far outnumbers those in both the 0-10 age group and the 30+ group (Figure 4.2). This means that population growth is slowing down in these countries. For other parts of Africa, the birth rate is also expected to come down over the next few decades but currently the 0-10 age group is still larger than the other deciles. A gradual change to a ‘youth bulge’ will lead to a change in the continent’s population structure, and there will be a relatively high number of 10-30 year olds compared to other parts of the world between now and 2050.

LABOUR SUPPLY OF POTENTIAL MIGRANTS FROM AFRICA 71
SEO AMSTERDAM ECONOMICS
Figure 4.2 A ‘youth bulge’ can be seen in Southern African countries, while other African countries (and even North Africa) have a ‘population pyramid’
Source: ASCL (2014), based on US Census Bureau International Database (2009) / UNDESA

72 CHAPTER 4
SEO AMSTERDAM ECONOMICS
Africa’s population is also growing rapidly because of rising life expectancy rates. Besides relatively high (although diminishing) fertility rates, another reason why Africa’s population is also growing rapidly is the rise in life expectancy rates. In the 1960s, many African countries had life expectancy rates of below 50 or even below 40 years, and very high infant and child mortality rates. By 2015, life expectancy rates had improved to levels beyond 60 (or even 70) years, and infant and child mortality rates are now much lower than a few decades ago. Improved health care, improved safe water conditions and improved nutrition have all contributed to that result.28
4.2 Education trends in Africa African populations are increasingly getting better educated, but the Millennium Development Goals were not met in 2015. For Sub-Sahara Africa as a whole, primary net school enrolment stood at 79%, for North Africa at 95%.29 For most countries, the figures for girls are lower than those for boys. This is particularly the case for the ‘belt’ between Mali and Eritrea, where the primary net enrolment rate for girls was still below 60% (ASCL 2017a).
4.2.1 Primary education
Achieving universal primary education, one of the key targets of the Millennium Development Goals (MDGs) between 2000 and 2015, has not yet been met. MDG target 2A was to ensure that “by 2015, children everywhere, boys and girls alike, will be able to complete a full course of primary schooling”. This was measured by the net enrolment ratio in primary education30 and the proportion of pupils that start in grade 1 and who reach the last grade of primary school.31 Between 1990 and 2015, much progress was made. In 1990, which was taken as a point of departure for the MDGs, only seven African countries had reached near universal primary education for both sexes. Ten African countries had primary net enrolment rates below 50% for male pupils and 21 countries had net enrolment rates below 50% for female pupils. Around 2015, many more children went to school, both in absolute and in relative terms. Twenty African countries had reached near-universal coverage for both boys and girls, while other countries experienced major improvements. In Africa as a whole, many more youngsters than a generation ago (both boys and girls) have finalised primary school education. And among them, many have continued their education with secondary or even tertiary degrees. However, there are still many African children who do not complete primary education. Seven African countries have remained significantly behind the MDGs. Enrolment rates were still below 60% for girls in many countries, with the worst performance in Eritrea, South Sudan and Liberia (and no data for countries like Somalia). A few countries, including Liberia, even had a lower net primary enrolment rate than two decades earlier (ASCL 2017a). 28 For details see: https://ourworldindata.org/life-expectancy, and https://ourworldindata.org/child-
mortality 29 See https://data.unicef.org/topic/education/primary-education 30 ‘Net enrolment’ is defined as the “[n]umber of children attending primary or secondary school who are of
primary school age, expressed as a percentage of the total number of children of primary school age.” (data.unicef.org). Because of the inclusion of primary-school-aged children attending secondary school, this indicator is also sometimes referred to as the “primary-adjusted net attendance ratio.” Calculations follow the International Standard Classification of Education (ISCED).
31 UN (20xx) : https://mdgs.un.org/unsd/mdg/Host.aspx?Content=Indicators/OfficialList.htm.

LABOUR SUPPLY OF POTENTIAL MIGRANTS FROM AFRICA 73
SEO AMSTERDAM ECONOMICS
Figure 4.3 Primary school completion rates are generally higher in Northern Africa, but are quite low for girls in other parts of Africa
A. Men
B. Women
Source: ASCL (2017a) / based on UNICEF (2015), with different years per country (2010-2015)
In addition to a low net enrolment rate, some countries also have a low completion rate, also called primary school ‘survival rate’. This is defined as the percentage of children who start primary education and who succeed in getting to the end of the primary education system. The worst performing countries in terms of primary school ‘survival’ rates are Uganda, Angola, Mozambique, Ethiopia, Madagascar, Sierra Leone and even Rwanda, with less than 40% of starters also finishing primary school (based on UNICEF data for 2010-2015).

74 CHAPTER 4
SEO AMSTERDAM ECONOMICS
Enrolment rates and completion rates still do not say much about the quality of education, which is also still problematic in many African countries, despite many reforms and improvements. Goal 4 of the new Sustainable Development Goals is to “ensure inclusive and quality education for all and promote lifelong learning”. For most of Africa, measurement of the quality of education is still in its infancy. Only some countries in North Africa participate in assessments of language or mathematical proficiency.32 One measure of the quality of education is the adult literacy rate, which has improved but remains low for women, especially in central African countries. Adult literacy rates are measured by conducting tests among adults about their ability to read and write simple texts. The percentage of adults that is considered ‘literate’ has improved quite a bit since 1960, when the majority of African countries still had adult literacy rates below 20% (ASCL 2014). However, as Figure 4.4 shows, literacy rates are still quite low in central Africa and are especially low for women. In at least a third of all African countries, (much) more than half of adult females still fail to pass the literacy test. There are only a few African countries where the adult literacy rate is above 90% for men and above 80% for women: South Africa, Libya, the Seychelles and Equatorial Guinea. For the age group 15-24, countries in Northern and Southern Africa had reached a literacy rate of at least 80% and some at least 90%. But countries like Guinea, Burkina Faso, and Niger scored <40%, Chad, Liberia and Benin < 50% and Ethiopia <60%33. For the most populous country in Africa, Nigeria, recent estimates are ca 65% for men, and below 50% for women, while the 15-25 age group has an average of between 60 and 70%.
Figure 4.4 Literacy rates are highest in northern and southern Africa, and remain low for women
A. Men
32 For definitions, data and world maps with individual country data, if available, see:
https://ourworldindata.org/quality-of-education 33 https://ourworldindata.org/literacy
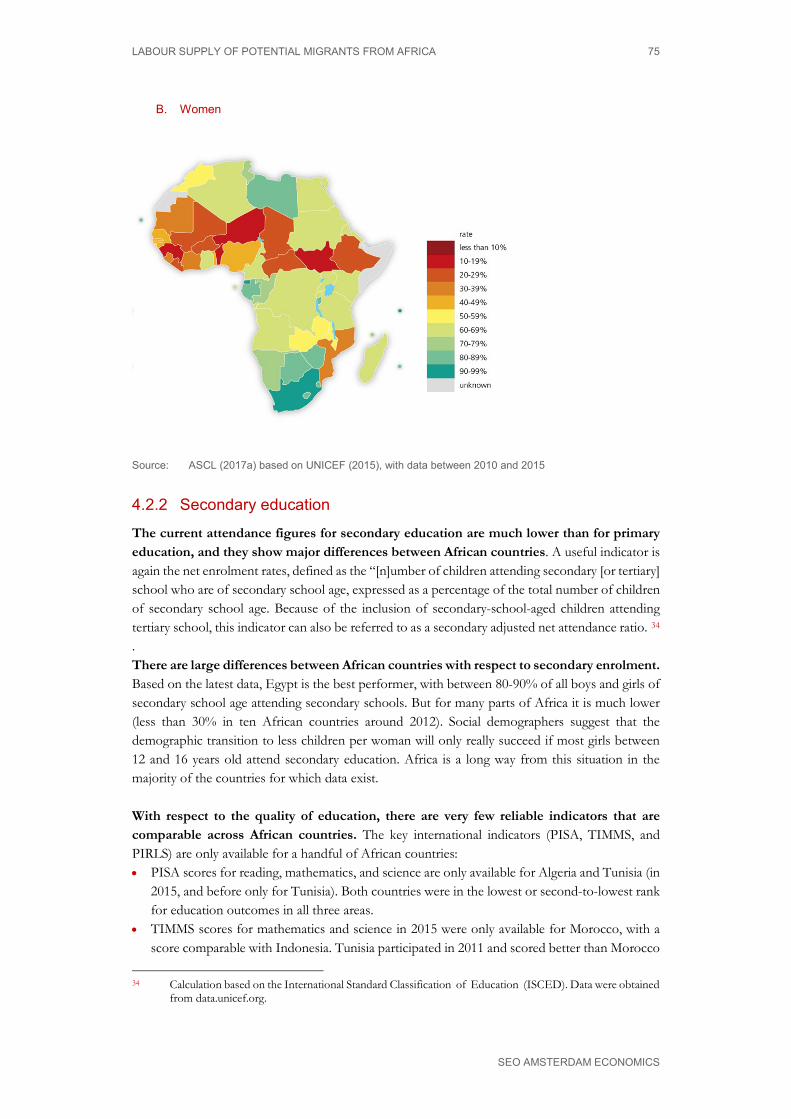
LABOUR SUPPLY OF POTENTIAL MIGRANTS FROM AFRICA 75
SEO AMSTERDAM ECONOMICS
B. Women
Source: ASCL (2017a) based on UNICEF (2015), with data between 2010 and 2015
4.2.2 Secondary education
The current attendance figures for secondary education are much lower than for primary education, and they show major differences between African countries. A useful indicator is again the net enrolment rates, defined as the “[n]umber of children attending secondary [or tertiary] school who are of secondary school age, expressed as a percentage of the total number of children of secondary school age. Because of the inclusion of secondary-school-aged children attending tertiary school, this indicator can also be referred to as a secondary adjusted net attendance ratio. 34 . There are large differences between African countries with respect to secondary enrolment. Based on the latest data, Egypt is the best performer, with between 80-90% of all boys and girls of secondary school age attending secondary schools. But for many parts of Africa it is much lower (less than 30% in ten African countries around 2012). Social demographers suggest that the demographic transition to less children per woman will only really succeed if most girls between 12 and 16 years old attend secondary education. Africa is a long way from this situation in the majority of the countries for which data exist. With respect to the quality of education, there are very few reliable indicators that are comparable across African countries. The key international indicators (PISA, TIMMS, and PIRLS) are only available for a handful of African countries: • PISA scores for reading, mathematics, and science are only available for Algeria and Tunisia (in
2015, and before only for Tunisia). Both countries were in the lowest or second-to-lowest rank for education outcomes in all three areas.
• TIMMS scores for mathematics and science in 2015 were only available for Morocco, with a score comparable with Indonesia. Tunisia participated in 2011 and scored better than Morocco
34 Calculation based on the International Standard Classification of Education (ISCED). Data were obtained
from data.unicef.org.
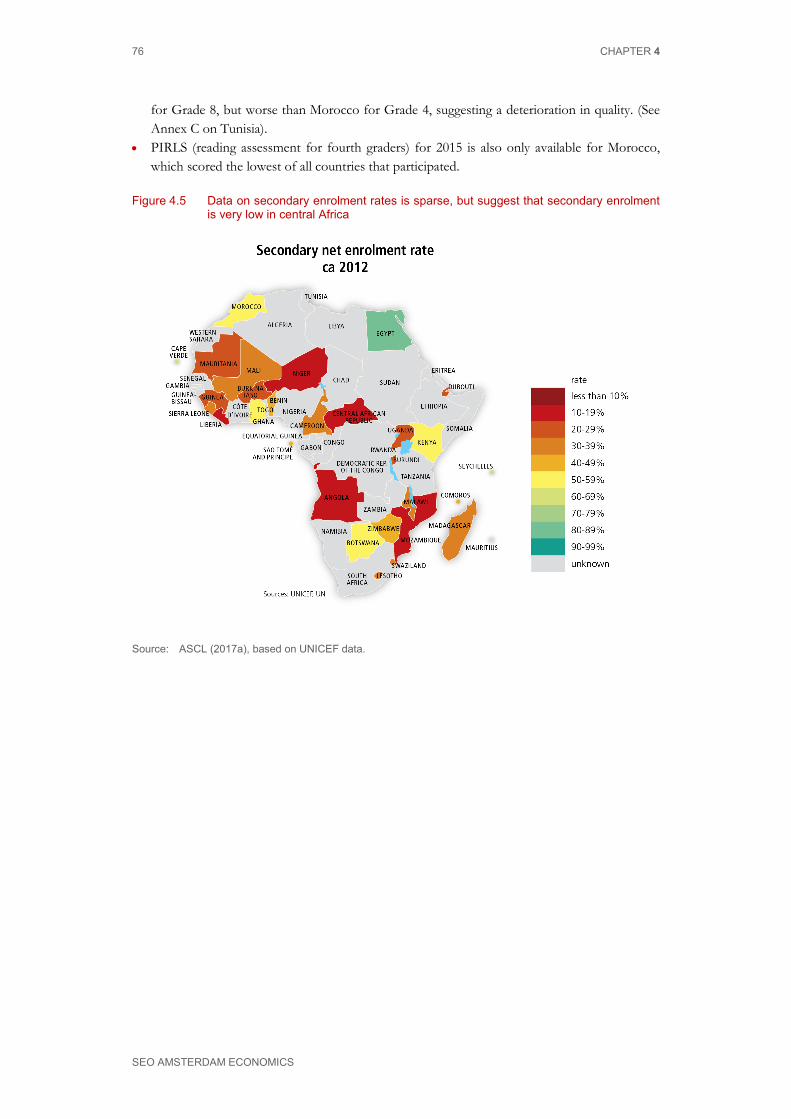
76 CHAPTER 4
SEO AMSTERDAM ECONOMICS
for Grade 8, but worse than Morocco for Grade 4, suggesting a deterioration in quality. (See Annex C on Tunisia).
• PIRLS (reading assessment for fourth graders) for 2015 is also only available for Morocco, which scored the lowest of all countries that participated.
Figure 4.5 Data on secondary enrolment rates is sparse, but suggest that secondary enrolment is very low in central Africa
Source: ASCL (2017a), based on UNICEF data.
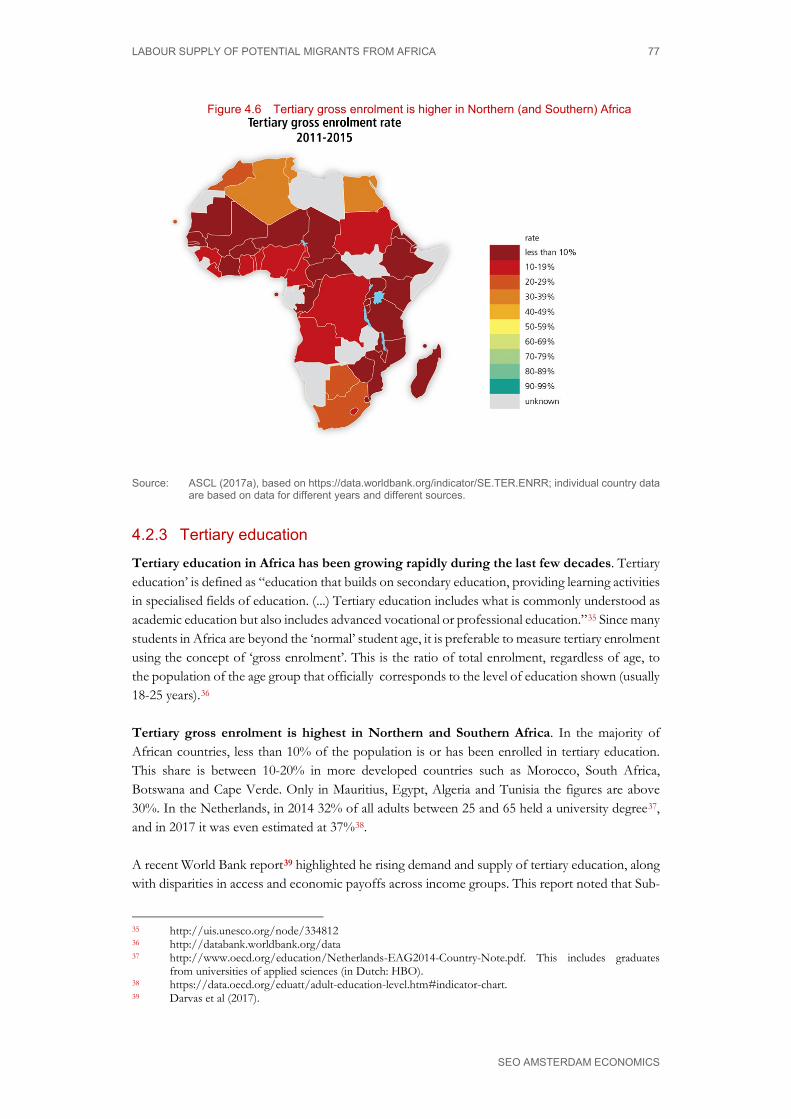
LABOUR SUPPLY OF POTENTIAL MIGRANTS FROM AFRICA 77
SEO AMSTERDAM ECONOMICS
Figure 4.6 Tertiary gross enrolment is higher in Northern (and Southern) Africa
Source: ASCL (2017a), based on https://data.worldbank.org/indicator/SE.TER.ENRR; individual country data
are based on data for different years and different sources.
4.2.3 Tertiary education
Tertiary education in Africa has been growing rapidly during the last few decades. Tertiary education’ is defined as “education that builds on secondary education, providing learning activities in specialised fields of education. (...) Tertiary education includes what is commonly understood as academic education but also includes advanced vocational or professional education.”35 Since many students in Africa are beyond the ‘normal’ student age, it is preferable to measure tertiary enrolment using the concept of ‘gross enrolment’. This is the ratio of total enrolment, regardless of age, to the population of the age group that officially corresponds to the level of education shown (usually 18-25 years).36 Tertiary gross enrolment is highest in Northern and Southern Africa. In the majority of African countries, less than 10% of the population is or has been enrolled in tertiary education. This share is between 10-20% in more developed countries such as Morocco, South Africa, Botswana and Cape Verde. Only in Mauritius, Egypt, Algeria and Tunisia the figures are above 30%. In the Netherlands, in 2014 32% of all adults between 25 and 65 held a university degree37, and in 2017 it was even estimated at 37%38. A recent World Bank report39 highlighted he rising demand and supply of tertiary education, along with disparities in access and economic payoffs across income groups. This report noted that Sub-
35 http://uis.unesco.org/node/334812 36 http://databank.worldbank.org/data 37 http://www.oecd.org/education/Netherlands-EAG2014-Country-Note.pdf. This includes graduates
from universities of applied sciences (in Dutch: HBO). 38 https://data.oecd.org/eduatt/adult-education-level.htm#indicator-chart. 39 Darvas et al (2017).

78 CHAPTER 4
SEO AMSTERDAM ECONOMICS
Saharan Africa saw the fastest growth in its tertiary gross enrolment ratio (GER) during 1970-2013 at 4.3 percent annually—faster than the global average of 2.8 percent. Even with this growth, sub-Saharan Africa has the lowest tertiary gross enrolment ratio globally. However, it was noted that this trend is primarily due to sub-Saharan Africa’s low base in 1970, when fewer than 400,000 students were in tertiary education. The report also showed that, for many African countries, the share of private tertiary institutions has risen fast between 2000 and 2012, and for at least six had reached more than 40% (in at least three even more than 50%: Rwanda, Burundi and Côte d’Ivoire).
4.3 Labour market trends Youth unemployment is a widespread problem in Africa at the moment. In 2017, average unemployment for Africa as a whole stood at 15 percent for youth unemployment40 and 8 percent for total unemployment.41 In some countries, such as South Africa, youth unemployment rates even exceeded 50 percent. While recorded unemployment rates are generally highly unreliable in terms of levels, an analysis of the trend in unemployment can still be useful. Youth unemployment rates have fluctuated around 30 percent in Northern Africa—about double the rate of youth unemployment in Sub-Saharan Africa. As Figure 4.7 shows, average youth unemployment rates in Sub-Saharan African countries have been fairly stable around 13-15 percent. They first decreased slightly from above 15 percent prior to 2004 to 12.8% in 2015. Since then, they increased again slightly to nearly 14 percent. In Northern Africa, however, youth unemployment first declined from around 35 percent in 1998 to 25 percent in 2009, but since the global financial crisis they have ratcheted up to levels above 30 percent again.
Figure 4.7 Youth unemployment rates in Northern Africa have fluctuated around 30 percent—more than double the rates in Sub-Saharan Africa.
Source: The World Bank, Popular Indicators (2018), modelled ILO estimate
40 The youth labour force is defined as the labour force aged between 15 and 24. 41 Except for the Seychelles, data on all African countries is used.
0
5
10
15
20
25
30
35
40
Sub-Saharan Africa Northern Africa

LABOUR SUPPLY OF POTENTIAL MIGRANTS FROM AFRICA 79
SEO AMSTERDAM ECONOMICS
South Africa and Eswatini (formerly known as Swaziland) have the highest youth- and total unemployment rates in Africa. This is shown in Figure 4.8, which displays the top 20 African countries with the highest youth and total unemployment rates. In both countries, more than 50% of the labour force aged between 15 and 24 is unemployed, which is about double the average unemployment rate in those countries. Lesotho, Mozambique, Namibia, and Libya are also found to be on the high end of the spectrum.
Figure 4.8 Within Africa, youth and total unemployment are highest in South Africa and Eswatini
Source: World Bank, Popular Indicators (2018), modelled ILO estimate, top 20 countries.
Youth unemployment rates in African countries are in general approximately double the total unemployment rates. This is not true outside of Africa. On average, the global youth unemployment rate is only half as high as the total unemployment rate. This difference is likely related to the high share of youth in African populations.
Eswatini
South Africa
Libya
NamibiaMozambique
Lesotho
Tunisia
Gabon
Botswana
SudanKenya
Mauritius
Algeria
Congo, Rep.
Sao Tome and Principe
AngolaMaliMorocco Mauritania
Cabo Verde
World
0
5
10
15
20
25
30
0 10 20 30 40 50 60
Tota
l Une
mpl
oym
ent r
ate
Youth Unemployment Rate

80 CHAPTER 4
SEO AMSTERDAM ECONOMICS
Figure 4.9 Within Africa, youth and total unemployment are lowest in Niger
Source: World Bank, Popular Indicators (2018), modelled ILO estimate, lowest 20 countries.
Among African countries, Niger has the lowest recorded rates of both total unemployment and youth unemployment. The total and youth unemployment rates in Niger equal 0.4% and 0.5% respectively. Also in comparison with the global average, these are considered very low. Figure 4.9 provides an overview of the 20 African countries with the lowest youth and total unemployment rates. Youth unemployment rates are found to be higher than the total unemployment rates for all these 20 countries, but the relative differences are smaller than among the top-20 African countries. Data on unemployment in Africa, and on youth unemployment in particular, are notoriously unreliable, and difficult to interpret. The ASCL Thematic Map about ‘decent work’ warns: “The data presented on this map should be interpreted with caution. The introduction to the ILO’s Decent Work Indicators in Africa: A First Assessment Based on National Sources Report (ILO, 2012), from which most of the data were taken, starts by emphasizing the scarcity of employment data in Africa. This concern is shared by an IMF working paper entitled Africa’s Got Work to Do: Employment Prospects in the New Century (Fox et al., 2013). The main challenges relate to the inconsistency of data collection with regards to the time at which they were collected and the methodological differences that inhibit comparison across and between countries. The map is to be seen as an indication of current labour-market dynamics and is an attempt to scale up efforts in collecting up-to-date employment figures and in supporting African governments in this respect”42. Another issue not captured by the data is that many ‘unemployed’ Africans work in the informal sector, often below their aspirations and abilities. They are likely to work as self-employed farmers, apprentices, or seasonal labourers, often for very low wages and in precarious circumstances. Many of those informal sector workers, but also a considerable number of people
42 ASCL 2013
Sierra LeoneCameroon
Burkina Faso
Zimbabwe
Malawi
Ethiopia
Congo, Dem. Rep.
GuineaSenegal
Benin
GhanaTanzania
Cote d'Ivoire
Liberia
MadagascarBurundi
UgandaTogo
Rwanda
Niger0
1
2
3
4
5
6
7
0 1 2 3 4 5 6 7 8 9 10
Tota
l Une
mpl
oym
ent r
ate
Youth Unemployment rate

LABOUR SUPPLY OF POTENTIAL MIGRANTS FROM AFRICA 81
SEO AMSTERDAM ECONOMICS
employed in the ‘formal sector’ (for Africa probably less than 20% of the total work force) are working below their aspirations and below their formal education levels. It should be added that ‘precarious employment’ in Africa also often means child labour, particularly in agriculture . For a country like Uganda, estimates are close to 40% of all children between 7 and 14 years.43 The fact that there are so many youth in Africa today, who are much better educated than their parents ever were, but lack job opportunities, is likely to have a big socio-economic impact. African youth in many countries increasingly realise that their (reasonably good) level of education is not going to allow them direct or easy access to greater prosperity and a better life. As a result, many start to feel disillusioned about the lack of job opportunities. (ASCL 2014).
4.4 Migration flows from Africa
4.4.1 Outward migration flows from Africa Given the limited labour market prospects in Africa, it is perhaps not surprising that emigration from Africa to non-African destinations is considerable.44 Weighted by population size, Africa’s intercontinental outmigration per 1000 inhabitants is still among the lowest in the world, but it is growing in relative and particularly in absolute terms. Thus far, the largest outward migration flows have been from Northern Africa – not from African countries with the worst education systems or labour market prospects (Figure 4.10). This is also true when migration flows are measured ‘per capita’, i.e., in percent of population size (Figure 4.11). If we look at the number of emigrants per capita, it is important to correct for the effect of small island states and countries at war. As Figure 4.11 shows, small island states tend to have very high outmigration figures (countries like Cape Verde, the Seychelles, Mauritius, the Comores and São Tomé & Principe). Moreover, outmigration from a country like is very high as well, due to the very long war conditions in that country. Abstracting from small island economies, there appears to be a positive correlation between the level of development and the size of outward migration flows from Africa. This can be seen in Figure 4.11, which connects intercontinental outmigration with the level of development, as measured by the UN Human Development Index (HDI, both for 2015). The categories used for HDI levels are: very low (I-lowest), low (I-other), mid-low (II), and middle (III). The size of the circles in the figure indicates the size of extra-African migration flows per 1000 inhabitants. These tend to be highest for small island economies, simply because those have low numbers of inhabitants. However, abstracting from those islands, it can be seen that generally, migration flows are larger for countries with a higher level of development, as measured by the HDI index. While intercontinental outmigration per 1000 inhabitants differs a lot within each of the four categories, the weighted averages per category are strikingly different.45 For the highest
43 https://ourworldindata.org/child-labor 44 However, only 1.4% of all people born in Africa live in other macro-regions (in 2015); this is 3% worldwide. 45 Weighting by population size is important in order to correct for the influence of small island states (which
tend to have very high migration figures due to their small size).

82 CHAPTER 4
SEO AMSTERDAM ECONOMICS
HDI group (III), the weighted average in 2015 was 43/1000; for group (II) it was 30/1000, but for the two lowest development categories (I) it was only 7/1000.46
Figure 4.10 The largest outward migration flows have been from northern Africa thus far
) In the early stages of development, migration is usually to destinations nearby. This could initially be cities and rural areas with better access to work and income, but also better amenities like schools and health facilities. Only those that migrate to neighbouring countries are counted as (international) migrants. For Sub-Sahara Africa in 2015, 70% of all international migration was to other African countries (often neighbours) and only 30% to intercontinental destinations. For North Africa, which generally has much higher HDI index figures, the large majority for international migration was intercontinental: for Morocco, Algeria and Tunisia mainly to Western Europe; for Libya, Egypt and Sudan mainly to the Middle East.
46 If we exclude Somalia (which had very high migration rates due to its long-term war), the score for the
lowest HDI category would be lower (5/1000).

LABOUR SUPPLY OF POTENTIAL MIGRANTS FROM AFRICA 83
SEO AMSTERDAM ECONOMICS
Figure 4.11 Per capita, the largest intercontinental migration flows tend to be from more developed African countries (and small islands)
Source: UNDESA/ASCL (2017b)
Empirical studies suggest that the relationship between development and migration generally has an inverted U-shape (‘migration hump’) that seems to hold for every decade since the 1960s. One example of such a ‘migration hump’ is shown in Figure 4.12. Various studies have repeatedly shown this relationship in other cross-section studies (covering many countries at a given point in time). Nonparametric regressions have shown that both the positive relationship between emigration and GDP per capita before the turning point, and their negative relationship after the turning point, are statistically significant at the 5% level (Clemens 2014; Dao et al., 2018). Putting the existing estimates into current (2019) PPP-adjusted U.S. dollars, the turning point seems to correspond to a GDP per capita level of around $10,000. Clemens (2014) also found that the migration hump has become more pronounced over time: the turning point is associated with a higher and higher level of migration as the years pass. However, Bade and De Kemp (2018) argue that the hump may in fact be less pronounced than previously thought. This is because small countries (often islands) often dominate the top of the curve, and the results are typically not weighted by country size (so the Comoros and Cape Verde are given as much weight in this analysis as China or India). They show that, if differences in population size are taken into account, the migration hump is much less pronounced than shown in graphs based on unweighted comparisons.

84 CHAPTER 4
SEO AMSTERDAM ECONOMICS
Figure 4.12 The inverted U-shaped relationship between GDP per capita levels and emigrant share in cross-section (in the year 2005).
Source: Adapted from De Haas (2010b).
4.4.2 What explains the ‘migration hump’?
Several so-called ‘migration transition theories’ have been put forward to explain the migration hump. These theories (going back to Zelinsky, 1971 and Gould, 1979) identify various economic, socio-political and other factors that accompany ‘development’ and that influence the decision to migrate. Following De Haas (2010a, 2010b), these factors can be grouped into ‘migration capabilities’ and ‘migration aspirations’. Migration capabilities (MC) tend to increase with development, following an S-shaped pattern. These capabilities increase with the lifting of credit constraints at home and the loosening of general or bilateral immigration barriers abroad, which both rise as per capita income grows (Vanderkamp, 1971; Rapoport and Docquier, 2005). MC can thus be expected to follow an S-shaped pattern, at first growing more and more rapidly because of the compounding impact of migrant networks and remittances, and later decelerating due to diffusion. Migration aspirations (MA), however, are more likely to have an inverted U-shape. They are a function of factors such as (i) the gap between domestic fertility and mortality rates –generating labour market pressures at home (Zelinsky, 1971), (ii) origin countries’ relationship with migrant networks abroad (Massey, 1988), (iii) opportunity costs of migration (Martin and Taylor, 1996), and (iv) domestic inequality (Stark, 2006). For all of these factors, it is reasonable to assume that they first rise and later decrease with development (cf. Clemens, 2014). Figure 4.13 illustrates these migration transition theories. At development levels Dlow and
Dmedium, we assume that the aspiration to migrate is the same, at MA1 = MA2. Yet migration
capabilities at Dlow are much lower than at the higher development stage Dmedium. For an equal
>22273 2083-5000 5000-9032 9032-22273
GDP per capita, 2005 (PPP values) <2083
Emigrants
Immigrants
20
18
16
14
12
10
Mig
rant
stoc
k, %
of t
otal
pop
ulat
ion
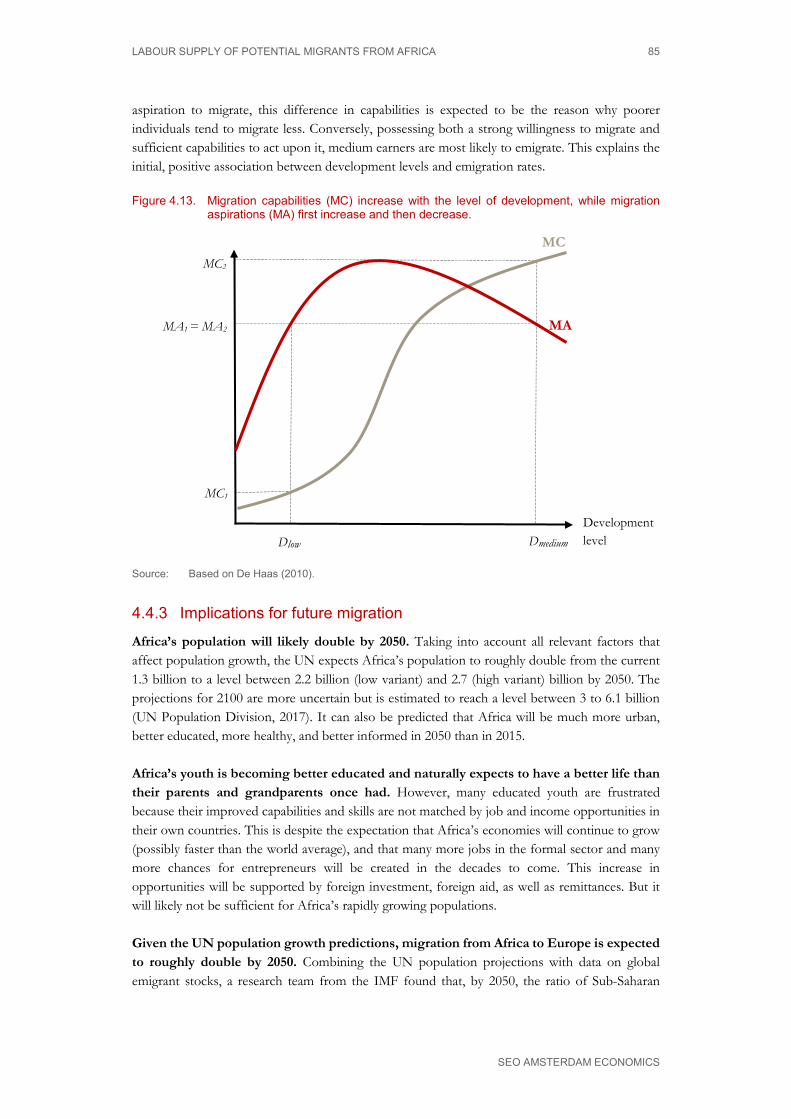
LABOUR SUPPLY OF POTENTIAL MIGRANTS FROM AFRICA 85
SEO AMSTERDAM ECONOMICS
aspiration to migrate, this difference in capabilities is expected to be the reason why poorer individuals tend to migrate less. Conversely, possessing both a strong willingness to migrate and sufficient capabilities to act upon it, medium earners are most likely to emigrate. This explains the initial, positive association between development levels and emigration rates.
Figure 4.13. Migration capabilities (MC) increase with the level of development, while migration aspirations (MA) first increase and then decrease.
Source: Based on De Haas (2010).
4.4.3 Implications for future migration
Africa’s population will likely double by 2050. Taking into account all relevant factors that affect population growth, the UN expects Africa’s population to roughly double from the current 1.3 billion to a level between 2.2 billion (low variant) and 2.7 (high variant) billion by 2050. The projections for 2100 are more uncertain but is estimated to reach a level between 3 to 6.1 billion (UN Population Division, 2017). It can also be predicted that Africa will be much more urban, better educated, more healthy, and better informed in 2050 than in 2015. Africa’s youth is becoming better educated and naturally expects to have a better life than their parents and grandparents once had. However, many educated youth are frustrated because their improved capabilities and skills are not matched by job and income opportunities in their own countries. This is despite the expectation that Africa’s economies will continue to grow (possibly faster than the world average), and that many more jobs in the formal sector and many more chances for entrepreneurs will be created in the decades to come. This increase in opportunities will be supported by foreign investment, foreign aid, as well as remittances. But it will likely not be sufficient for Africa’s rapidly growing populations. Given the UN population growth predictions, migration from Africa to Europe is expected to roughly double by 2050. Combining the UN population projections with data on global emigrant stocks, a research team from the IMF found that, by 2050, the ratio of Sub-Saharan
Development level Dlow Dmedium
MA1 = MA2
MC1
MC2 MC
MA
86 CHAPTER 4
SEO AMSTERDAM ECONOMICS
African (SSA) migration as a share of the OECD population could increase to 2.4%, from 0.4% in 2010 (González-García et al., 2016). Using the same technique, a recent study by the European Commission’s Joint Research Centre (Natale et al 2018) found that, taking demographic growth projections alone (and assuming constant trends for socio-economic, population growth and migration intensity), the intensity of SSA migration to Europe will more than double in 2050. This corresponds to an increase in the annual number of Africans leaving their country of origin (to a destination within or outside of Africa) from 1.4 million in 2015 to 2.8 million in 2050 (assuming a constant rate of migration). In an alternative scenario, both population growth and economic development are taken into account as determinants of emigration, in line with the migration transition theories. In this case, the European Commission estimates that the annual number of African leaving their countries of origin would rise to 3.5 million per year by 2050. Based on the UN population pyramids projected for 2050 and on a global bilateral migration matrix compiled by a World Bank research team (cf. Ozden et al., 2011), Héran (2018) finds that SSA migrants will make up around 4% of Europe’s population by 2050.47 Using somewhat different assumptions, Bade and De Kemp (2018) estimate that the total number of migrants from Africa to another continent would increase from 14.6 million in 2015 to 32-50 million in 2050. A large part of this increase is the result of the projected doubling of the population. It seems unlikely that future migration flows from Africa would have the same profile of destination countries as in the past. On the one hand, it could be expected that a larger proportion will migrate to Asia than the 28% in 2015, and it is possible that Europe will lose some of its appeal (especially if anti-migration and anti-Islam sentiments became stronger and led to stricter migration policies). On the other hand, there are likely to be important ‘network’ effects associated with the fact that existing migrants form a network that could assist or encourage future migrants.48 Nevertheless, it seems unlikely that Europe’s position in the intercontinental migration from Africa will fall below 50%. On top of this intercontinental migration driven by economic and social growth, there might be calamity-driven migration. This could happen as a result of (civil) warfare, climate-related disasters, and political (youth) revolts. The very high migration figures for Somalia and the high figures for Eritrea are warning signs. If things were to go wrong in Egypt, or in South Africa, the recent numbers of Afghan, Iraqi and Syrian refugees might look small if we compare them with what could be a result of calamity-forced migration from these high-risk areas in Africa. Moreover, a lot of migration is not ( mainly) a result of economic aspirations or calamity-forced circumstances. Some of it is because of social reasons (education, love, fleeing from anti-homosexual attitudes) and/or because of a desire for adventure and exploration.
47 Note that these projections for migration are quite uncertain, as they depend on assumptions made about
(a) demographic developments; (b) socioeconomic developments; (c) climate change; and (d) violence and political instability. As Bade and De Kemp (2018) point out, however, the easiest of these factors to predict is demographic developments, because the vast majority of the young people who are going to migrate between now and the next 25 years have already been born.
48 A general finding corroborated by econometric research on the determinants of migration is that a 10 percent increase in the migration stock in a given year will lead to a four percent further increase in immigration flows over the next ten years (cf. Beine, Bertoli and Fernández‐Huertas Moraga,, 2016). If this is correct, then Europe is likely to remain a preferred destination for many African emigrants because of its already large stock of migrants.

LABOUR SUPPLY OF POTENTIAL MIGRANTS FROM AFRICA 87
SEO AMSTERDAM ECONOMICS
It is not likely that there will be rapid socio-economic development in the Sahara-Sahel belt. Most migration from that belt can be expected to be calamity-driven. But for the region south of the Sahara-Sahel belt, socio-economic development can be expected to be high between now and 2050, and this will mean a high likelihood that aspiration/capability-driven (youth) migration from Africa will mainly come from that region. Not because it will be a disaster zone, but because it will experience rising prosperity. With fast-rising numbers of university graduates in major parts of Africa, it can be expected that Africans aspiring to migrate will increasingly be higher skilled. A growing number of young Africans now pursue degrees from public and increasingly private universities, both from within Africa and from abroad, increasingly from Asia. The demand for these highly-skilled Africans will not only come from countries like the Netherlands or Europe in general, but also from other continents. In the global competition for brains and skills, economic opportunities are not the only determinants of migration. Social and cultural factors play a major role too, and many Africans that pursue higher education abroad will want to return to Africa (brain circulation).
88 CHAPTER 4
SEO AMSTERDAM ECONOMICS
References to Chapter 4 Economist, The (2018), Can refugees help to plug Europe's skilled-labour gaps? Employing refugees in Germany
and Sweden, 16.6.2018
ASCL (2013), “Africa's economic growth from a labour perspective: selected decent work indicators”. Thematic Map No 6. African Studies Centre Leiden. Available at: https://openaccess.leidenuniv.nl/handle/1887/22067
ASCL (2014), “Africa Population Dynamics”, ASCL Thematic Map No. 9, African Studies Centre Leiden. Available at: http://hdl.handle.net/1887/25786
ASCL (2017a), “Education in Africa: recent dynamics and current situation,” ASCL Thematic Map No. 16, African Studies Centre Leiden. Available at: http://hdl.handle.net/1887/47429
ASCL (2017b), “Africa: international migration, emigration 2015”, ASCL Thematic Map No. 17, African Studies Centre Leiden. Available at http://hdl.handle.net/1887/54691
ASCL 2017c, “Africa in the 21st Century”. ASCL Infosheet 33. African Studies Centre. Available at https://www.ascleiden.nl/publications/africa-21st-century
Bade, J. and A. De Kemp (2018), “Ontwikkeling en Migratie”, IOB Studie No. 427, The Hague: Dutch Ministry of Foreign Affairs. (Translated as “Development and Migration”.)
Beine, M., Bertoli, S., & Fernández‐Huertas Moraga, J. (2016). A practitioners’ guide to gravity models of international migration. The World Economy, 39(4), 496-512.
Clemens, Michael A. (2014). ‘Does development reduce migration?’ In: R.E.B Lucas (ed.) International Handbook on Migration and Economic Development. Cheltenham: Edward Elgar Publishing, pp. 152–185.
Darvas, Peter; Gao, Shang; Shen, Yijun; Bawany, Bilal (2017), Sharing higher education’s promise beyond the few in Sub-Saharan Africa (English). Washington, D.C. World Bank Group.
Dao, T. H., Docquier, F., Parsons, C., & Peri, G. (2018). Migration and development: Dissecting the anatomy of the mobility transition. Journal of Development Economics, 132, 88–101.
Dietz, Ton & Hein de Haas, 2018, Wen er maar aan! Migratie en ontwikkeling: een ongemakkelijke boodschap. Geografie 27/6 (juni 2018), pp. 26-32. https://openaccess.leidenuniv.nl/bitstream/handle/1887/63524/Dietz_geografie-2018-6-def.pdf?sequence=1.
De Haas, H. (2010a). ‘Migration and development: A theoretical perspective’. International Migration Review, 44(1), 227-264.
De Haas, H. (2010b). Migration transitions: a theoretical and empirical inquiry into the developmental drivers of international migration. Oxford: International Migration Institute. Working Paper 24.
De Haas, H. (2011). The determinants of international migration: conceptualising policy, origin & destination effects. Working paper. Oxford: International Migration Institute
Düvell, Franck; Cherti, Myriam and Lapshyna, Irina (2017), Does immigration enforcement matter? Irregular migration and control policies in the UK, Final Report, Oxford: Centre on Migration, Policy and Society
LABOUR SUPPLY OF POTENTIAL MIGRANTS FROM AFRICA 89
SEO AMSTERDAM ECONOMICS
Natale F., Migali S., and Munz R. (2018), Many More to Come? Migration from and within Africa, European Commission Joint Research Centre. Luxembourg: Publications Office of the European Union.
Özden, Ç., Parsons, C. R., Schiff, M., & Walmsley, T. L. (2011). Where on earth is everybody? The evolution of global bilateral migration 1960–2000. The World Bank Economic Review, 25(1), 12-56.
Fox, L. C. Haines, J. Huerta Muñoz, and A. Thomas (2013), Africa’s Got Work to Do: Employment Prospects in the New Century. IMF Working Paper No. WP/13/201.
González-García J., Hitaj E., MlachilaM., Viseth A., Yenice M., 2016, “Sub- Saharan African migration: Patterns and spillovers”, Spillover Note No. 9, International Monetary Fund.
Gould, J. D. (1979). European Inter-Continental Emigration 1815-1914: Patterns and Causes. Journal of European Economic History, 8(3), 593–679.
Héran, F. (2018). Europe and the spectre of sub-Saharan migration. Population & Sociétés, (558). ILO (2012) Decent Work Indicators in Africa: A first assessment based on national sources,
Geneva: ILO.| Massey, D. S. (1988). Economic Development and International Migration in Comparative
Perspective. Population and Development Review, 14(3), 383–413. Rapoport, H., & Docquier, F. (2005). The Economics of Migrants’ Remittances. IZA Discussion
Papers, (1531). Stark, O. (2006). Inequality and migration: A behavioral link. Economics Letters, 91(1), 146–152. UN Population Division 2017. Retrieved from https://population.un.org/wpp/ Vanderkamp, J. (1971). Migration flows, their determinants and the effects of return migration.
Journal of Political Economy, 79(5), 1012–1031. Zelinsky, W. (1971). The hypothesis of the mobility transition. Geographical Review, 219-249.


DUTCH LABOUR MARKET SHORTAGES AND POTENTIAL FOR LABOUR SUPPLY FROM AFRICA AND THE MIDDLE EAST 99
SEOAMSTERDAM ECONOMICS
5 Conclusions
In the Netherlands and many other European countries, ageing populations and structural change are increasingly giving rise to labour market shortages. High tech firms, hospitals and schools are having a hard time filling their vacancies. Young graduates with the right technical, medical, or ICT skills are in high demand. At the same time, around one third of young people in many countries near Europe are unemployed. Many countries in Africa and the Middle East are dealing with record high and still rising unemployment rates, especially for young people, women, and those with higher education. It is not surprising, therefore, that many of them increasingly aspire to migrate to Europe for job opportunities. Nevertheless, EU countries have issued few work visa for Africans over the past few years, and even the best educated Syrian refugees in the Netherlands have a hard time finding employment. A clear match between supply and demand has therefore not yet taken place. At the request of the Dutch Ministry of Foreign Affairs, this report has investigated the extent to which there is a potential match between Dutch labour demand and the supply of potential labour migrants from countries near Europe. For an in-depth analysis, the Ministry requested to focus on three cases studies: Nigeria, Tunisia and Jordan. In separate annexes, we have explored their education systems, labour markets, and existing experience with migration. Two additional annexes have explored lessons learned from recent migration policies in Germany and Sweden.
5.1 Labour market shortages in the Netherlands Current labour market shortages in the Netherlands arise from a combination of demographic factors, structural economic change and high economic growth, while qualitative mismatches are stable over time. The demographic trend of ageing populations is one of the reasons for labour market shortages to arise, as the working population declines compared to the total population size. Other reasons are structural changes in the economy that result from chancing preferences and technological developments. In the short run, the business cycle also has a large influence on labour shortages, even for sectors and occupations that become less important in the long run. Labour market shortages tend to provoke adjustment mechanisms that reduce these shortages in the long run. The main adjustment mechanisms that can be distinguished are: • Adjustments in the price of labour: rising or declining wages. • Adjustments in the quality of labour: higher or lower quality, less or more variety. • Adjustments in the labour force participation rate (number of people, number of hours. • Adjustments in the contribution of labour to the production process: technological change. • Adjustments in the size of the labour force via emigration or immigration. • Adjustments in the demand for domestic labour via outsourcing or foreign investment. • Adjustments in transactions costs that reduce information mismatches.

92 CHAPTER 5
SEO AMSTERDAM ECONOMICS
Each of these mechanisms can be expected to help reduce labour shortages over time. They can cause labour supply and labour demand to move into the direction of a new equilibrium, with adjusted wages and/or employment levels. In the short run it is possible for certain shortages to exist, as a consequence of the fact that these adjustment mechanisms take time to realize. In the long run, dynamics on the labour market may cause a continuum of new types of shortages, giving the impression that shortages may be persistent. It is difficult to project the exact size of the supply and demand of labour in the long run, let alone labour market shortages that result from a mismatch between the two. For that reason, there are no projections in the literature that go beyond a horizon of 10 years. Existing projections of labour market demand and supply by the Research Centre for Education and the Labour Market (ROA) only go up to 2022. In these projections it is expected that the highest rate of job creation will take place in the ‘health’ sector, with an average yearly increase of 3.1 percent, followed by ‘wholesale’ (1.9 percent) and ‘construction’ (1.7 percent). On the other side of the spectrum, ROA expects that the sectors ‘agriculture, forestry and fishing’ and ‘chemical industry’ will realize an average yearly decline of 1.1 and 0.3 percent, respectively. These projections are similar to predictions made by UWV, which also predicts the health and constructions sectors to expand considerably and the agricultural sectors to do less well. These statistics provide a good grasp of the sectors in which shortages are likely to arise, although they do not include information of the supply of labour in these sectors. Based on data about the inflow of labour, ROA has created an indicator that measures labour market bottlenecks by occupational group. Of the 12 types of occupations distinguished, seven are expected to experience ‘some’ to ‘large’ bottlenecks in staffing between 2017-2022. These are, in order of largest bottlenecks to smallest: 1. ICT occupations 2. Pedagogical occupations 3. Technical occupations 4. Managerial occupations 5. Creative and linguistic occupations 6. Health and well-being occupations 7. Public administration, security and legal occupations The occupational group with the largest expected bottlenecks, ICT, requires mainly highly skilled workers. The remaining ‘shortage’ occupations require both medium and high skilled workers. Occupations with the largest expected bottlenecks provide large labour perspectives for graduates. Diploma’s with the best labour market perspectives, ranked from the best to medium perspectives, are: 1. Technical diploma’s at the academic level 2. Technical diploma’s at the higher vocational level 3. Education diploma’s at the higher vocational level 4. Medical diploma’s at the academic level 5. Social and behavioral diploma’s at the academic level 6. Health diploma’s at the higher vocational level 7. Technical diploma’s at the medium vocational level

CONCLUSIONS 93
SEO AMSTERDAM ECONOMICS
There are several additional important skills that are required in most occupational groups with expected bottlenecks. These include (Dutch) language proficiency, problem solving abilities in a digital environment, and numeracy.
5.2 Labour supply in Nigeria, Tunisia and Jordan This section summarises our findings regarding (potential) labour supply from countries near Europe. For the overall trends, we have focused mostly on Africa, with some selected Middle Eastern countries. For in-depth studies, we focused on three case studies: Nigeria, Tunisia and Jordan.
5.2.1 Education
In many countries in Africa, enrolment rates for primary and secondary education have increased substantially over the past decades, but the Millennium Development Goal (MDG) of universal primary education has not yet been met. Universal primary education had been one of the key targets of the MDGs between 2000 and 2015, but this was only met by 20 countries in 2015. Seven African countries remained significantly behind the MDGs, especially for girls, with the worst performance in Eritrea, South Sudan and Liberia (and no data for countries like Somalia). Even in countries with higher enrolment rates, many African children still do not complete primary education, let alone secondary education. Despite educational reforms and improvements in enrolment rates and completion rates, the quality of education remains an issue in many African countries. Goal 4 of the new Sustainable Development Goals is to “ensure inclusive and quality education for all and promote lifelong learning”. A major challenge here is that, for most of Africa, measurement of the quality of education is still in its infancy. There are very few reliable indicators on quality of education that are comparable across African countries. The only African countries that participate in international assessments of language, mathematics, or science are some countries in North Africa (Morocco, Tunisia, Algeria) and they tend to score towards the bottom. In our case study countries, we found the following: • In Nigeria, only about half of all primary students continue to the secondary level, and less than
15 percent eventually make it to tertiary level. • In Tunisia, educational reforms since the late 1980s allowed a new generation to gain mass
access to education. However, the quality lagged behind, as indicated by the high number of repeaters in secondary and tertiary education and high dropout rates in secondary education.
• In Jordan, primary enrolment rates are nearly 100 percent for the native population, but only 65 percent for Syrian refugee children in Jordan. There are indications that the quality of education in Jordan deteriorated during 2007-2015, and math test scores are now at a similar level as in Morocco (and worse than in Egypt).
All case study countries have a high focus on engineering, mathematics, business, and ICT. • In Tunisia, the most popular subjects for tertiary education are business/law (20%),
engineering/manufacturing/construction (19%), and ICT (14%)

94 CHAPTER 5
SEO AMSTERDAM ECONOMICS
• In Jordan, the most popular fields are trade/business (27%), engineering (22%), followed by medical studies (9%) and mathematics/computer science (8%).
• In Nigeria, the most popular subjects are engineering and health, including for the increasing number of Nigerians who study in the US and the UK.
Syrians in Jordan tend to be lower educated than in Europe. There are various indications that Syrian refugees who came to Europe are relatively highly educated compared to those who remained in the region. Of the Syrian refugees in Germany and the UK, 26% and 27% respectively had higher education. (See Chapter 3 and Annex E on Germany). A small survey of 308 Syrian refugees in Austria, the Netherlands and the UK found that 38% had a university degree (Deloitte 2017). In Jordan, Syrians are mostly low educated and tend to work in low skilled jobs (see Annex B on Jordan). Many Syrian refugees in Jordan come from rural villages and smaller towns in Syria, and have at most secondary education. The same may be the case for Syrian refugees from Lebanon and Turkey. According to UNHCR, as many as 60% of Syrians in Jordan above the age of 15 never completed their high school degree.
5.2.2 Labour Markets
In many countries around Europe, unemployment rates are soaring, particularly among youth, women, and higher educated graduates. This is a pattern that was seen in all three case study countries, and is likely the case for many African countries and selected countries in the Middle East. Partly due to demographic developments, there is a shortage of employment opportunities for many youth in Africa, especially for higher educated youth. • Youth unemployment rates in Northern Africa have fluctuated around 30 percent—more than
double the rates in Sub-Saharan Africa. Following an initial decline from around 35 percent in 1998 to 25 percent in 2009, average youth unemployment in Northern Africa is now back at levels above 30 percent.
• In Tunisia, around 35% of young Tunisians aged 15 to 24 are unemployed, while overall unemployment is around 15%. Moreover, 42% of youth with tertiary education level is unemployed.
• In Jordan, youth unemployment is around 37%, and has risen for 20-24 year olds in recent years. Unemployment for women rose from 24% to 30%. Jordanians with a bachelor’s degree face the highest unemployment rate (23%).
• In Nigeria, unemployment tripled during the past three years, and was around 19% at the end of 2017. Youth unemployment (15-24 years) stood at 33% for those aged 15-24 years, and 20% for those aged 25-34 years. Unemployment is also higher among those with post-secondary education (31.8% in the third quarter of 2017.).
The growth in enrolment, participation and graduation in education that has recently been taking place in many countries in Africa and the Middle East has not (yet) resulted in job opportunities for higher educated youth. This is often attributed to the strong position of the public sector in the formal labour market in combination with a large informal labour market, which results in market failures. As a result, an increase in (higher educated) labour supply does not immediately result in a similar growth in employment. Some observations in this regard are: • Higher educated students are less likely to work in the informal sector.

CONCLUSIONS 95
SEO AMSTERDAM ECONOMICS
• Labour supply adjusts more quickly than labour demand: when there was high demand for higher educated staff, many decided to enroll in higher education. Now there is a surplus of higher educated students (competition). It will take time for the local economy to adjust.
• Weak business environment and high volatility of the political economy: higher educated students are less likely to e.g. start a business.
The fact that many youth in Africa today lack job opportunities, even though they are much better educated than their parents ever were, is likely to have a big socio-economic impact. African youth in many countries increasingly realise that their (reasonably good) level of education is not going to allow them direct or easy access to greater prosperity and a better life. As a result, many start to feel disillusioned about the lack of job opportunities. One way out for those who are ambitious and have the resources, is to pursue tertiary education abroad; but they typically do not come to the Netherlands. • For Nigeria, the US and the UK are the top destinations. Noteworthy is the large ‘brain drain’
of Nigeria-trained medical students and health workers as well as academics who appear to be fleeing Nigeria’s struggling tertiary education landscape and unstable labour market prospects. Thousands of them are now gainfully employed in medical jobs abroad, and they tend to prefer the US and the UK to the Netherlands. In the field of medicine, 14% of physicians who trained in Nigeria work abroad, with 90% of them living and working in either the US or in the UK.
• Higher educated Tunisians prefer France as a destination as a result of historical ties and language reasons. The recent growth in emigration to Germany, as a result of specific bilateral programs, seems to be more temporary and not completely successful.
5.3 Is there a match? For professions that require academic qualifications, it seems unlikely that a good match can be found between the Dutch labour market and potential migrants from Africa or the Middle East, due to concerns over the quality of their education systems. There are some pockets of excellence, however: for example, Jordan hosts 1 or 2 top universities with international rankings. For degrees that do not (yet) meet international standards, it is possible that the quality gap could be bridged with special programmes in the region, although prospective migrants may prefer to pursue higher education in Europe. Visa restrictions do not appear to be the main barrier in this case, since most academic (technical) jobs are likely to qualify for ‘knowledge migrant’ visas. This is already a global labour market, as confirmed by interviews with employers. For medium and higher vocational professions, there seem to be larger opportunities for matches. Graduates from Northern Africa and countries like Jordan are often strong in subjects such as engineering, ICT, and other technical professions. Nigerians' strong interest in health-related fields is also worth exploring. More detailed research on the quality of domestic vocational programmes would be needed to ascertain whether there is a qualitative match between the supply side and the demand side for particular vocational programmes and professions. If quality remains an obstacle, then further study could be made to assess to what extent it is possible to either (a) provide support to strengthen domestic vocational programs, or (2) attract prospective future migrants from these countries at an early stage, by encouraging them to study in the Netherlands.

96 CHAPTER 5
SEO AMSTERDAM ECONOMICS
It is unlikely that a good match can be made between Dutch labour demands and Syrian refugees based in Jordan (or Lebanon or Turkey). As our research showed, these Syrian refugees tend to be mostly lower educated and low skilled, while the Dutch labour market mostly demands higher education or at least higher vocational training programmes. The majority of male Syrian refugees in Jordan with employment work in agriculture, mechanics, or construction. However, given the large numbers of Syrian refugees involved, it is very well possible that a smaller subset of Syrian refugees in the Middle East have skills that could be useful to the Dutch or European labour market. The same holds for Syrian refugees in Europe, which tend to be more highly educated.
5.4 Barriers and opportunities related to migration policies
Even if matches between demand and supply can be found, migration policies will affect to a large extent whether these matches can materialise in practice. Migration policies therefore constitute both barriers and opportunities. On the one hand, the general framework of Dutch labour migration policy constitutes a barrier to labour migration. It is ‘demand driven’, with a high threshold labour market test and temporary residence permits for one year that require a full labour market tested extension procedure. On the other hand, the current Dutch migration policy framework does allow for various exemptions based on skills and income levels. The most well-known is the ‘knowledge migrant’ visa scheme that can be granted based on certain requirements, including income thresholds. Temporary labour migration for reasons of international trade and training are also facilitated. As the Dutch history of labour migration has shown, measures such as quota, temporariness and limited access to welfare arrangements have previously been used to allow for selective and limited labour migration. Sectoral policies were also used in the past (e.g., for health care workers), but are less in use now, with the exception of a policy for Asian Chefs. The broadly formulated authority to waive the work permit requirement allows the Dutch Minister of Social Affairs and Employment to adjust the labour migration policy to national economic needs. The Immigration Act states that admission policies should serve international obligations, humanitarian reasons or ‘the national interest’. The knowledge migrants scheme is a typical scheme designed to serve the national interest. The ‘search year’ (for a variety of highly educated people from Dutch, EU and mainly western universities) is also geared to the national interest, but does allow for a link to education and development. One of the latest adjustments, the hybridisation of work as employee while also working as self-employed person shifts the policy focus to retaining the highly skilled migrants for the Dutch economy in a wider sense, not just as workers. It allows them to invest in a future career in the Netherlands as entrepreneur and shows the highly skilled migration schemes are not just providing highly skilled workers for the labour market.
CONCLUSIONS 97
SEO AMSTERDAM ECONOMICS
At the EU level, labour and study migration into specific job types or sectors are regulated by five EU labour migration Directives, using skills and income levels as selection criteria. These directives on labour migration admission conditions and criteria present a fragmented framework. They also lack policy intersectionality, for instance with regard to diploma and skills recognition. However, the EU framework for bilateral migration agreements allows for policy intersection and a wide range of activities. Partnership agreements can be project based, small scale, and could facilitate (temporary) labour migration or training schemes for people from specific countries (also for Nigeria, Tunisia and Jordan). An important barrier to migration is the absence of an international or European legal framework for the recognition of non-EU diplomas. The Dutch organisation for internationalisation in education, Nuffic, sets useful common standards for the EU, but diplomas are still evaluated differently all over Europe. In the Netherlands, foreign diplomas are evaluated by EP-Nuffic and SBB, resulting in an advice to the educational institution or prospective employer. However, procedures to challenge an evaluation are absent and procedures to challenge admission decisions are not well communicated. Of course, transparency and access to legal procedures is not necessarily going to raise the level of foreign diplomas. Hence, this barrier is likely to be lifted only via preparatory courses or via improvements in educational programs that then eventually may be evaluated positively, or even recognised automatically, as is currently the case with EU diplomas.
5.5 Barriers and opportunities related to labour market integration of migrants
A successful labour market match also requires successful labour market integration. In this regard, it is relevant to note that migrants in the Netherlands still face other, non-regulatory barriers to labour market integration. The most important ones are (1) high expectations from employers regarding Dutch language requirements, (2) non-familiarity of Dutch employers with cultural differences, (3) a lack of relevant social networks; and (4) stereotyping (sometimes called ‘statistical discrimination’), based on the limited and specific previous Dutch experience with traditional groups of migrants (guest workers, former colonies, and refugees) that are likely not representative of future migrant flows and which therefore can create a ‘sample bias’. For second generation migrants in the Netherlands (particularly, the Moroccan Dutch and Turkish Dutch), employment and income gaps remain large and persistent. Despite having acquired Dutch education and Dutch language fluency, labour market participation is still worse for these groups and the unemployment rates for these groups are still up to three times higher than for their ethnic Dutch counterparts and did not reduce during 2003-2015. Only about 50% of that difference can be attributed to differences by education, age, or work experience. Similar large and persistent gaps are found in other European destination countries. The remaining gap is often attributed to a lack of ‘soft skills.’ In surveys and interviews, Dutch and other European often refer to language barriers, cultural differences, and differences in ‘work ethic’ as barriers to labour market integration. However, this is likely the result of the fairly limited and very specific experience that the Netherlands has had with traditional groups of

98 CHAPTER 5
SEO AMSTERDAM ECONOMICS
migrants from these regions, most notably guest workers and refugees. These specific groups have historically tended to be lower educated (sometimes even illiterate), socially and religiously more conservative, and statistically more likely to be unemployed than their Dutch counterparts. It is therefore not surprising that cultural differences are seen as a barrier to labour market integration for these groups of migrants. However, these groups are likely not representative of the types of labour migrants that are needed in the future. Similar barriers to labour market integration are experienced by various groups of migrants who came to the Netherlands for reasons other than employment but who could be a potential source of labour supply for the Dutch labour market. These groups include foreign students, spouses of labour migrants, and refugees. Despite the policy interest in retaining more foreign students and putting more refugees to work, success rates remain relatively low. Long-term residents with intra-EU mobility rights could offer an additional large pool of potential labour supply for the Dutch labour market, but they are not a target group of any policy and are not visible in any Dutch statistics. The difficulty of integrating into Dutch and European labour markets may well be reasons why labour migrants from West Africa often seem to prefer the UK or the US. Based on interviews, their reasons to prefer the UK or the US to the Netherlands include (a) difficulties with learning the Dutch language, (b) difficulties of finding suitable employment in the Netherlands (where it is felt that the ‘search year’ only tends to lead to low-paid internships); and (c) the perception that the Netherlands lacks certain social benefits for family members, such as work permits for spouses or subsidised university tuition for children. International research suggests that cultural differences need not be a key barrier to labour market integration in the long term. Extensive migration research carried out in the United States and Europe shows that both the first and second generations of migrants in the US tend to assimilate faster and achieve parity in labour market outcomes more quickly than in Europe. In fact, migrants in the US often perform better than ‘natives’, including migrants from the Middle East and from Africa. For example, Nigerian-Americans are considered among the most successful immigrant communities in the US. Nearly 30 percent of them hold a graduate degree, and many are employed as engineers, doctors, researchers, and entrepreneurs. While the US has a history that is very different from Europe, the US experience does illustrate that cultural differences need not stand in the way of successful labour market integration, particularly if the term ‘migrant’ is no longer associated with being low educated, as still is the case in Europe. When countries start to attract a larger variety of migrants of various backgrounds, education levels, and careers, one would therefore expect the negative stigma attached to the term ‘migrant’ to disappear over time. One suggestion to speed up this process would be to use the term ‘expat’ instead of ‘migrant’, as is already done in some countries.

DUTCH LABOUR MARKET SHORTAGES AND POTENTIAL FOR LABOUR SUPPLY FROM AFRICA AND THE MIDDLE EAST 99
SEOAMSTERDAM ECONOMICS
Appendix A Migration statistics: definitions
For the long-term migration stock data presented in this repot, we used the migration statistics producd by the Population Division of the United Nationas Department for Economic and Social Affairs (UNDESA).49 Reference years use mid-year as a point of reference (so for example, migration stock estimates for 2017 are in fact for 1/7/2017). For the purpose of estimating the international migrant stock, UNDESA equates international migrants either with the foreign born or with foreign citizens: “When data on place of birth are available, they are generally given precedence. Of the 232 countries or areas in Trends in International Migrant Stock: The 2017 Revision, data on the foreign-born were available for 182, or 78 percent. Data on foreign citizens were used for 47 countries or areas, or 20 percent. For the remaining three countries, since no empirical data were available, estimates were imputed based on regional trends”. (UNDESA 2017, p.2). Most of Europe, including the Netherlands, uses ‘foreign born’ as its definition of international migrants, but some European countries (Belgium, the Czech Republic) use ‘citizenship’, which makes international comparisons difficult. For the Netherlands a ‘citizenship’-based definition would mean much lower immigration figures (94 percent of people living in the Netherlands had a Dutch passport in 2017.50 Most of the data UNDESA used to estimate the international migrant stock by country or area were obtained from population censuses. Additionally, population registers and nationally representative surveys provided information on the number and composition of international migrants. For the Netherlands, where population censuses have not been organised since 1991, we used data from Statistics Netherlands (CBS) based on population registers. UNDESA assumes that for ‘developed countries’ (like the Netherlands) “refugees admitted for resettlement as well as recognised asylum-seekers are routinely included in population counts, be it by censuses or population registers”. Statistics Netherlands defines an immigrant as follows: “In order to be counted as an immigrant, these persons must be registered in the municipal population registers. Until September 1994, except for a few special cases, admission for a person with the Dutch nationality took place if [s]he had settled for more than 30 days and for a person with a non-Dutch nationality as the expected
49 The revised 1990-2015 data are available at UNDESA (2015). For the updated 2017 list and for definitions,
see UNDESA (2017). References in Chapter 3. For the data, see the Workbook: UN_MigrantStockByOriginAndDestination_2017 (available online).
50 http://statline.cbs.nl/Statweb/publication/?DM=SLNL&PA=03743&D1=0&D2=0,2&D3=0,8-206&D4=0,4,9,14,18-20&HDR=T,G1,G3&STB=G2&VW=T

100 APPENDIX A
SEO AMSTERDAM ECONOMICS
residence duration the 180 days exceeded. From October 1994, one is registered if one expects to stay in the Netherlands for at least four months”.51 Finally, Statistics Netherlands (CBS) defines ‘people with a migration background’ as those people for whom one or two parents were born outside the Netherlands. As of January 1, 2018, this was 23% of the Dutch population. If we were to go further back in time, this percentage would likely be even higher.
51 Definition in Dutch: “Om als immigrant te kunnen worden geteld dienen deze personen ingeschreven te
worden in de gemeentelijke bevolkingsregisters. Tot en met september 1994: een aantal speciale gevallen uitgezonderd, vond opneming voor een persoon met de Nederlandse nationaliteit plaats als deze zich voor langer dan 30 dagen dacht te vestigen en voor een persoon met een niet-Nederlandse nationaliteit als de verwachte vestigingsduur de 180 dagen overschreed. Vanaf oktober 1994: men wordt ingeschreven als men verwacht minimaal vier maanden in Nederland te blijven”. See: https://www.cbs.nl/nl-nl/onze-diensten/methoden/begrippen?tab=i#id=immigratie

