dyes and pigments apppendices | us epa archive · pdf fileboth aniline and o-toluidine were...
TRANSCRIPT


Appendix A
Evaluation of Potential for Developing HealthBenchmarks for Acetoacetanilide (AAA),
Acetoacet-o-toluidide (AAOT), andAcetoacet-o-anisidide (AAOA)

Appendix A
Evaluation of Potential for Developing HealthBenchmarks for Acetoacetanilide (AAA),
Acetoacet-o-toluidide (AAOT), andAcetoacet-o-anisidide (AAOA)
A.1 Background
For the 1994 proposed listing determination for wastes from the manufacture of dyes and pigments (59 FR 66072, December 22, 1994), conditional health benchmarks were developed for acetoacetanilide (AAA), acetoacet-o-toluidide (AAOT), and acetoacet-o-anisidide (AAOA) based on structure activity relationships (SAR). The U.S. Environmental Protection Agency (EPA) used a SAR approach because, at the time, no EPA-verified health benchmark values were available for these compounds and no constituent-specific toxicity studies were identified that could be used to develop benchmarks.
The SAR analysis performed for the proposed rule relied upon metabolic pathway information to develop toxicologic values based on the carcinogenic potential of aromatic amines. The metabolic pathways for the class of compounds identified as aromatic amines were acetylation and N-hydroxylation. Using this information, EPA proposed the use of the toxicity of aniline to represent the toxicity of AAA and the toxicity of 2-aminotoluene to represent the toxicities of AAOA and AAOT.
AAA was assumed to be a structural analog of aniline and the metabolic pathways were expected to be similar. It was noted that as much as 60 percent of aniline absorbed in humans is oxidized in a dose-dependent way to give o- and p-aminophenol, the first step in amide formation. The metabolites of these products include acetylated arylamines, which are responsible for the toxicity of aniline. Because the acetyl group is already part of AAA, initial acetylation may be considered complete. And, because only 60 percent of the aniline is expected to be metabolized by the acetylation pathway and AAA is acetylated in its original form, the toxicity of AAA was expected to be proportionally greater than the toxicity of aniline. Also, because the metabolic conversions occur on a molar basis and the doses in laboratory studies are reported as parts per million, the difference in molecular weight was considered. Considering these factors, the health-based level (HBL) for AAA in drinking water was estimated to be 0.003 mg/L as compared to 0.006 mg/L for aniline.
For the proposed rule, AAOT and AAOA were considered structural analogues of 2-aminotoluene, and the metabolic pathways were expected to be similar to those previously

described for aniline. Also, because only 25 percent of the aminotoluene was expected to be metabolized by the acetylation pathway, and AAOT and AAOA are acetylated in their original forms, their toxicities were expected to be proportionally greater than the toxicity of 2-aminotoluene. Considering metabolic pathway differences and differences in molecular weight, the HBLs for AAOT and AAOA in drinking water were estimated to be 0.00004 mg/L and 0.00005 mg/L, respectively, as compared to 0.0001 mg/L for 2-aminotoluene. EPA assumed a direct quantitative relationship between the constituents of concern and these compounds that follow a similar metabolic route.
Since publication of the proposed rule, EPA has reviewed the data submitted by commenters and conducted a literature search to identify other metabolic and toxicity data recently published in the scientific literature that can be used to predict the metabolism and/or toxicity of these constituents. A review of the metabolic pathways and proposed mechanisms of toxicity for these compounds submitted by commenters and identified in the literature is presented below.
A.2 Summary of Major Comments on SAR for Proposed Rule
Commenters on the proposed rule disagree with EPA’s primary assumption in the proposed rule that AAA, AAOT, and AAOA are carcinogenic based on structure activity relationships. They believe that EPA’s characterization of aniline carcinogenicity is incorrect. Commenters assert that the metabolic pathways for aniline described in the proposed rule (ring-hydroxylation and acetylation) actually contribute to clearance of aniline from the body by forming conjugates with glucouonide and sulfate, which are excreted in the urine. Further, commenters note that current toxicologic data suggest that the mechanism for the carcinogenicity of aniline is attributable to the hematoxic effects of aniline, which can produce hemolytic anemia and methemoglobinemia in both humans and laboratory animals. Because this is a nongenotoxic mechanism, commenters assert that the metabolic pathways used in the SAR approach are inappropriate for characterizing the carcinogenicity of aniline and thus structural analogs of aniline. The commenters believe that the same argument holds for AAOT and AAOA.
One commenter submitted a screening information data set (SIDS) dossier on AAA as well as genotoxicity tests to support the contention that AAA, AAOT, and AAOA are not carcinogenic. The SIDS data included a 14-day preliminary oral rat study and a 28-day subchronic oral rat study.
A.3 Toxicity Data for AAA, AAOA, and AAOT
This section summarizes the available data on these compounds. Their structures are presented in Figure A-1. These compounds are classified as arylamines.

Toxicity data provided by commenters for AAA, AAOA, and AAOT were limited to mutagenicity data and acute oral and dermal exposures to laboratory animals. LD50 values in rat and mouse following oral administration, and in guinea pig following dermal exposure, indicate a relatively low acute toxicity for these compounds, with all LD50 values >1,000 mg/kg. The primary target tissue identified in rats administered the chemicals in feed (11 days for AAOT, 14 days for AAA and AAOA, and 28 days for AAA) was the blood, with secondary effects in liver (AAA only) and spleen. Mutagenicity tests in Salmonella strains gave negative results for all three compounds with and without activation with hepatic S9. AAOA and AAOT were also tested in the Chinese hamster ovary and unscheduled DNA synthesis assays, and neither compound was positive with or without activation with hepatic S9. No additional constituent- specific toxicity data were located through a search of recent literature.
A.3.1 Weight of Evidence for Carcinogenic Potential for AAA, AAOA, and AAOT
To provide additional background information that may be considered when assessing the limited acute toxicity data provided by the commenter and reexamine the basis for the SAR analysis conducted for the proposed rule, the weight of evidence for potential carcinogenic metabolic pathways for the class of arylamine compounds is discussed here.
Both aniline and o-toluidine were evaluated for carcinogenic potential by the International Agency for Research on Cancer (IARC, 1987a and 1987b.). After reviewing the data available in1987, IARC placed aniline in group 3, inadequate evidence of carcinogenicity, because of inadequate evidence for carcinogenicity to humans and limited evidence of carcinogenicity to animals and placed o-toluidine in Group 2B, limited evidence of carcinogenicity, because of inadequate evidence of carcinogenicity to humans and sufficient evidence of carcinogenicity to animals.
Aniline hydrochloride was tested for carcinogenicity in single experiments in mice and rats by oral administration. No increase in tumor incidence was found in mice. In rats, aniline produced fibrosarcomas, sarcomas, and hemangiosarcomas of the spleen and peritoneal cavity. In other limited studies, largely negative results were noted. In bioassay testing, aniline induced mixed results. (IARC, 1987a)
In the case of o-toluidine, evidence for carcinogenicity to humans was judged to be inadequate, however, evidence for carcinogenicity to animals was judged sufficient. o-Toluidine produced neoplasms at various sites in both rats and mice by oral administration, in particular, vascular tumors including tumors of the spleen and other abdominal hemangiosarcomas. Other limited studies following subcutaneous administration showed no treatment-related neoplasms. However, several of these studies were inadequate for evaluation. No uniform results were obtained from bioassay testing. (IARC, 1987b)
Other studies indicate that aromatic amines associated with the production of dyes are often bladder carcinogens but may also attack the liver and spleen (Ward et al., 1991; Garner et al., 1984). These compounds are activated to carcinogens following N-oxidation, and this product can be further activated by N-acetyl and O-acetyl transferases (NAT/OAT) to ultimately

form reactive acetoxy esters. The acetyl group can be directly conjugated to the hydroxyl moiety, or can be intramolecularly transferred to that atom by an N-acetyltransferase-catalyzed B to O- rearrangement after the formation of an acetamido metabolite. The enzymes involved in the hydroxylation include cytochrome P450 (P450), prostaglandin H synthase, and flavin-containing monooxygenases. P450 hydroxylates both the amino group of arylamines to form N-hydroxyarylamines and nitrosoarenes, as well as aromatic carbon atoms ortho- and para- to that substituent. The unstable product formed following N-oxidation dissociates to produce reactive carbonium and/or nitrenium ions (Parkinson, 1996).
Both 2-aminofluorene (AF) and 2-(acetylamino)fluorene (AAF) are considered the prototypical aromatic amines for which the most biological data are available and serve as biochemical models for these processes (Patel et al., 1998) (Figure A-2). The same activation scheme is involved in the activation of the aniline derivative, acetaminophen (4-hydroxyacetanilide, Tylenol, paracetamol), to the proximate hepatotoxin (Dahlin et al., 1984), although the presence of the para-hydroxy group provides for conjugation reactions (glucuronidation and sulfation) that predominate in its metabolism and serve as detoxifying reactions. The genotoxicity and carcinogenicity of acetaminophen has been comprehensively reviewed most recently by Bergman et al. (1996). Although the hepatotoxicity and lethality of acetaminophen is well established in humans, the genotoxicity and carcinogenicity data are ambiguous. At nonhepatotoxic levels (ca. 250 mg/kg in man), the studies do not indicate a carcinogenic potential for acetaminophen, but inconsistent positive genotoxicity and carcinogenicity have been reported at higher levels.
For ortho-anisidine and other aniline derivatives, a peroxidation that yields reactive diamines and quinoneimine intermediates (Figure A-3) that potentially bind protein/DNA has also been identified (Thompson and Eling, 1991). Because the urinary bladder contains substantial peroxidase activity, activation by this and other extrahepatic activating systems merit consideration when assessing the adequacy of hepatic S9 in mutagenicity tests.
The N-oxidized metabolites of arylamines can alkylate DNA and other macromolecules but also oxidize hemoglobin in a reaction that causes methemoglobinemia. In the case of aniline, the N-hydroxy, nitroso, nitro, and possibly ortho- and para- aminophenol, metabolites can oxidize hemoglobin to cause methemoglobinemia and, consequently, hyperplasia and siderosis of the spleen (Kao et al., 1978, Kiese, 1966; Radomski, 1979). However, a relatively large amount

peroxidase
� -Anisidine
N
NH
OCH3
OCH3
NH2
OCH3
NH2
OCH3
N
O
OCH3
OCH3
NH
OH
OCH3
OCH3
Diimine
NH3 GSH, Ascorbate
Quinoneimine
Nucleophilic DNA/Protein Adduction
Cancer Cancer
tetramer
.+
Adapted from Thompson and Eling 1991.
of the oxidized equivalents is required to convert a significant amount of the hemoglobin. Splenic damage is secondary to erythrocytic effects, and relatively high doses of arylamine are required to reach the threshold past which this toxic effect is elicited. Consequently, splenic effects found in laboratory animals may be of less concern than the causation of tumors, particularly in bladder, that have been associated with human occupational exposure to o-toluidine (Rubino et al., 1982) and/or aniline (Ward et al., 1991, 1996).
EPA does not believe that the data provided here are sufficient to support a quantitative estimate of the carcinogenic potency of these compounds. The best means of ascertaining if cancer risk is associated with exposure to these chemicals is through conducting 2-year carcinogenicity studies and, in the case of arylamides that may be metabolized to arylamines, paying particular attention to the carcinogenic responses of the bladder. At a minimum, a 13-week study could be performed to allow adequate assessment of the carcinogenic potential of these chemicals, but no such data are available.
In the absence of these data, it would be useful to conduct metabolism studies to determine if, for example, AAOT is deacylated to form the known carcinogen o-toluidine. While the carcinogenicity and metabolism of AAA, AAOT, and AAOA have not been determined, it is interesting to note that they promote methemoglobinemia in laboratory animals. This suggests that a significant portion of the dose is deacylated and N-oxidized in vivo, potentially forming known proximate carcinogens,( i.e., o-toluidine) . The carcinogenicity of o-toluidine is well established in animals. It produces significant increases in the incidence of one or more types of neoplasms in the organs of F344 rats and B6C3F1 mice of both sexes. These responses are not limited to the spleen; responses in rats include mesotheliomas of the abdominal cavity or scrotum in males and transitional-cell carcinomas of the urinary bladder in females and increased incidences of fibromas of the subcutaneous tissue in males and fibroadenomas or adenomas of the mammary gland in females (NCI, 1979). In mice, hemangiosarcomas were induced at various sites in males, and hepatocellular carcinomas or adenomas were induced in females. Similarly, o-anisidine has been found to be carcinogenic in F344 rats and B6C3F1 mice, inducing transitional-cell carcinomas or papillomas of the bladder in both rats and mice and in both sexes of each species, transitional-cell carcinomas of the pelvis of the kidney in male rats, and follicular-cell tumors of the thyroid in male rats (NCI, 1978). Aniline is at most a weak

carcinogen, possibly due to the lesser reactivity of its activated derivatives with DNA (Jacobsen et al., 1988; Ward et al., 1991; Jackson et al., 1993).
Unfortunately, toxicity testing of AAA, AAOT, and AAOA has been limited to LD50 studies, gross toxicity after short-term dosing, and genotoxicity tests. Because bladder and liver carcinogenicity are the most serious effects associated with this class of molecules, the tests conducted were not well chosen to determine the hazards associated with their exposure. Although genotoxicity tests were conducted with and without S9 as an activating system, these methodologies are inadequate to allow the optimal assessment of the carcinogenic potential of aromatic amines. Concerns about the sensitivity of commonly used Salmonella strains in assessing the mutagenic potential of aromatic amines has led to the development of new tester strains that express enzymes that activate carcinogens (Josephy et al., 1997). Optimally, the system must be able to bioactivate the aromatic amine within the bacterial cell rather than be supplemented externally with a hepatic supernatant that may or may not contain the activating systems responsible (e.g., cytochrome P450 and NAT/OAT) for hepatic and extrahepatic toxic responses (Josephy et al., 1995). Interestingly, many of these systems were derived from some of the strains used in data submitted by commenters to test AAA, AAOT, and AAOA, and those Salmonella strains, TA-98 and TA-1535, are devoid or deficient in NAT and have greatly reduced sensitivity to the mutagenicity of aromatic amines. Recent research has come to fruition with the development of bacterial cell lines that simultaneously express human cytochrome P450, its reductase, and N-acetyltransferase (Josephy et al., 1998), replacing the need for S9 and increasing sensitivity.
In conclusion, the carcinogenic action of arylamines, particularly on the bladder, is the most serious health effect associated with their exposure. This can best be ascertained for AAA, AAOT and AAOA, by 2-year carcinogenicity studies, although 13-week exposures may also reveal this activity. Two of the compounds reviewed, AAOT and AAOA, are acetoacetamide derivatives of known carcinogens. It would be advisable to determine in metabolism studies whether they are hydrolyzed in vivo to form these arylamines, a reaction suggested by the methemoglobinemias observed after administration of the compound to rats. Mutagenicity tests in Salmonella proved negative for the three arylamides, but it is unclear if the strains used allowed for exposure of the nuclear material to proximate carcinogens. More modern strains expressing the activating enzymes may be more predictive of genotoxic actions of these compounds (Josephy et al., 1998), and should be considered for future characterization of their potential toxicity.
A.4 Developing Health Benchmarks
Insufficient data are available to make a quantitative estimation of the carcinogenic potential of AAA, AAOA, or AAOT or to establish a provisional noncancer benchmark without great uncertainty. Therefore, alternatives are presented with the associated limitations and uncertainties of each approach. A.4.1 Precedence for Using SAR Weight-of-Evidence Approach
Insufficient constituent-specific toxicity test data currently exist to classify AAA, AAOA, or AAOT as potential carcinogens for regulatory purposes. However, a precedent

for using SAR analysis in the absence of constituent-specific toxicity testing has been established in the final rule for the hazardous waste listing decision for organobromines. In the response to comments document for the organobromines rule, EPA addressed this policy issue for the listing program as follows:
The Agency agrees that this listing represents a new element in the Agency's policy in that this is the first listing to use SAR as a basis for listing a wastestream as hazardous. The Agency was specifically exploring the establishment of a precedent in using other than Agency-verified toxicity data when it issued the organobromines listing proposal. EPA takes the position that, depending on the strength of the evidence, SAR-based listings are appropriate to use for the hazardous waste listings program because SAR is an available tool that can solve a problem the Agency will regularly face: making risk-based regulatory decisions (such as listing determinations) in the absence of Agency-verified or provisional health benchmark s(e.g., reference dose [RfD], reference concentration [RfC], or cancer slope factor [CSF]). SAR is one approach that was designed to specifically address this problem. The use of SAR is particularly compelling in the organobromines listing determination. The constituent has an extremely close structural analog (2,4,6-TCP) for which direct toxicity data are available. Because of this, the Agency specifically solicited comment on the policy implications of the use of QSAR in the organobromines proposal.
In addition, in the 1996 Guidelines for Carcinogen Risk Assessment, EPA presented guidance for the use of SAR to predict carcinogenicity in Section 2.3.2 (61 FR 17977):
2.3.2. Structure-Activity Relationships
Structure-activity relationship (SAR) analyses and models can be used to predict molecular properties, surrogate biological endpoints, and carcinogenicity. Overall, these analyses provide valuable initial information on agents, which may strengthen or weaken the concern for an agent's carcinogenic potential. Currently, SAR analysis is useful for chemicals and metabolites that are believed to initiate carcinogenesis through covalent interaction with DNA (i.e., DNA-reactive, mutagenic, electrophilic, or proelectrophilic chemicals) (Ashby and Tennant, 1991). For organic chemicals, the predictive capability of SAR analysis combined with other toxicity information has been demonstrated (Ashby and Tennant, 1994). The following parameters are useful in comparing an agent to its structural analogues and congeners that produce tumors and affect related biological processes such as receptor binding and activation, mutagenicity, and general toxicity (Woo and Arcos, 1989):
• nature and reactivity of the electrophilic moiety or moieties present,• potential to form electrophilic reactive intermediate(s) through chemical, photochemical, or
metabolic activation,• contribution of the carrier molecule to which the electrophilic moiety(ies) is attached,• physicochemical properties (e.g., physical state, solubility, octanol-water partition coefficient,
half-life in aqueous solution),• structural and substructural features (e.g., electronic, stearic, molecular geometric),• metabolic pattern (e.g., metabolic pathways and activation and detoxification ratio), and• possible exposure route(s) of the agent.
Suitable SAR analysis of non-DNA-reactive chemicals and of DNA-reactive chemicals that do not appear to bind covalently to DNA requires knowledge or postulation of the probable mode(s) of action of closely related carcinogenic structural analogues (e.g., receptor-mediated, cytotoxicity-related). Examination of the physicochemical and biochemical properties of the agent may then provide the rest

of the information needed in order to make an assessment of the likelihood of the agent's activity by that mode of action.
In fact, in the Guidelines, the example of using SAR to support a finding of carcinogenicity (Narrative #4) is for an aromatic amine.
Bis-benzenamine
CAS# XXX
CANCER HAZARD SUMMARY
This chemical is likely to be carcinogenic to humans by all routes of exposure. Its carcinogenic potential is indicated by (a) tumor and toxicity studies on structural analogues, which demonstrate the ability of the chemical to produce thyroid follicular cell tumors in rats and hepatocellular tumors in mice following ingestion and (b) metabolism and hormonal information on the chemical and its analogues, which contributes to a working mode of action and associates findings in animals with those in exposed humans. In comparison with other agents designated as likely carcinogens, the overall weight of evidence for this chemical places it at the lower end of the grouping. This is because there is a lack of tumor response data on this agent itself. Biological information on the compound is contradictory in terms of how to quantitate potential cancer risks. The information on disruption on thyroid-pituitary status argues for using a margin of exposure evaluation. However, the chemical is an aromatic amine, a class of agents that are DNA-reactive and induce gene mutation and chromosome aberrations, which argues for low-dose linearity. Additionally, there is a lack of mode of action information on the mouse liver tumors produced by the structural analogues, also pointing toward a low-dose linear default approach. In recognition of these uncertainties, it is recommended to quantitate tumors using both nonlinear (to place a lower bound on the risks) and linear (to place an upper bound on the risks) default approaches. Given the absence of tumor response data on the chemical per se, it is recommended that tumor data on close analogues be used to possibly develop toxicity equivalent factors or relative potencies.
Using these precedents, a conditional toxicity equivalency factor (TEF) might be calculated based on aniline for AAA and o-toluidine for AAOA and AAOT. However, EPA believes that, although a qualitative judgment can be made as to the likelihood that these compounds may be carcinogenic, the data are not sufficient to justify calculation of a CSF.
A.4.2 Available Acute Toxicity Data
The toxicity data available for AAA, AAOA, and AAOT are extremely limited. The data include a 28-day toxicity study of AAA, an 11-day toxicity study of AAOT, and a 14-day toxicity study of AAOA. These studies are all of too short duration to be considered subchronic studies. Subchronic studies are 13 weeks in duration. Hence, the uncertainties in the results from both 28-day, 14-day, and 11-day studies are significantly greater than those from 13-week (or 90-day) studies when making extrapolations to potential effects from chronic exposures.
A summary of a 28-day exposure study for AAA in rats was submitted by the commenter (Eastman Kodak). In this study, Sprague-Dawley rats that were treated orally with AAA suffered reversible dose-dependent hemolytic anemia and methemoglobinemia and irreversible siderosis of

the spleen and splenomegaly accompanied by hepatic extramedullary hematopoiesis and renal excretion of heme. The study identified a no observed adverse effects level (NOAEL) of 12 mg/kg-d for these effects (LONZA Report, 1991). The actual detailed study report was not submitted with the comment; thus no judgment may be made concerning the conduct of the study and the validity of the NOAEL and lowest observed adverse effects level (LOAEL) determinations.
A provisional noncancer benchmark for AAA may be calculated as follows:
where
NOAEL = 12 mg/kg-d
UF = uncertainty factor of 1000 (10 x 10 x 10)10 interspecies variation10 human variability10 less than chronic study
MF = modification factor of 9 (3 x 3)3 lack of reliable reproductive/ developmental effects data3 28-day toxicity studies are subacute and not subchronic in duration.
Thus, the overall uncertainty/modifying factors for AAA would equal 9,000. This uncertainty value is very high for health benchmarks established for regulatory purposes.
The NOAEL from the 11-day study of AAOT and the NOAEL from the 14-day study of AAOA may be used as the starting points for developing provisional reference doses for these compounds. Given the shortness of duration of these studies, another uncertainty factor of 10, over and above the uncertainty factors used for AAA, is added. Thus, the overall uncertainty/ modifying factors for AAOA and AAOT would be 90,000. This value exceeds the usual bounds for uncertainty in establishing health benchmarks.

A provisional noncancer benchmark for AAOA may be calculated as follows:
where
NOAEL = 75 mg/kg-d
UF = uncertainty factor of 10,000 (10 x 10 x 10 x 10)10 interspecies variation10 human variability10 less than chronic study10 extremely short duration study
MF = modification factor of 9 (3 x 3)3 lack of reliable reproductive/ developmental effects data3 14-day toxicity studies are subacute and not subchronic in duration.
Thus, the overall uncertainty/modifying factors for AAOA would equal 90,000.
With the same concerns a provisional noncancer benchmark for AAOT may be calculated as follows:
where
NOAEL = 96 mg/kg-d
UF = uncertainty factor of 10,000 (10 x 10 x 10 x 10)10 interspecies variation10 human variability10 less than chronic study10 extremely short duration study
MF = modification factor of 9 (3 x 3)3 lack of reliable reproductive/ developmental effects data3 11-day toxicity studies are subacute and not subchronic in duration.
The substantiation of the provisionally calculated reference doses described for the three compounds is contingent upon obtaining the complete study reports (including individual animal data records) of the 11-day study of AAOT, the 14-day toxicity study of AAOA, and the 14-day and 28-day studies of AAA. These reports are needed to evaluate the adequacy of the studies, both in terms of design and execution, for developing NOAELs or LOAELs.
A.5 Conclusions
This appendix has reviewed the appropriateness of developing health benchmarks for

AAA, AAOA, and AAOT. The weight of evidence of potential carcinogenicity based on the identification of surrogates for these compounds has been evaluated. The metabolic pathways leading to carcinogenicity of the selected surrogates are documented; however, there are no data to substantiate the metabolism of AAA, AAOA, and AAOT to yield the same or similar metabolic products by the same pathways. Therefore, no benchmarks based on carcinogenic potential have been calculated. The acute toxicity data and the mutagenicity data summary submitted by the commenter does not negate the carcinogenic potential of these constituents. The acute studies are of very short duration and any use of these data to derive noncancer health benchmarks would have extremely high uncertainty (i.e., 9,000 - 90,000). In addition, before these data could be used for the development of health benchmarks, a complete study report containing all individual animal data would need to be submitted by the commenter and reviewed by EPA toxicologists for adequacy of the study design and execution. Thus, at this time, no data appear to be available that are suitable for deriving health benchmarks with an acceptable level of uncertainty based either on cancer or noncancer endpoints.
A.6 References
Bergman, K., L. Muller, and S.W. Teigen. 1996. Series: current issues in mutagenesis and carcinogenesis, No. 65. The genotoxicity and carcinogenicity of paracetamol: a regulatory (re)view. Mutat. Res. 349:263-288.
Dahlin, D. C., G. T. Miwa, A. Y. Lu, and S. Nelson. 1984. N-acetyl-p-benzoquinone imine: a cytochrome P-450-mediated oxidation product of acetaminophen. Proc. Natl. Acad. Sci. 81: 1327-1331.
Garner, R. C., C. N. Martin, and D. B. Clayson. 1984. Carcinogenic aromatic amines and related compounds. In Chemical Carcinogenesis, 2nd ed. (Searle, C. E., Ed.) Vol. I, pp 175-276, American Chemical Society, Washington, DC.
IARC. 1987a. Aniline (Group3). Supplement 7: 99-100. Lyon, France.
IARC. 1987b. ortho-Toluidine (Group 2B). Supplement 7: 362-363. Lyon, France
Jackson, M. A., H.. F. Stack, and M. D. Waters. 1993. The genetic toxicology of putative nongenotoxic carcinogens. Mutat. Res. 296:241-277.
Jacobson, M. D., R. Shapiro, G. R. Underwood, S. Broyde, L. Verna, and B. E. Hingerty, 1988. Synthesis and conformation of a dinucleoside monophosphate modified by aniline. Chem. Res. Toxicol. 1:152-159.
Josephy P. D., L. S. DeBruin, H. L. Lord, J. N. Oak, D. H. Evans, Z.. Guo, M. S. Dong, and F. P. Guengerich, F. P. 1995. Bioactivation of aromatic amines by recombinant human cytochrome P4501A2 expressed in Ames tester strain bacteria: a substitute for activation by mammalian tissue preparations. Cancer Res. 55:799-802.

Josephy, P. D., P. Gruz, and T. Nohmi. 1997. Recent advances in the construction of bacterial genotoxicity assays. Mutat. Res. 386:1-23.
Josephy, P. D., D. H. Evans, A. Parikh, and F. P. Guengerich. 1998. Metabolic activation of aromatic amine mutagens by simultaneous expression of human cytochrome P450 1A2, NADPH-cytochrome P450 reductase, and N-acetyltransferase in Escherichia coli. Chem. Res. Toxicol. 11, 70-74.
Kao, J., J. Faulkner, and J. W. Bridges. 1978. Metabolism of aniline in rats, pigs, and sheep. Drug Metab. Dispos. 6:549-555.
Kiese, M. 1966. The biochemical production of ferrihemoglobin forming derivatives from aromatic amines, and mechanisms of ferrihemoglobin formation. Pharmacol. Rev. 18:1091-1160.
LONZA Report, 1991.
NCI (National Cancer Institute). 1978. Bioassay of o-toluidine hydrochloride for possible carcinogenicity. Carcinogenesis Technical Report No. 153.
NCI (National Cancer Institute). 1979. Bioassay of o-anisidine hydrochloride for possible carcinogenicity. Carcinogenesis Technical Report No. 89.
Parkinson, A. 1996. Biotransformation of xenobiotics. In Casarett and Doull's Toxicology, 5th ed (Klaassen, C.D., M.O. Amdur, and J. Doull, Eds) pp 113-186, MacMillan Publishing Company, New York.
Patel D. J., B. Mao, Z. Gu, B. E. Hingerty, A. Gorin, A. K. Basu, and S. Broyde. 1998. Nuclear magnetic resonance solution structures of covalent aromatic amine-DNA adducts and their mutagenic relevance. Chem. Res. Toxicol. 11:391-407.
Radomski, J. L. 1979. The primary aromatic amines: Their biological properties and structure-activity relationships. Ann. Rev. Pharmacol. Toxicol. 19:129-157.
Rubino, G. F., G. Scansetti, G. Piolatto, E. Pira. 1982. An epidemiological study on the role of o-toluidine and 4,4’-methylene-bis-2-methylaniline in inducing bladder cancer in man. Environ. Res. 27:241-254.
Thompson, D. C., and T. E. Eling. 1991. Reactive intermediates formed during the peroxidative oxidation of anisidine isomers. Chem. Res. Toxicol. 4:474-481.
U.S. EPA (Environmental Protection Agency). 1996. Proposed Guidelines for Carcinogen Risk Assessment. EPA/600/P-92/003C. Office of Research and Development, Washington, DC.
Ward, E., A. Carpenter, S. Markowitz, D. Roberts, and W. Halperin, W. 1991. Excess number of

bladder cancers in workers exposed to orthotoluidine and aniline. J. Natl. Cancer Inst. 83: 5-1-506.
Ward, E. M., G. Sabbioni, D. G. DeBord, A. W. Teass, K. K. Brown, G. G. Talaska, D. R. Roberts, A. M. Ruder, and R. P. Streicher. 1996. Monitoring of aromatic amine exposures in workers at a chemical plant with a known bladder cancer excess. J. Natl. Cancer Inst. 88: 1046-1052.
Appendix B
Sensitivity Analysis for NongroundwaterPathways

Appendix B
B-2
Appendix B
Sensitivity Analysis for Nongroundwater Pathways
B.1 Introduction
The initial phase of this risk analysis was a sensitivity analysis. The sensitivity analysis isused to identify and rank the most influential variable parameters in the analysis. The first step ofa sensitivity analysis is to set all variable parameters at central tendency values and calculatecentral tendency risk estimates. Then, one at a time, each variable parameter is set to its high-endvalue, risk is calculated, and the variation in the risk from the central tendency value is noted. Theparameters having the greatest effect on the resulting risks are identified as the most sensitivevariables. The two most sensitive parameters identified by this method are set to high-end in thedeterministic analysis.
For this analysis, the initial landfill waste concentration for each constituent is set at aconstant value (1,000 mg/kg). Then, setting all variable parameters at their central tendencyvalues a central tendency risk value was calculated for each constituent. Then each independentparameter was varied to high end one at a time and the risk values were calculated. Note that theparameters associated with location (both meteorological and soil parameters) are varied as asingle variable to their high end values to determine the risk for the high end location. Theresulting risks for each constituent and each variation are compared to the central tendency riskvalue to determine the sensitivity of each variable or the degree to which changing an individualvariable impacts the risk results.
The nongroundwater sensitivity analysis considers the emissions of volatile constituentsfrom the landfill and their dispersion and deposition at receptor locations. The exposure pathwaysevaluated for the nongroundwater analysis include direct inhalation of vapors, inadvertentingestion of soil that has been contaminated by vapor deposition, ingestion of plant products thatare contaminated by vapor deposition and air-to-plant transfer of vapors, and the ingestion of beefand dairy products that have been contaminated by cattle ingestion of contaminated soil andvegetation. Receptors for the nongroundwater pathways are assumed to be farmers and theirchildren as these are considered to be the most highly exposed individuals.
TAM and filter aid waste streams are evaluated separately for the nongroundwater
Appendix B
B-3
sensitivity analysis. Therefore, the waste-stream-specific parameters for volume, bulk density, andfraction organic carbon are specific to each waste stream. However, due to CBI constraints, asingle set of constituents is evaluated for both TAM sludge and spent filter aids. Parametersvaried in the nongroundwater sensitivity analysis are listed below.
• Waste quantity (metric tons)• Waste stream foc• Geographic location
- Precipitation (cm/yr)- Evapotranspiration (cm/yr)- Runoff (cm/yr)
• Landfill dimensions- Area (m2)- Depth (m).
• Distance to receptor (m)• Exposure factors.
B.2 Parameters Varied for the Sensitivity Analysis
Parameters considered in the nongroundwater sensitivity analysis can be grouped into fourcategories; 1) waste stream specific parameters; 2) waste management unit parameters; 3)location related parameters; and 4) exposure factors. Parameters varied within each of thesecategories for the sensitivity analysis are described below.
B. 2.1 Waste Stream Specific Parameters
Waste stream specific parameters include:
• Constituent composition• Bulk density of waste • Waste stream foc• Waste quantity
These parameters are described below and the specific values used in the sensitivityanalysis for waste-stream specific parameters are identified.
Constituent Composition - For this analysis, the constituent-specific waste concentrationis not an independent variable. Rather, due to CBI constraints, risk-based constituentconcentrations are back-calculated in this assessment. Therefore constituent concentration is notvaried as part of the sensitivity analysis. Instead, concentrations of the 53 constituents of concernevaluated for both the TAM sludge and spent filter aid waste streams are set at a fixed value of1000 mg/kg for the sensitivity analysis. The constituents, their health benchmarks, and theconstituent specific physical and chemical property data used in the fate and transport modelingare presented in Appendix D. The method used to identify constituents of concern in these wastestreams is described in the listing technical background document (EPA, 1999).

Appendix B
B-4
Waste Bulk Density and Fraction Organic Carbon (foc) - The physical properties dataneeded for the risk analysis are waste fraction organic carbon (foc) and waste bulk density. Thesedata are obtained from separate sources. The foc data were obtained from the sampling andanalysis data collected for the 1994 proposed rule for the dye and pigment industry (EPA, 1999). The foc data for filter aid wastes are the results from sampling conducted on filter aids from allindustry segments and various processes within the industry. EPA does not have sampling andanalysis data for noncommingled TAM sludge waste streams. Therefore, the foc for TAMsludges is assumed to be the same as for other dye and pigment industry wastewater treatmentsludges that were sampled and analyzed for the 1994 proposed rule. The value for the dry bulkdensities of spent filter aids and TAM sludges is obtained from the EPA survey of all hazardouswaste generators (U.S. EPA, 1991). The generator survey requested information about the bulkdensity of various types of wastes, including spent filter aids and biological wastewater treatmentsludge. The central tendency bulk density values from this survey are used because littlevariability is expected in this parameter and no waste-specific data are available from the samplingand analysis phase of this listing determination. Physical property data used in the deterministicand Monte Carlo analyses are presented in Tables 2-1 and 2-2.
Waste Quantity - Spent filter aids may be generated by any dye or pigment process. Thegeneration rates for the filter aid waste stream have been declared Confidential BusinessInformation (CBI) by the facilities that report generating these wastes. Therefore, specificgeneration rates are not used in the analysis. Instead, the reported waste volumes are entered intoa data set from which a distribution of volumes is developed. The 50th and 90th percentile valuesfor waste volumes are pulled from this distribution for use as waste generation rates in thesensitivity analysis.
The TAM volume used in the sensitivity analysis is 57.2 metric tons per year. Wastequantity data are presented in Tables 2-1 and 2-2.
Table 2-1. Filter Aid Waste Stream Specific Parameters
Parameter Units Central Tendency (50th Percentile)
High End(90th Percentile)
Reference
Waste Quantity Mg/yr % % EPA, 1999
Bulk Density of Waste g/cm3 1.07 U.S. EPA, 1991(Generator Survey)
Fraction of OrganicCarbon
unitless % % SAIC, 1999
* Relevant data are not included at present because of business confidentiality concerns

Appendix B
B-5
Table 2-2. TAM Sludge Waste Stream Specific Parameters
Parameter Units Central Tendency (50th Percentile)
High End(90th Percentile)
Reference
Waste Quantity tonne 57.2 SAIC, 1999
Bulk Density of Waste g/cm3 1.07 U.S. EPA, 1991(Generator Survey)
Fraction of OrganicCarbon
unitless % % SAIC, 1999
* Relevant data are not included at present because of business confidentiality concerns
B. 2.2 Waste Management Unit Parameters
The waste management practice modeled for TAM sludge and spent filter aids is disposalin a municipal landfill. For this analysis, any municipal landfill described in the distribution ofmunicipal landfills is assumed possible.
The landfill parameters used in the nongroundwater sensitivity analysis are:
C total surface area of landfillC surface area of active cellC depth of waste in landfillC active life of the landfillC operating days per yearC length of time daily waste addition is uncoveredC depth of daily coverC depth of landfill cap
The landfills analyzed for the sensitivity analysis are assumed to comply with currentmunicipal landfill management practices regarding landfill cover regulations in 40 CFR 258. These regulations require application of 6 inches of daily cover (soil) and application of a 2-footsoil cap for each annual cell. The landfills are not, however, assumed to have liner systems,because those requirements are not in effect for all existing landfills. The landfill is evaluated asan unlined landfill and does not include a landfill liner or leachate collections system.
The municipal landfill parameters used in this risk assessment are not specific to anylocation. A national distribution of landfill areas is used for the surface area parameter. Thelifetime of the landfill is assumed to be 30 years (U.S. EPA, 1988). There is no nationaldistribution available for the third important parameter, landfill depth. Therefore, the values formunicipal landfill depth used in this analysis are a distribution of permitted waste column depthsfor municipal landfills in the State of Texas. The Texas data are presented in Appendix G. Thedepth values were assessed for correlation with the associated landfill areas in the Texas permitdata and found to correlate with a coefficient of 0.5.

Appendix B
B-6
The landfill partitioning model was used to estimate contaminant loss from a landfill due tovolatilization, and leaching. The distribution of total landfill surface areas used in this analysis isfrom the survey of municipal landfills conducted in support of the Toxicity Characteristic (U.S.EPA, 1988). The distribution is presented in Table 2-3. The municipal landfill parameters used inthe landfill partitioning model for the sensitivity analysis are presented in Table 2-4.
Table 2-3. Distribution for Area of Municipal Subtitle D Landfills
Area (m2) Cumulative Probability
4,000 0.00
8,094 0.10
20,200 0.25
60,705 0.50
194,000 0.75
420,888 0.90
9,348,570 1.00
Source: U.S. EPA, 1988
Table 2-4. Landfill Parameters Used in Sensitivity Analysis
Parameter Units
Landfill
Reference10th
Percentile50th
Percentile90th
Percentile
Area m2 8,094 60,705 420,888c U.S. EPA, 1988.
Area of Active Face (CellArea) m2 269.8 2,024 14,030c Calculated
Active Life of Landfill yr 30U.S. EPA, 1988.
Total Porosity ofMunicipal Waste
unitless 0.671 Help Model
Liquid Filled Porosity ofMunicipal Waste
unitless 0.12 Help Model
Depth of Daily WasteAddition
m 0.76 Assumption
Uncovered Time hrs 12 Estimated
Thickness of Daily Cover m 0.15 CFR 258
Thickness of Cap m 0.6 CFR 258

Appendix B
Parameter Units
Landfill
Reference10th
Percentile50th
Percentile90th
Percentile
B-7
Operating Days per Year d/yr 350 Assumption
Layers unitless 5.4 Calculated
Daily additions/layer unitless 65 Calculated
Average Exposed Time d 67.93 Calculated
Area of Daily WasteAddition
m2 31.06 Calculated
c Used only in groundwater sensitivity analysis.
B.2.3 Location Related Parameters
The municipal landfills assumed to receive filter aid and TAM sludge waste streams areassumed located near the facility where the waste is generated. Hydrogeologic and climateparameters used in the fate and transport modeling of the two waste streams are taken from the hydrogeologic and climate stations located nearest each of the facilities being evaluated. Facility locations for the filter aid waste streams are claimed as CBI. Therefore, only thedesignation of the hydrogeologic codes and climate stations nearest the facilities are identified forthe spent filter aid analysis. The location at which dedicated TAM sludges are reported to begenerated is used in modeling conducted for TAM sludges. The geographic location is used toidentify the soil, climate, and hydrogeologic parameters used in the fate and transport modeling. The climate data, soil parameters, and hydrogeologic descriptor data are linked to specificlocations. Thus, for the sensitivity analysis, high end and central tendency locations are treated asa single variable and all climate and soil parameters associated with each location were variedtogether. The climate and soil parameter values used in the analysis are consistent between thegroundwater and nongroundwater pathway sensitivity analyses.
It is important to note, however, that it is difficult to identify meaningful central tendencyand high-end facility locations because of the numerous interrelated variables associated with eachlocation. For instance, infiltration rate, unsaturated zone thickness, and aquifer thickness areamong the most important groundwater pathway parameters tied to location. Other location-related parameters, such as wind speed and temperature, are important for nongroundwaterpathways. Most locations are likely to have a mix of high-end, central-tendency, and low-endparameter values. In many cases, conditions that favor high-end exposure for one pathway mayhave the opposite effect on another pathway. For instance, locations with high precipitation maybe high-end for the groundwater pathway but will tend to reduce exposure from the air transportpathways.
Because these waste streams are modeled in municipal landfills, it was anticipated that thegroundwater pathway would present the highest risk. Therefore, for the sensitivity analysis forfilter aids, the central tendency and high-end locations were selected based on the groundwaterpathway. On this basis, _________* was chosen to represent the central tendency case

Appendix B
B-8
and_________* was chosen to represent the high-end case in the sensitivity analysis. Climatedata from the LaGuardia meteorologic station and hydrogeologic data from Edison, NJ,hydrogeology station are used for the TAM sludge analysis. These locations were judged to beclose enough and similar enough to the location of the TAM landfill to be representative.
Soil Parameters - In general, soil parameter variability does not impact nongroundwaterrisk results as much as groundwater risk results. This is partly because only the surficialproperties are used in nongroundwater analyses whereas for groundwater analyses both theunsaturated zone and saturated zone parameters are used. Also, the degree of variability in theparameters that are used in the nongroundwater analyses generally tend to be fairly small. Typicalparameter values associated with surface soils in these geographic locations have been identifiedfor use in the nongroundwater sensitivity analysis. It is assumed that wastes disposed in municipallandfills are sent to facilities near the point of generation. Therefore, the soil parameters areestimated by considering soil parameters near the dye or pigment manufacturing facility area usingthe States Soil Geographic (STATSGO) database and selected subsets of this database(USSOILS and CONUS).
The (STATSGO) database is a Geographic Information System (GIS) database designedprimarily for regional, multistate, river basin, State, and multicounty resource planing managementand monitoring. Soil maps for STATSGO are compiled from more detailed county soil surveymaps. Where county soil survey maps are not available, data on geology, topography, vegetation,and climate are assembled together with Land Remote Sensing Satellite (LANDSAT) images. Soils of like areas are studied, and the probable classification and extent of the soils aredetermined. Soil parameters used for this analysis are presented in Table 2-5.
* Relevant data are not included at present because of business confidentiality concerns
Table 2-5. Soil Parameters for Central Tendency and High End Locations of Dye andPigment Facilities Producing Deferred Wastes
Parameter Units Central Tendency1
High End2 Reference
Predominant Soil Texture unitless Loamysand
CONUS(STATSGO)
Fraction Organic Carbon unitless 0.009 USOILS (STATSGO)
USLE Erodibility Factor tons/acre 0.16 USOILS (STATSGO)
Hydraulic Conductivity cm/hr 14.59 Carsel and Parrish (1988)
Saturated Water Content unitless 0.41 Carsel and Parrish (1988)
Moisture Retention Exponent unitless 4.38 Clapp and Hornberger(1978)
Dry bulk density g/cm3 1.56 Calculated1 Relevant data are not included at present because of business confidentiality concerns

Appendix B
B-9
2 Only site for TAM Sludges
Climate Parameters - Detailed climate and meteorologic data are required to conductfate and transport modeling. These data are needed to conduct air dispersion and depositionmodeling to estimate concentrations constituents in surrounding areas due to vapor air emissionsfrom the municipal landfill.
The climate data used in this analysis were downloaded from the CD-ROM InternationalStation Meteorological Climate Summary (ISMCS) (NOC, 1992). Annual precipitation, averageannual temperature, and annual average wind speed were used.
This analysis also used 5 years of representative ISCMS surface and upper air data foreach of the meteorologic region locations modeled to determine long-term average airconcentrations and deposition rates. Surface data are obtained from the Solar and MeteorologicalSurface Observation Network (SAMSON) CD-ROM (NOAA, 1993) for each meteorologicstation. These data include 5 years of hourly observations of the following surface meteorologicparameters:
• opaque sky, • temperature, • wind direction, • windspeed, • ceiling height, • current weather, • station pressure, and • precipitation type and amount.
The corresponding upper air data are obtained from EPA's SCRAM Bulletin Board (U.S.EPA). These data are paired with the surface data for air dispersion modeling through the use ofthe meteorologic preprocessor PCRAMMET. PCRAMMET pairs the surface data with theupper air data to create a meteorologic file that contains hourly windspeed, wind direction,atmospheric stability class, temperature, and mixing height for deposition calculations. PCRAMMET requires additional site-specific land-use data to calculate additional meteorologicparameters for with EPA’s Industrial Source Complex Short Term, version 3 (ISC3). Thelanduse data used in this analysis were based on telephone surveys and assessed topographicmaps. PCRAMMET inputs were developed for each meteorological location corresponding tothe high-end and central tendency sites evaluated. The climate parameters for the centraltendency and high end site considered in the nongroundwater risk analysis are presented in Table2-6.
Table 2-6. Climate Parameters for Central Tendency and High End Location for SpentFilter Aid and TAM Sludge Wastes

Appendix B
B-10
Parameter Units Central Tendency1 High End2 Reference
Location NA LaGuardia, NY
Annual Rainfall cm/yr 109 ISMCS, June, 1992
Average Windspeed m/s 6 ISMCS, June, 1992
AverageTemperature
deg F 55 ISMCS, June, 1992
1 Relevant data are not included at present because of business confidentiality concerns2 Only site for TAM Sludges
B.2.4 Exposure Parameters
Receptor Location The receptors for the nongroundwater pathways are assumed to befarmers and their children. For the nongroundwater pathway the values for distance to receptorare presented in Table 2-7..
Table 2-7 Distance from Source to Receptor
Pathway units CentralTendendy
High End Reference
Nongroundwater m 500 75 U.S. EPA, 1998
Exposure Factors The exposure factors considered in the sensitivity analysis for thenongroundwater pathways are ingestion rates, inhalation rate, and exposure durations. Theprimary source for these factors is the 1997 Exposure Factors Handbook (U.S. EPA, 1997). These factors are used in estimating risk through inhalation of vapors emitted from the landfill,ingestion of crops and/or animal products (beef, dairy) exposed to these emissions, andinadvertent ingestion of soil. The central tendency and high end values for exposure parametersfor all pathways and receptors included in the sensitivity analysis are presented in Table 2-8.
Table 2-8 Central Tendency and High End Exposure Factors
Farmer
Media Units CentralTendency
High End Reference
Soila kg/day 5.0E-05 NA EFH Table 4-23
Exposed Vegetablesb kg(DW)/d 7.3E-03 3.6E-02 EFH Table 13-63
Fruitsc kg(DW)/d 1.2E-02 5.5E-02 EFH Table 13-61
Root Vegetablesd
kg(DW)/d(Metals)
7.5E-03 3.9E-02EFH Table 13-65
kg(WW)/d(Organics)
5.3E-02 2.8E-01

Appendix B
Farmer
Media Units CentralTendency
High End Reference
B-11
Beefe kg(WW)/d 1.1E-01 4.5E-01 EFH Table 13-36
Dairyf kg(WW)/d 6.5E-01 2.6 EFH Table 13-28
Inhalationg m3/hr 0.63 NA EFH Table 5-23
Exposure Duration yr 10 58.4
Child of Farmer
Soila kg/d 1.0E-04 4.0E-04 EFH Table 4-23
Exposed Vegetablesb kg(DW)/d 3.5E-03 2.0E-02 EFH Table 13-63
Fruitsc kg(DW)/d 5.4E-03 4.3E-02 EFH Table 13-61
Root Vegetablesd
kg(DW)/d(Metals)
4.8E-03 2.8E-02
EFH Table 13-65kg(WW)/d(Organics)
3.4E-02 2.0E-01
Beefe kg(WW)/d 9.1E-02 2.1E-01 EFH Table 13-36
Dairyf kg(WW)/day 7.1E-01 1.7 EFH Table 11-2
Inhalationg m3/hr 0.27 NA EFH Table 5-23
Exposure Duration yrs 7.36 (soil)
18 EFH Table
Fraction of Intake from Contaminated Source
Soil NA 1 Assumption
Exposed Vegetables NA 0.42 EFH Table 13-71
Fruits NA 0.328 EFH Table 13-71
Root Vegetables NA 0.173 EFH Table 13-71
Beef NA 0.478 EFH Table 13-71
Dairy NA 0.207 EFH Table 13-71
B.3 Risk Assessment Methodology
The sensitivity analysis is used to identify the most influential variable parameters that arethen set to high-end values to estimate high-end risks. As discussed above, the first step of a
Appendix B
B-12
sensitivity analysis is to set all variable parameters at central tendency values and calculate centraltendency risk estimates. Then, one at a time, each variable parameter is set to its high-end value,risk is calculated, and the variation in the risk from the central tendency value is noted. Theparameters having the greatest effect on the resulting risks are identified as the most sensitivevariables. The two most sensitive parameters identified by this method are set to high-end in thedeterministic analysis.
Models used to conduct the nongroundwater sensitivity analyses include the landfillpartitioning model, the EPA Industrial Source Complex Short Term, Version 3 air dispersionmodel and the Indirect Exposure Model (IEM). These models are described in greater detail inSection 4 below. The landfill partitioning model estimates volatile emissions and leachateconcentrations from a landfill simultaneously to maintain a mass balance between the pathways. Each landfill partitioning model run produces a volatile emission rate that is then used with theISCST3 air dispersion model.
The ISCST3 model uses some of the same parameters included in the landfill partitioningmodel. It also uses a variable for distance to receptor that is not included in the landfillpartitioning model. ISCST3 dispersion and deposition modeling is conducted using inputs fromthe landfill partitioning model. First, all parameters are set at central tendency. Then the model isrun once with each of the variable parameters set to high end while the others are fixed at centraltendency. The location parameter is considered a single parameter and all meteorologic variablesassociated with location are varied together.
Parameters shared between the landfill partitioning model and the air modeling arecoordinated in the risk modeling. For example, the location parameter is used in the landfillpartitioning model to produce an emission rate. ISC3 modeling for that emission rate isconducted using data for the same location. Landfill area is similarly coordinated between thetwo models.
The remaining variables considered in the nongroundwater sensitivity analysis areexposure factors which are varied using the the IEM. Other exposures that are considered but notvaried in the sensitivity analysis include inhalation of vapors and adult ingestion of soil. Thesensitivity of the varied exposure parameters is determined by setting each parameter at high endwhile all other variable parameters are set at central tendency as described above.
The sensitivity analysis modeling produces a risk estimate associated with the use of asingle high-end parameter for each modeling run. The most sensitive parameters are those thatproduce the highest estimate of risk when set at their high-end values.
B.4 Fate and Transport Models
As mentioned in Section 3 above, the models and equations used in estimating riskthrough the nongroundwater pathways for the sensitivity analysis are:

Appendix B
B-13
C landfill partitioning model - based on the Jury equations ( Jury et al. 1983, 1984, and1990)
C ISCST3 - for air dispersion and deposition modeling (U.S. EPA, 1995)C indirect exposure model (IEM)- for assessing risk due to direct and indirect exposures
(IEM is a model based on equations presented in U.S. EPA, 1990 and U.S. EPA, 1993.)
Each model or set of equations is discussed in greater detail in the sections below.Parameters shared between the landfill partitioning model and the air modeling are coordinated inthe risk modeling. For example, the location parameter is used in the landfill partitioning model toproduce an emission rate. ISC3 modeling for that emission rate is conducted using data for thesame location. Landfill area is similarly coordinated between the two models.
B.4.1 Landfill Partitioning Model
A summary description of the landfill partitioning model is provided here. Thepartitioning equations and a more detailed description of the model is provided in Section 3 of thisreport. A spreadsheet calculation model is used to determine the contaminant loss from a landfilldue to volatilization, runoff, degradation, and leaching. The model uses partitioning equationsdeveloped for estimating volatilization of contaminants from soil (Jury et al. 1983, 1984, 1990). For this risk assessment, the equations have been adapted to represent the management practicesand design criteria required by regulation for municipal landfills. Runoff losses are assumed to bezero because landfills are assumed to have berms or other control devices sufficient to preventrunoff. Aerobic degradation is assumed not to occur in landfills.
Key assumptions for the landfill partitioning model are that waste will be collected 350d/yr and each daily addition volume will be placed in a daily pile in the landfill. The modelevaluates contaminant losses from the landfill over three separate conditions: (1) losses from thedaily pile which is uncovered for a portion of the day; (2) losses from the daily pile after cover isapplied; and (3) losses after closure of the landfill cell when the waste is covered by a 2-ft thicklandfill cap.
Daily piles are assumed to be uncovered for a period of 12 h prior to the application ofdaily cover. After the 12-h period, the waste is assumed to be covered by a 6-in daily cap asrequired by the municipal landfill regulations (40 Code of Federal Regulations [CFR] 258). Theamount of contaminant lost during the uncovered duration is calculated, and the total contaminantconcentration remaining in the waste is calculated and used as the starting concentration for thecovered daily waste addition.
On each successive day, the daily waste addition is placed in piles assumed to be adjacentto the previous day’s waste addition. For each daily addition of waste, 12-h emissions areestimated from the newly added uncovered pile, and vapor emissions are estimated through thedaily soil cover for waste added on previous days. The model estimates partitioning of the wastethrough the daily cover until new waste is added onto that daily pile.
Additions of new daily piles continue until the area of the cell is filled with a layer of dailywaste. When a layer is completed, a second layer is begun by placing the next daily waste addition

Appendix B
B-14
on top of the initial daily waste pile. Once waste is added on top of a daily addition, losses fromthat pile are assumed to be minimal. This process continues until the annual cell is filled. Thenumber of daily piles in a cell is estimated based on the area of the landfill cell divided by the areaof each daily pile.
At the end of each year, the annual cell is assumed to be capped and a new cell started. The closed landfill cell is assumed to be covered by a 2-ft thick landfill cap as required under themunicipal landfill regulations. The emission rate is greatly reduced by the cap; however, it is notzero.
In the first year, a mass of the constituent is added to the landfill, and the model estimatesthe mass partitioned to each media (air, leachate, and soil) for each of the emission scenarios. Asnoted previously, no biodegradation is included within the landfill. The losses to the air andleachate are summed over these three conditions for the year and subtracted from the initial massof the constituent added to the landfill. The mass of the constituent remaining after accountingfor these losses is carried forward and summed with the new annual waste mass added to thelandfill. (Note: A check mechanism is included in the model to ensure that the solubility limit ofthe constituent is not exceeded in the leachate.)
This process continues for the life of the landfill, which is assumed to be 30 years. At theend of the active life of the landfill, all cells are capped, but leaching and limited air emissions areassumed to continue and are modeled for an additional 40 years after landfill closure. Potentialrelease mechanisms for the municipal landfill are graphically presented in Figure 4-1.

Appendix B
B-15
Figure 4-1. Schematic View of Landfill

Appendix B
B-16
B.4.2 ISCST3 Model for Air Dispersion and Deposition
Air dispersion modeling for the sensitivity analysis is conducted with EPA’s IndustrialSource Complex Short Term, version 3 (ISCST3). ISCST3 is a Gaussian plume model that cansimulate both wet and dry deposition and plume depletion. The ISCST3 outputs are used toestimate the vapor air concentrations and deposition rates needed to develop relative riskestimates associated with vapor air emissions from the municipal landfill. The EPA’s ISCST3model is applicable in simple, intermediate, and complex terrains. However, as discussed inVolume II of the ISCST3 User’s Guide (U.S. EPA, 1995) the complex terrain screeningalgorithms do not apply to area sources such as the emission source (i.e., municipal landfill)being investigated as part of the this analysis. Consequently, regardless of the location beingmodeled, receptor elevations and the terrain grid pathway are not specified in the ISCST3 inputfiles for this analysis. The ISCST3 model was run using "default" model options.
As part of the sensitivity analysis, modeling is conducted using two different landfill sizes (50th percentile landfill - 246 m x 246 m; 10th percentile landfill 90 m x 90 m) assumed located intwo geographic locations _________ and Newark, NJ. Receptors are evenly spaced at distances75 m and 500 m from the edge of the landfill unit. The maximum vapor air concentrations anddeposition rates obtained as outputs from the ISCST3 model are used in combination with foodchain transfer factors and exposure assumptions to develop relative risk estimates for theindividual receptor. Table 4-1 presents the air modeling results from this effort. The resultspresented in this table reflect a unit emission rate of 1 g/s/ m2. These air modeling results areconverted to chemical-specific air concentrations and deposition rates by multiplying the values inthe table by the chemical-specific emission rates that are estimated using the landfill partitioningmodel.
Table 4-1. Results of the ISCST3 Air Modeling
LocationLandfill Size
(m2)
Air Concentration of Vapors(µg/m³)/(g/s/m2)
Central tendency * 60,705
Landfill area * 2,024
Distance to Receptor * 60,705
Meteorologic Location Newark, NJ 60,705 13,050
* Relevant data are not included at present because of business confidentiality concerns.
B.5 Exposure Modeling Equations
This analysis includes estimates of risks to the farmer and farm child due to directinhalation of vapors emitted from the landfill and from indirect food-chain pathways (i.e., risksfrom ingestion of contaminated crops, livestock, or fish). The ISCST3 air dispersion anddeposition model (with landfill air emission rates for volatile constituents estimated with thelandfill partitioning model) is used to estimate the air concentration and deposition of vapor for

Appendix B
B-17
each constituent at receptor locations. All subsequent risk estimates are dependent upon theconcentration and deposition of vapors at the receptor site. The air concentration of vapors isused directly to estimate the risk due to inhalation by the farmer and child. It is also used in IEMto estimate vapor transfer and subsequent contaminant concentrations in fruits, vegetables, grain,and forage (due to air-to-plant transfer). Vapor deposition is used in IEM to estimate soilconcentrations.
IEM equations are used to combine the outputs from the ISCST3 air dispersion anddeposition model with food chain transfer factors and exposure assumptions to estimate exposurepoint concentrations for the various intake media (air, plants, animal products). IEM thenestimates risks to receptors who consume these media. The IEM equations that are used toestimate the fate and transport, media concentration, and human health risk presented in AppendixB-1. All transfer factors used in this risk assessment are assumed to be constant values and formost organic compounds are calculated based on KOW values. Transfer factors used for eachconstituent are presented in Appendix D. The exposure factors used in the sensitivity analysis arepresented in Table 2-8.
B.6 Results
The results of the sensitivity analysis for the nongroundwater pathways are presented inTables 6-1 through 6-8. The risk results for the ingestion pathways for the farmer and child offarmer are presented in Tables 6-9 through 6-12 and the risk results for the inhalation pathway arepresented in Tables 6-13 through 6-16.
The limiting receptors for this analysis are the farmer and child of farmer. Thus, becausethe risk based concentrations derived in support of this listing are calculated based on the pathwayestimated to pose the highest risk, only the limiting receptors need to be evaluated. The homegardener and resident will by definition be less exposed than the farmer or child of farmer. Thefarmer and child both are assumed exposed by direct inhalation and ingestion of home producedexposed vegetables, exposed fruits, root vegetables, beef and dairy products.
A comparison of the results of the nongroundwater sensitivity analysis to the results of thegroundwater pathway sensitivity analysis, which is done using the same inputs indicates that in allcases, the groundwater risk analysis produces higher risk estimates for all constituents.
Because the purpose of this analysis is to set risk-based concentration limits, only thepathways of most concern, or those that present the highest risk, are required to determineprotective concentrations. Based on the results of the sensitivity analysis, groundwater pathwayswere found to be most limiting (i.e., to present the highest risk) in all cases for all constituents ofconcern; therefore, only the groundwater pathway needs to be further evaluated usingdeterministic and Monte Carlo analyses. In other words, risk-based concentrations set based ongroundwater pathway risks will also be protective of nongroundwater pathway risks. Based onthis finding, no further modeling of nongroundwater risks has been conducted.

Appendix B
B-18
Table. 6-1 Filter Aid Ingestion Results for Sensitivity Analysis - Farmer *
* Not included at present due to business confidentiality concerns

Appendix B
B-19
Table. 6-2 Filter Aid Ingestion Results for Sensitivity Analysis - Child *
* Not included at present due to business confidentiality concerns

Appendix B
B-20
Table 6-3. TAM Ingestion Results for Sensitivity Analysis - Farmer
Name CasNumber
CentralTendency
ExposureDuration
BeefIngestion
DairyIngestion
VegetableIngestion
RootIngestion
FruitIngestion
Distanceto
receptor
Landfill area foc
Formaldehyde 50-00-0 1.0E-09 1.0 1.0 1.0 3.0 1.0 3.0 20.0 0.4 4.0
Aniline 62-53-3 6.0E-13 5.8 1.0 1.0 2.6 1.0 3.2 21.2 0.5 0.1
Acetone 67-64-1 7.0E-10 1.0 1.0 1.0 2.9 1.0 2.9 28.6 0.4 1.0
Chloroform 67-66-3 1.1E-14 5.8 1.0 1.0 2.2 1.0 3.6 21.2 0.4 1.0
Benzene 71-43-2 5.3E-14 5.8 1.0 1.0 2.1 1.0 3.6 21.2 0.4 1.0
Methylene chloride 75-09-2 8.1E-15 5.8 1.0 1.0 2.5 1.0 3.3 21.2 0.4 1.1
Bromodichloromethane 75-27-4 4.6E-13 5.8 1.0 1.0 2.3 1.0 3.4 21.2 0.4 0.4
N-Nitrosodiphenylamine 86-30-6 1.1E-13 5.8 1.1 1.2 1.8 1.0 3.6 21.2 0.4 0.4
Naphthalene 91-20-3 2.0E-09 1.0 1.0 1.0 1.5 1.0 4.0 25.0 0.5 0.2
Benzidine 92-87-5 1.8E-05 4.6 1.0 1.0 1.5 1.0 4.2 21.2 0.4 0.2
Dichlorobenzene, 1,2- 95-50-1 2.0E-09 1.0 1.0 1.0 1.0 1.0 3.0 15.0 0.3 0.1
Toluidine, o- 95-53-4 1.5E-11 5.8 1.0 1.0 2.5 1.0 3.3 21.2 0.5 0.1
o-Phenylenediamine 95-54-5 1.7E-12 5.8 1.0 1.0 2.7 1.0 3.0 21.2 0.5 0.8
Ethylbenzene 100-41-4 7.0E-10 1.0 1.0 1.1 1.4 1.0 2.9 14.3 0.4 0.4
Benzaldehyde 100-52-7 2.0E-09 1.0 1.0 1.0 2.5 1.0 3.0 20.0 0.4 0.2
Cresol, p- 106-44-5 5.0E-08 0.8 1.0 1.0 2.0 1.0 4.0 20.0 0.4 0.4
Dichlorobenzene, 1,4- 106-46-7 4.8E-13 5.8 1.3 1.3 1.6 1.0 3.4 21.2 0.4 0.1
Chloroaniline, p- 106-47-8 1.0E-07 0.9 1.0 1.0 3.0 1.0 3.0 20.0 0.5 0.4
Toluidine, p- 106-49-0 7.8E-12 5.8 1.0 1.0 2.5 1.0 3.3 21.2 0.4 0.2
p-Phenylenediamine 106-50-3 2.0E-09 1.0 1.0 1.0 3.5 1.0 4.0 25.0 0.5 1.0
Methyl isobutyl ketone 108-10-1 2.0E-09 1.0 1.0 1.0 2.0 1.0 3.0 15.0 0.4 0.4
Toluene 108-88-3 2.0E-10 1.0 1.0 1.0 1.5 1.0 4.0 20.0 0.4 0.5
Chlorobenzene 108-90-7 4.0E-09 1.0 1.0 1.0 1.8 1.0 2.5 20.0 0.3 0.3
Phenol 108-95-2 5.0E-10 1.0 1.0 1.0 2.0 1.0 4.0 20.0 0.4 0.4
Pyridine 110-86-1 5.0E-07 1.0 1.0 1.0 2.0 1.0 2.0 20.0 0.4 0.4
Dimethyoxybenzidine, 3,3'- 119-90-4 7.3E-08 5.8 1.0 1.0 1.5 1.0 4.2 21.2 0.4 0.6
Trichlorobenzene, 1,2,4- 120-82-1 4.0E-09 1.0 2.0 2.0 1.5 1.0 2.5 25.0 0.5 0.5
N-N-Dimethylaniline 121-69-7 1.0E-07 1.0 1.0 1.0 3.0 1.0 5.0 30.0 0.5 0.3
Diphenylamine 122-39-4 5.0E-08 1.0 1.2 1.2 1.4 1.0 2.0 18.0 0.4 0.4
1,2-Diphenylhydrazine 122-66-7 2.8E-11 5.4 1.0 1.0 2.0 1.0 3.8 21.2 0.4 0.4

Appendix B
B-21
Table 6-4. TAM Ingestion Results for Sensitivity Analysis - Child
Name Cas Number CentralTendency
ExposureDuration
BeefIngestion
DairyIngestion
VegetableIngestion
RootIngestion
FruitIngestion
Childsoil
Ingestion
Distanceto
receptor
Landfillarea
foc
Formaldehyde 50-00-0 6.3E-10 1.0 1.0 1.0 2.1 1.3 5.2 1.0 20.6 0.3 3.2
Aniline 62-53-3 2.5E-13 2.4 1.0 1.0 2.9 1.1 4.8 1.0 21.2 0.5 0.1
Acetone 67-64-1 4.3E-10 1.0 1.0 1.0 2.8 1.4 5.1 1.0 22.3 0.4 1.0
Chloroform 67-66-3 4.6E-15 2.4 1.0 1.0 2.4 1.0 5.7 1.0 21.1 0.4 1.0
Benzene 71-43-2 2.2E-14 2.5 1.0 1.0 2.4 1.0 5.9 1.0 21.4 0.4 1.0
Methylene chloride 75-09-2 3.4E-15 2.4 1.0 1.0 2.7 1.1 5.0 1.0 20.9 0.4 1.1
Bromodichloromethane 75-27-4 1.9E-13 2.5 1.0 1.0 2.6 1.1 5.3 1.0 21.6 0.4 0.4
N-Nitrosodiphenylamine 86-30-6 5.5E-14 2.5 1.1 1.3 1.8 1.0 4.9 1.0 21.8 0.4 0.4
Naphthalene 91-20-3 1.7E-09 1.0 1.1 1.3 1.5 1.0 4.1 1.0 22.4 0.4 0.1
Benzidine 92-87-5 7.6E-06 2.0 1.0 1.0 1.6 1.0 6.8 1.0 21.1 0.4 0.2
Dichlorobenzene, 1,2- 95-50-1 1.4E-09 0.9 1.1 1.4 1.5 1.0 4.1 1.0 18.6 0.4 0.1
Toluidine, o- 95-53-4 6.3E-12 2.4 1.0 1.0 2.9 1.1 5.2 1.0 20.6 0.5 0.1
o-Phenylenediamine 95-54-5 7.1E-13 2.5 1.0 1.0 3.0 1.2 4.8 1.0 21.1 0.5 0.8
Ethylbenzene 100-41-4 5.0E-10 1.0 1.1 1.2 1.7 1.0 4.4 1.0 19.4 0.4 0.4
Benzaldehyde 100-52-7 1.1E-09 1.0 1.0 1.0 3.3 1.1 4.1 1.0 18.2 0.4 0.2
Cresol, p- 106-44-5 3.0E-08 1.0 1.0 1.0 2.4 1.0 3.7 1.0 20.3 0.4 0.4Dichlorobenzene, 1,4- 106-46-7 2.9E-13 2.4 1.1 1.4 1.4 1.0 4.1 1.0 20.7 0.4 0.1
Chloroaniline, p- 106-47-8 6.1E-08 1.0 1.0 1.0 2.3 1.1 5.2 1.0 19.7 0.5 0.3
Toluidine, p- 106-49-0 3.2E-12 2.5 1.0 1.0 2.8 1.1 5.3 1.0 21.3 0.4 0.2
p-Phenylenediamine 106-50-3 1.5E-09 1.0 1.0 1.0 3.3 1.3 4.5 1.0 21.3 0.4 0.9
Methyl isobutyl ketone 108-10-1 9.2E-10 1.0 1.0 1.0 2.7 1.1 4.8 1.0 18.5 0.6 0.6
Toluene 108-88-3 1.1E-10 1.0 1.1 1.2 1.7 1.1 5.7 1.0 25.5 0.4 0.6
Chlorobenzene 108-90-7 1.8E-09 1.0 1.1 1.2 1.9 1.1 6.1 1.0 26.1 0.5 0.5
Phenol 108-95-2 3.0E-10 1.0 1.0 1.0 2.7 1.1 3.7 1.0 20.3 0.4 0.4
Pyridine 110-86-1 3.1E-07 1.0 1.0 1.0 2.6 1.1 3.5 1.0 16.5 0.4 0.3
Bis(2-ethylhexyl)phthalate 117-81-7 2.4E-08 2.5 1.3 2.1 1.0 1.0 1.0 1.0 21.3 0.4 0.5
Dimethyoxybenzidine, 3,3'- 119-90-4 3.0E-08 2.5 1.0 1.0 1.6 1.0 7.0 1.0 21.3 0.4 0.6
Trichlorobenzene, 1,2,4- 120-82-1 5.2E-09 1.0 1.4 1.9 1.2 1.0 2.5 1.0 23.1 0.4 0.4
N-N-Dimethylaniline 121-69-7 8.1E-08 1.0 1.0 1.0 2.0 1.0 6.4 1.0 17.3 0.3 0.1
Diphenylamine 122-39-4 3.7E-08 1.0 1.2 1.5 1.5 1.0 3.2 1.0 20.5 0.4 0.4
1,2-Diphenylhydrazine 122-66-7 1.2E-11 2.3 1.0 1.0 2.1 1.0 6.0 1.0 20.8 0.4 0.4
Xylenes (total) 1330-20-7 3.3E-11 1.0 1.1 1.4 1.5 1.0 3.3 1.0 16.1 0.4 0.3

Appendix B
B-22

Appendix B
B-23
Table. 6-5 Filter Aid Inhalation Results for Sensitivity Analysis - Farmer
* Not included at present due to business confidentiality concerns

Appendix B
B-24
Table 6-6. Filter Aid Inhalation Results for Sensitivity Analysis - Child
* Not included at present due to business confidentiality concerns

Appendix B
B-25
Table 6-7. TAM Inhalation Results for Sensitivity Analysis - Child
Name Cas Number CentralTendency
ExposureDuration
Distance toreceptor
Landfill area foc
Aniline 62-53-3 0.1 1.0 20 0.6 0.08
Acetone 67-64-1 0.00004 1.0 22.5 0.5 1
Naphthalene 91-20-3 0.005 1.0 20 0.4 0.14Dichlorobenzene, 1,2- 95-50-1 0.001 1.0 30 0.6 0.2
Ethylbenzene 100-41-4 0.001 1.0 20 0.5 0.5
Dichlorobenzene, 1,4- 106-46-7 0.0004 1.0 22.5 0.5 0.15
Methyl isobutyl ketone 108-10-1 0.01 1.0 30 0.6 0.7Toluene 108-88-3 0.003 1.0 23.3 0.3 0.7
Chlorobenzene 108-90-7 0.05 1.0 20 0.4 0.4
Phenol 108-95-2 0.0003 1.0 20 0.3 0.3
Pyridine 110-86-1 0.08 1.0 25 0.4 0.4Bis(2-ethylhexyl)phthalate 117-81-7 0.000002 1.0 20 0.4 0.45
Trichlorobenzene, 1,2,4- 120-82-1 0.00005 1.0 20 0.4 0.4
Xylenes (total) 1330-20-7 0.002 1.0 25 0.5 0.4Benzidine 92-87-5 2.633E-05 1.9 21.2 0.4 0.2
1,2-Diphenylhydrazine 122-66-7 4.3E-08 2.3 21.2 0.4 0.4Bromodichloromethane 75-27-4 2.966E-06 2.5 21.2 0.4 0.4
Benzene 71-43-2 1.738E-06 2.5 21.2 0.4 1.0
Chloroform 67-66-3 4.679E-06 2.5 21.2 0.4 1.0
Methylene chloride 75-09-2 9.066E-08 2.5 21.2 0.4 1.1Toluidine, o- 95-53-4 7.205E-07 2.5 21.2 0.5 0.1
Formaldehyde 50-00-0 6.527E-08 2.5 21.2 0.4 3.4
N-Nitrosodiphenylamine 86-30-6 5.878E-10 2.5 21.2 0.4 0.4
Azobenzene 103-33-3 3.383E-10 2.5 21.2 0.4 0.4

Appendix B
B-26
Table 6-8. TAM Inhalation Results for Sensitivity Analysis - Farmer
Name Cas Number CentralTendency
ExposureDuration
Distance toreceptor
Landfill area foc
Aniline 62-53-3 0.1 1.0 20.0 0.6 0.1
Acetone 67-64-1 0.00004 1.0 22.5 0.5 1.0Naphthalene 91-20-3 0.005 1.0 20.0 0.4 0.1
Dichlorobenzene, 1,2- 95-50-1 0.001 1.0 30.0 0.6 0.2
Ethylbenzene 100-41-4 0.001 1.0 20.0 0.5 0.5
Dichlorobenzene, 1,4- 106-46-7 0.0004 1.0 22.5 0.5 0.2Methyl isobutyl ketone 108-10-1 0.01 1.0 30.0 0.6 0.7Toluene 108-88-3 0.003 1.0 23.3 0.3 0.7
Chlorobenzene 108-90-7 0.05 1.0 20.0 0.4 0.4
Phenol 108-95-2 0.0003 1.0 20.0 0.3 0.3
Pyridine 110-86-1 0.08 1.0 25.0 0.4 0.4Bis(2-ethylhexyl)phthalate 117-81-7 0.000002 1.0 20.0 0.4 0.5
Trichlorobenzene, 1,2,4- 120-82-1 0.00005 1.0 20.0 0.4 0.4
Xylenes (total) 1330-20-7 0.002 1.0 25.0 0.5 0.4
Benzidine 92-87-5 1.692E-05 4.6 21.2 0.4 0.21,2-Diphenylhydrazine 122-66-7 2.763E-08 5.4 21.2 0.4 0.4
Bromodichloromethane 75-27-4 1.905E-06 5.8 21.2 0.4 0.4
Benzene 71-43-2 1.117E-06 5.8 21.2 0.4 1.0
Chloroform 67-66-3 3.006E-06 5.8 21.2 0.4 1.0Methylene chloride 75-09-2 5.825E-08 5.8 21.2 0.4 1.1
Toluidine, o- 95-53-4 4.629E-07 5.8 21.2 0.5 0.1
Formaldehyde 50-00-0 4.194E-08 5.8 21.2 0.4 3.4
Azobenzene 103-33-3 2.174E-10 5.8 21.2 0.4 0.4

Appendix B
B-27
Table 6.9 - Filter Aid Ingestion Risk Results for Sensitivity Analysis - Farmer
* Not included at present due to business confidentiality concerns

Appendix B
B-28
Table 6-10 - Filter Aid Ingestion Risk Results for Sensitivity Analysis - Child
* Not included at present due to business confidentiality concerns

Appendix B
B-29
Table 6-11 TAM Ingestion Risk Results for Sensitivity Analysis - Child
Name CASNumber
CentralTendency
Exposure Beef Dairy Vegetables Root Fruit Child soil Distance toreceptor
Landfill area foc
Formaldehyde 50-00-0 0.0000000006 0.0000000006 0.0000000006 0.0000000006 0.000000001 0.0000000008 0.000000003 0.0000000006 0.00000001 0.0000000002 0.000000002Aniline 62-53-3 3.E-13 7.E-13 3.E-13 3.E-13 7.E-13 3.E-13 2.E-12 3.E-13 7.E-12 1.E-13 2.E-12Acetone 67-64-1 0.00000004 0.00000004 0.00000004 0.00000004 0.0000001 0.00000006 0.0000002 0.00000004 0.000001 0.00000002 0.00000004Chloroform 67-66-3 5.E-15 1.E-14 5.E-15 5.E-15 1.E-14 5.E-15 3.E-14 5.E-15 1.E-13 2.E-15 5.E-15Benzene 71-43-2 2.E-14 6.E-14 2.E-14 2.E-14 5.E-14 2.E-14 1.E-13 2.E-14 5.E-13 9.E-15 2.E-15Methylene chloride 75-09-2 3.E-15 8.E-15 3.E-15 3.E-15 9.E-15 4.E-15 2.E-14 3.E-15 7.E-14 2.E-15 4.E-15Bromodichloromethane 75-27-4 2.E-13 5.E-13 2.E-13 2.E-13 5.E-13 2.E-13 1.E-12 2.E-13 4.E-12 8.E-14 8.E-14Naphthalene 91-20-3 0.000000002 0.000000002 0.000000002 0.000000002 0.000000003 0.000000002 0.000000007 0.000000002 0.00000004 0.0000000007 0.0000000002Benzidine 92-87-5 0.000008 0.00002 0.000008 0.000008 0.00001 0.000008 0.00005 0.000008 0.0002 0.000003 0.000002Dichlorobenzene, 1,2- 95-50-1 0.00000001 0.00000001 0.00000002 0.00000002 0.00000002 0.00000001 0.00000006 0.00000001 0.0000003 0.000000006 0.000000002Toluidine, o- 95-53-4 6.E-12 2.E-11 6.E-12 6.E-12 2.E-11 7.E-12 3.E-11 6.E-12 1.E-10 3.E-12 7.E-13o-Phenylenediamine 95-54-5 7.E-13 2.E-12 7.E-13 7.E-13 2.E-12 9.E-13 3.E-12 7.E-13 2.E-11 4.E-13 6.E-13Ethylbenzene 100-41-4 0.0000000005 0.0000000005 0.0000000006 0.0000000006 0.0000000008 0.0000000005 0.000000002 0.0000000005 0.00000001 0.0000000002 0.0000000002Benzaldehyde 100-52-7 0.0000001 0.0000001 0.0000001 0.0000001 0.0000004 0.0000001 0.0000005 0.0000001 0.000002 0.00000004 0.00000002Cresol, p- 106-44-5 0.00000003 0.00000003 0.00000003 0.00000003 0.00000007 0.00000003 0.0000001 0.00000003 0.0000006 0.00000001 0.00000001Dichlorobenzene, 1,4- 106-46-7 3.E-13 7.E-13 3.E-13 4.E-13 4.E-13 3.E-13 1.E-12 3.E-13 6.E-12 1.E-13 4.E-14Chloroaniline, p- 106-47-8 0.0000006 0.00000006 0.00000006 0.00000006 0.0000001 0.00000007 0.0000003 0.00000006 0.000001 0.00000003 0.00000002Toluidine, p- 106-49-0 3.E-12 8.E-12 3.E-12 3.E-12 9.E-12 3.E-12 2.E-11 3.E-12 7.E-11 1.E-12 6.E-13p-Phenylenediamine 106-50-3 0.000000002 0.000000002 0.000000002 0.000000002 0.000000005 0.000000002 0.000000007 0.000000002 0.00000003 0.0000000006 0.000000001Methyl isobutyl ketone 108-10-1 0.0000000009 0.0000000009 0.0000000009 0.0000000009 0.000000003 0.0000000010 0.000000004 0.0000000009 0.00000002 0.0000000005 0.0000000005Toluene 108-88-3 0.0000000001 0.0000000001 0.0000000001 0.0000000001 0.0000000002 0.0000000001 0.0000000006 0.0000000001 0.000000003 0.00000000005 0.00000000007Chlorobenzene 108-90-7 0.000000002 0.000000002 0.000000002 0.000000002 0.000000003 0.000000002 0.00000001 0.000000002 0.00000005 0.000000001 0.0000000009Phenol 108-95-2 0.0000000003 0.0000000003 0.0000000003 0.0000000003 0.0000000008 0.0000000003 0.000000001 0.0000000003 0.000000006 0.0000000001 0.0000000001Pyridine 110-86-1 0.0000003 0.0000003 00.000003 0.0000003 0.0000008 0.0000003 0.000001 0.0000003 0.000005 0.0000001 0.00000009Bis(2-ethylhexyl)phthalate 117-81-7 2.E-08 6.E-08 3.E-08 5.E-08 2.E-08 2.E-08 2.E-08 2.E-08 5.E-07 1.E-08 1.E-08Dimethyoxybenzidine3,3'- 119-90-4 3.E-08 8.E-08 3.E-08 3.E-08 5.E-08 3.E-08 2.E-07 3.E-08 6.E-07 1.E-08 2.E-08Trichlorobenzene, 1,2,4- 120-82-1 0.000000005 0.000000005 0.000000007 0.00000001 0.000000006 0.000000005 0.00000001 0.000000005 0.0000001 0.000000002 0.000000002N-N-Dimethylaniline 121-69-7 0.00000008 0.00000008 0.00000008 0.00000008 0.0000002 0.00000008 0.0000005 0.00000008 0.000001 0.00000003 0.00000001Diphenylamine 122-39-4 0.00000004 0.00000004 0.00000004 0.00000006 0.00000005 0.00000004 0.0000001 0.00000004 0.0000008 0.00000001 0.000000021,2-Diphenylhydrazine 122-66-7 1.E-11 3.E-11 1.E-11 1.E-11 3.E-11 1.E-11 7.E-11 1.E-11 3.E-10 5.E-12 5.E-12Xylenes (total) 1330-20-7 3.E-11 3.E-11 4.E-11 5.E-11 5.E-11 3.E-11 1.E-10 3.E-11 5.E-10 1.E-11 1.E-11

Appendix B
B-30
Table 6-12 TAM Ingestion Risk Results for Sensitivity Analysis - Farmer
Name CASNumber
CentralTendency
Exposure Beef Dairy Vegetables Root Fruit Distance toreceptor
Landfill area foc
Formaldehyde 50-00-0 0.000000001 0.000000001 0.000000001 0.000000001 0.000000003 0.000000001 0.000000003 0.0000000002 0.0000000004 0.000000004Aniline 62-53-3 6.E-13 3.E-12 6.E-13 6.E-13 2.E-12 6.E-13 2.E-12 1.E-11 3.E-13 4.E-14Acetone 67-64-1 0.0000000007 0.0000000007 0.0000000007 0.0000000007 0.000000002 0.0000000007 0.000000002 0.00000002 0.0000000003 0.0000000007Chloroform 67-66-3 1.E-14 6.E-14 1.E-14 1.E-14 2.E-14 1.E-14 4.E-14 2.E-13 5.E-15 1.E-14Benzene 71-43-2 5.E-14 3.E-13 5.E-14 5.E-14 1.E-13 5.E-14 2.E-13 1.E-12 2.E-14 5.E-14Methylene chloride 75-09-2 8.E-15 5.E-14 8.E-15 8.E-15 2.E-14 8.E-15 3.E-14 2.E-13 4.E-15 9.E-15Bromodichloromethane 75-27-4 5.E-13 3.E-12 5.E-13 5.E-13 1.E-12 5.E-13 2.E-12 1.E-11 2.E-13 2.E-13N-Nitrosodiphenylamine 86-30-6 1.E-13 6.E-13 1.E-13 1.E-13 2.E-13 1.E-13 4.E-13 2.E-12 5.E-14 5.E-14Naphthalene 91-20-3 0.000000002 0.000000002 0.000000002 0.000000002 0.000000003 0.000000002 0.000000008 0.00000005 0.0000000009 0.0000000003Benzidine 92-87-5 0.00002 0.00008 0.00002 0.00002 0.00003 0.00002 0.00008 0.0004 0.000008 0.000004Dichlorobenzene, 1,2- 95-50-1 0.000000002 0.000000002 0.000000002 0.000000002 0.000000002 0.000000002 0.000000006 0.00000003 0.0000000006 0.0000000002Toluidine, o- 95-53-4 2.E-11 9.E-11 2.E-11 2.E-11 4.E-11 2.E-11 5.E-11 3.E-10 7.E-12 2.E-12o-Phenylenediamine 95-54-5 2.E-12 1.E-11 2.E-12 2.E-12 5.E-12 2.E-12 5.E-12 4.E-11 9.E-13 1.E-12Ethylbenzene 100-41-4 0.0000000007 0.0000000007 0.0000000007 0.0000000008 0.000000001 0.0000000007 0.000000002 0.00000001 0.0000000003 0.0000000003Benzaldehyde 100-52-7 0.000000002 0.000000002 0.000000002 0.000000002 0.000000005 0.000000002 0.000000006 0.00000004 0.0000000007 0.0000000004Cresol, p- 106-44-5 0.00000005 0.00000004 0.00000005 0.00000005 0.0000001 0.00000005 0.0000002 0.000001 0.00000002 0.00000002Dichlorobenzene, 1,4- 106-46-7 5.E-13 3.E-12 6.E-13 6.E-13 8.E-13 5.E-13 2.E-12 1.E-11 2.E-13 7.E-14Chloroaniline, p- 106-47-8 0.0000001 0.00000009 0.0000001 0.0000001 0.0000003 0.0000001 0.0000003 0.000002 0.00000005 0.00000004Toluidine, p- 106-49-0 8.E-12 5.E-11 8.E-12 8.E-12 2.E-11 8.E-12 3.E-11 2.E-10 3.E-12 1.E-12p-Phenylenediamine 106-50-3 0.000000002 0.000000002 0.000000002 0.000000002 0.000000007 0.000000002 0.000000008 0.00000005 0.000000001 0.000000002Methyl isobutyl ketone 108-10-1 0.000000002 0.000000002 0.000000002 0.000000002 0.000000004 0.000000002 0.000000006 0.00000003 0.0000000007 0.0000000008Toluene 108-88-3 0.0000000002 0.0000000002 0.0000000002 0.0000000002 0.00000003 0.0000000002 0.0000000008 0.000000004 0.00000000008 0.0000000001Chlorobenzene 108-90-7 0.000000004 0.000000004 0.000000004 0.000000004 0.000000007 0.000000004 0.00000001 0.00000008 0.000000001 0.000000001Phenol 108-95-2 0.0000000005 0.0000000005 0.0000000005 0.0000000005 0.000000001 0.0000000005 0.000000002 0.00000001 0.0000000002 0.0000000002Pyridine 110-86-1 0.0000005 0.0000005 0.0000005 0.0000005 0.000001 0.0000005 0.000001 0.00001 0.0000002 0.0000002Bis(2-ethylhexyl)phthalate 117-81-7 2.E-08 1.E-07 4.E-08 5.E-08 2.E-08 2.E-08 2.E-08 4.E-07 8.E-09 8.E-09Dimethyoxybenzidine, 3,3'- 119-90-4 7.E-08 4.E-07 7.E-08 7.E-08 1.E-07 7.E-08 3.E-07 2.E-06 3.E-08 4.E-08Trichlorobenzene, 1,2,4- 120-82-1 0.000000004 0.000000004 0.000000008 0.000000008 0.000000006 0.000000004 0.00000001 0.0000001 0.000000002 0.000000002N-N-Dimethylaniline 121-69-7 0.0000001 0.0000001 0.0000001 0.0000001 0.0000003 0.0000001 0.0000005 0.000003 0.00000005 0.00000003Diphenylamine 122-39-4 0.00000005 0.00000005 0.00000006 0.00000006 0.00000007 0.00000005 0.0000001 0.0000009 0.00000002 0.000000021,2-Diphenylhydrazine 122-66-7 3.E-11 2.E-10 3.E-11 3.E-11 6.E-11 3.E-11 1.E-10 6.E-10 1.E-11 1.E-11

Appendix B
B-31
Table 6-13 Filter Aid Inhalation Risk Results for Sensitivity Analysis - Farmer
* Not included at present due to business confidentiality concerns

Appendix B
B-32
Table 6-14 Filter Aid Inhalation Risk Results for Sensitivity Analysis - Child
* Not included at present due to business confidentiality concerns

Appendix B
B-33
Table 6-15 TAM Inhalation Risk Results for Sensitivity Analysis - Farmer
Name CAS Number CentralTendency
Exposure Distance toReceptor
Landfill Area foc
Formaldehyde 50-00-0 4.E-08 2.E-07 9.E-07 2.E-08 1.E-07
Aniline 62-53-3 0.1 0.1 2 0.06 0.008
Acetone 67-64-1 0.00004 0.00004 0.0009 0.00002 0.00004
Chloroform 67-66-3 3.E-06 2.E-05 6.E-05 1.E-06 3.E-06
Benzene 71-43-2 1.E-06 6.E-06 2.E-05 5.E-07 1.E-06
Methylene chloride 75-09-2 6.E-08 3.E-07 1.E-06 3.E-08 6.E-08
Bromodichloromethane 75-27-4 2.E-06 1.E-05 4.E-05 8.E-07 8.E-07
Naphthalene 91-20-3 0.005 0.005 0.1 0.002 0.0007
Benzidine 92-87-5 2.E-05 8.E-05 4.E-04 7.E-06 4.E-06
Dichlorobenzene, 1,2- 95-50-1 0.001 0.001 0.03 0.0006 0.0002
Toluidine, o- 95-53-4 5.E-07 3.E-06 1.E-05 2.E-07 5.E-08
Ethylbenzene 100-41-4 0.001 0.001 0.02 0.0005 0.0005
Azobenzene 103-33-3 2.E-10 1.E-09 5.E-09 9.E-11 9.E-11
Dichlorobenzene, 1,4- 106-46-7 0.0004 0.0004 0.009 0.0002 0.00006
Methyl isobutyl ketone 108-10-1 0.01 0.01 0.3 0.006 0.007
Toluene 108-88-3 0.003 0.003 0.07 0.001 0.002
Chlorobenzene 108-90-7 0.05 0.05 1 0.02 0.02
Phenol 108-95-2 0.0003 0.0003 0.006 0.0001 0.0001
Pyridine 110-86-1 0.08 0.08 2 0.03 0.03
Bis(2-ethylhexyl)phthalate 117-81-7 0.000002 0.000002 0.00004 0.0000008 0.0000009
Trichlorobenzene, 1,2,4- 120-82-1 0.00005 0.00005 0.001 0.00002 0.00002
1,2-Diphenylhydrazine 122-66-7 3.E-08 2.E-07 6.E-07 1.E-08 1.E-08
Xylenes (total) 1330-20-7 0.002 0.002 0.05 0.0009 0.0008

Appendix B
B-34
Table 6-16 TAM Inhalation Risk Results for Sensitivity Analysis - Child
Name CAS Number CentralTendency
Exposure Distance toReceptor
Landfill Area foc
Formaldehyde 50-00-0 7.E-08 2.E-07 1.E-06 3.E-08 2.E-07
Aniline 62-53-3 0.1 0.1 2 0.06 0.008
Acetone 67-64-1 0.00004 0.00004 0.0009 0.00002 0.00004
Chloroform 67-66-3 5.E-06 1.E-05 1.E-04 2.E-06 5.E-06
Benzene 71-43-2 2.E-06 4.E-06 4.E-05 7.E-07 2.E-06
Methylene chloride 75-09-2 9.E-08 2.E-07 2.E-06 4.E-08 1.E-07
Bromodichloromethane 75-27-4 3.E-06 7.E-06 6.E-05 1.E-06 1.E-06
Naphthalene 91-20-3 0.005 0.005 0.1 0.002 0.0007
Benzidine 92-87-5 3.E-05 5.E-05 6.E-04 1.E-05 6.E-06
Dichlorobenzene, 1,2- 95-50-1 0.001 0.001 0.03 0.0006 0.0002
Toluidine, o- 95-53-4 7.E-07 2.E-06 2.E-05 4.E-07 8.E-08
Ethylbenzene 100-41-4 0.001 0.001 0.02 0.0005 0.0005
Azobenzene 103-33-3 3.E-10 8.E-10 7.E-09 1.E-10 1.E-10
Dichlorobenzene, 1,4- 106-46-7 0.0004 0.0004 0.009 0.0002 0.00006
Methyl isobutyl ketone 108-10-1 0.01 0.01 0.3 0.006 0.007
Toluene 108-88-3 0.003 0.003 0.07 0.001 0.002
Chlorobenzene 108-90-7 0.05 0.05 1 0.02 0.02
Phenol 108-95-2 0.0003 0.0003 0.006 0.0001 0.0001
Pyridine 110-86-1 0.08 0.08 2 0.03 0.03
Bis(2-ethylhexyl)phthalate 117-81-7 0.000002 0.000002 0.00004 0.0000008 0.0000009
Trichlorobenzene, 1,2,4- 120-82-1 0.00005 0.00005 0.001 0.00002 0.00002
1,2-Diphenylhydrazine 122-66-7 4.E-08 1.E-07 9.E-07 2.E-08 2.E-08
Xylenes (total) 1330-20-7 0.002 0.002 0.05 0.0009 0.0008

Appendix B
B-35
B.7 References
Carsel, Robert and Rudolph Parrish. 1988. Developing joint probability distributions of soil waterretention characteristics. Water Resources Research, 25, (5):755-769.
Clapp, R.B., and G.M.Hornberger. 1978. Empirical equations for some hydraulic properties. WaterResources Research. 14:601-604.
Jury, W.A., W.J. Farmer, and W.F. Spencer. 1984. Behavior assessment model for trace organics insoil: II. chemical classification and parameter sensitivity. J. Environ. Qual. 13(4):567-572.
Jury, W.A., W.F. Spencer, and W.J. Farmer. 1983. Behavior assessment model for trace organics insoil: I. Model description. J. Environ. Qual. 12(4):558-564.
Jury, W.A., D. Russo, G. Streile, and H.E. Abd. 1990. Evaluation of volatilization by organicchemicals residing below the soil surface. Water Resources Research 26(1):13-20.
NOC (Naval Oceanography Command). 1992. International Station Meteorological Climate Summary(CD-ROM), Version 2.0. Jointly produced by: Naval Oceanography Command Detachment Asheville,USAFETAC OL-A, and National Climatic Data Center.
U.S. EPA. SCRAM Bulletin Board. http://www.epa.gov/scram001/. U.S. Environmental ProtectionAgency. Office of Air Quality Planning and Standards. Research Triangle Park, North Carolina.
U.S. EPA (Environmental Protection Agency), 1999, Background Document for Identification andListing of the Deferred Dye and Pigment Wastes. Office of Solid Waste, Washington, DC.
U.S. EPA (Environmental Protection Agency). 1997. Exposure Factors Handbook. Volume II, FoodIngestion Factors. EPA/600/P-95/002Fb. Office of Research and Development, Washington, DC.
U.S. EPA (Environmental Protection Agency. 1998. Air Characteristic Study: Technical BackgroundDocument. EPA530-R-98-009B. May
U.S. EPA. 1995. PCRAMMET User's Guide (Draft). U.S. Environmental Protection Agency. Officeof Air Quality Planning and Standards. Technical Support Division (MD-14). Research Triangle Park,North Carolina.
U.S. EPA (Environmental Protection Agency). 1988. Draft National Survey of Solid Waste(Municipal) Landfill Facilities, EPA/530-SW-88-034. Office of Solid Waste, Washington, DC.
U.S. EPA (Environmental Protection Agency). 1991. National Survey of Hazardous WasteGenerators and Treatment Storage, Disposal and Recycling Facilities in 1986: Hazardous WasteManagement in RCRA TSDR Units. EPA 530-SW-91-060. Office of Solid Waste and EmergencyResponse, Washington, DC.
U.S. EPA (Environmental Protection Agency). 1995a. User’s Guide for the Industrial Source

Appendix B
B-36
Complex (ISC3) Dispersion Models - Volume II. EPA-454/B-95-003b. Office of Air Quality Planningand Standards. Emissions, Monitoring, and Analysis Division. Research Triangle Park, NC.
U.S. EPA, 1990. Methodology for Assessing Health Risks Associated with Indirect Exposure toCombustor Emissions; Interim Final. EPA/600/6-90/003. Office of Research and Development. Cincinnati, OH.
U.S. EPA, 1993. Addendum to; Methodology for Assessing Health Risks Associated with IndirectExposure to Combustor Emissions. EPA/600/AP-93/003. Office of Health and EnvironmentalAssessment. November, 1993.

Appendix B
B-37

Appendix B-1
Indirect and Direct Exposure Equations

Appendix B-1
B-1-1
Table of Contents
Page
Table B-1-1.1 Deposition Rate Factor to Agricultural Field from Source . . . . . . . . . . . . B-1-2Table B-1-1.2 Soil Loss Constant . . . . . . . . . . . . . . . . . . . . . . . . . . . . . . . . . . . . . . . . . B-1-3Table B-1-1.3 Loss Constant Due to Leaching . . . . . . . . . . . . . . . . . . . . . . . . . . . . . . . . B-1-4Table B-1-1.4 Landfill Soil Volumetric Water Content . . . . . . . . . . . . . . . . . . . . . . . . . B-1-5Table B-1-1.5 Constituent Loss Constant Due to Volatilization . . . . . . . . . . . . . . . . . . . B-1-6Table B-1-1.6 Mass of Soil in Mixing Depth of Agricultural Field . . . . . . . . . . . . . . . . . B-1-7Table B-1-1.7 Aboveground Produce Concentration Due to Air-to-Plant Transfer . . . . . B-1-8Table B-1-1.8 Aboveground Produce Concentration Due to Root Uptake . . . . . . . . . . . B-1-9Table B-1-1.9 Root Vegetable Concentration Due to Root Uptake . . . . . . . . . . . . . . . B-1-10Table B-1-1.10 Beef Concentration Due to Plant and Soil Ingestion . . . . . . . . . . . . . . . B-1-11Table B-1-1.11 Milk Concentration Due to Plant and Soil Ingestion . . . . . . . . . . . . . . . B-1-12Table B-1-1.12 Forage (Pasture Grass/Hay) Concentration Due to Air-to-Plant
Transfer . . . . . . . . . . . . . . . . . . . . . . . . . . . . . . . . . . . . . . . . . . . . . . . . B-1-13Table B-1-1.13 Forage/Silage/Grain Concentration Due to Root Uptake . . . . . . . . . . . . B-1-14
Table B-1-2.1 Contaminant Intake from Soil . . . . . . . . . . . . . . . . . . . . . . . . . . . . . . . . B-1-15Table B-1-2.2 Contaminant Intake from Exposed Vegetable Intake . . . . . . . . . . . . . . . B-1-16Table B-1-2.3 Contaminant Intake from Exposed Fruit Intake . . . . . . . . . . . . . . . . . . . B-1-17Table B-1-2.4 Contaminant Intake from Root Vegetable Intake . . . . . . . . . . . . . . . . . . B-1-18Table B-1-2.5 Contaminant Intake from Beef and Dairy Intake . . . . . . . . . . . . . . . . . . B-1-19Table B-1-2.6 Total Daily Intake for Nongroundwater Indirect Pathways . . . . . . . . . . B-1-20Table B-1-2.7 Individual Cancer Risk: Carcinogens . . . . . . . . . . . . . . . . . . . . . . . . . . . B-1-21Table B-1-2.8 Hazard Quotient: Noncarcinogens . . . . . . . . . . . . . . . . . . . . . . . . . . . . . B-1-22
Table B-1-3.1 Concentration in Air . . . . . . . . . . . . . . . . . . . . . . . . . . . . . . . . . . . . . . . B-1-23Table B-1-3.2 Inhalation Cancer Risk for Individual Chemicals from Unit Risk Factor:
Carcinogens . . . . . . . . . . . . . . . . . . . . . . . . . . . . . . . . . . . . . . . . . . . . . B-1-24Table B-1-3.3 Inhalation Cancer Risk for Individual Chemicals from Carcinogenic
Slope Factor: Carcinogens . . . . . . . . . . . . . . . . . . . . . . . . . . . . . . . . . . B-1-25Table B-1-3.4 Inhalation Hazard Quotient for Individual Chemicals:
Noncarcinogens . . . . . . . . . . . . . . . . . . . . . . . . . . . . . . . . . . . . . . . . . . B-1-26
Table B-1-4.1 Calculation of Waste Concentration after Volatilization for Organic Constituents of Concern in Landfills . . . . . . . . . . . . . . . . . . . . . . . . . . . B-1-27
Table B-1-4.2 Calculation of Soil-Water Partition Coefficients for Organic Constituentsof Concern, Landfills and Land Treatment Units . . . . . . . . . . . . . . . . . . B-1-28
Table B-1-5.14 Individual Cancer Risk from Ingestion: Carcinogens . . . . . . . . . . . . . . . B-1-29Table B-1-5.15 Hazard Quotient: Noncarcinogens . . . . . . . . . . . . . . . . . . . . . . . . . . . . . B-1-30

Appendix B-1
B-1-2
Ds(1),SF '100 x Q
ZSF x BDx [Fv (0.31536 x VdvSF x CyvSF % DywvSF ) % (DydpSF % DywpSF ) x (1 & Fv )]
Table B-1-1.1. Deposition Rate Factor to Agricultural Field from Source
Farmer Exposure Scenario
Parameter Definition Input Value
Ds(1),SF Deposition term for agricultural field(mg/kg-yr)
100 Units conversion factor([mg-m2]/[kg-cm2])
Q Source emissions (g/sec) Waste management scenario-specific
ZSF Soil mixing depth of agricultural field(cm)
20
BD Soil bulk density (g/cm3) Site-specific
Fv Fraction of air concentration in vaporphase (dimensionless)
Chemical-specific
0.31536 Units conversion factor (m-g-s/cm-µg-yr)
VdvSF Dry deposition velocity for agriculturalfield (cm/s)
3
CyvSF Normalized vapor phase air concentrationfor agricultural field(µg-s/g-m3)
Modeled ISC3
DywvSF Normalized yearly wet deposition fromvapor phase for agricultural field (s/m2-yr)
Modeled ISC3
DydpSF Normalized yearly dry deposition fromparticle phase for agricultural field (s/m2-yr)
0
DywpSF Normalized yearly wet deposition fromparticle phase for agricultural field (s/m2-yr)
0
Description
These equations calculate average air deposition occurring over the exposure duration as a result of wet and drydeposition of particles onto soil, deposition of wet vapors to soil, and diffusion of dry vapors to soil. Constituents are assumed to be incorporated only to a finite depth (the mixing depth, Z).

Appendix B-1
B-1-3
ksSF ' kslSF % kseSF % ksrSF % ksgSF % ksvSF
Table B-1-1.2. Soil Loss Constant
Farmer Exposure Scenario
Parameter Definition Central Tendency High End
ksSF Constituent soil loss constant due to allprocesses from agricultural field (1/yr)
kslSF Constituent loss constant due to leaching(1/yr)
Calculated (see Table B-1-1.4)
kseSF Constituent loss constant due to soilerosion (1/yr)
Calculated (see Table B-1-1.7)
ksrSF Constituent loss constant due to surfacerunoff (1/yr)
Calculated (see Table B-1-1.10)
ksgSF Constituent loss constant due todegradation (1/yr)
Chemical-specific
ksvSF Constituent loss constant due tovolatilization (1/yr)
Calculated (see Table B-1-1.11)
Description
This equation calculates the constituent loss constant, which accounts for the loss of constituent from soil byseveral mechanisms.

Appendix B-1
B-1-4
kslSF 'P % I & R & Ev
2 x ZSF x [1.0 % (BD x Kds /2 )]
Table B-1-1.3. Loss Constant Due to Leaching
Farmer Exposure Scenario
Parameter Definition Central Tendency High End
kslSF Constituent loss constant due to leachingfor agricultural field (1/yr)
P Average annual precipitation (cm/yr) Site-specific
I Average annual irrigation (cm/yr) 0
R Average annual runoff (cm/yr) Site-specific
Ev Average annual evapotranspiration(cm/yr)
Site-specific
2 Soil volumetric water content (mL/cm3) Calculated (see Table B-1-1.5)
ZSF Soil depth of agricultural field fromwhich leaching removal occurs – tilled(cm)
20
BD Soil bulk density (g/cm3) Site-specific
Kds Soil-water partition coefficient (cm3/g) Chemical-specific
Description
This equation calculates the constituent loss constant due to leaching from soil.

Appendix B-1
B-1-5
2'2sqKs
12b%3
Table B-1-1.4. Soil Volumetric Water Content
All Exposure Scenarios
Parameter Definition Central Tendency High End
2 Soil volumetric water content (mL/cm3)
2s Soil saturated volumetric water content(mL/cm3)
Site-specific
q Average annual recharge rate (cm/yr) Calculated(see Table B-1-1.6)
Ks Saturated hydraulic conductivity (cm/yr) Site-specific
b Soil-specific exponent representing waterretention (unitless)
Site-specific
Source: SEAM.

Appendix B-1
B-1-6
ksvSF '3.1536x10 7 x H
ZSF x Kds x R x T x BDx 0.482 x u 0.78 x
µa
Da x Da
&0.67
x4 x AF
B
&0.11
Table B-1-1.5. Constituent Loss Constant Due to Volatilization
Farmer Exposure Scenario
Parameter Definition Central Tendency High End
ksvSF Constituent loss constant due tovolatilization for landfill (1/yr)
3.1536x10⁷ Conversion constant (s/yr)
H Henry's law constant (atm-m3/mol) Chemical-specific
ZSF Soil mixing depth of agricultural field (cm) 20
Kds Soil-water partition coefficient (cm3/g) Chemical-specific
R Universal gas constant (atm-m3/mol-K) 8.205x10⁻⁵
T Ambient air temperature (K) Site-specific
BD Soil bulk density (g/cm3) Site-specific
u Average annual windspeed (m/s) Site-specific
µa Viscosity of air (g/cm-s) 1.81x10⁻⁴
Da Density of air (g/cm3) 1.2x10⁻³
Da Diffusivity of constituent in air (cm2/s) Chemical-specific
Description
This equation calculates the constituent loss constant due to volatilization from soil.

Appendix B-1
B-1-7
MSF ' ZSF x AF x BD x 10
Table B-1-1.6. Mass of Soil in Mixing Depth of Agricultural Field
Farmer Exposure Scenario
Parameter Definition Central Tendency High End
MSF Mass of soil in mixing depth ofagricultural field (kg)
ZSF Soil mixing depth for agricultural field –tilled (cm)
20
AF Area of agricultural field (m2) 2,000,000
BD Soil bulk density (g/cm3) Site-specific
10 Units conversion factor
Description
This equation is used to calculate the total mass of soil in the agricultural field that will be mixing with themass of eroded material.

Appendix B-1
B-1-8
PvSF ' Q x Fv xCyvSF x Bv x VGag
Da
Table B-1-1.7. Aboveground Produce Concentration Due to Air-to-Plant Transfer
Farmer Exposure Scenario
Parameter Definition Default Value
PvSF Concentration of constituent in the plant due toair-to-plant transfer (mg/kg) - Farmer
Q Emissions (g) Waste management scenario-specific
Fv Fraction of air concentration in vapor phase(dimensionless)
Chemical-specific
CyvSF Normalized vapor phase air concentration (µg-s/g-m3)
Modeled ISC3
Bv Air-to-plant biotransfer factor ([mg constituent/kg plant tissue DW]/[µg constituent/gair])
Chemical-specific
VGag Empirical correction factor for above-ground produce(dimensionless)
0.01
Da Density of air (g/cm3) 1.2x10⁻³
Description
This equation calculates the constituent concentration in aboveground vegetation due to direct uptake of vaporphase chemical into the plant leaves.

Appendix B-1
B-1-9
PrSF ' CSF x Br
Table B-1-1.8. Aboveground Produce Concentration Due to Root Uptake
Farmer Exposure Scenario
Parameter Definition Central Tendency High End
PrSF Concentration of constituent in the plant due todirect uptake from soil (mg/kg) - Farmer
CSF Average soil concentration of constituent overexposure duration (mg/kg)
Calculated(see Table B-1-1.2)
Br Plant-soil bioconcentration factor foraboveground produce [µg/g DW]/[µg/g soil]
Chemical-specific
Description
This equation calculates the constituent concentration in aboveground vegetation due to direct uptake ofchemicals from soil.

Appendix B-1
B-1-10
Prbg,SF 'CSF x RCF
Kds
Table B-1-1.9. Root Vegetable Concentration Due to Root Uptake
Farmer Exposure Scenario
Parameter Definition Central Tendency High End
Prbg, SF Concentration of constituent in belowgroundplant parts due to root uptake (mg/kg) - Farmer
CSF Soil concentration of constituent (mg/kg) Calculated(see Table B-1-1.2)
RCF Ratio of concentration in roots toconcentration in soil pore water ([mgconstituent/kg plant tissue WW] / [Fgconstituent/mL pore water])
Chemical-specific
Kds Soil-water partition coefficient (mL/g) Chemical-specific
Description
This equation calculates the constituent concentration in root vegetables due to uptake from the soil water.

Appendix B-1
B-1-11
Abeef ' (F x Qp x P % Qs x CSF ) x Babeef
Table B-1-1.10. Beef Concentration Due to Plant and Soil Ingestion
Farmer Scenario
Parameter Definition Central Tendency High End
Abeef Concentration of constituent in beef(mg/kg)
F Fraction of plant grown on contaminatedsoil and eaten by the animal grain orforage (dimensionless)
1
Qp Quantity of plant eaten by the animal eachday (kg plant tissue DW/day)
- beef cattle–grain- beef cattle–forage
0.478.8
P Total concentration of constituent in theplant eaten by the animal (mg/kg) = Pd +Pv + Pr
Calculated (see Tables B-1-1.19, B-1-1.20, B-1-1.21)
Qs Quantity of soil eaten by the foraginganimal (kg soil/day)
0.5
CSF Soil concentration (mg/kg) Calculated (see Table B-1-1.2)
Babeef Biotransfer factor for beef (d/kg) Chemical-specific
Description
This equation calculates the concentration of constituent in beef from ingestion of forage and soil.

Appendix B-1
B-1-12
Amilk ' (F x Qp x P % Qs x CSF) x Bamilk
Table B-1-1.11. Milk Concentration Due to Plant and Soil Ingestion
Farmer Scenario
Parameter Definition Central Tendency High End
Amilk Concentration of constituent in milk(mg/kg)
F Fraction of plant grown on contaminatedsoil and eaten by the animal grain orforage (dimensionless)
1
Qp Quantity of plant eaten by the animal eachday (kg plant tissue DW/day)
- dairy cattle–grain- dairy cattle–forage
313.2
P Total concentration of constituent in theplant eaten by the animal (mg/kg) = Pd + Pv + Pr
Calculated (see Tables B-1-1.19, B-1-1.20, B-1-1.21)
Qs Quantity of soil eaten by the foraginganimal (kg soil/day)
0.4
CSF Soil concentration (mg/kg) Calculated (see Table B-1-1.2)
Bamilk Biotransfer factor for milk (day/kg) Chemical-specific
Description
This equation calculates the concentration of constituent in milk from ingestion of forage and soil.
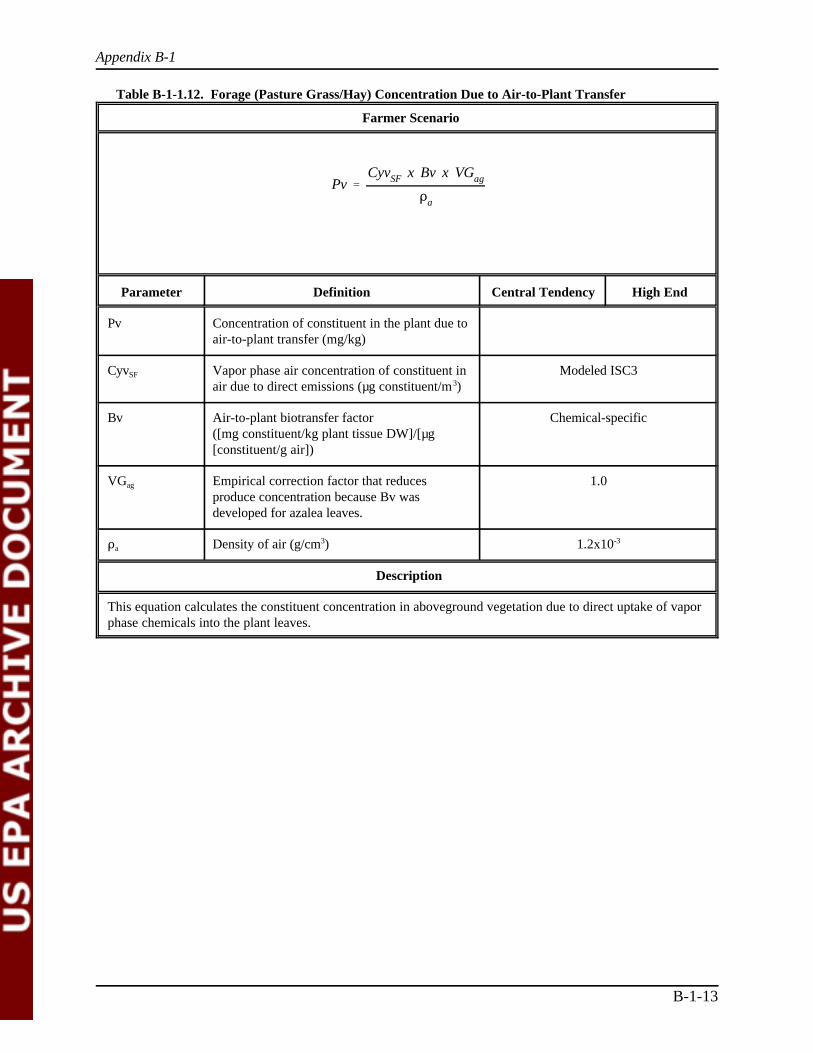
Appendix B-1
B-1-13
Pv 'CyvSF x Bv x VGag
Da
Table B-1-1.12. Forage (Pasture Grass/Hay) Concentration Due to Air-to-Plant Transfer
Farmer Scenario
Parameter Definition Central Tendency High End
Pv Concentration of constituent in the plant due toair-to-plant transfer (mg/kg)
CyvSF Vapor phase air concentration of constituent inair due to direct emissions (µg constituent/m3)
Modeled ISC3
Bv Air-to-plant biotransfer factor ([mg constituent/kg plant tissue DW]/[µg[constituent/g air])
Chemical-specific
VGag Empirical correction factor that reducesproduce concentration because Bv wasdeveloped for azalea leaves.
1.0
Da Density of air (g/cm3) 1.2x10⁻³
Description
This equation calculates the constituent concentration in aboveground vegetation due to direct uptake of vaporphase chemicals into the plant leaves.

Appendix B-1
B-1-14
Pr ' ji
CSF x Bri
Table B-1-1.13. Forage/Silage/Grain Concentration Due to Root Uptake
Farmer Scenario
Parameter Definition Default Value
Pr Concentration of constituent in the plant due to directuptake from soil (mg/kg)
CSF Average soil concentration of constituent overexposure duration (mg/kg)
Calculated(see Table B-1-1.2)
Bri Plant-soil bioconcentration factor plant species i(forage/silage/grain) [µg/g DW]/[µg/g soil]
Chemical-specific
Description
This equation calculates the constituent concentration in aboveground vegetation due to direct uptake ofconstituents from soil.

Appendix B-1
B-1-15
Isoil ' Sc @ CRsoil @ Fsoil
Table B-1-2.1. Contaminant Intake from Soil
Parameter Description Values
Isoil Daily intake of contaminant from soil (mg/d)
Sc Average soil concentration of pollutant over exposureduration (mg/kg)
Calculated (see Table B-1-1.2)
CRsoil Consumption rate of soil (kg/d) Varies
Fsoil Fraction of consumed soil contaminated (unitless) 1
Description
This equation calculates the daily intake of contaminant from soil consumption. The soil concentration willvary with each scenario, and the soil consumption rate varies for children.

Appendix B-1
B-1-16
Iev ' (Pd % Pv % Pr) @ CRev @ Fev
Table B-1-2.2. Contaminant Intake from Exposed Vegetable Intake
Parameter Description Values
Iev Daily intake of contaminant from exposed vegetables(mg/d)
Pd Concentration in exposed vegetables due to deposition(mg/kg DW)
Calculated(see Table B-1-1.13 for the
Farmer)
Pv Concentration in exposed vegetables due to air-to-planttransfer (mg/kg DW)
Calculated (see Table B-1-1.14 for the
Farmer)
Pr Concentration in exposed vegetables due to root uptake(mg/kg DW)
Calculated(see Table B-1-1.15 for the
Farmer)
CRev Consumption rate of exposed vegetables (kg DW/d)
Varies
Fev Fraction of exposed vegetables contaminated (unitless) Varies
Description
This equation calculates the daily intake of contaminant from ingestion of exposed vegetables. Theconsumption rate varies for children and adults. The contaminated fraction and the concentration in exposedvegetables will vary with each scenario.

Appendix B-1
B-1-17
Ief ' (Pd % Pv % Pr) @ CRef @ Fef
Table B-1-2.3. Contaminant Intake from Exposed Fruit Intake
Parameter Description Values
Ief Daily intake of contaminant from exposed fruit (mg/d)
Pd Concentration in exposed fruit due to deposition (mg/kgDW)
Calculated
Pv Concentration in exposed fruit due to air-to-plant transfer(mg/kg DW)
Calculated (see Table B-1-1.14 for the
Farmer)
Pr Concentration in exposed fruit due to root uptake (mg/kgDW)
Calculated(see Table B-1-1.15 for the
Farmer)
CRag Consumption rate of exposed fruit (kg DW/d)
Varies
Fag Fraction of exposed fruit contaminated (unitless) Varies
Description
This equation calculates the daily intake of contaminant from ingestion of exposed fruit. The consumptionrate varies for children and adults. The contaminated fraction and the concentration in exposed fruit will varywith each scenario.
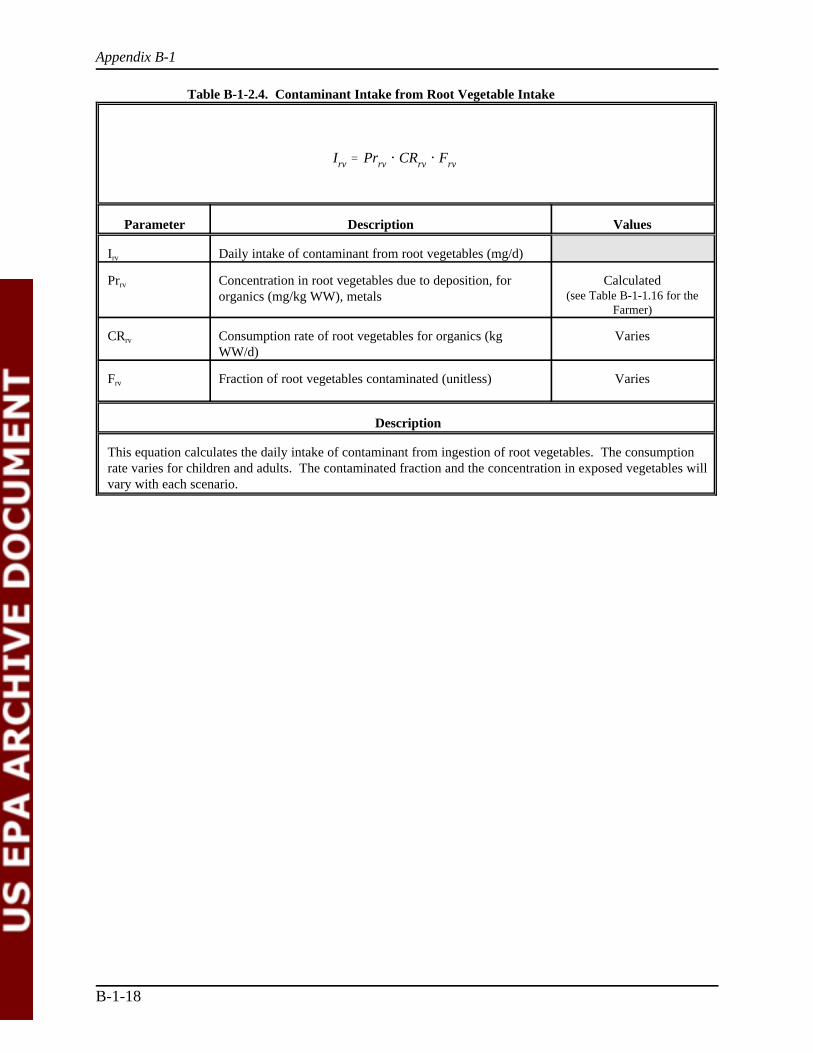
Appendix B-1
B-1-18
Irv ' Prrv @ CRrv @ Frv
Table B-1-2.4. Contaminant Intake from Root Vegetable Intake
Parameter Description Values
Irv Daily intake of contaminant from root vegetables (mg/d)
Prrv Concentration in root vegetables due to deposition, fororganics (mg/kg WW), metals
Calculated(see Table B-1-1.16 for the
Farmer)
CRrv Consumption rate of root vegetables for organics (kgWW/d)
Varies
Frv Fraction of root vegetables contaminated (unitless) Varies
Description
This equation calculates the daily intake of contaminant from ingestion of root vegetables. The consumptionrate varies for children and adults. The contaminated fraction and the concentration in exposed vegetables willvary with each scenario.

Appendix B-1
B-1-19
Ii ' Ai C CRi C Fi
Table B-1-2.5. Contaminant Intake from Beef and Dairy Intake
Parameter Description Values
Ii Daily intake of contaminant from animal tissue i (mg/d)
Ai Concentration in animal tissue i (mg/kg WW) Calculated (see Table B-1-1.17 for beef,
Table B-1-1.18 for dairy)
CRi Consumption rate of animal tissue i (kg WW/d) Varies
Fi Fraction of animal tissue i contaminated (unitless) Varies
Description
This equation calculates the daily intake of contaminant from ingestion of animal tissue (where the "i" in theabove equation refers to beef and dairy). The consumption rate varies for children and adults and for the typeof animal tissue.

Appendix B-1
B-1-20
I ' Isoil % Iev % Ibeef % Idairy % Ief % Irv
Table B-1-2.6. Total Daily Intake for Nongroundwater Indirect Pathways
Farmer and Child of Farmer
Parameter Description Values
I Total daily intake of contaminant (mg/d)
Isoil Daily intake of contaminant from soil (mg/d) Calculated(see Table B-1-2.1)
Iev Daily intake of contaminant from exposed vegetables Calculated(see Table B-1-2.2)
Ief Daily intake of contaminant from exposed fruit (mg/d) Calculated(see Table B-1-2.3)
Irv Daily intake of contaminant from root vegetables Calculated(see Table B-1-2.4)
Ibeef, Idairy Daily intake of contaminant from animal tissue (mg/d) Calculated(see Table B-1-2.5)
Description
This equation calculates the daily intake of contaminant on a pathway-by-pathway basis.

Appendix B-1
B-1-21
Cancer Risk ' I @ ED @ EF @ CSFBW @ AT @ 365
Table B-1-2.7. Individual Cancer Risk: Carcinogens
Parameter Description Values
Cancer Risk Individual lifetime cancer risk (unitless)
I Total daily intake of contaminant (mg/d) Calculated(see Tables B-1-2.1 - B-1-
2.5)
ED Exposure duration (yr) Varies
EF Exposure frequency (d/yr) 350
BW Body weight (kg) Adult: 70Child: 15
AT Averaging time (yr) 70
365 Units conversion factor (d/yr)
CSF Oral cancer slope factor (per mg/kg/d) Chemical-specific
Description
This equation calculates the individual cancer risk from indirect exposure to carcinogenic chemicals. The bodyweight varies for the child. The exposure duration varies for different scenarios.

Appendix B-1
B-1-22
HQ 'I
BW @ RfD
Table B-1-2.8. Hazard Quotient: Noncarcinogens
Parameter Description Values
HQ Hazard quotient (unitless)
I Total daily intake of contaminant (mg/d) Calculated(see Tables B-1-2.1 -
B-1-2.6)
BW Body weight (kg) Adult: 70Child: 15
RfD Reference Dose (mg/kg/d) Chemical-specific
Description
This equation calculates the hazard quotient for indirect exposure to noncarcinogenic chemicals. The bodyweight varies for the child.

Appendix B-1
B-1-23
Ca ' (Cvapor C Jair,t) % (PM10 C C0 C Cparticulate C1
1000C 1
1000)
Table B-1-3.1. Concentration in Air
Parameter Description Values
Ca Concentration in air (Fg/m3)Cvaport Annual average vapor air concentration
((Fg/m3)/(g/m2-s))Modeled ISC3
Jair,t Total contaminant flux to atmosphere (g/m2-s) Modeled (Chemical-specific)
PM10 Particulate matter (<10 micrometers) (g/m2-s) ModeledC0 Source constituent concentration (mg/kg) Chemical-specific
Cparticulate Annual average particulate air concentration ((Fg/m3)/(g/m2-s))
Modeled ISC3
Description
This equation calculates the inhalation cancer risk for individual constituents using the Unit Risk Factor.

Appendix B-1
B-1-24
Cancer Risk ' Ca C URF
Table B-1-3.2. Inhalation Cancer Risk for Individual Chemicals from Unit Risk Factor: Carcinogens
Parameter Description Values
Cancer Risk Individual Lifetime cancer risk (unitless)
Ca Concentration in air (Fg/m3) Calculated (see Table B-1-3.1)
URF Inhalation Unit Risk Factor (per Fg/m3) Chemical-specific
Description
This equation calculates the inhalation cancer risk for individual constituents using the Unit Risk Factor.

Appendix B-1
B-1-25
Cancer Risk ' ADI C CSFinh
ADI 'Ca C IR C ET C EF C ED C 0.001 mg/µg
BW C AT C 365 day/yr
Table B-1-3.3. Inhalation Cancer Risk for Individual Chemicals from Carcinogenic Slope Factor: Carcinogens
Parameter Description Values
Cancer Risk Individual lifetime cancer risk (unitless)
ADI Average daily intake via inhalation (mg/kg/d)
Ca Concentration of contaminant in the air (µg/m3) Calculated(see Table B-1-3.1)
IR Inhalation rate (m3/h) Varies
ET Exposure time (h/d) 24
EF Exposure frequency (d/yr) 350
ED Exposure duration (yr) Varies
BW Body weight (kg) Adult = 70Child = 15
AT Averaging time (yr) 70
CSFinh Inhalation Carcinogenic Slope Factor (per mg/kg/d) Chemical-specific
Description
This equation calculates the inhalation cancer risk for individual constituents using the Carcinogenic SlopeFactor.

Appendix B-1
B-1-26
HQ 'Ca C 0.001 mg/µg
RfC
Table B-1-3.4. Inhalation Hazard Quotient for Individual Chemicals: Noncarcinogens
Parameter Description Values
HQ Hazard quotient (unitless)
Ca Concentration in air (µg/m3) Calculated(see Table B-1-3.1)
RfC Reference concentration (mg/m3) Chemical-specific
Description
This equation calculates the inhalation hazard quotient for individual constituents.

Appendix B-1
B-1-27
CW(AV) 'MC(AV)
MT(AV)
MC(AV) ' (CW(BV) BD VW) & MV
MT(AV) ' (BD VW) & MV
Table B-1-4.1. Calculation of Waste Concentration after Volatilization for Organic Constituents of Concern in Landfills
Landfill Scenarios
Parameter Definition Central Tendency High End
CW(AV) Waste concentration after volatilization(mg/Kg)
MC(AV) Contaminant mass after volatilization (mg)
MT(AV) Total mass of waste after volatilization (Kg)
CW(BV) Average waste concentration beforevolatilization (mg/Kg), wet-weight basis
Waste stream-specific
BD Bulk density of waste (g/cm3) Waste stream-specific
VW Waste volume (m3) Waste stream-specific
Waste stream-specific
MV Contaminant mass volatilized during first30 years of landfill operation (mg)
Chemical-specific
Description
Above equations are used to calculate the waste concentration at the time the landfill is closed, that is, after 30years. Volatilization is assumed to occur only during the active life of the landfill, prior to installation of claycap. This waste concentration which is adjusted for volatilization losses is then used as input for thegroundwater fate and transport modeling.

Appendix B-1
B-1-28
kd ' koc x foc
Table B-1-4.2. Calculation of Soil-Water Partition Coefficients for Organic Constituents of Concern, Landfills and Land Treatment Units
Landfill
Parameter Definition Central Tendency High End
kd Soil-water partition coefficient (cm3/g)
koc Normalized distribution coefficient fororganic carbon (cm3/g)
Chemical-specific (see Appendix)
foc Fractional organic carbon content Waste specific
Description
This equation is used to calculate the soil-water partition coefficient for organic constituents.

Appendix B-1
B-1-29
Cancer Risk ' I @ ED @ EF @ CSFBW @ AT @ 365
Table B-1-5.1. Individual Cancer Risk from Ingestion: Carcinogens
Parameter Description Values
Cancer Risk Individual lifetime cancer risk (unitless)
I Total daily intake of contaminant (mg/d) Calculated(see Tables B-1-2.1 - B-1-
2.6)
ED Exposure duration (yr) Varies
EF Exposure frequency (d/yr) 350
BW Body weight (kg) Adult: 70Child: 15
AT Averaging time (yr) 70
365 Units conversion factor (d/yr)
CSF Oral cancer slope factor (per mg/kg/d) Chemical-specific
Description
This equation calculates the individual cancer risk from tap water ingestion of carcinogenic chemicals. Thebody weight varies for the child. The exposure duration varies for different scenarios.

Appendix B-1
B-1-30
HQ 'I
BW @ RfD
Table B-1-5.2. Hazard Quotient: Noncarcinogens
Parameter Description Values
HQ Hazard quotient (unitless)
I Total daily intake of contaminant (mg/d) Calculated(see Tables B-1-2.1 - B-1-
2.6)
BW Body weight (kg) Adult: 70Child: 15
RfD Reference Dose (mg/kg/d) Chemical-specific
Description
This equation calculates the hazard quotient for indirect exposure to noncarcinogenic chemicals. The bodyweight varies for the child.

Appendix C
Selection of Surrogates andPigment Waste Stream Constituents

Appendix C
C-2
Appendix C
Selection of Surrogates andPigment Waste Stream Constituents
C.1 Selection of Surrogates for Organic Constituents
Because of the large number of constituents of concern, constituents were grouped basedon subsurface fate and transport characteristics. Then one representative constituent from eachcategory was modeled. The modeled constituent in each category is called a surrogate. Themodeling results for the surrogate are then applied to each constituent in that category. Themethodology for grouping the constituents and choosing the surrogates is described here.
C.1.1 Basis for Grouping of Organic Constituents
The constituent list for the Dyes and Pigments Deferred Wastes (Section 4, Table 4-2)contains a total of 53 organic and 11 inorganic constituents. The number of modeling runsrequired to model these constituents in the sensitivity analysis was minimized by exploiting thefollowing features:
# For a given waste management scenario, if two organic constituents have the samewaste and leaching concentrations and the same sorption and hydrolysis ratecoefficients, the model will predict the same receptor well exposure concentration.
# If two organic constituents have the same receptor well exposure concentration,their waste and leachate concentration thresholds will be linearly proportional totheir respective HBL values.
Combined, these two features make it possible to group constituents based on subsurfacefate and transport characteristics, rather than requiring a separate modeling run for each individualconstituent on the list.
For computational efficiency, average transformation rate, 8, is calculated for eachconstituent, constituents are categorized according to their 8 and KOC values, and then themodeling is conducted for one representative constituent in each category. The modeled

Appendix C
C-3
LDLC & VLC ' N 8 C % N R MCMt
(C-1)
8 '81N % 82Db kd
N % Dbkd
(C-2)
constituent in each category is called a surrogate. The modeling results for the surrogate are thenapplied to each constituent in that category.
C.1.2 Calculation of Constituent-Specific Sorption and Decay Characteristics
The subsurface fate and transport of solute species is described by the advection-dispersion equation (U.S. EPA, 1996b):
where
L = divergence operatorD = dispersion tensorC = chemical concentrationV = velocity tensorN = porosity8 = first-order chemical decay coefficientR = retardation coefficient.
The chemical decay coefficient, 8, and the retardation coefficient, R, represent theconstituent-specific fate and transport characteristics that influence solute transport behavior. Inother words, for the same modeling scenario, chemicals with similar values for R and 8 areexpected to have similar fate and transport behavior. Thus, the model-predicted exposureconcentration of individual chemicals may be derived from the modeling results of chemicals withsimilar R and 8 values.
The following sections describe how R and 8 are determined from the chemical-specificorganic carbon partition coefficient, KOC, and the hydrolysis rate constants, Ka,n,b, respectively.
C.1.2.1 Chemical Decay Coefficient (88). The overall first-order chemical decaycoefficient of an organic species in the subsurface as modeled by EPACMTP is a combination ofdissolved phase and sorbed phase decay and is described by (U.S. EPA, 1996b):
where
81 = dissolved phase decay coefficient (y-1) N = porosity (or average water content in the unsaturated zone)

Appendix C
C-4
81 ' K Ta @ 10&pH % K T
n % K Tb @ 10&(14&pH)
82 ' 10 @ K Ta @ 10&pH % K T
n
(C-3)
K Ta,n,b ' K Tr
a,n,b eEa/Rg
1Tr % 273
&1
T % 273 (C-4)
82 = sorbed phase decay coefficient (y-1)Db = soil bulk density (gm/cm3)kd = soil-water partition coefficient (cm3/gm).
Note that the effect of sorbed phase decay is directly incorporated in the formulation of 8. The sorbed and dissolved phase decay coefficients are functions of the temperature-dependentchemical-specific hydrolysis rate constants Ka
T, KnT, and Kb
T (U.S. EPA, 1996b):
where
KaT = acid-catalyzed hydrolysis rate constant at temperature T (1/mol-yr)
pH = soil or aquifer pHKn
T = neutral hydrolysis rate constant at temperature T (1/yr)Kb
T = base-catalyzed hydrolysis rate constant at temperature T (1/mol-yr).
The temperature dependence of Ka,n,b is described by the Arrhenius equation:
where
Ea/Rg = activation coefficient = 10,000Tr = reference temperature (EC) = 25ET = soil or aquifer temperature (EC).
C.1.2.2 Parameters Used in the Calculation of Chemical-Specific Decay Rate. Equations C-2 through C-4 indicate that the modeled decay rate depends not only on thechemical-specific hydrolysis rate constants but also on a number of soil and aquifer parameters. These parameters include the bulk density, porosity (water content in unsaturated zone),temperature, and pH.
These parameters are not constants, but depend on soil type and location; for Monte Carloanalyses, each is characterized by a distribution of values. However, for computational efficiency,an average 8 value for each constituent is calculated so that constituents can be classifiedaccording to their KOC and 8 values. Modeling is conducted for one constituent in each category(called the surrogate) and modeling results for the surrogate are applied to each constituent in thatcategory.

Appendix C
C-5
R ' 1 %Dbkd
N(C-5)
kd ' foc @ koc (C-6)
In calculating the average chemical decay coefficient (l) for each of the 53 organicconstituents, the median values of the soil parameters are used. These values for the unsaturatedzone (rather than saturated zone) are used because the effect of contaminant sorption anddegradation as modeled by EPACMTP is much more pronounced in the unsaturated zone than inthe saturated zone. Although the unsaturated zone travel distance (from the base of the wasteunit to the water table) is generally much shorter than the travel distance through the saturatedzone to the receptor well, the flow rate through the unsaturated zone is several orders ofmagnitude smaller than the groundwater flow rate in the saturated zone. As a result, for a givenconstituent, most of the travel time from the source to the receptor well is spent in theunsaturated zone. Therefore, median values of unsaturated zone parameters (Table C-1) are usedin calculating the overall 8 value for the each constituent.
Table C-1. Median Parameters used to Derive 88
Soil Parameter Value
Water content, N 0.355
Bulk density, Db 1.65 g/cm3
Temperature, T 14.4EC
pH 6.8
C.1.2.3 Retardation Coefficient (R). The effect of equilibrium sorption is expressed inEPACMTP through the retardation coefficient, R, which is a function of the chemical-specificorganic carbon partition coefficient, KOC (U.S. EPA, 1996b):
where
Db = soil bulk density (gm/cm3)N = porosity (or average water content in the unsaturated zone)kd = soil-water partition coefficient (cm3/gm).
where
foc = fraction organic carbon in the soil or aquiferkoc = organic carbon partition coefficient.

Appendix C
C-6
C.1.3 Grouping of Constituents Based on KOC and 88
Using the criteria described below, categories based on KOC and 8 values are developedfor the organic constituents of concern. These categories are presented in Table C-2.
The value of 1.0 x 10⁻⁴ yr-1 (half-life of 6,931 years) is selected as the maximum value forthe lowest 8 category because constituents with a 8 value less than or equal to 1.0 x 10⁻⁴ yr-1 areclassified as nondegraders in the 1995 proposed Hazardous Waste Identification Rule (HWIR‘95) (U.S. EPA, 1996b). This is done because the modeled result will be the same (essentiallyidentical to that of a conservative constituent, i.e., 8 value of 0.0 yr-1) whether a constituent has a 8 value of 1.0 x 10⁻⁴ yr-1 or a smaller number such as 1.0 x 10⁻⁶ yr-1. The upper bound for thesecond 8 category, 0.1 yr-1 is chosen as a value just slightly higher than the 8 values of the threeconstituents in this category (see Tables C-2 and C-3).
Table C-2. Grouping of Constituents Based on KOC and 88
KOC (mL/g)
8 (yr-1) <1 <100 <1,000 <10,000 >10,000
<1.0 x 10⁻⁴ Group 1 Group 2 Group 3 Group 4 Group 5
<0.1 Group 6 Group 7 Group 8 Group 9 Group 10
>0.1 Group 1 Group 12 Group 13 Group 14 Group 15
Table C-3. Distribution of λλ and KOC for Organic Chemicals
KOC (mL/g)
8 (yr-1) <1 <100 <1,000 <10,000 >10,000 Total
<1.0 x 10⁻⁴ 7 24 9 9 4 53
<0.1 0 3 0 0 0 3
>0.1 0 1 0 0 0 1
Total 15 35 12 12 11 57
The upper bounds for each of the KOC categories are chosen both to provide meaningfulboundaries and to separate the nondegrading constituents into groups roughly equal in size.
The distribution of the organic chemicals within the chosen categories is shown inTable C-3. This table shows that the majority of the chemicals either do not or only slightlydegrade (hydrolysis rate < 0.0001).

Appendix C
C-7
Table C-4 lists the 53 organic constituents of concern from the wastes produced by dyesand pigments facilities. The last column of this table indicates the group to which eachconstituent was assigned.
The 8 and KOC value of the surrogate for each group of constituents is chosen as the lowest 8 andlowest KOC value of any constituents in that group. If the same constituent has both the lowest λ andlowest KOC value, then that constituent is chosen as the surrogate. The surrogates chosen in this mannerare highlighted in bold text on Table C-4.
Table C-4. Grouping of Organic Constituentsa
Organic Constituents forGroundwater Pathway CAS #
Koc(ml/g) 8 (1/yr) Group
Acetone 67-64-1 0.28 0.00E+00 1
Formaldehyde 50-00-0 0.43 0.00E+00 1
p-Phenylenediamine 106-50-3 0.24 0.00E+00 1
o-Phenylenediamine 95-54-5 0.68 0.00E+00 1
_______b 1
Aniline 62-53-3 4.6 0.00E+00 2
Benzaldehyde 100-52-7 14 0.00E+00 2
Benzene 71-43-2 65 0.00E+00 2
Benzidine 92-87-5 22 0.00E+00 2
Chloroaniline, p- 106-47-8 34 0.00E+00 2
Cresol, p- 106-44-5 43 0.00E+00 2
Chloroform 67-66-3 40 7.46E-05 2
N-N-Dimethylaniline 121-69-7 98 0.00E+00 2
Dimethyoxybenzidine, 3,3'- 119-90-4 31 0.00E+00 2
Methyl isobutyl ketone 108-10-1 7.4 0.00E+00 2
Phenol 108-95-2 14 0.00E+00 2
Pyridine 110-86-1 2.2 0.00E+00 2
Toluidine, o- 95-53-4 10 0.00E+00 2
Toluidine, p- 106-49-0 12 0.00E+00 2
Chlorobenzene 108-90-7 347 0.00E+00 3

Appendix C
Organic Constituents forGroundwater Pathway CAS #
Koc(ml/g) 8 (1/yr) Group
C-8
1,2-Diphenylhydrazine 122-66-7 417 0.00E+00 3
Ethylbenzene 100-41-4 661 0.00E+00 3
N-Nitrosodiphenylamine 86-30-6 692 0.00E+00 3
Toluene 108-88-3 269 0.00E+00 3
Xylenes (total) 1330-20-7 708 0.00E+00 3
_______a 3
Azobenzene 103-33-3 3162 0.00E+00 4
Diphenylamine 122-39-4 1445 0.00E+00 4
Naphthalene 91-20-3 1096 0.00E+00 4
Trichlorobenzene, 1,2,4- 120-82-1 4898 0.00E+00 4
Bis(2-ethylhexyl)phthalate 117-81-7 9549926 7.15E-10 5
_______a 5
Bromodichloromethane 75-27-4 60 7.91E-04 7
Methylene chloride 75-09-2 8.5 2.90E-04 7
_______b 7
a The complete list of constituents is not included at present because ofbusiness confidentiality concerns.
b These compounds were used in the original analysis but were laterdropped from the list of constituents of concern evaluated for this analysis. They were nevertheless retained as surrogate constituents for thecompounds assessed. They are not included at present because of businessconfidentiality concerns.
C.2 Selection of Surrogates for Inorganic Constituents
Inorganic constituents are assigned to the appropriate group based on their geochemicalcharacteristics. In general, these compounds do not hydrolyze to a significant degree. Anioniccompounds exhibit little or no sorption and therefore are grouped with the conservative organics(KOC < 1 and 8 < 1.0 x 10⁻⁴). Cationic compounds such as ammonia and the metals can bestrongly sorbed and thus can be grouped with organic compounds that are adsorbed to a similardegree.

Appendix C
*Relevant data are not included at present because of business confidentiality concerns.
C-9
For the metals listed in Table C-5, empirical (pH-dependent) isotherms are available foruse in the sensitivity analysis (Loux et al., 1990; U.S. EPA, 1996c). Thus, the pH-dependentisotherm is used to assign a Kd value for each metal for the filter aid waste stream based on thecentral tendency pH value of the waste stream (pH = _____;* data supplied by SAIC). The Kd
value is then divided by the fraction organic carbon in the waste (foc = _____;* data supplied bySAIC) to obtain an “effective KOC” value for each metal. This effective KOC value is then used toplace each metal in one of the groups established for organics. The results of the sensitivityanalysis for the surrogate assigned to each group are then applied to the metals in that group.
Table C-5. Assignment of Metals to Groups
MetalKd (L/kg)at pH ___a
Effective Koc
(L/kg)88
(yr-1) Group
As (III) a 380 0.0 3
As (V) a 625 0.0 3
Ba (II) a 1451 0.0 4
Cr (VI) a 195 0.0 3
Cu (II) a 6383 0.0 4
Ni (II) a 1311 0.0 4
Pb (II) a 1677 0.0 4
V (V) a 625 0.0 3
Zn (II) a 2054 0.0 4
a Relevant data are not included at present because of businessconfidentiality concerns.

Appendix C
C-10
C.3 References
Loux, N. T., C. R. Chafin, and S. M. Hassan. 1990. Statistics of Aquifer Material Properties andEmpirical pH-dependent Partitioning Relationships for As (III), As (V), Ba(II), Cd(II),Cr(VI), Cu(II), Hg(II), Ni(II), Pb(II), Sb(V), Se(IV), Tl(I), and Zn(II). Office of Researchand Development, U. S. Environmental Protection Agency, Athens GA.
U.S. EPA (Environmental Protection Agency). 1996a. EPA's Composite Model for LeachateMigration with Transformation Products (EPACMTP) Background Document for theFinite Source Methodology. Office of Solid Waste, Washington, DC.
U.S. EPA (Environmental Protection Agency). 1996b. EPA's Composite Model for LeachateMigration with Transformation Products (EPACMTP) Background Document for Metals.Office of Solid Waste, Washington, DC.

Appendix D
Chemical-Specific Inputs
Relevant data for some constituents are not included at present because of business confidentiality concerns

Appendix D
D-3
Table D-1. Chemical-Specific Inputs for Acetone
Parameter Definition Value Ref
Chemical/Physical Properties
Fv Fraction of pollutant air concentration present in the vaporphase (dimensionless)
1
Koc Soil adsorption coefficient (m/g) 0.58
Kow Octanol-water partition coefficient (unitless) 5.8E-1 SCDM
VP Vapor pressure (atm) 3.03E-1
SCDM
SOl Water solubility (mL/g) 1E+6 SCDM
MW Molecular weight (g/mol) 58.08
H Henry's law constant (atm-m3/mol) 3.88E-5
SCDM
Da Diffusivity in air (cm2/s) 1.2E-1 Water8
Dw Diffusivity in water (cm2/s) 1.1E-5 Water8
8 GW degradation rate (1/yr) 0
Transfer Factors
Bv Air-to-plant biotransfer factor ([µg pollutant/g plant tissueDW]/[µg pollutant/g air])
8E-2 Calc
RCF Root concentration factor ([µg pollutant/g plant tissueFW]/[µg pollutant/g soil water])
8.4E-1 Calc
BCFPlant-Soil Plant-soil bioconcentration factor ([µg pollutant/g planttissue DW]/[µg pollutant/g soil])
5.3E+1 Calc
Babeef/Bapork
Biotransfer factor for beef (d/kg)1 1.4E-8 Calc
Bamilk Biotransfer factor for milk (d/kg) 4.6E-9 Calc
Skin permeability constant for water (cm/hr) 5.7E-4
BAFFish Fish bioaccumulation factor (L/kg) N/A
BCFFish Fish bioconcentration factor (L/kg) 1.7E-1 EPA,91
Other Parameters
Fw Fraction of wet deposition that adheres to plant surfaces(dimensionless)
Health Benchmarks
CSF Cancer slope factor (per mg/kg/day) N/A
RfD Reference dose (mg/kg/d) 1E-1 IRIS
URF Unit risk factor (per µg/m3) N/A
RfC Reference concentration (mg/m3) 3.1E+1 ATSDR

Appendix D
D-4
Table D-2. Chemical-Specific Inputs for Aniline
Parameter Definition Value Ref
Chemical/Physical Properties
Fv Fraction of pollutant air concentration present in the vapor phase(dimensionless)
1
Koc Soil adsorption coefficient (m/g) 9.2
Kow Octanol-water partition coefficient (unitless) 9.5E+0 SCDM
VP Vapor pressure (atm) 6.45E-4 SCDM
SOl Water solubility (mL/g) 3.6E+4 SCDM
MW Molecular weight (g/mol) 93.13
H Henry's law constant (atm-m3/mol) 1.9E-6 SCDM
Da Diffusivity in air (cm2/s) 7E-2 Water8
Dw Diffusivity in water (cm2/s) 8.3E-6 Water8
8 GW degradation rate (1/yr) 0
Transfer Factors
Bv Air-to-plant biotransfer factor ([µg pollutant/g plant tissueDW]/[µg pollutant/g air])
3.3E+1 Calc
RCF Root concentration factor ([µg pollutant/g plant tissueFW]/[µg pollutant/g soil water])
9.9E-1 Calc
BCFPlant-Soil Plant-soil bioconcentration factor ([µg pollutant/g planttissue DW]/[µg pollutant/g soil]) 1.1E+1
Calc
Babeef/Bapork
Biotransfer factor for beef (d/kg)1 2.4E-7 Calc
Bamilk Biotransfer factor for milk (d/kg) 7.6E-8 Calc
Skin permeability constant for water (cm/hr) 2.6E-3
BAFFish Fish bioaccumulation factor (L/kg) N/A
BCFFish Fish bioconcentration factor (L/kg) 1.6E+0 EPA,91
Other Parameters
Fw Fraction of wet deposition that adheres to plant surfaces(dimensionless)
Health Benchmarks
CSF Cancer slope factor (per mg/kg/day) 5.7E-3 IRIS
RfD Reference dose (mg/kg/d) N/A
URF Unit risk factor (per µg/m3) N/A
RfC Reference concentration (mg/m3) 1E-3 IRIS

Appendix D
D-5
Table D-3. Chemical-Specific Inputs for Azobenzene
Parameter Definition Value Ref
Chemical/Physical Properties
Fv Fraction of pollutant air concentration present in the vaporphase (dimensionless)
0
Koc Soil adsorption coefficient (m/g) 5693
Kow Octanol-water partition coefficient (unitless) 6.6E+3 Vershueren
VP Vapor pressure (atm)
SOl Water solubility (mL/g)
MW Molecular weight (g/mol) 182.22
H Henry's law constant (atm-m3/mol)
Da Diffusivity in air (cm2/s) 8E-2 Water8
Dw Diffusivity in water (cm2/s) 8E-6 Water8
8 GW degradation rate (1/yr)
Transfer Factors
Bv Air-to-plant biotransfer factor ([µg pollutant/g plant tissueDW]/[µg pollutant/g air])
RCF Root concentration factor ([µg pollutant/g plant tissueFW]/[µg pollutant/g soil water])
2.7E+1 Calc
BCFPlant-Soil Plant-soil bioconcentration factor ([µg pollutant/g planttissue DW]/[µg pollutant/g soil]) 2.4E-1
Calc
Babeef/Bapork
Biotransfer factor for beef (d/kg)1 1.7E-4 Calc
Bamilk Biotransfer factor for milk (d/kg) 5.2E-5 Calc
Skin permeability constant for water (cm/hr) 7.6E-2
BAFFish Fish bioaccumulation factor (L/kg) N/A
BCFFish Fish bioconcentration factor (L/kg) N/A
Other Parameters
Fw Fraction of wet deposition that adheres to plant surfaces(dimensionless)
Health Benchmarks
CSF Cancer slope factor (per mg/kg/day) 1.1E-1 IRIS
RfD Reference dose (mg/kg/d) N/A
URF Unit risk factor (per µg/m3) 3.1E-5 IRIS
RfC Reference concentration (mg/m3) N/A

Appendix D
D-6
Table D-4. Chemical-Specific Inputs for Benzaldehyde
Parameter Definition Value Ref
Chemical/Physical Properties
Fv Fraction of pollutant air concentration present in the vapor phase(dimensionless)
1
Koc Soil adsorption coefficient (m/g) 29
Kow Octanol-water partition coefficient (unitless) 3E+1 Vershueren
VP Vapor pressure (atm) 1.24E-3 Vershueren
SOl Water solubility (mL/g) 3.3E+3 Vershueren
MW Molecular weight (g/mol) 106.13
H Henry's law constant (atm-m3/mol) 3.98E-5 Calc
Da Diffusivity in air (cm2/s) 7.3E-2 Water8
Dw Diffusivity in water (cm2/s) 9.1E-6 Water8
8 GW degradation rate (1/yr)
Transfer Factors
Bv Air-to-plant biotransfer factor ([µg pollutant/g plant tissueDW]/[µg pollutant/g air])
1.3E-1 Calc
RCF Root concentration factor ([µg pollutant/g plant tissueFW]/[µg pollutant/g soil water])
1.2E+0 Calc
BCFPlant-Soil Plant-soil bioconcentration factor ([µg pollutant/g planttissue DW]/[µg pollutant/g soil])
5.4E+0 Calc
Babeef/Bapork
Biotransfer factor for beef (d/kg)1 7.6E-7 Calc
Bamilk Biotransfer factor for milk (d/kg) 2.4E-7 Calc
Skin permeability constant for water (cm/hr) 4.8E-3
BAFFish Fish bioaccumulation factor (L/kg) N/A
BCFFish Fish bioconcentration factor (L/kg) N/A
Other Parameters
Fw Fraction of wet deposition that adheres to plant surfaces(dimensionless)
Health Benchmarks
CSF Cancer slope factor (per mg/kg/day) N/A
RfD Reference dose (mg/kg/d) 1E-1 IRIS
URF Unit risk factor (per µg/m3) N/A
RfC Reference concentration (mg/m3) N/A

Appendix D
D-7
Table D-5. Chemical-Specific Inputs for Benzene
Parameter Definition Value Ref
Chemical/Physical Properties
Fv Fraction of pollutant air concentration present in the vapor phase(dimensionless)
1
Koc Soil adsorption coefficient (m/g) 124
Kow Octanol-water partition coefficient (unitless) 1.3E+2 SCDM
VP Vapor pressure (atm) 1.25E-1 SCDM
SOl Water solubility (mL/g) 1.75E+3
SCDM
MW Molecular weight (g/mol) 78.11
H Henry's law constant (atm-m3/mol) 5.58E-3 Calc
Da Diffusivity in air (cm2/s) 8.8E-2 Water8
Dw Diffusivity in water (cm2/s) 9.8E-6 Water8
8 GW degradation rate (1/yr) 0
Transfer Factors
Bv Air-to-plant biotransfer factor ([µg pollutant/g plant tissueDW]/[µg pollutant/g air])
1.9E-1 Calc
RCF Root concentration factor ([µg pollutant/g plant tissueFW]/[µg pollutant/g soil water])
2.1E+0 Calc
BCFPlant-Soil Plant-soil bioconcentration factor ([µg pollutant/g planttissue DW]/[µg pollutant/g soil]) 2.3E+0
Calc
Babeef/Bapork
Biotransfer factor for beef (d/kg)1 3.4E-6 Calc
Bamilk Biotransfer factor for milk (d/kg) 1.1E-6 Calc
Skin permeability constant for water (cm/hr) 2.1E-2
BAFFish Fish bioaccumulation factor (L/kg) N/A
BCFFish Fish bioconcentration factor (L/kg) 4.2E+0 Mackay,82
Other Parameters
Fw Fraction of wet deposition that adheres to plant surfaces(dimensionless)
Health Benchmarks
CSF Cancer slope factor (per mg/kg/day) 2.9E-2 IRIS
RfD Reference dose (mg/kg/d) N/A
URF Unit risk factor (per µg/m3) 8.3E-6 IRIS
RfC Reference concentration (mg/m3) N/A

Appendix D
D-8
Table D-6. Chemical-Specific Inputs for Benzidine
Parameter Definition Value Ref
Chemical/Physical Properties
Fv Fraction of pollutant air concentration present in the vapor phase(dimensionless)
0.193867 EPA,94
Koc Soil adsorption coefficient (m/g) 43
Kow Octanol-water partition coefficient (unitless) 4.6E+1 SCDM
VP Vapor pressure (atm) 1.05E-11 SCDM
SOl Water solubility (mL/g) 5E+2 SCDM
MW Molecular weight (g/mol) 184.24
H Henry's law constant (atm-m3/mol) 3.88E-11 SCDM
Da Diffusivity in air (cm2/s) 3.4E-2 Water8
Dw Diffusivity in water (cm2/s) 1.5E-9 Water8
8 GW degradation rate (1/yr) 0
Transfer Factors
Bv Air-to-plant biotransfer factor ([µg pollutant/g plant tissueDW]/[µg pollutant/g air])
8.4E+6 Calc
RCF Root concentration factor ([µg pollutant/g plant tissueFW]/[µg pollutant/g soil water])
1.4E+0 Calc
BCFPlant-Soil Plant-soil bioconcentration factor ([µg pollutant/g planttissue DW]/[µg pollutant/g soil]) 4.3E+0
Calc
Babeef/Bapork
Biotransfer factor for beef (d/kg)1 1.1E-6 Calc
Bamilk Biotransfer factor for milk (d/kg) 3.6E-7 Calc
Skin permeability constant for water (cm/hr) 2.2E-3
BAFFish Fish bioaccumulation factor (L/kg) N/A
BCFFish Fish bioconcentration factor (L/kg) 5.4E+0 EPA,91
Other Parameters
Fw Fraction of wet deposition that adheres to plant surfaces(dimensionless)
Health Benchmarks
CSF Cancer slope factor (per mg/kg/day) 2.3E+2 IRIS
RfD Reference dose (mg/kg/d) 3E-3 IRIS
URF Unit risk factor (per µg/m3) 6.7E-2 IRIS
RfC Reference concentration (mg/m3) N/A

Appendix D
D-9
Table D-7. Chemical-Specific Inputs for Bis(2-Ethylexyl) Phthalate
Parameter Definition Value Ref
Chemical/Physical Properties
Fv Fraction of pollutant air concentration present in the vapor phase(dimensionless)
0.934485
EPA,94
Koc Soil adsorption coefficient (m/g) 15003065
Kow Octanol-water partition coefficient (unitless) 2E+7 SCDM
VP Vapor pressure (atm) 8.49E-9 SCDM
SOl Water solubility (mL/g) 3.4E-1 SCDM
MW Molecular weight (g/mol) 390.56
H Henry's law constant (atm-m3/mol) 1.02E-7 SCDM
Da Diffusivity in air (cm2/s) 3.5E-2 Water8
Dw Diffusivity in water (cm2/s) 3.7E-6 Water8
8 GW degradation rate (1/yr) 7.15E-10
Transfer Factors
Bv Air-to-plant biotransfer factor ([µg pollutant/g plant tissueDW]/[µg pollutant/g air])
8.2E+7 Calc
RCF Root concentration factor ([µg pollutant/g plant tissueFW]/[µg pollutant/g soil water])
1.3E+4 Calc
BCFPlant-Soil Plant-soil bioconcentration factor ([µg pollutant/g planttissue DW]/[µg pollutant/g soil]) 2.3E-3
Calc
Babeef/Bapork
Biotransfer factor for beef (d/kg)1 5E-1 Calc
Bamilk Biotransfer factor for milk (d/kg) 1.6E-1 Calc
Skin permeability constant for water (cm/hr) 1.2E+0
BAFFish Fish bioaccumulation factor (L/kg) 1.2E+2 Stephan,93
BCFFish Fish bioconcentration factor (L/kg) N/A
Other Parameters
Fw Fraction of wet deposition that adheres to plant surfaces(dimensionless)
Health Benchmarks
CSF Cancer slope factor (per mg/kg/day) 1.4E-2 IRIS
RfD Reference dose (mg/kg/d) 2E-2 IRIS
URF Unit risk factor (per µg/m3) N/A
RfC Reference concentration (mg/m3) 1E-3 Superfund
Table D-8. Chemical-Specific Inputs for Bromodichloromethane

Appendix D
D-10
Parameter Definition Value Ref
Chemical/Physical Properties
Fv Fraction of pollutant air concentration present in the vapor phase(dimensionless)
1
Koc Soil adsorption coefficient (m/g) 116
Kow Octanol-water partition coefficient (unitless) 1.3E+2 SCDM
VP Vapor pressure (atm) 6.58E-2 SCDM
SOl Water solubility (mL/g) 6.74E+3
SCDM
MW Molecular weight (g/mol) 163.83
H Henry's law constant (atm-m3/mol) 1.6E-3 Calc
Da Diffusivity in air (cm2/s) 3E-2 Water8
Dw Diffusivity in water (cm2/s) 1.1E-5 Water8
8 GW degradation rate (1/yr) 7.91E-4
Transfer Factors
Bv Air-to-plant biotransfer factor ([µg pollutant/g plant tissueDW]/[µg pollutant/g air])
6E-1 Calc
RCF Root concentration factor ([µg pollutant/g plant tissueFW]/[µg pollutant/g soil water])
2.1E+0 Calc
BCFPlant-Soil Plant-soil bioconcentration factor ([µg pollutant/g planttissue DW]/[µg pollutant/g soil]) 2.4E+0
Calc
Babeef/Bapork
Biotransfer factor for beef (d/kg)1 3.2E-6 Calc
Bamilk Biotransfer factor for milk (d/kg) 1E-6 Calc
Skin permeability constant for water (cm/hr) 5.9E-3
BAFFish Fish bioaccumulation factor (L/kg) N/A
BCFFish Fish bioconcentration factor (L/kg) 1.2E+1 EPA,91
Other Parameters
Fw Fraction of wet deposition that adheres to plant surfaces(dimensionless)
Health Benchmarks
CSF Cancer slope factor (per mg/kg/day) 6.2E-2 IRIS
RfD Reference dose (mg/kg/d) 2E-2 IRIS
URF Unit risk factor (per µg/m3) 1.8E-5 EPA,98
RfC Reference concentration (mg/m3) N/A

Appendix D
D-11
Table D-9. Chemical-Specific Inputs for p-Chloroaniline
Parameter Definition Value Ref
Chemical/Physical Properties
Fv Fraction of pollutant air concentration present in the vapor phase(dimensionless)
0.999992 EPA,94
Koc Soil adsorption coefficient (m/g) 66
Kow Octanol-water partition coefficient (unitless) 7.1E+1 SCDM
VP Vapor pressure (atm) 1.62E-5 SCDM
SOl Water solubility (mL/g) 5.3E+3 SCDM
MW Molecular weight (g/mol) 127.57
H Henry's law constant (atm-m3/mol) 3.31E-7 SCDM
Da Diffusivity in air (cm2/s) 4.8E-2 Water8
Dw Diffusivity in water (cm2/s) 1E-5 Water8
8 GW degradation rate (1/yr) 0
Transfer Factors
Bv Air-to-plant biotransfer factor ([µg pollutant/g plant tissueDW]/[µg pollutant/g air])
1.6E+3 Calc
RCF Root concentration factor ([µg pollutant/g plant tissueFW]/[µg pollutant/g soil water])
1.6E+0 Calc
BCFPlant-Soil Plant-soil bioconcentration factor ([µg pollutant/g planttissue DW]/[µg pollutant/g soil]) 3.3E+0
Calc
Babeef/Bapork
Biotransfer factor for beef (d/kg)1 1.8E-6 Calc
Bamilk Biotransfer factor for milk (d/kg) 5.6E-7 Calc
Skin permeability constant for water (cm/hr) 6.5E-3
BAFFish Fish bioaccumulation factor (L/kg) N/A
BCFFish Fish bioconcentration factor (L/kg) 7.6E+0 EPA,1991
Other Parameters
Fw Fraction of wet deposition that adheres to plant surfaces(dimensionless)
Health Benchmarks
CSF Cancer slope factor (per mg/kg/day) N/A
RfD Reference dose (mg/kg/d) 4E-3 IRIS
URF Unit risk factor (per µg/m3) N/A
RfC Reference concentration (mg/m3) N/A

Appendix D
D-12
Table D-10. Chemical-Specific Inputs for Chlorobenzene
Parameter Definition Value Ref
Chemical/Physical Properties
Fv Fraction of pollutant air concentration present in the vapor phase(dimensionless)
1
Koc Soil adsorption coefficient (m/g) 648
Kow Octanol-water partition coefficient (unitless) 7.2E+2 SCDM
VP Vapor pressure (atm) 1.58E-2 SCDM
SOl Water solubility (mL/g) 4.72E+2
SCDM
MW Molecular weight (g/mol) 112.56
H Henry's law constant (atm-m3/mol) 3.7E-3 SCDM
Da Diffusivity in air (cm2/s) 7.3E-2 Water8
Dw Diffusivity in water (cm2/s) 8.7E-6 Water8
8 GW degradation rate (1/yr) 0
Transfer Factors
Bv Air-to-plant biotransfer factor ([µg pollutant/g plant tissueDW]/[µg pollutant/g air])
1.7E+0 Calc
RCF Root concentration factor ([µg pollutant/g plant tissueFW]/[µg pollutant/g soil water])
5.6E+0 Calc
BCFPlant-Soil Plant-soil bioconcentration factor ([µg pollutant/g planttissue DW]/[µg pollutant/g soil]) 8.6E-1
Calc
Babeef/Bapork
Biotransfer factor for beef (d/kg)1 1.8E-5 Calc
Bamilk Biotransfer factor for milk (d/kg) 5.8E-6 Calc
Skin permeability constant for water (cm/hr) 4.2E-2
BAFFish Fish bioaccumulation factor (L/kg) N/A
BCFFish Fish bioconcentration factor (L/kg) 2.3E+1 Mackay, 82
Other Parameters
Fw Fraction of wet deposition that adheres to plant surfaces(dimensionless)
Health Benchmarks
CSF Cancer slope factor (per mg/kg/day) N/A
RfD Reference dose (mg/kg/d) 2E-2 IRIS
URF Unit risk factor (per µg/m3) N/A
RfC Reference concentration (mg/m3) 2E-2 HEAST

Appendix D
D-13
Table D-11. Chemical-Specific Inputs for Chloroform
Parameter Definition Value Ref
Chemical/Physical Properties
Fv Fraction of pollutant air concentration present in the vapor phase(dimensionless)
1
Koc Soil adsorption coefficient (m/g) 77
Kow Octanol-water partition coefficient (unitless) 8.3E+1 SCDM
VP Vapor pressure (atm) 2.59E-1 SCDM
SOl Water solubility (mL/g) 7.92E+3
SCDM
MW Molecular weight (g/mol) 119.38
H Henry's law constant (atm-m3/mol) 3.67E-3 SCDM
Da Diffusivity in air (cm2/s) 1E-1 Water8
Dw Diffusivity in water (cm2/s) 1E-5 Water8
8 GW degradation rate (1/yr) 7.46E-5
Transfer Factors
Bv Air-to-plant biotransfer factor ([µg pollutant/g plant tissueDW]/[µg pollutant/g air])
1.7E-1 Calc
RCF Root concentration factor ([µg pollutant/g plant tissueFW]/[µg pollutant/g soil water])
1.7E+0 Calc
BCFPlant-Soil Plant-soil bioconcentration factor ([µg pollutant/g planttissue DW]/[µg pollutant/g soil]) 3E+0
Calc
Babeef/Bapork
Biotransfer factor for beef (d/kg)1 2.1E-6 Calc
Bamilk Biotransfer factor for milk (d/kg) 6.6E-7 Calc
Skin permeability constant for water (cm/hr) 8.2E-3
BAFFish Fish bioaccumulation factor (L/kg) N/A
BCFFish Fish bioconcentration factor (L/kg) 2.6E+0 Mackay, 82
Other Parameters
Fw Fraction of wet deposition that adheres to plant surfaces(dimensionless)
Health Benchmarks
CSF Cancer slope factor (per mg/kg/day) 6.1E-3 IRIS
RfD Reference dose (mg/kg/d) 1E-2 IRIS
URF Unit risk factor (per µg/m3) 2.3E-5 IRIS
RfC Reference concentration (mg/m3) N/A

Appendix D
D-14
Table D-12. Chemical-Specific Inputs for p-Cresol
Parameter Definition Value Ref
Chemical/Physical Properties
Fv Fraction of pollutant air concentration present in the vapor phase(dimensionless)
1
Koc Soil adsorption coefficient (m/g) 83
Kow Octanol-water partition coefficient (unitless) 8.9E+1 SCDM
VP Vapor pressure (atm) 1.45E-4 SCDM
SOl Water solubility (mL/g) 2.15E+4
SCDM
MW Molecular weight (g/mol) 108.14
H Henry's law constant (atm-m3/mol) 7.92E-7 SCDM
Da Diffusivity in air (cm2/s) 7.4E-2 Water8
Dw Diffusivity in water (cm2/s) 1E-5 Water8
8 GW degradation rate (1/yr) 0
Transfer Factors
Bv Air-to-plant biotransfer factor ([µg pollutant/g plant tissue DW]/[µgpollutant/g air])
8.4E+2 Calc
RCF Root concentration factor ([µg pollutant/g plant tissue FW]/[µgpollutant/g soil water])
1.8E+0 Calc
BCFPlant-Soil Plant-soil bioconcentration factor ([µg pollutant/g plant tissueDW]/[µg pollutant/g soil]) 2.9E+0
Calc
Babeef/Bapork Biotransfer factor for beef (d/kg)1 2.2E-6 Calc
Bamilk Biotransfer factor for milk (d/kg) 7.1E-7 Calc
Skin permeability constant for water (cm/hr) 1E-2
BAFFish Fish bioaccumulation factor (L/kg) N/A
BCFFish Fish bioconcentration factor (L/kg) 9.1E+0 EPA,91
Other Parameters
Fw Fraction of wet deposition that adheres to plant surfaces(dimensionless)
Health Benchmarks
CSF Cancer slope factor (per mg/kg/day) N/A
RfD Reference dose (mg/kg/d) 5E-3 HEAST
URF Unit risk factor (per µg/m3) N/A
RfC Reference concentration (mg/m3) N/A

Appendix D
D-15
Table D-13. Chemical-Specific Inputs for 1,2-Dichlorobenzene
Parameter Definition Value Ref
Chemical/Physical Properties
Fv Fraction of pollutant air concentration present in the vapor phase(dimensionless)
1
Koc Soil adsorption coefficient (m/g) 2355
Kow Octanol-water partition coefficient (unitless) 2.7E+3 SCDM
VP Vapor pressure (atm) 1.79E-3 SCDM
SOl Water solubility (mL/g) 1.56E+2 SCDM
MW Molecular weight (g/mol) 147.00
H Henry's law constant (atm-m3/mol) 1.9E-3 SCDM
Da Diffusivity in air (cm2/s) 6.9E-2 Water8
Dw Diffusivity in water (cm2/s) 7.9E-6 Water8
8 GW degradation rate (1/yr) 0
Transfer Factors
Bv Air-to-plant biotransfer factor ([µg pollutant/g plant tissueDW]/[µg pollutant/g air])
1.3E+1 Calc
RCF Root concentration factor ([µg pollutant/g plant tissueFW]/[µg pollutant/g soil water])
1.4E+1 Calc
BCFPlant-Soil Plant-soil bioconcentration factor ([µg pollutant/g planttissue DW]/[µg pollutant/g soil]) 4E-1
Calc
Babeef/Bapork
Biotransfer factor for beef (d/kg)1 6.8E-5 Calc
Bamilk Biotransfer factor for milk (d/kg) 2.1E-5 Calc
Skin permeability constant for water (cm/hr) 6.6E-2
BAFFish Fish bioaccumulation factor (L/kg) N/A
BCFFish Fish bioconcentration factor (L/kg) 2.3E+2 Oliver &Niimi,83
Other Parameters
Fw Fraction of wet deposition that adheres to plant surfaces(dimensionless)
Health Benchmarks
CSF Cancer slope factor (per mg/kg/day) N/A
RfD Reference dose (mg/kg/d) 9E-2 IRIS
URF Unit risk factor (per µg/m3) N/A
RfC Reference concentration (mg/m3) 2E-1 HEAST

Appendix D
D-16
Table D-14. Chemical-Specific Inputs for 1,4-Dichlorobenzene
Parameter Definition Value Ref
Chemical/Physical Properties
Fv Fraction of pollutant air concentration present in the vapor phase(dimensionless)
1
Koc Soil adsorption coefficient (m/g) 2302
Kow Octanol-water partition coefficient (unitless) 2.6E+3 SCDM
VP Vapor pressure (atm) 1.32E-3 SCDM
SOl Water solubility (mL/g) 7.38E+1 SCDM
MW Molecular weight (g/mol) 147.00
H Henry's law constant (atm-m3/mol) 2.43E-3 SCDM
Da Diffusivity in air (cm2/s) 6.9E-2 Water8
Dw Diffusivity in water (cm2/s) 7.9E-6 Water8
8 GW degradation rate (1/yr) 0
Transfer Factors
Bv Air-to-plant biotransfer factor ([µg pollutant/g plant tissueDW]/[µg pollutant/g air])
1E+1 Calc
RCF Root concentration factor ([µg pollutant/g plant tissueFW]/[µg pollutant/g soil water])
1.4E+1 Calc
BCFPlant-Soil Plant-soil bioconcentration factor ([µg pollutant/g planttissue DW]/[µg pollutant/g soil]) 4.1E-1
Calc
Babeef/Bapork
Biotransfer factor for beef (d/kg)1 6.6E-5 Calc
Bamilk Biotransfer factor for milk (d/kg) 2.1E-5 Calc
Skin permeability constant for water (cm/hr) 6.5E-2
BAFFish Fish bioaccumulation factor (L/kg) N/A
BCFFish Fish bioconcentration factor (L/kg) 2.3E+2 Oliver&Niimi,83
Other Parameters
Fw Fraction of wet deposition that adheres to plant surfaces(dimensionless)
Health Benchmarks
CSF Cancer slope factor (per mg/kg/day) 2.4E-2 HEAST
RfD Reference dose (mg/kg/d) N/A
URF Unit risk factor (per µg/m3) N/A
RfC Reference concentration (mg/m3) 8E-1 IRIS

Appendix D
D-17
Table D-15. Chemical-Specific Inputs for 3,3'-Dimethoxybenzidine
Parameter Definition Value Ref
Chemical/Physical Properties
Fv Fraction of pollutant air concentration present in the vapor phase(dimensionless)
0.905382
EPA,94
Koc Soil adsorption coefficient (m/g) 60
Kow Octanol-water partition coefficient (unitless) 6.5E+1 SCDM
VP Vapor pressure (atm) 2.79E-10
SCDM
SOl Water solubility (mL/g) 6E+1 SCDM
MW Molecular weight (g/mol) 244.29
H Henry's law constant (atm-m3/mol) 1.81E-13
SCDM
Da Diffusivity in air (cm2/s) 2.4E-2 Water8
Dw Diffusivity in water (cm2/s) 5.5E-6 Water8
8 GW degradation rate (1/yr) 0
Transfer Factors
Bv Air-to-plant biotransfer factor ([µg pollutant/g plant tissueDW]/[µg pollutant/g air])
2.6E+9 Calc
RCF Root concentration factor ([µg pollutant/g plant tissueFW]/[µg pollutant/g soil water])
1.6E+00
Calc
BCFPlant-Soil Plant-soil bioconcentration factor ([µg pollutant/g planttissue DW]/[µg pollutant/g soil]) 3.5E+0
Calc
Babeef/Bapork
Biotransfer factor for beef (d/kg)1 1.6E-6 Calc
Bamilk Biotransfer factor for milk (d/kg) 5.1E-7 Calc
Skin permeability constant for water (cm/hr) 1.2E-3
BAFFish Fish bioaccumulation factor (L/kg) N/A
BCFFish Fish bioconcentration factor (L/kg) 7E+0 EPA,91
Other Parameters
Fw Fraction of wet deposition that adheres to plant surfaces(dimensionless)
Health Benchmarks
CSF Cancer slope factor (per mg/kg/day) 1.4E-2 HEAST
RfD Reference dose (mg/kg/d) N/A
URF Unit risk factor (per µg/m3) N/A
RfC Reference concentration (mg/m3) N/A

Appendix D
D-18
Table D-16. Chemical-Specific Inputs for N-N-Dimethylaniline
Parameter Definition Value Ref
Chemical/Physical Properties
Fv Fraction of pollutant air concentration present in the vapor phase(dimensionless)
1
Koc Soil adsorption coefficient (m/g) 187
Kow Octanol-water partition coefficient (unitless) 2E+2 Verschueren
VP Vapor pressure (atm) 9.13E-4 Verschueren
SOl Water solubility (mL/g) 1.1E+3 ASTER
MW Molecular weight (g/mol) 121.18
H Henry's law constant (atm-m3/mol) 9.96E-5 Calc
Da Diffusivity in air (cm2/s) 1.5E-1 Water8
Dw Diffusivity in water (cm2/s) 1.4E-5 Water8
8 GW degradation rate (1/yr)
Transfer Factors
Bv Air-to-plant biotransfer factor ([µg pollutant/g plant tissueDW]/[µg pollutant/g air])
1.6E+14E-1
Calc
RCF Root concentration factor ([µg pollutant/g plant tissueFW]/[µg pollutant/g soil water])
2.6E+0 Calc
BCFPlant-Soil Plant-soil bioconcentration factor ([µg pollutant/g planttissue DW]/[µg pollutant/g soil]) 1.8E+0
Calc
Babeef/Bapork
Biotransfer factor for beef (d/kg)1 5.1E-6 Calc
Bamilk Biotransfer factor for milk (d/kg) 1.6E-6 Calc
Skin permeability constant for water (cm/hr) 1.5E-2
BAFFish Fish bioaccumulation factor (L/kg) N/A
BCFFish Fish bioconcentration factor (L/kg) N/A
Other Parameters
Fw Fraction of wet deposition that adheres to plant surfaces(dimensionless)
Health Benchmarks
CSF Cancer slope factor (per mg/kg/day) N/A
RfD Reference dose (mg/kg/d) 2E-3 IRIS
URF Unit risk factor (per µg/m3) N/A
RfC Reference concentration (mg/m3) N/A

Appendix D
D-19
Table D-17. Chemical-Specific Inputs for Diphenylamine
Parameter Definition Value Ref
Chemical/Physical Properties
Fv Fraction of pollutant air concentration present in the vapor phase(dimensionless)
0.999752
EPA,94
Koc Soil adsorption coefficient (m/g) 2637
Kow Octanol-water partition coefficient (unitless) 3E+3 SCDM
VP Vapor pressure (atm) 8.79E-7 SCDM
SOl Water solubility (mL/g) 3.57E+1 SCDM
MW Molecular weight (g/mol) 169.23
H Henry's law constant (atm-m3/mol) 4.96E-7 SCDM
Da Diffusivity in air (cm2/s) 5.8E-2 Water8
Dw Diffusivity in water (cm2/s) 6.3E-6 Water8
8 GW degradation rate (1/yr) 0
Transfer Factors
Bv Air-to-plant biotransfer factor ([µg pollutant/g plant tissueDW]/[µg pollutant/g air])
5.7E+4 Calc
RCF Root concentration factor ([µg pollutant/g plant tissueFW]/[µg pollutant/g soil water])
1.5E+1 Calc
BCFPlant-Soil Plant-soil bioconcentration factor ([µg pollutant/g planttissue DW]/[µg pollutant/g soil]) 3.8E-1
Calc
Babeef/Bapork
Biotransfer factor for beef (d/kg)1 7.6E-5 Calc
Bamilk Biotransfer factor for milk (d/kg) 2.4E-5 Calc
Skin permeability constant for water (cm/hr) 5.2E-2
BAFFish Fish bioaccumulation factor (L/kg) N/A
BCFFish Fish bioconcentration factor (L/kg) 9.5E+1 Mackay,82
Other Parameters
Fw Fraction of wet deposition that adheres to plant surfaces(dimensionless)
Health Benchmarks
CSF Cancer slope factor (per mg/kg/day) N/A
RfD Reference dose (mg/kg/d) 2.5E-2 IRIS
URF Unit risk factor (per µg/m3) N/A
RfC Reference concentration (mg/m3) N/A

Appendix D
D-20
Table D-18. Chemical-Specific Inputs for 1,2-Diphenylhydrazine
Parameter Definition Value Ref
Chemical/Physical Properties
Fv Fraction of pollutant air concentration present in the vapor phase(dimensionless)
0.999941
EPA,94
Koc Soil adsorption coefficient (m/g) 777
Kow Octanol-water partition coefficient (unitless) 8.7E+2 SCDM
VP Vapor pressure (atm) 5.67E-7 SCDM
SOl Water solubility (mL/g) 6.8E+1 SCDM
MW Molecular weight (g/mol) 184.24
H Henry's law constant (atm-m3/mol) 1.54E-6 Calc
Da Diffusivity in air (cm2/s) 3.2E-2 Water8
Dw Diffusivity in water (cm2/s) 7.4E-6 Water8
8 GW degradation rate (1/yr) 0
Transfer Factors
Bv Air-to-plant biotransfer factor ([µg pollutant/g plant tissueDW]/[µg pollutant/g air])
4.9E+31.2E+2
Calc
RCF Root concentration factor ([µg pollutant/g plant tissueFW]/[µg pollutant/g soil water])
6.4E+0 Calc
BCFPlant-Soil Plant-soil bioconcentration factor ([µg pollutant/g planttissue DW]/[µg pollutant/g soil])
7.7E-1 Calc
Babeef/Bapork
Biotransfer factor for beef (d/kg)1 2.2E-5 Calc
Bamilk Biotransfer factor for milk (d/kg) 6.9E-6 Calc
Skin permeability constant for water (cm/hr) 1.8E-2
BAFFish Fish bioaccumulation factor (L/kg) N/A
BCFFish Fish bioconcentration factor (L/kg) N/A
Other Parameters
Fw Fraction of wet deposition that adheres to plant surfaces(dimensionless)
Health Benchmarks
CSF Cancer slope factor (per mg/kg/day) 8E-1 IRIS
RfD Reference dose (mg/kg/d) N/A
URF Unit risk factor (per µg/m3) 2.2E-4 IRIS
RfC Reference concentration (mg/m3) N/A

Appendix D
D-21
Table D-19. Chemical-Specific Inputs for Ethylbenzene
Parameter Definition Value Ref
Chemical/Physical Properties
Fv Fraction of pollutant air concentration present in the vapor phase(dimensionless)
1
Koc Soil adsorption coefficient (m/g) 1222
Kow Octanol-water partition coefficient (unitless) 1.4E+3 SCDM
VP Vapor pressure (atm) 1.26E-2 SCDM
SOl Water solubility (mL/g) 1.69E+2 SCDM
MW Molecular weight (g/mol) 106.17
H Henry's law constant (atm-m3/mol) 7.88E-3 SCDM
Da Diffusivity in air (cm2/s) 7.5E-2 Water8
Dw Diffusivity in water (cm2/s) 7.8E-6 Water8
8 GW degradation rate (1/yr) 0
Transfer Factors
Bv Air-to-plant biotransfer factor ([µg pollutant/g plant tissueDW]/[µg pollutant/g air])
1.6E+0 Calc
RCF Root concentration factor ([µg pollutant/g plant tissueFW]/[µg pollutant/g soil water])
8.7E+0 Calc
BCFPlant-Soil Plant-soil bioconcentration factor ([µg pollutant/g planttissue DW]/[µg pollutant/g soil]) 5.9E-1
Calc
Babeef/Bapork
Biotransfer factor for beef (d/kg)1 3.5E-5 Calc
Bamilk Biotransfer factor for milk (d/kg) 1.1E-5 Calc
Skin permeability constant for water (cm/hr) 7.3E-2
BAFFish Fish bioaccumulation factor (L/kg) N/A
BCFFish Fish bioconcentration factor (L/kg) 7.9E+1 EPA,91
Other Parameters
Fw Fraction of wet deposition that adheres to plant surfaces(dimensionless)
Health Benchmarks
CSF Cancer slope factor (per mg/kg/day) N/A
RfD Reference dose (mg/kg/d) 1E-1 IRIS
URF Unit risk factor (per µg/m3) N/A
RfC Reference concentration (mg/m3) 1E+0 IRIS

Appendix D
D-22
Table D-20. Chemical-Specific Inputs for Formaldehyde
Parameter Definition Value Ref
Chemical/Physical Properties
Fv Fraction of pollutant air concentration present in the vapor phase(dimensionless)
1
Koc Soil adsorption coefficient (m/g) .89
Kow Octanol-water partition coefficient (unitless) 8.9E-1 SCDM
VP Vapor pressure (atm) 6.89E+0 SCDM
SOl Water solubility (mL/g) 5.5E+5 SCDM
MW Molecular weight (g/mol) 30.03
H Henry's law constant (atm-m3/mol) 3.36E-7 SCDM
Da Diffusivity in air (cm2/s) 1.8E-1 Water8
Dw Diffusivity in water (cm2/s) 2E-5 Water8
8 GW degradation rate (1/yr) 0
Transfer Factors
Bv Air-to-plant biotransfer factor ([µg pollutant/g plant tissueDW]/[µg pollutant/g air])
1.5E+1 Calc
RCF Root concentration factor ([µg pollutant/g plant tissueFW]/[µg pollutant/g soil water])
8.5E-1 Calc
BCFPlant-Soil Plant-soil bioconcentration factor ([µg pollutant/g planttissue DW]/[µg pollutant/g soil]) 4.1E+1
Calc
Babeef/Bapork
Biotransfer factor for beef (d/kg)1 2.2E-8 Calc
Bamilk Biotransfer factor for milk (d/kg) 7.1E-9 Calc
Skin permeability constant for water (cm/hr) 1.2E-3
BAFFish Fish bioaccumulation factor (L/kg) N/A
BCFFish Fish bioconcentration factor (L/kg) 2.4E-1 EPA,91
Other Parameters
Fw Fraction of wet deposition that adheres to plant surfaces(dimensionless)
Health Benchmarks
CSF Cancer slope factor (per mg/kg/day) 4.5E-2 HEAST
RfD Reference dose (mg/kg/d) 2E-1 IRIS
URF Unit risk factor (per µg/m3) 1.3E-5 IRIS
RfC Reference concentration (mg/m3) N/A

Appendix D
D-23
Table D-21. Chemical-Specific Inputs for Methyl Isobutyl Ketone
Parameter Definition Value Ref
Chemical/Physical Properties
Fv Fraction of pollutant air concentration present in the vapor phase(dimensionless)
1
Koc Soil adsorption coefficient (m/g) 15
Kow Octanol-water partition coefficient (unitless) 1.5E+1 SCDM
VP Vapor pressure (atm) 2.62E-2 SCDM
SOl Water solubility (mL/g) 1.9E+4 SCDM
MW Molecular weight (g/mol) 100.16
H Henry's law constant (atm-m3/mol) 1.38E-4 Calc
Da Diffusivity in air (cm2/s) 7.5E-2 Water8
Dw Diffusivity in water (cm2/s) 7.8E-6 Water8
8 GW degradation rate (1/yr) 0
Transfer Factors
Bv Air-to-plant biotransfer factor ([µg pollutant/g plant tissueDW]/[µg pollutant/g air])
7.5E-1 Calc
RCF Root concentration factor ([µg pollutant/g plant tissueFW]/[µg pollutant/g soil water])
1.1E+0 Calc
BCFPlant-Soil Plant-soil bioconcentration factor ([µg pollutant/g planttissue DW]/[µg pollutant/g soil]) 7.9E+0
Calc
Babeef/Bapork
Biotransfer factor for beef (d/kg)1 3.9E-7 Calc
Bamilk Biotransfer factor for milk (d/kg) 1.2E-7 Calc
Skin permeability constant for water (cm/hr) 3.3E-3
BAFFish Fish bioaccumulation factor (L/kg) N/A
BCFFish Fish bioconcentration factor (L/kg) 2.3E+0 EPA,91
Other Parameters
Fw Fraction of wet deposition that adheres to plant surfaces(dimensionless)
Health Benchmarks
CSF Cancer slope factor (per mg/kg/day) N/A
RfD Reference dose (mg/kg/d) 8E-2 HEAST
URF Unit risk factor (per µg/m3) N/A
RfC Reference concentration (mg/m3) 8E-2 HEAST

Appendix D
D-24
Table D-22. Chemical-Specific Inputs for Methylene Chloride
Parameter Definition Value Ref
Chemical/Physical Properties
Fv Fraction of pollutant air concentration present in the vapor phase(dimensionless)
1
Koc Soil adsorption coefficient (m/g) 17
Kow Octanol-water partition coefficient (unitless) 1.8E+1 SCDM
VP Vapor pressure (atm) 5.7E-1 SCDM
SOl Water solubility (mL/g) 1.3E+4 SCDM
MW Molecular weight (g/mol) 84.93
H Henry's law constant (atm-m3/mol) 2.19E-3 SCDM
Da Diffusivity in air (cm2/s) 1E-1 Water8
Dw Diffusivity in water (cm2/s) 1.2E-5 Water8
8 GW degradation rate (1/yr) 2.9E-4
Transfer Factors
Bv Air-to-plant biotransfer factor ([µg pollutant/g plant tissueDW]/[µg pollutant/g air])
5.5E-2 Calc
RCF Root concentration factor ([µg pollutant/g plant tissueFW]/[µg pollutant/g soil water])
1.1E+0 Calc
BCFPlant-Soil Plant-soil bioconcentration factor ([µg pollutant/g planttissue DW]/[µg pollutant/g soil]) 7.3E+0
Calc
Babeef/Bapork
Biotransfer factor for beef (d/kg)1 4.5E-7 Calc
Bamilk Biotransfer factor for milk (d/kg) 1.4E-7 Calc
Skin permeability constant for water (cm/hr) 4.5E-3
BAFFish Fish bioaccumulation factor (L/kg) N/A
BCFFish Fish bioconcentration factor (L/kg) 2.5E+0 EPA,91
Other Parameters
Fw Fraction of wet deposition that adheres to plant surfaces(dimensionless)
Health Benchmarks
CSF Cancer slope factor (per mg/kg/day) 7.5E-3 IRIS
RfD Reference dose (mg/kg/d) 6E-2 IRIS
URF Unit risk factor (per µg/m3) 4.7E-7 IRIS
RfC Reference concentration (mg/m3) 3E+0 HEAST

Appendix D
D-25
Table D-23. Chemical-Specific Inputs for Naphthalene
Parameter Definition Value Ref
Chemical/Physical Properties
Fv Fraction of pollutant air concentration present in the vapor phase(dimensionless)
1
Koc Soil adsorption coefficient (m/g) 2010
Kow Octanol-water partition coefficient (unitless) 2.3E+3 SCDM
VP Vapor pressure (atm) 1.12E-4 SCDM
SOl Water solubility (mL/g) 3.1E+1 SCDM
MW Molecular weight (g/mol) 128.17
H Henry's law constant (atm-m3/mol) 4.83E-4 SCDM
Da Diffusivity in air (cm2/s) 5.9E-2 Water8
Dw Diffusivity in water (cm2/s) 7.5E-6 Water8
8 GW degradation rate (1/yr) 0
Transfer Factors
Bv Air-to-plant biotransfer factor ([µg pollutant/g plant tissueDW]/[µg pollutant/g air])
4.4E+1 Calc
RCF Root concentration factor ([µg pollutant/g plant tissueFW]/[µg pollutant/g soil water])
1.2E+1 Calc
BCFPlant-Soil Plant-soil bioconcentration factor ([µg pollutant/g planttissue DW]/[µg pollutant/g soil]) 4.4E-1
Calc
Babeef/Bapork
Biotransfer factor for beef (d/kg)1 5.8E-5 Calc
Bamilk Biotransfer factor for milk (d/kg) 1.8E-5 Calc
Skin permeability constant for water (cm/hr) 7.7E-2
BAFFish Fish bioaccumulation factor (L/kg) N/A
BCFFish Fish bioconcentration factor (L/kg) 7.2E+1 Mackay,82
Other Parameters
Fw Fraction of wet deposition that adheres to plant surfaces(dimensionless)
Health Benchmarks
CSF Cancer slope factor (per mg/kg/day) N/A
RfD Reference dose (mg/kg/d) 2E-2 IRIS
URF Unit risk factor (per µg/m3) N/A
RfC Reference concentration (mg/m3) 3E-3 IRIS

Appendix D
D-26
Table D-24. Chemical-Specific Inputs for N-Nitrosodiphenylamine
Parameter Definition Value Ref
Chemical/Physical Properties
Fv Fraction of pollutant air concentration present in the vapor phase(dimensionless)
0.999821
EPA,94
Koc Soil adsorption coefficient (m/g) 1278
Kow Octanol-water partition coefficient (unitless) 1.4E+3 SCDM
VP Vapor pressure (atm) 8.8E-7 SCDM
SOl Water solubility (mL/g) 3.51E+1 SCDM
MW Molecular weight (g/mol) 198.22
H Henry's law constant (atm-m3/mol) 5E-6 SCDM
Da Diffusivity in air (cm2/s) 2.9E-2 Water8
Dw Diffusivity in water (cm2/s) 6.9E-6 Water8
8 GW degradation rate (1/yr) 0
Transfer Factors
Bv Air-to-plant biotransfer factor ([µg pollutant/g plant tissueDW]/[µg pollutant/g air])
2.6E+3 Calc
RCF Root concentration factor ([µg pollutant/g plant tissueFW]/[µg pollutant/g soil water])
9E+0 Calc
BCFPlant-Soil Plant-soil bioconcentration factor ([µg pollutant/g planttissue DW]/[µg pollutant/g soil]) 5.8E-1
Calc
Babeef/Bapork
Biotransfer factor for beef (d/kg)1 3.6E-5 Calc
Bamilk Biotransfer factor for milk (d/kg) 1.1E-5 Calc
Skin permeability constant for water (cm/hr) 2.1E-2
BAFFish Fish bioaccumulation factor (L/kg) N/A
BCFFish Fish bioconcentration factor (L/kg) 9.8E+1 Veith etal,80
Other Parameters
Fw Fraction of wet deposition that adheres to plant surfaces(dimensionless)
Health Benchmarks
CSF Cancer slope factor (per mg/kg/day) 4.9E-3 IRIS
RfD Reference dose (mg/kg/d) N/A
URF Unit risk factor (per µg/m3) 2.6E-6 CalEPA97
RfC Reference concentration (mg/m3) N/A

Appendix D
D-27
Table D-25. Chemical-Specific Inputs for Phenol
Parameter Definition Value Ref
Chemical/Physical Properties
Fv Fraction of pollutant air concentration present in the vapor phase(dimensionless)
1
Koc Soil adsorption coefficient (m/g) 29
Kow Octanol-water partition coefficient (unitless) 3E+1 SCDM
VP Vapor pressure (atm) 3.63E-4 SCDM
SOl Water solubility (mL/g) 8.28E+4 SCDM
MW Molecular weight (g/mol) 94.11
H Henry's law constant (atm-m3/mol) 3.97E-7 SCDM
Da Diffusivity in air (cm2/s) 8.2E-2 Water8
Dw Diffusivity in water (cm2/s) 9.1E-6 Water8
8 GW degradation rate (1/yr) 0
Transfer Factors
Bv Air-to-plant biotransfer factor ([µg pollutant/g plant tissueDW]/[µg pollutant/g air])
5.3E+2 Calc
RCF Root concentration factor ([µg pollutant/g plant tissueFW]/[µg pollutant/g soil water])
1.2E+0 Calc
BCFPlant-Soil Plant-soil bioconcentration factor ([µg pollutant/g planttissue DW]/[µg pollutant/g soil]) 5.4E+0
Calc
Babeef/Bapork
Biotransfer factor for beef (d/kg)1 7.6E-7 Calc
Bamilk Biotransfer factor for milk (d/kg) 2.4E-7 Calc
Skin permeability constant for water (cm/hr) 5.7E-3
BAFFish Fish bioaccumulation factor (L/kg) N/A
BCFFish Fish bioconcentration factor (L/kg) 1.7E+3 Stephan,93
Other Parameters
Fw Fraction of wet deposition that adheres to plant surfaces(dimensionless)
Health Benchmarks
CSF Cancer slope factor (per mg/kg/day) N/A
RfD Reference dose (mg/kg/d) 6E-1 IRIS
URF Unit risk factor (per µg/m3) N/A
RfC Reference concentration (mg/m3) 6E-3 EPA,98

Appendix D
D-28
Table D-26. Chemical-Specific Inputs for o-Phenylenediamine
Parameter Definition Value Ref
Chemical/Physical Properties
Fv Fraction of pollutant air concentration present in the vapor phase(dimensionless)
1
Koc Soil adsorption coefficient (m/g) 1.4
Kow Octanol-water partition coefficient (unitless) 1.4E+0 Verschueren
VP Vapor pressure (atm) 6.76E-4 ASTDR
SOl Water solubility (mL/g) 4.15E+4 Verschueren
MW Molecular weight (g/mol) 108.15
H Henry's law constant (atm-m3/mol) 1.76E-6 Calc
Da Diffusivity in air (cm2/s) 6.6E-2 Water8
Dw Diffusivity in water (cm2/s) 9.9E-6 Water8
8 GW degradation rate (1/yr) 0
Transfer Factors
Bv Air-to-plant biotransfer factor ([µg pollutant/g plant tissueDW]/[µg pollutant/g air])
4.6E+01.1E+0
Calc
RCF Root concentration factor ([µg pollutant/g plant tissueFW]/[µg pollutant/g soil water])
8.6E-1 Calc
BCFPlant-Soil Plant-soil bioconcentration factor ([µg pollutant/g planttissue DW]/[µg pollutant/g soil]) 3.2E+1
Calc
Babeef/Bapork
Biotransfer factor for beef (d/kg)1 3.5E-8 Calc
Bamilk Biotransfer factor for milk (d/kg) 1.1E-8 Calc
Skin permeability constant for water (cm/hr) 5.3E-4
BAFFish Fish bioaccumulation factor (L/kg) N/A
BCFFish Fish bioconcentration factor (L/kg) N/A
Other Parameters
Fw Fraction of wet deposition that adheres to plant surfaces(dimensionless)
Health Benchmarks
CSF Cancer slope factor (per mg/kg/day) 4.7E-2 HEAST
RfD Reference dose (mg/kg/d) N/A
URF Unit risk factor (per µg/m3) N/A
RfC Reference concentration (mg/m3) N/A

Appendix D
D-29
Table D-27. Chemical-Specific Inputs for p-Phenylenediamine
Parameter Definition Value Ref
Chemical/Physical Properties
Fv Fraction of pollutant air concentration present in the vapor phase(dimensionless)
0.999996
EPA,94
Koc Soil adsorption coefficient (m/g) 0.51
Kow Octanol-water partition coefficient (unitless) 5E-1 Hansch,95
VP Vapor pressure (atm) 6.05E-6 EPA,96
SOl Water solubility (mL/g) 3.8E+4 Verschueren
MW Molecular weight (g/mol) 108.15
H Henry's law constant (atm-m3/mol) 1.72E-8 Calc
Da Diffusivity in air (cm2/s) 6.6E-2 Water8
Dw Diffusivity in water (cm2/s) 9.9E-6 Water8
8 GW degradation rate (1/yr) 0
Transfer Factors
Bv Air-to-plant biotransfer factor ([µg pollutant/g plant tissueDW]/[µg pollutant/g air])
3.9E+0 Calc
RCF Root concentration factor ([µg pollutant/g plant tissueFW]/[µg pollutant/g soil water])
8.4E-1 Calc
BCFPlant-Soil Plant-soil bioconcentration factor ([µg pollutant/g planttissue DW]/[µg pollutant/g soil]) 5.8E+1
Calc
Babeef/Bapork
Biotransfer factor for beef (d/kg)1 1.3E-8 Calc
Bamilk Biotransfer factor for milk (d/kg) 4E-9 Calc
Skin permeability constant for water (cm/hr) 2.6E-4
BAFFish Fish bioaccumulation factor (L/kg) N/A
BCFFish Fish bioconcentration factor (L/kg) N/A
Other Parameters
Fw Fraction of wet deposition that adheres to plant surfaces(dimensionless)
Health Benchmarks
CSF Cancer slope factor (per mg/kg/day) N/A
RfD Reference dose (mg/kg/d) 1.9E-1 HEAST
URF Unit risk factor (per µg/m3) N/A
RfC Reference concentration (mg/m3) N/A

Appendix D
D-30
Table D-28. Chemical-Specific Inputs for Pyridine
Parameter Definition Value Ref
Chemical/Physical Properties
Fv Fraction of pollutant air concentration present in the vapor phase(dimensionless)
1
Koc Soil adsorption coefficient (m/g) 4.6
Kow Octanol-water partition coefficient (unitless) 4.7E+0 SCDM
VP Vapor pressure (atm) 2.74E-2 SCDM
SOl Water solubility (mL/g) 1E+6 SCDM
MW Molecular weight (g/mol) 79.10
H Henry's law constant (atm-m3/mol) 8.88E-6 SCDM
Da Diffusivity in air (cm2/s) 9.1E-2 Water8
Dw Diffusivity in water (cm2/s) 7.6E-6 Water8
8 GW degradation rate (1/yr) 0
Transfer Factors
Bv Air-to-plant biotransfer factor ([µg pollutant/g plant tissueDW]/[µg pollutant/g air])
3.3E+0 Calc
RCF Root concentration factor ([µg pollutant/g plant tissueFW]/[µg pollutant/g soil water])
9.2E-1 Calc
BCFPlant-Soil Plant-soil bioconcentration factor ([µg pollutant/g planttissue DW]/[µg pollutant/g soil]) 1.6E+1
Calc
Babeef/Bapork
Biotransfer factor for beef (d/kg)1 1.2E-7 Calc
Bamilk Biotransfer factor for milk (d/kg) 3.7E-8 Calc
Skin permeability constant for water (cm/hr) 1.9E-3
BAFFish Fish bioaccumulation factor (L/kg) N/A
BCFFish Fish bioconcentration factor (L/kg) 8.9E-1 EPA,91
Other Parameters
Fw Fraction of wet deposition that adheres to plant surfaces(dimensionless)
Health Benchmarks
CSF Cancer slope factor (per mg/kg/day) N/A
RfD Reference dose (mg/kg/d) 1E-3 IRIS
URF Unit risk factor (per µg/m3) N/A
RfC Reference concentration (mg/m3) 7E-3 EPA,98

Appendix D
D-31
Table D-29. Chemical-Specific Inputs for Toluene
Parameter Definition Value Ref
Chemical/Physical Properties
Fv Fraction of pollutant air concentration present in the vapor phase(dimensionless)
1
Koc Soil adsorption coefficient (m/g) 505
Kow Octanol-water partition coefficient (unitless) 5.6E+2 SCDM
VP Vapor pressure (atm) 3.74E-2 SCDM
SOl Water solubility (mL/g) 5.26E+2 SCDM
MW Molecular weight (g/mol) 92.14
H Henry's law constant (atm-m3/mol) 6.64E-3 SCDM
Da Diffusivity in air (cm2/s) 8.7E-2 Water8
Dw Diffusivity in water (cm2/s) 8.6E-6 Water8
8 GW degradation rate (1/yr) 0
Transfer Factors
Bv Air-to-plant biotransfer factor ([µg pollutant/g plant tissue DW]/[µgpollutant/g air])
7.1E-1 Calc
RCF Root concentration factor ([µg pollutant/g plant tissue FW]/[µgpollutant/g soil water])
4.8E+0 Calc
BCFPlant-Soil Plant-soil bioconcentration factor ([µg pollutant/g plant tissueDW]/[µg pollutant/g soil]) 1E+0
Calc
Babeef/Bapork Biotransfer factor for beef (d/kg)1 1.4E-5 Calc
Bamilk Biotransfer factor for milk (d/kg) 4.5E-6 Calc
Skin permeability constant for water (cm/hr) 4.7E-2
BAFFish Fish bioaccumulation factor (L/kg) N/A
BCFFish Fish bioconcentration factor (L/kg) 4.8E+1 Veith et al. 80
Other Parameters
Fw Fraction of wet deposition that adheres to plant surfaces(dimensionless)
Health Benchmarks
CSF Cancer slope factor (per mg/kg/day) N/A
RfD Reference dose (mg/kg/d) 2E-1 IRIS
URF Unit risk factor (per µg/m3) N/A
RfC Reference concentration (mg/m3) 4E-1 IRIS

Appendix D
D-32
Table D-30. Chemical-Specific Inputs for o-Toluidine
Parameter Definition Value Ref
Chemical/Physical Properties
Fv Fraction of pollutant air concentration present in the vapor phase(dimensionless)
1
Koc Soil adsorption coefficient (m/g) 21
Kow Octanol-water partition coefficient (unitless) 2.2E+1 SCDM
VP Vapor pressure (atm) 4.21E-4 SCDM
SOl Water solubility (mL/g) 1.66E+4 SCDM
MW Molecular weight (g/mol) 107.16
H Henry's law constant (atm-m3/mol) 2.72E-6 Calc
Da Diffusivity in air (cm2/s) 7.1E-2 Water8
Dw Diffusivity in water (cm2/s) 9.1E-6 Water8
8 GW degradation rate (1/yr) 0
Transfer Factors
Bv Air-to-plant biotransfer factor ([µg pollutant/g plant tissue DW]/[µgpollutant/g air])
5.5E+0 Calc
RCF Root concentration factor ([µg pollutant/g plant tissue FW]/[µgpollutant/g soil water])
1.1E+0 Calc
BCFPlant-Soil Plant-soil bioconcentration factor ([µg pollutant/g plant tissueDW]/[µg pollutant/g soil]) 6.5E+0
Calc
Babeef/Bapork Biotransfer factor for beef (d/kg)1 5.5E-7 Calc
Bamilk Biotransfer factor for milk (d/kg) 1.7E-7 Calc
Skin permeability constant for water (cm/hr) 3.8E-3
BAFFish Fish bioaccumulation factor (L/kg) N/A
BCFFish Fish bioconcentration factor (L/kg) 3E+0 EPA,91
Other Parameters
Fw Fraction of wet deposition that adheres to plant surfaces(dimensionless)
Health Benchmarks
CSF Cancer slope factor (per mg/kg/day) N/A
RfD Reference dose (mg/kg/d) N/A
URF Unit risk factor (per µg/m3) 6.9E-5 EPA,98
RfC Reference concentration (mg/m3) N/A

Appendix D
D-33
Table D-31. Chemical-Specific Inputs for p-Toluidine
Parameter Definition Value Ref
Chemical/Physical Properties
Fv Fraction of pollutant air concentration present in the vapor phase(dimensionless)
1
Koc Soil adsorption coefficient (m/g) 24
Kow Octanol-water partition coefficient (unitless) 2.5E+1 SCDM
VP Vapor pressure (atm) 2.34E-4 SCDM
SOl Water solubility (mL/g) 7.82E+2 SCDM
MW Molecular weight (g/mol) 107.16
H Henry's law constant (atm-m3/mol) 3.21E-5 Calc
Da Diffusivity in air (cm2/s) 7E-2 Water8
Dw Diffusivity in water (cm2/s) 9.4E-6 Water8
8 GW degradation rate (1/yr) 0
Transfer Factors
Bv Air-to-plant biotransfer factor ([µg pollutant/g plant tissue DW]/[µgpollutant/g air])
5.4E+0 Calc
RCF Root concentration factor ([µg pollutant/g plant tissue FW]/[µgpollutant/g soil water])
1.2E+0 Calc
BCFPlant-Soil Plant-soil bioconcentration factor ([µg pollutant/g plant tissueDW]/[µg pollutant/g soil]) 6.0E+0
Calc
Babeef/Bapork Biotransfer factor for beef (d/kg)1 6.3E-7 Calc
Bamilk Biotransfer factor for milk (d/kg) 2E-7 Calc
Skin permeability constant for water (cm/hr) 4.2E-3
BAFFish Fish bioaccumulation factor (L/kg) N/A
BCFFish Fish bioconcentration factor (L/kg) 3.3E+0 EPA,91
Other Parameters
Fw Fraction of wet deposition that adheres to plant surfaces(dimensionless)
Health Benchmarks
CSF Cancer slope factor (per mg/kg/day) 1.9E-1 HEAST
RfD Reference dose (mg/kg/d) N/A
URF Unit risk factor (per µg/m3) N/A
RfC Reference concentration (mg/m3) N/A

Appendix D
D-34
Table D-32. Chemical-Specific Inputs for 1,2,4-Trichlorobenzene
Parameter Definition Value Ref
Chemical/Physical Properties
Fv Fraction of pollutant air concentration present in the vapor phase(dimensionless)
1
Koc Soil adsorption coefficient (m/g) 8752
Kow Octanol-water partition coefficient (unitless) 1E+4 SCDM
VP Vapor pressure (atm) 5.67E-4 SCDM
SOl Water solubility (mL/g) 3E+2 SCDM
MW Molecular weight (g/mol) 181.45
H Henry's law constant (atm-m3/mol) 1.42E-3 SCDM
Da Diffusivity in air (cm2/s) 3E-2 Water8
Dw Diffusivity in water (cm2/s) 8.2E-6 Water8
8 GW degradation rate (1/yr) 0
Transfer Factors
Bv Air-to-plant biotransfer factor ([µg pollutant/g plant tissueDW]/[µg pollutant/g air])
7.3E+1 Calc
RCF Root concentration factor ([µg pollutant/g plant tissueFW]/[µg pollutant/g soil water])
3.8E+1 Calc
BCFPlant-Soil Plant-soil bioconcentration factor ([µg pollutant/g planttissue DW]/[µg pollutant/g soil]) 1.9E-1
Calc
Babeef/Bapork
Biotransfer factor for beef (d/kg)1 2.6E-4 Calc
Bamilk Biotransfer factor for milk (d/kg) 8.1E-5 Calc
Skin permeability constant for water (cm/hr) 1E-1
BAFFish Fish bioaccumulation factor (L/kg) 5.3E+2 Thomann,89
BCFFish Fish bioconcentration factor (L/kg) N/A
Other Parameters
Fw Fraction of wet deposition that adheres to plant surfaces(dimensionless)
Health Benchmarks
CSF Cancer slope factor (per mg/kg/day) N/A
RfD Reference dose (mg/kg/d) 1E-2 IRIS
URF Unit risk factor (per µg/m3) N/A
RfC Reference concentration (mg/m3) 2E-1 HEAST

Appendix D
D-35
Table D-33. Chemical-Specific Inputs for Xylenes (total)
Parameter Definition Value Ref
Chemical/Physical Properties
Fv Fraction of pollutant air concentration present in the vapor phase(dimensionless)
1
Koc Soil adsorption coefficient (m/g) 1307
Kow Octanol-water partition coefficient (unitless) 1.5E+3
VP Vapor pressure (atm) 1.06E-2
SOl Water solubility (mL/g) 1.86E+2
MW Molecular weight (g/mol) 106.17
H Henry's law constant (atm-m3/mol) 6.04E-3 Calc
Da Diffusivity in air (cm2/s) 7.1E-2 Water8
Dw Diffusivity in water (cm2/s) 9.3E-6 Water8
8 GW degradation rate (1/yr) 0
Transfer Factors
Bv Air-to-plant biotransfer factor ([µg pollutant/g plant tissue DW]/[µgpollutant/g air])
2.2E+0 Calc
RCF Root concentration factor ([µg pollutant/g plant tissue FW]/[µgpollutant/g soil water])
9.2E+0 Calc
BCFPlant-Soil Plant-soil bioconcentration factor ([µg pollutant/g plant tissueDW]/[µg pollutant/g soil]) 5.7E-1
Calc
Babeef/Bapork Biotransfer factor for beef (d/kg)1 3.7E-5 Calc
Bamilk Biotransfer factor for milk (d/kg) 1.2E-5 Calc
Skin permeability constant for water (cm/hr) 7.6E-2
BAFFish Fish bioaccumulation factor (L/kg) N/A
BCFFish Fish bioconcentration factor (L/kg) 8.4E+1 EPA,91
Other Parameters
Fw Fraction of wet deposition that adheres to plant surfaces(dimensionless)
Health Benchmarks
CSF Cancer slope factor (per mg/kg/day) N/A
RfD Reference dose (mg/kg/d) 2E+0 IRIS
URF Unit risk factor (per µg/m3) N/A
RfC Reference concentration (mg/m3) 4.3E-1 ATSDR

Appendix D
D-36
ReferencesAll references cited in this appendix are cited as secondary sources from the following
sources:
U.S. EPA (Environmental Protection Agency). 1997f. Health Effects Assessment SummaryTables. FY 1997 Update. Office of Emergency and Remedial Response and Office ofResearch and Development, Washington, DC.
U.S. EPA (Environmental Protection Agency). 1998b. Integrated Risk Information System(IRIS) Database. Cincinnati, OH. August.

Appendix E
Toxicological Profiles
Relevant data for some constituents are not included at presentbecause of business confidentiality concerns

Appendix E
E-3
AcetoneBenchmark Status: Acetone has a reference dose (RfD) in the Integrated Risk
Information System (IRIS) database but does not have a reference concentration (RfC), inhalationunit risk, oral cancer slope factor (CSF), or inhalation CSF. The RfD is 0.1 mg/kg-d.
The RfD was based on an oral no observed effects level (NOEL) of 100 mg/kg-d from asubchronic study (90 days) using rats (U.S. EPA, 1986). The NOEL was based on daily gavageof acetone. An uncertainty factor of 1,000 was applied (100 for inter- and intraspeciesextrapolation, and 10 to extrapolate from subchronic to chronic exposure). Confidence in thestudy used to develop the RfD was medium, but low confidence was assigned to the overalldatabase and the RfD estimate.
Acetone is not classifiable as to human carcinogenicity (Group D) based on the lack ofhuman data and inadequate data from animal bioassays.

Appendix E
E-4
AnilineBenchmark Status: Aniline has an RfC and oral CSF in the IRIS database but does not
have an RfD, inhalation unit risk factor, or inhalation CSF. The RfC is 1E-3 mg/m3, and the oralCSF is 5.7E-3(mg/kg-d)-1.
The RfC was based on an inhalation NOAEL of 19 mg/m3 (5 ppm) from a subchronicstudy (20 to 26 weeks) using rats, guinea pigs, and mice (Oberst et al., 1956). The adjustedNOAEL of 3.4 mg/m3 was based on exposure for 6 hours per day and 5 days per week. Anuncertainty factor of 3,000 was applied (10 for sensitive human subpopulations, 10 forinterspecies variation, 10 for use of a subchronic study, and 3 for a lack of reproductive studies). The modifying factor was 1. Confidence in the study used to develop the RfC and in the overalldatabase were low; consequently, low confidence was assigned to the RfC estimate.
Aniline is classified as a probable human carcinogen (Group B2) based on inadequate datain humans and sufficient evidence in animals. The CSF was based on a 2-year study using CD-Frats. Aniline hydrochloride was given in the diet at dose levels of 0, 200, 600, and 2,000 ppm(CIIT, 1982). An increased incidence of splenic sarcomas was seen in male rats receiving the highdose. The CSF was derived using the linearized multistage procedure and correcting fordifferences in the molecular weight of aniline and aniline hydrochloride. The linearized multistageprocedure may not be the most appropriate procedure for derivation of the slope factor sincetumor incidence may be related to hemosiderosis and the subsequent fibrotic response in thespleen.

Appendix E
E-5
AzobenzeneBenchmark Status: Azobenzene has an oral CSF and an inhalation unit risk factor in the
IRIS database but does not have an RfD, RfC, or inhalation CSF. The oral CSF is1.1E-1(mg/kg-d)-1, and the inhalation unit risk factor is 3.1E-5µg/m3. Azobenzene has aninhalation CSF in the Health Effects Assessment Summary Tables (HEAST) of 1.1E-01(mg/kg-d)-
1.
Azobenzene is classified as a probable human carcinogen (Group B2) based on its abilityto induce invasive sarcomas in the spleen and other abdominal organs in rats following dietaryadministration. Also, it is genotoxic and may be converted to benzidine, a known humancarcinogen, under the acidic conditions of the stomach. The oral CSF was based on a 105 to 106-week dietary study using F344 rats and B6C3F1 mice (NCI, 1979). Azobenzene wasadministered in feed at dose levels of 200 or 400 ppm (rats and male mice) and 208 or 505 ppm(female mice). An increased incidence of various types of sarcomas in the spleen and otherabdominal organs was observed in rats of both sexes. The CSF was derived using the linearizedmultistage procedure.
The inhalation unit risk factor was calculated from the oral data listed above using thelinearized multistage procedure. The unit risk should not be used if the air concentration exceeds300 µg/m3 since above this concentration the unit risk may not be appropriate.
The inhalation CSF was based on the same study as listed above for the oral CSF. Nofurther information was given.
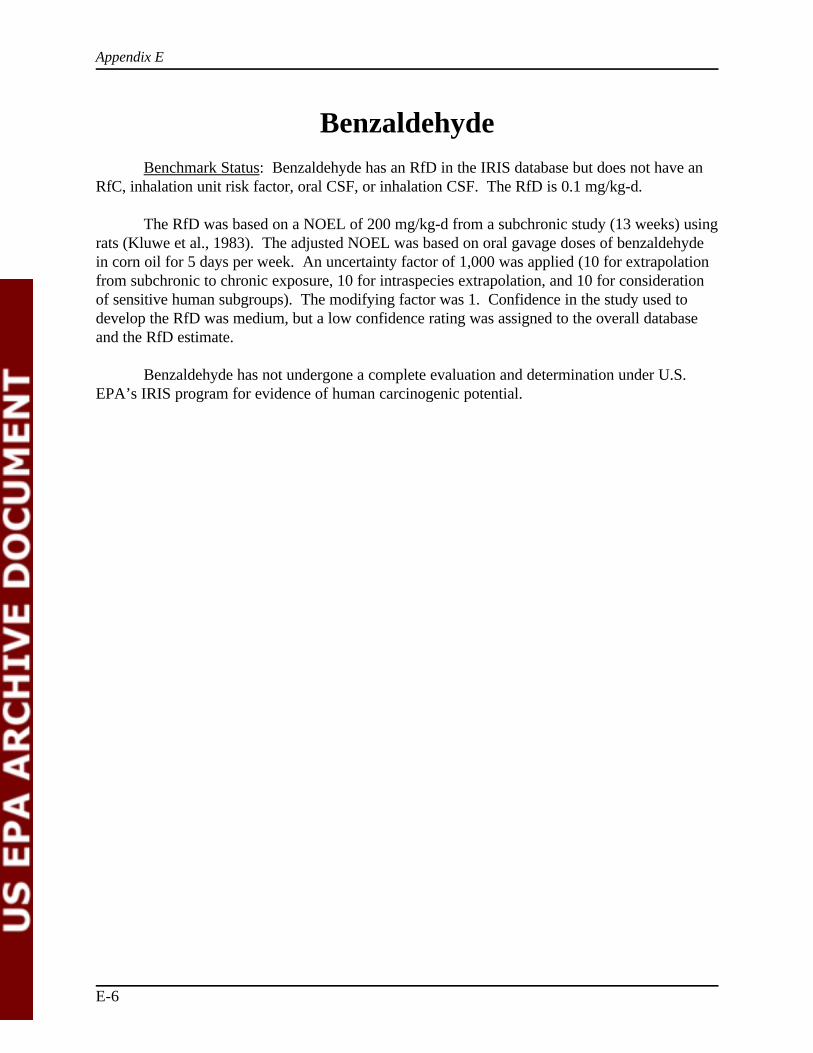
Appendix E
E-6
BenzaldehydeBenchmark Status: Benzaldehyde has an RfD in the IRIS database but does not have an
RfC, inhalation unit risk factor, oral CSF, or inhalation CSF. The RfD is 0.1 mg/kg-d.
The RfD was based on a NOEL of 200 mg/kg-d from a subchronic study (13 weeks) usingrats (Kluwe et al., 1983). The adjusted NOEL was based on oral gavage doses of benzaldehydein corn oil for 5 days per week. An uncertainty factor of 1,000 was applied (10 for extrapolationfrom subchronic to chronic exposure, 10 for intraspecies extrapolation, and 10 for considerationof sensitive human subgroups). The modifying factor was 1. Confidence in the study used todevelop the RfD was medium, but a low confidence rating was assigned to the overall databaseand the RfD estimate.
Benzaldehyde has not undergone a complete evaluation and determination under U.S.EPA’s IRIS program for evidence of human carcinogenic potential.

Appendix E
E-7
BenzeneBenchmark Status: Benzene has an oral CSF in the IRIS database but does not have an
RfC, RfD, inhalation unit risk factor, or inhalation CSF. The oral CSF is 0.029(mg/kg-d)-1.Benzene has an inhalation CSF in HEAST of 0.029(mg/kg-d)-1.
Benzene is classified as a known human carcinogen (Group A) based on convincinghuman evidence as well as supporting evidence from animal studies. The oral CSF was based oninhalation occupational exposure data (Rinsky et al., 1981; Ott et al., 1978; Wong et al., 1983). The exposures to benzene varied with the studies. An increased evidence of leukemia wasobserved in the human workers exposed to benzene. The oral CSF was extrapolated using a one-hit (pooled data) process. The inhalation CSF was based on the same studies listed above for theoral CSF derivation.

Appendix E
E-8
BenzidineBenchmark Status: Benzidine has an RfD, inhalation unit risk factor, inhalation CSF, and
oral CSF in the IRIS database but does not have an RfC. The RfD is 0.003 mg/kg-d, theinhalation unit risk factor is 0.067µg/m3, the inhalation CSF is 230(mg/kg-d)-1, and the oral CSF is230(mg/kg-d)-1.
The RfD was based on an oral LOAEL of 2.7 mg/kg-d from a chronic study (33 months)using mice (Littlefield et al., 1983). The LOAEL was based on daily exposure to benzidine in drinking water. An uncertainty factor of 1,000 was applied (10 for the extrapolation of doselevels from laboratory animals to humans, 10 for the threshold for sensitive humans, and 10 forthe estimation of a NOAEL from a LOAEL). The modifying factor was 1. Confidence in thestudy used to develop the RfD was medium; consequently, a medium confidence rating wasassigned to both the overall database and the RfD estimate.
Benzidine is classified as a human carcinogen (Group A) based on increased incidence ofbladder cancer and bladder cancer-related deaths in exposed workers. The inhalation CSF wasbased on an occupational exposure of humans to benzidine over a mean time period of 11.46years (Zavon, 1973). An increased incidence of bladder tumors was observed. The inhalationCSF was derived using a model taking into account observed tumor incidence, daily lifetimeexposure, and average human life span in the U.S.
The inhalation unit risk factor was derived using a one-hit time factor using the data fromthe Zavon (1973) study. The inhalation unit risk should not be used if the air concentrationexceeds 0.2 µg/m3 because above this concentration the slope factor may differ from that stated.
The oral CSF was derived using a one-hit time factor using the data from the Zavon(1973) study.

Appendix E
E-9
Bis(2-Ethylhexyl) PhthalateBenchmark Status: Bis(2-ethylhexyl) phthalate has an RfD and an oral CSF in the IRIS
database but does not have an RfC, inhalation unit risk factor, or inhalation CSF. The RfD is 0.02mg/kg-d, and the oral CSF is 0.014(mg/kg-d)-1.
The RfD was based on a LOAEL of 19 mg/kg-d from a chronic study (1 year) usingguinea pigs (Carpenter et al., 1953). The LOAEL was based on daily administration of bis(2-ethylhexyl) phthalate in the feed. An uncertainty factor of 1,000 was applied (10 for interspeciesvariation, 10 for protection of sensitive human subpopulations, and 10 because the study used waslonger than subchronic but less than lifetime and the effect was considered minimally adverse). The modifying factor was 1. Confidence in the study used to develop the RfD, the overalldatabase, and the RfC estimate was medium.
Bis(2-ethylhexyl) phthalate is classified as a probable human carcinogen (Group B2) basedon dose-related increases in liver tumor responses in rats and mice of both sexes. The oral CSFwas based on a 103-week study using Fisher 344 rats and B6C3F1 mice. Bis(2-ethylhexyl)phthalate was given in the diet at dose levels of 0, 6,000, or 12,000 ppm for rats and 0, 3,000, or6,000 ppm for mice (NTP, 1982). An increased incidence of hepatocellular carcinomas andadenomas was observed in female rats and mice of both sexes. The oral CSF was derived usingthe linearized multistage procedure.

Appendix E
E-10
BromodichloromethaneBenchmark Status: Bromodichloromethane has an RfD and oral CSF in the IRIS
database but does not have an RfC, inhalation unit risk factor, or inhalation CSF. The RfD is 0.02mg/kg-d, and the oral CSF is 0.062/mg/kg-d.
The RfD was based on a LOAEL of 17.9 mg/kg-d from a chronic study (102 weeks) usingF344/N rats and B6C3F1 mice (NTP, 1986). The adjusted LOAEL of 17.9 mg/kg-d was basedon a gavage dose of bromodichloromethane in corn oil 5 days per week. An uncertainty factor of1,000 was applied to the LOAEL (100 for extrapolation from animal data and for protection ofsensitive human subpopulations, and 10 for basing the RfD on a LOAEL and to account fordatabase deficiencies). The modifying factor was 1. Confidence in the study used to develop theRfD was medium; consequently, a medium confidence rating was assigned to both the overalldatabase and the RfD estimate.
Bromodichloromethane is classified as a probable human carcinogen (Group B2) based oninadequate human data and sufficient evidence of carcinogenicity in two animal species (mice andrats). The oral CSF was based on a 102-week study using F344/N rats and B6C3F1 mice. Thetest animals were exposed by gavage to bromodichloromethane in corn oil at dose levels of 0, 50,or 100 mg/kg-d (rats) or 0, 25, or 50 mg/kg-d (mice) 5 days per week (NTP, 1987). Anincreased incidence of kidney tubular cell adenoma and adenocarcinomas was observed in malemice. The oral CSF was derived using the linearized multistage procedure.

Appendix E
E-11
p-ChloroanilineBenchmark Status: p-Chloroaniline has an RfD in the IRIS database but does not have an
RfC, inhalation unit risk factor, oral CSF, or inhalation CSF. The RfD is 0.004 mg/kg-d.
The RfD was based on a LOAEL of 12.5 mg/kg-d from a chronic study (78 weeks) usingrats (NCI, 1979). The LOAEL was based on daily doses of p-chloroaniline in their diet. Anuncertainty factor of 3,000 was applied (10 to extrapolate from a LOAEL to a NOEL, 10 toextrapolate from rats to humans, 10 to protect sensitive humans, and 3 for lack of supportingreproductive and other toxicity data). The modifying factor was 1. Confidence in the study usedto develop the RfD was low; consequently, a low confidence rating was assigned to the overalldatabase and the RfD estimate.
p-Chloroaniline has not undergone a complete evaluation and determination under U.S.EPA’s IRIS program for evidence of human carcinogenic potential.

Appendix E
E-12
ChlorobenzeneBenchmark Status: Chlorobenzene has an RfD in the IRIS database but does not have an
RfC, inhalation unit risk factor, oral CSF, or inhalation CSF. The RfD is 0.02 mg/kg-d.Chlorobenzene has an RfC in HEAST of 0.02 mg/m3.
The RfD was based on a NOAEL of 27.25 mg/kg-d from a subchronic study (13 weeks)using dogs (Monsanto Company, 1967a; Knapp et al., 1971). The adjusted NOAEL was 19mg/kg-d based on administration of chlorobenzene in capsule form for 5 days per week. Anuncertainty factor of 1,000 was applied to the NOAEL of 19 mg/kg-d (10 for the extrapolation ofdose levels from laboratory animals to humans, 10 for the threshold for sensitive humans, and 10for the effect of duration when extrapolating from subchronic to chronic exposure). Themodifying factor was 1. Confidence in the study used to develop the RfD, the overall database,and the RfD estimate was medium.
The RfC was based on a LOAEL of 75 ppm from a subchronic study (120 days) using rats(Dilley, 1977). The LOAEL was based on intermittent inhalation of chlorobenzene vapor. Anuncertainty factor of 10,000 was applied, but no further explanation was given. The chronic RfCvalue was derived from methodology that is not current with the interim inhalation methodologyused by the RfD/RfC work group.
Chlorobenzene is not classifiable as to human carcinogenicity (Group D) based on no dataconcerning carcinogenicity in human; inadequate data for animals; and predominantly negativegenetic toxicity data in bacterial, yeast, and mouse lymphoma cells.

Appendix E
E-13
ChloroformBenchmark Status: Chloroform has an RfD, inhalation unit risk factor, and oral CSF in
the IRIS database but does not have an RfC or inhalation CSF. The RfD is 1E-2 mg/kg-d, the inhalation unit risk factor is 2.3E-5 µg/m3, and the CSF is 6.1E-3(mg/kg-d)-1. Chloroform has aninhalation CSF in HEAST of 8.1E-2(mg/kg-d)-1.
The RfD was based on a LOAEL of 15 mg/kg-d from a chronic study (7.5 years) usingdogs (Heywood et al., 1979). The adjusted LOAEL was 12.9 mg/kg-d based on an oral dose ofchloroform in a toothpaste base given 6 days a week. An uncertainty factor of 1,000 was appliedto the LOAEL of 12.9 mg/kg-d (10 for the interspecies conversion, 10 for the protection ofsensitive human subpopulations, and 10 for the concern that the effect seen was a LOAEL and nota NOEL). The modifying factor was 1. Confidence in the study used to develop the RfD wasmedium, and a medium-to-low confidence rating was assigned to both the overall database andthe RfD estimate.
Chloroform is classified as a probable human carcinogen (Group B2) based on increasedincidence of several tumor types in rats and mice. The inhalation unit risk factor was based on a78-week study using Osborne-Mendel rats and B6C3F1 mice. The test animals were exposed bygavage to chloroform in corn oil at dose levels of 90 or 125 mg/kg-d (male rats), 90 or 180mg/kg-d (female rats), 150 or 300 mg/kg-d (male mice), or 250 or 500 mg/kg-d (female mice) 5times per week (NCI, 1976). An increased incidence of kidney epithelial tumors was observed inmale rats and significant increases in hepatocellular carcinomas in mice of both sexes. Theinhalation unit risk factor was derived using the linearized multistage procedure. The unit riskshould not be used if the air concentration exceeds 400 µg/m3 since above this concentration theunit risk may not be appropriate.
The oral CSF was based on a 104-week study using Osborne-Mendel rats and B6C3F1mice. The test animals were administered chloroform in drinking water at concentrations of 200,400, 900, or 1,800 mg/L (Jorgenson et al., 1985). A significant increase in renal tumors wasobserved in rats administered the highest dose level. The oral CSF was derived using a linearizedmultistage procedure.
The inhalation CSF was based on the 78-week study using B6C3F1 mice (NCI, 1976). The inhalation CSF was based on route-to-route extrapolation.

Appendix E
E-14
p-CresolBenchmark Status: p-Cresol does not have an RfD, RfC, inhalation unit risk factor, oral
CSF, or inhalation CSF in the IRIS database. An RfD was established in the IRIS database, but itwas withdrawn in 1991. p-Cresol has an RfD in HEAST of 0.005 mg/kg-d.
The RfD was based on a NOAEL of 5 mg/kg-d from a developmental study (days 6-18 ofgestation) using rabbits (CMA, 1988). The NOAEL was based on daily oral gavage of p-cresol. An uncertainty factor of 1,000 was applied. No further information was provided.
p-Cresol is classified as a possible human carcinogen (Group C) based on an increasedincidence of skin papillomas in mice in an initiation-promotion study.

Appendix E
E-15
1,2-DichlorobenzeneBenchmark Status: 1,2-Dichlorobenzene has an RfD in the IRIS database but does not
have an RfC, inhalation unit risk factor, oral CSF, or inhalation CSF. The RfD is 0.09 mg/kg-d. 1,2-Dichlorobenzene has an RfC in the HEAST of 0.2 mg/m3.
The RfD was based on a NOAEL of 120 mg/kg-d from a chronic study (2 years) usingrats (NTP, 1985). The adjusted NOAEL of 85.7 mg/kg-d was based on gavage of 1,2-dichlorobenzene in corn oil 5 days per week. An uncertainty factor of 1,000 was applied (10 forthe extrapolation of dose levels from laboratory animals to humans, 10 for the threshold forsensitive humans, and 10 because of the lack of studies assessing reproductive effects andadequate chronic toxicity in a second species). The modifying factor was 1. Confidence in thestudy used to develop the RfD was medium, but a low confidence rating was assigned to both theoverall database and the RfD estimate.
The chronic RfC was based on a NOAEL of 49 ppm from a subchronic study (up to 7months) using rats (Hollingsworth et al., 1958). The NOAEL was based on intermittentinhalation exposure to 1,2-dichlorobenzene. An uncertainty factor of 1,000 was applied, but nofurther information was given.
1,2-Dichlorobenzene is not classifiable as to human carcinogenicity (Group D) based onno human data and evidence of both negative and positive trends for carcinogenic responses inrats and mice.

Appendix E
E-16
1,4-DichlorobenzeneBenchmark Status: 1,4-Dichlorobenzene has an RfC in the IRIS database but does not
have an RfD, inhalation unit risk factor, oral CSF, or inhalation CSF. The RfC is 0.8 mg/m3. 1,4-Dichlorobenzene has an oral CSF in HEAST of 0.024(mg/kg-d)-1.
The RfC was based on a NOAEL of 301 mg/m3 from a subchronic multi-generationalstudy using rats (Chlorobenzene Producers Association, 1986). The adjusted NOAEL of 75mg/m3 was based on exposure to 1,4-dichlorobenzene vapor for 6 hours per day and 7 days perweek. An uncertainty factor of 100 was applied (10 to account for sensitive humansubpopulations, 3 for interspecies differences, 3 because the NOAEL was based on a subchronicrather than a chronic study). The modifying factor was 1. Confidence in the study used todevelop the RfC was medium, and a medium confidence rating was assigned to the overalldatabase and the RfC estimate.
1,4-Dichlorobenzene has not undergone a complete evaluation and determination underU.S. EPA’s IRIS program for evidence of human carcinogenic potential; however, HEASTclassifies 1,4-dichlorobenzene as a possible human carcinogen (Group C). The oral CSF wasbased on a 103-week oral gavage study using mice (NTP, 1986). An increased incidence of livertumors was observed in the mice. The oral CSF derived by HEAST is under review and is subjectto change.

Appendix E
E-17
3,3'-DimethoxybenzidineBenchmark Status: 3,3'-Dimethoxybenzidine does not have a profile in the IRIS database.
Benzenethiol has an oral CSF in HEAST but does not have an RfD, RfC, inhalation unit riskfactor, or inhalation CSF. The oral CSF is 0.014(mg/kg-d)-1.
The oral CSF was based on a lifetime exposure study using hamsters (Sellakumar et al.,1969). The hamsters were exposed orally to 3,3'-dimethoxybenzidine through their diet. Anincreased incidence of forestomach papillomas was observed.
3,3'-Dimethoxybenzidine is classified as a probable human carcinogen (Group B2), but nofurther information was available.

Appendix E
E-18
N-N-DimethylanilineBenchmark Status: N-N-Dimethylaniline has an RfD in the IRIS database but does not
have an RfC, inhalation unit risk factor, oral CSF, or inhalation CSF. The RfD is 0.002 mg/kg-d.
The RfD was based on a LOAEL of 31.25 mg/kg-d from a subchronic study (13 weeks)using mice (Abdo et al., 1984). The adjusted LOAEL of 22.32 mg/kg-d was based onadministration of N-N-dimethylaniline in corn oil by gavage 5 days per week. An uncertaintyfactor of 10,000 was applied (10 for interspecies extrapolation, 10 to protect sensitive individuals,10 because the effect level was a LOAEL, and 10 because the study was subchronic). Themodifying factor was 1. Confidence in the study used to develop the RfD was low; consequently,a low confidence rating was also applied to the overall database and the RfD estimate.
N-N-Dimethylaniline has not undergone a complete evaluation and determination underU.S. EPA’s IRIS program for evidence of human carcinogenic potential.

Appendix E
E-19
DiphenylamineBenchmark Status: Diphenylamine has an RfD in the IRIS database but does not have an
RfC, inhalation unit risk factor, oral CSF, or inhalation CSF. The RfD is 0.025 mg/kg-d.
The RfD was based on a NOEL of 2.5 mg/kg-d from a chronic study (2 years) using dogs(Thomas et al., 1967). The NOEL was based on administration of diphenylamine in feed. Anuncertainty factor of 100 was applied (10 each for inter- and intraspecies differences). Themodifying factor was 1. Confidence in the study used to develop the RfD was medium, and aconfidence rating of medium was also applied to the overall database and the RfD estimate.
Information regarding evidence of human carcinogenic potential for diphenylamine is notavailable at this time.

Appendix E
E-20
1,2-DiphenylhydrazineBenchmark Status: 1,2-Diphenylhydrazine has an oral CSF and an inhalation unit risk
factor in the IRIS database but does not have an RfD, RfC, or inhalation CSF. The oral CSF is0.8/mg/kg-d and the inhalation unit risk factor is 0.00022µg/m3. 1,2-Diphenylhydrazine has aninhalation CSF HEAST of 0.8(mg/kg-d)-1.
1,2-Diphenylhydrazine is classified as a probable human carcinogen (Group B2) based onpositive results of studies in both rats and mice. The oral CSF was based on a 78-week dietarystudy using F344 rats and B6C3F1 mice (NCI, 1978). 1,2-Diphenylhydrazine was administered infeed at concentrations of 0.008 or 0.03 percent (male rats), 0.004 or 0.01 percent (female rats),0.008 or 0.04 percent (male mice), or 0.004 and 0.04 percent (female mice). An increasedincidence of hepatocellular carcinomas and neoplastic liver nodules was observed in male rats. Also, increased incidence of neoplastic liver nodules and mammary adenocarcinomas wasobserved in female rats, and increased incidence of hepatocelluar carcinomas was observed infemale mice. The oral CSF was derived using the linearized multistage procedure.
The inhalation unit risk factor was calculated from the oral data listed above using thelinearized multistage procedure. The unit risk factor should not be used if the air concentrationexceeds 50 µg/m3 since above this concentration the unit risk may not be appropriate.
The inhalation CSF was based on the same study as listed above for the oral CSF (NCI,1978), but no further information is available.

Appendix E
E-21
EthylbenzeneBenchmark Status: Ethylbenzene has an RfD and RfC in the IRIS database but does not
have an inhalation unit risk factor, oral CSF, or inhalation CSF. The RfD is 0.1 mg/kg-d, and theRfC is 1 mg/m3.
The RfD was based on a NOEL of 136 mg/kg-d from a subchronic study (182 days) usingrats (Wolf et al., 1956). The adjusted NOEL was 97.1 mg/kg-d based on exposure to gavage ofethylbenzene in olive oil for 5 days per week. An uncertainty factor of 1,000 was applied to theadjusted NOEL (10 for interspecies variability, 10 for intraspecies variability, and 10 forextrapolation of a subchronic effect level to its chronic equivalent). The modifying factor was 1. Confidence in the study used to develop the RfD was low; consequently, a low confidence ratingwas assigned to the overall database and the RfD estimate.
The RfC was based on a NOAEL of 434 mg/m3 from a developmental study (days 1-19 ofgestation) using rats or (days 1-24 of gestation) using rabbits (Andrew et al., 1981; Hardin et al.,1981). The NOAEL was based on inhalation of ethylbenzene vapor for 6 to 7 hours per day and7 days per week. An uncertainty factor of 300 was applied (10 for protection of unusuallysensitive individuals, 3 for interspecies conversion, and 10 to adjust for the absence ofmultigenerational reproductive and chronic studies). The modifying factor was 1. Confidence inthe study used to develop the RfC was low; consequently, a low confidence rating was assignedto the overall database and the RfC estimate.
Ethylbenzene is not classifiable as to human carcinogenicity (Group D) based on lack ofanimal bioassays and human studies.

Appendix E
E-22
FormaldehydeBenchmark Status: Formaldehyde has an RfD and inhalation unit risk factor in the IRIS
database but does not have an RfC, oral CSF, or inhalation CSF. The RfD is 2E-1 mg/kg-d andthe inhalation unit risk factor is 1.3E-5µg/m3. Formaldehyde has an inhalation CSF in HEAST of4.5E-2(mg/kg-d)-1.
The RfD was based on an oral NOAEL of 15 mg/kg-d from a chronic study (2 years)using rats (Til et al., 1989). The NOAEL was based on daily doses in drinking water. Anuncertainty factor of 100 was applied to account for the inter- and intraspecies differences. Themodifying factor was 1. Confidence in the study used to develop the RfD was high, but mediumconfidence was assigned to the overall database and the RfD estimate.
Formaldehyde is classified as a probable human carcinogen (Group B1) based on limitedevidence in humans and sufficient evidence in animals. The inhalation unit risk factor was basedon a 2-year study using Fischer 344 rats and B6C3F1 mice. The test animals were exposed toformaldehyde at dose levels of 0, 2, 5.6, or 14.3 ppm for 6 hours per day and 5 days per week(Kerns et al., 1983). An increased incidence of squamous cell carcincomas was seen in both maleand female rats receiving the high dose. The inhalation unit risk factor was derived using thelinearized multistage procedure. The unit risk should not be used if the air concentration exceeds800 µg/m3 since above this concentration the unit risk may not be appropriate.
The CSF was based on the Kerns et al. (1983) study used by IRIS to calculate theinhalation unit risk factor. The CSF was based on the incidence of nasal cavity tumors in the rats. No other information was given.
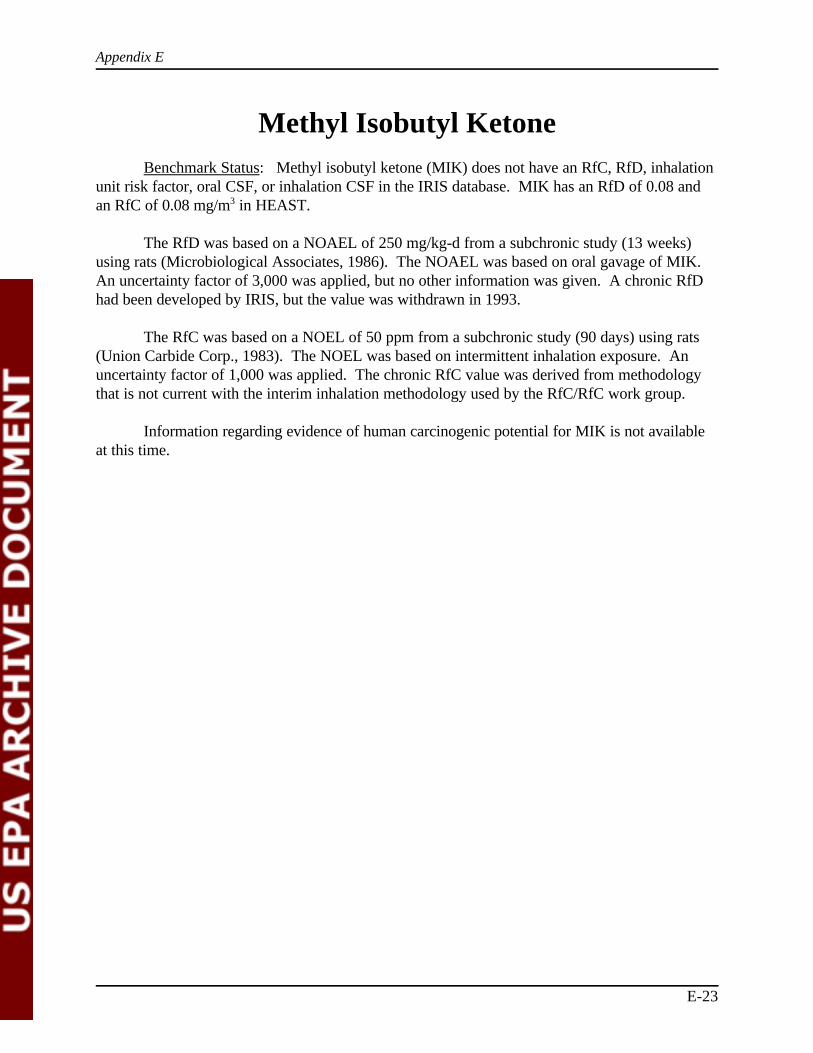
Appendix E
E-23
Methyl Isobutyl KetoneBenchmark Status: Methyl isobutyl ketone (MIK) does not have an RfC, RfD, inhalation
unit risk factor, oral CSF, or inhalation CSF in the IRIS database. MIK has an RfD of 0.08 andan RfC of 0.08 mg/m3 in HEAST.
The RfD was based on a NOAEL of 250 mg/kg-d from a subchronic study (13 weeks)using rats (Microbiological Associates, 1986). The NOAEL was based on oral gavage of MIK. An uncertainty factor of 3,000 was applied, but no other information was given. A chronic RfDhad been developed by IRIS, but the value was withdrawn in 1993.
The RfC was based on a NOEL of 50 ppm from a subchronic study (90 days) using rats(Union Carbide Corp., 1983). The NOEL was based on intermittent inhalation exposure. Anuncertainty factor of 1,000 was applied. The chronic RfC value was derived from methodologythat is not current with the interim inhalation methodology used by the RfC/RfC work group.
Information regarding evidence of human carcinogenic potential for MIK is not availableat this time.
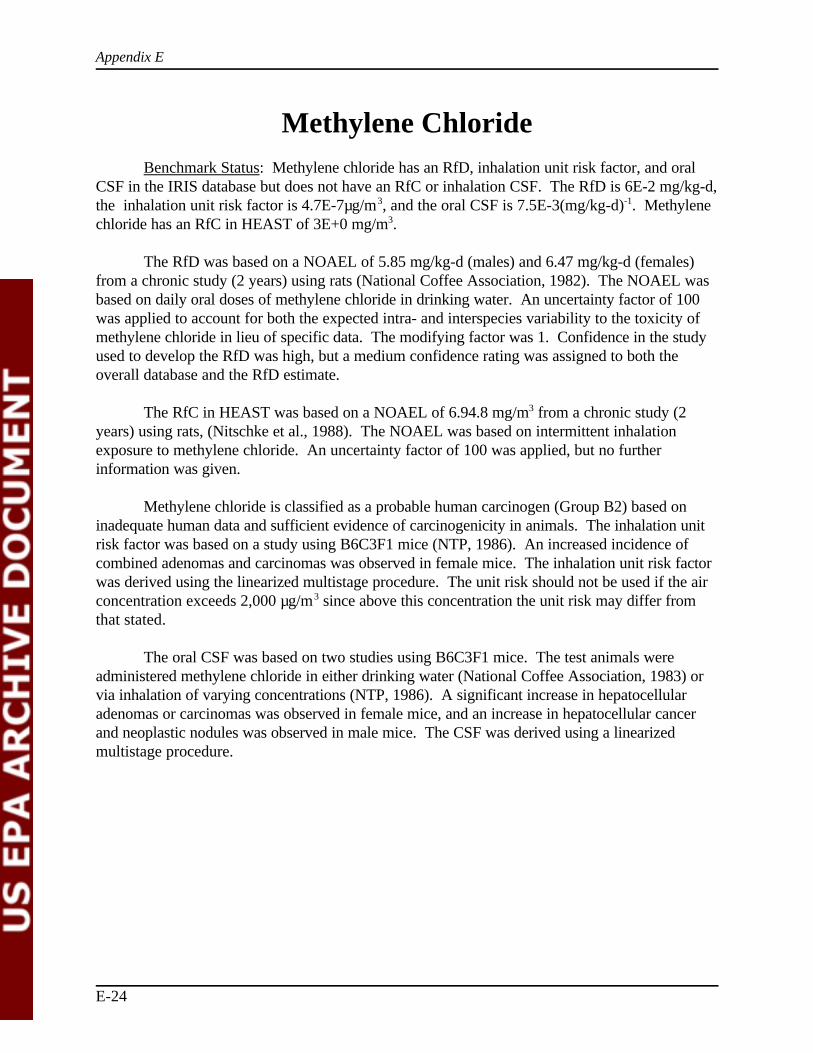
Appendix E
E-24
Methylene ChlorideBenchmark Status: Methylene chloride has an RfD, inhalation unit risk factor, and oral
CSF in the IRIS database but does not have an RfC or inhalation CSF. The RfD is 6E-2 mg/kg-d,the inhalation unit risk factor is 4.7E-7µg/m3, and the oral CSF is 7.5E-3(mg/kg-d)-1. Methylenechloride has an RfC in HEAST of 3E+0 mg/m3.
The RfD was based on a NOAEL of 5.85 mg/kg-d (males) and 6.47 mg/kg-d (females)from a chronic study (2 years) using rats (National Coffee Association, 1982). The NOAEL wasbased on daily oral doses of methylene chloride in drinking water. An uncertainty factor of 100was applied to account for both the expected intra- and interspecies variability to the toxicity ofmethylene chloride in lieu of specific data. The modifying factor was 1. Confidence in the studyused to develop the RfD was high, but a medium confidence rating was assigned to both theoverall database and the RfD estimate.
The RfC in HEAST was based on a NOAEL of 6.94.8 mg/m3 from a chronic study (2years) using rats, (Nitschke et al., 1988). The NOAEL was based on intermittent inhalationexposure to methylene chloride. An uncertainty factor of 100 was applied, but no furtherinformation was given.
Methylene chloride is classified as a probable human carcinogen (Group B2) based oninadequate human data and sufficient evidence of carcinogenicity in animals. The inhalation unitrisk factor was based on a study using B6C3F1 mice (NTP, 1986). An increased incidence ofcombined adenomas and carcinomas was observed in female mice. The inhalation unit risk factorwas derived using the linearized multistage procedure. The unit risk should not be used if the airconcentration exceeds 2,000 µg/m3 since above this concentration the unit risk may differ fromthat stated.
The oral CSF was based on two studies using B6C3F1 mice. The test animals wereadministered methylene chloride in either drinking water (National Coffee Association, 1983) orvia inhalation of varying concentrations (NTP, 1986). A significant increase in hepatocellularadenomas or carcinomas was observed in female mice, and an increase in hepatocellular cancerand neoplastic nodules was observed in male mice. The CSF was derived using a linearizedmultistage procedure.

Appendix E
E-25
NaphthaleneBenchmark Status: Naphthalene has an RfD and an RfC in the IRIS database but does not
have an inhalation unit risk factor, oral CSF, or inhalation CSF. The RfD is 0.02 mg/kg-d and theRfC is 0.003 mg/m3.
The RfD was based on a oral NOAEL of 100 mg/kg-d from a subchronic study (13weeks) using rats (Battelle’s Columbus Laboratories, 1980). The adjusted NOAEL was71 mg/kg-d based on a gavage of naphthalene in corn oil 5 days per week. An uncertainty factorof 3000 was applied to the adjusted NOAEL (10 to extrapolate from rats to humans, 10 for theprotection of sensitive humans; 10 to extrapolate from subchronic to chronic exposure; and 3 fordatabase deficiencies, including the lack of chronic oral exposure studies and two-generationreproductive toxicity studies). The modifying factor was 1. Confidence in the study used todevelop the RfD was high; however, a low confidence rating was assigned to both the overalldatabase and the RfD estimate.
The RfC was based on an adjusted inhalation LOAEL (HEC) of 9.3 mg/m3 from a chronicstudy (103 weeks) using mice. The LOAEL was based on exposure for 6 hours per day and 5days per week. An uncertainty factor of 3,000 was applied (10 to extrapolate from mice tohumans; 10 for the protection of sensitive humans; 10 to extrapolate from LOAEL to a NOAEL;and 3 for database deficiencies, including the lack of a two-generation reproductive toxicity studyand chronic inhalation data for other animal species). The modifying factor was 1. Confidence inthe study used to develop the RfC was medium, but a low to medium confidence rating wasassigned to the overall database, and a medium confidence rating was assigned to the RfCestimate.
Naphthalene is classified as a possible human carcinogen (Group C) based on theinadequate data of carcinogenicity in humans via the oral and inhalation routes and the limitedevidence of carcinogenicity in animals via the inhalation route.

Appendix E
E-26
N-NitrosodiphenylamineBenchmark Status: N-Nitrosodiphenylamine has an oral CSF in the IRIS database but
does not have an RfD, RfC, inhalation unit risk, or inhalation CSF. The oral CSF is0.0049(mg/kg-d)-1.
N-Nitrosodiphenylamine is classified as a probable human carcinogen (Group B2) basedon increased incidence of bladder tumors in male and female rats, increased incidence of reticulumcell sarcomas in mice, and its structural relationship to carcinogenic nitrosamines. The oral CSFwas based on a drinking water study using F344 rats (NCI, 1979). N-Nitrosodiphenylamine wasadministered in the diet at dose levels of 0, 1,000, or 4,000 ppm. An increased incidence ofurinary bladder transitional cell carcinomas was observed in female rats. The CSF was derivedusing the linearized multistage procedure.

Appendix E
E-27
PhenolBenchmark Status: Phenol has an RfD in the IRIS database but does not have an RfC,
inhalation unit risk factor, oral CSF, or inhalation CSF. The RfD is 0.6 mg/kg-d. EPA developeda provisional RfC of 0.006 mg/m3 for the final listing rule for solvents (63 FR 64376).
The RfD was based on a NOAEL of 60 mg/kg-d from a developmental study using rats(NTP, 1983). The NOAEL was based on administration of phenol by gavage on gestational days6 through 15. An uncertainty factor of 100 was applied (10 for interspecies extrapolation and 10for sensitive human populations). The modifying factor was 1. Confidence in the study used todevelop the RfD and the RfD estimate was low; however, a confidence rating of medium wasapplied to the overall database.
The RfC is based on a NOAEL of 5 ppm (19 mg/m3) in rats, mice, and monkeys (Sandage,1961). Sandage (1961) exposed Sprague-Dawley rats, mice, and rhesus monkeys continuously to0 or 5 ppm phenol (19 mg/m3) for 90 days. No significant effects in body weight, hematologicalor biochemical tests (i.e., liver or kidney function), organ pathology (lungs, liver, kidneys), or thestress test were seen in any of the species when compared to controls; no deaths occurred. Anuncertainty factor of 3,000 (10 each for extrapolating from animals to humans, human variability,and use of subchronic data, and 3 to account for an incomplete database) was applied and amodifying factor of 1 was used.
Phenol is not classifiable as to human carcinogenicity (Group D) based on no dataconcerning carcinogenicity in humans and inadequate data for animals.

Appendix E
E-28
o-PhenylenediamineBenchmark Status: o-Phenylenediamine does not have a profile in the IRIS database.
o-Phenylenediamine has an oral CSF in HEAST but does not have an RfD, RfC, inhalation unitrisk factor, or inhalation CSF. The oral CSF is 0.047/mg/kg-d.
o-Phenylenediamine is classified as a probable human carcinogen (Group B2). The oralCSF was based on a 548-day study using rats (Weisburger et al., 1978). The test animals wereexposed to o-phenylenediamine dihydrochloride in their diet. An increased incidence of livertumors was observed in rats treated with o-phenylenediamine dihydrochloride.

Appendix E
E-29
p-PhenylenediamineBenchmark Status: p-Phenylenediamine does not have a profile in the IRIS database. p-
Phenylenediamine has an RfD in HEAST but does not have an RfC, inhalation unit risk factor,oral CSF, or inhalation CSF. The RfD is 0.19 mg/kg-d.
The RfD was based on a NOAEL of 18.7 mg/kg-d from a chronic study (2 years) usingrats (EPA, 1985). The NOAEL was based on administration of p-phenylenediamine in the diet. An uncertainty factor of 100 was applied to the NOAEL.
No information is available regarding the potential carcinogenicity of p-phenylenediamineto either humans or animals.

Appendix E
E-30
PyridineBenchmark Status: Pyridine has an RfD in the IRIS database but does not have an RfC,
inhalation unit risk factor, oral CSF, or inhalation CSF. The RfD is 0.001 mg/kg-d.
The RfD was based on a NOAEL of 1 mg/kg-d from a subchronic study (90 days) usingrats (EPA, 1986). The NOAEL was based on daily gavage of varying concentrations of pyridine. An uncertainty factor of 1000 was applied (10 each for interspecies and intraspecies variabilityand 10 for extrapolation from a subchronic to a chronic effect level). The modifying factor was 1. Confidence is the study used to develop the RfC, the overall database, and the RfC estimate wasmedium.
Pyridine has not undergone a complete evaluation and determination under U.S. EPA’sIRIS program for evidence of human carcinogenic potential.

Appendix E
E-31
TolueneBenchmark Status: Toluene has an RfD and RfC in the IRIS database but does not have
an inhalation unit risk factor, oral CSF, or inhalation CSF. The RfD is 0.2 mg/kg-d, and the RfCis 0.4 mg/m3.
The RfD was based on a NOAEL of 312 mg/kg-d from a subchronic study (13 weeks)using rats (NTP, 1989). The adjusted NOAEL was 223 mg/kg-d based on gavage exposure totoluene in corn oil for 5 days per week. An uncertainty factor of 1,000 was applied (10 for inter-and intraspecies extrapolations, 10 for subchronic-to-chronic extrapolation, and 10 for limitedreproductive and developmental toxicity data). The modifying factor was 1. Confidence in thestudy used to develop the RfD was high, but a medium confidence rating was assigned to theoverall database and the RfD estimate.
The RfC was based on LOAELs from two studies. The first LOAEL was 332 mg/m3 from a chronic occupational exposure study of females. The adjusted LOAEL of 119 mg/m3 wasbased on inhalation of toluene vapor for an 8-hour time-weighted average per day and 5 days perweek. The second LOAEL was 2,261 mg/m3 from a chronic study (2 years) using rats. Theadjusted LOAEL was 437 mg/m3, and the LOAEL (HEC or human equivalent concentration) of79 mg/m3 was based on inhalation of toluene vapor for 6.5 hours per day and 5 days per week. This LOAEL was calculated for a gas:respiratory effect in the extrathoracic region. Anuncertainty factor of 300 was applied (10 for the intraspecies variability, 10 for the use of aLOAEL, and 3 for database deficiencies). The modifying factor was 1. Confidence in the studiesused to develop the RfC, the overall database, and the RfC estimate was medium.
Toluene is not classifiable as to human carcinogenicity (Group D) based on no human dataand inadequate animal data.

Appendix E
E-32
o-ToluidineBenchmark Status: o-Toluidine does not have a profile in the IRIS database.
o-Toluidine has an oral CSF in HEAST, but does not have an RfD, RfC, inhalation unit riskfactor, or inhalation CSF. The oral CSF is 0.24(mg/kg-d)-1.
o-Toluidine is classified as a probable human carcinogen (Group B2). The oral CSF wasbased on a 93-week study using rats (Hecht et al., 1982). The test animals were exposed orally too-toluidine in their diet. An increased incidence of skin fibromas was observed in treated rats.

Appendix E
E-33
p-ToluidineBenchmark Status: p-Toluidine does not have a profile in the IRIS database. p-Toluidine
has an oral CSF in HEAST but does not have an RfD, RfC, inhalation unit risk factor, orinhalation CSF. The oral CSF is 0.19(mg/kg-d)-1.
p-Toluidine is classified as a possible human carcinogen (Group C). The oral CSF wasbased on a 18-month study using mice (Weisburger et al., 1978). The test animals wereadministered p-toluidine in their diet. An increase in liver tumors was observed in the mice. Nofurther information was provided.

Appendix E
E-34
1,2,4-TrichlorobenzeneBenchmark Status: 1,2,4-Trichlorobenzene has an RfD in the IRIS database of
0.01 mg/kg-d but does not have an RfC, inhalation unit risk factor, oral CSF, or inhalation CSF. The 1,2,4-trichlorobenzene RfC in HEAST is 0.2 mg/m3.
The RfD was based on a NOAEL of 14.8 mg/kg-d from a chronic multigeneration studyusing rats (Robinson et al., 1981). The NOAEL was based on exposure to 1,2,4-trichlorobenzene administered in the drinking water. An uncertainty factor of 1,000 was applied (10 forextrapolation from laboratory studies to humans, 10 for sensitive human subpopulations, and 10for a lack of chronic studies). The modifying factor was 1. Confidence in the study used todevelop the RfD, the overall database, and the RfD estimate was medium.
The RfC was based on a NOAEL of 104 ppm from a subchronic study (6 and 26 weeks)using rats, rabbits, dogs, and monkeys (Kociba et al., 1981; Coate et al., 1977; Cote et al., 1988). The NOAEL was based on inhalation of 1,2,4-trichlorobenzene. An uncertainty factor of 1,000was applied.
1,2,4-Trichlorobenzene is not classifiable as to human carcinogenicity (Group D) based oninadequate studies for drawing conclusions as to carcinogenicity in humans.

Appendix E
E-35
Xylenes (Total)Benchmark Status: Total xylenes have an RfD in the IRIS database but do not have an
RfC, inhalation unit risk factor, oral CSF, or inhalation CSF. The RfD is 2 mg/kg-d.
The RfD was based on a NOAEL of 250 mg/kg-d from a chronic study (103 weeks) usingrats (NTP, 1986). The adjusted NOAEL was 179 mg/kg-d based on an oral gavage of a xylenemixture for 5 days per week. An uncertainty factor of 100 was applied to the adjusted NOAEL(10 for species-to-species extrapolation and 10 to protect sensitive individuals). The modifyingfactor was 1. Confidence in the study used to develop the RfD was medium; consequently, amedium confidence rating was assigned to both the overall database and the RfD estimate.
Total xylenes are not classifiable as to human carcinogenicity (Group D) based on the factthat orally administered technical xylene mixtures did not result in significant increases inincidences in tumor responses in rats or mice of both sexes.

Appendix E
E-36
ReferencesAll references cited in this appendix are cited as secondary sources from the following
sources (with one exception for phenol):
U.S. EPA (Environmental Protection Agency). 1997f. Health Effects Assessment SummaryTables. FY 1997 Update. Office of Emergency and Remedial Response and Office ofResearch and Development, Washington, DC.
U.S. EPA (Environmental Protection Agency). 1998b. Integrated Risk Information System(IRIS) Database. Cincinnati, OH. August.
Exception:
Sandage, C. 1961. As cited in Tolerance Criteria for Continuous Inhalation Exposure to ToxicMaterial. I. Effects on Animals of 90-Day Exposure to Phenol, CCl4 and a Mixture ofIndole, Skatole, H2S and Methyl Mercaptan. Wright-Patterson Air Force Base, OH. U.S.Air Force Systems Command, Aeronautical Systems Division, ASD technical report 61-519(I).

Appendix F
Results

F-2
Appendix E
Table F-1. Risk-Based Waste Concentrations for TAM Sludge Waste (mg/kg)*
ChemicalCAS
NumberGroup
Number
90% Waste Concentration 95% Waste ConcentrationDeterministic
WasteConcentration
(mg/kg)Concentration
(mg/kg) Receptor PathwayConcentration
(mg/kg) Receptor Pathway1,2-Diphenylhydrazine 122667 4 31 Adult Oral 16 Adult Oral 11Acetone 67641 1 3333 Child Oral 2000 Child Oral 5500Aniline 62533 2 17 Adult/Child Inhalation 11 Adult/Child Inhalation 18Azobenzene 103333 4 716 Adult Oral 360 Adult Oral 257Benzaldehyde 100527 2 5000 Child Oral 2500 Child Oral 3800Benzene 71432 2 365 Child Inhalation 167 Adult/Child Inhalation 97Benzidine 92875 2 0.03 Adult Oral 0.01 Adult Oral 0.01Bis(2-ethylhexyl)phthalate 117817 5 NA NA NA NA NA NA 120000Bromodichloromethane 75274 6 156 Adult/Child Inhalation 70 Adult Inhalation 46Chloroaniline, p- 106478 2 250 Child Oral 143 Child Oral 160Chlorobenzene 108907 3 36 Adult/Child Inhalation 17 Adult/Child Inhalation 24Chloroform 67663 2 102 Child Inhalation 47 Adult/Child Inhalation 27Cresol, p- 106445 2 333 Child Oral 200 Child Oral 230Dichlorobenzene, 1,2- 95501 4 1109 Adult/Child Inhalation 665 Adult/Child Inhalation 708Dichlorobenzene, 1,4- 106467 4 2607 Adult Oral 1276 Adult Oral 935Dimethoxybenzidine, 3,3'- 119904 2 518 Adult Oral 238 Adult Oral 140Diphenylamine 122394 4 26524 Adult Oral 12352 Adult Oral 18000Ethylbenzene 100414 3 3429 Adult/Child Inhalation 1664 Adult/Child Inhalation 2200Formaldehyde 50000 1 7000 Child Oral 2500 Child Oral 7143Methyl isobutyl ketone 108101 2 42 Adult/Child Inhalation 27 Adult/Child Inhalation 40Methylene chloride 75092 6 927 Adult Oral 414 Adult Oral 325Naphthalene 91203 4 17 Adult/Child Inhalation 9 Adult/Child Inhalation 40N-N-Dimethylaniline 121697 2 300 Child Oral 143 Child Oral 167N-nitrosodiphenylamine 86306 4 7393 Adult Oral 3686 Adult Oral 2657Phenol 108952 2 833 Adult/Child Inhalation 416 Adult/Child InhalationPhenylenediamine, o- 95545 1 61 Adult Oral 30 Adult Oral 36Phenylenediamine, p- 106503 1 5000 Child Oral 2500 Child Oral 6200* The complete list of constituents is not included at present because of business confidentiality concerns (continued)

F-3
Appendix F
ChemicalCAS
NumberGroup
Number
90% Waste Concentration 95% Waste ConcentrationDeterministic
WasteConcentration
(mg/kg)Concentration
(mg/kg) Receptor PathwayConcentration
(mg/kg) Receptor Pathway
Table F-1. (continued)
Pyridine 110861 2 29 Adult/Child Inhalation 17 Adult/Child Inhalation 31Toluene 108883 3 665 Adult/Child Inhalation 333 Adult/Child Inhalation 400Toluidine, o- 95534 2 13 Adult Oral 10 Adult Oral 7Toluidine, p- 106490 2 23 Adult Oral 15 Adult Oral 10Trichlorobenzene, 1,2,4- 120821 4 3840 Adult/Child Inhalation 1997 Adult/Child Inhalation 2628
Xylenes (total) 1330207 3 1247 Adult/Child Inhalation 713 Adult/Child Inhalation 907
NA - Not Applicable because the concentration was > 1,000,000 mg/kg. Note - shading indicates risk-limiting exposure route

F-4
Appendix E
Table F-2. Risk-Based Leachate Concentrations for TAM Sludge Waste (mg/L)*
ChemicalCAS
NumberGroup
Number
90% Leachate Concentration 95% Leachate ConcentrationDeterministic
LeachateConcentration
(mg/L)Concentration
(mg/L) Receptor PathwayConcentration
(mg/L) Receptor Pathway1,2-Diphenylhydrazine 122667 4 0.0042 Adult Oral 0.003 Adult Oral 0.038Acetone 67641 1 5.6 Child Oral 3.7 Child Oral 8.6Aniline 62533 2 0.029 Adult/Child Inhalation 0.02 Adult/Child Inhalation 0.045Azobenzene 103333 4 0.013 Adult Oral 0.0086 Adult Oral 0.012Benzaldehyde 100527 2 5.6 Child Oral 3.7 Child Oral 8.3Benzene 71432 2 0.11 Adult/Child Inhalation 0.69 Adult/Child Inhalation 0.083Benzidine 92875 2 0.000023 Adult Oral 0.000013 Adult Oral 0.00002Bis(2-ethylhexyl)phthalate 117817 5 0.17 Adult Oral 0.048 Adult Oral 0.0019Bromodichloromethane 75274 6 0.060 Adult Inhalation 0.037 Adult Inhalation 0.048Chloroaniline, p- 106478 2 0.25 Child Oral 0.15 Child Oral 0.32Chlorobenzene 108907 3 0.0036 Adult/Child Inhalation 0.0025 Adult/Child Inhalation 0.0065Chloroform 67663 2 0.042 Adult/Child Inhalation 0.026 Adult/Child Inhalation 0.031Cresol, p- 106445 2 0.33 Child Oral 0.2 Child Oral 0.41Dichlorobenzene, 1,2- 95501 4 0.043 Adult/Child Inhalation 0.03 Adult/Child Inhalation 0.075Dichlorobenzene, 1,4- 106467 4 0.11 Adult Oral 0.066 Adult Oral 0.098Dimethoxybenzidine, 3,3'- 119904 2 0.38 Adult Oral 0.22 Adult Oral 0.29Diphenylamine 122394 4 1.1 Adult Oral 0.78 Adult Oral 1.9Ethylbenzene 100414 3 0.17 Adult/Child Inhalation 0.12 Adult/Child Inhalation 0.32Formaldehyde 50000 1 11 Child Oral 10 Child Oral 18Methyl isobutyl ketone 108101 2 0.042 Adult/Child Inhalation 0.029 Adult/Child Inhalation 0.068Methylene chloride 75092 6 0.067 Adult Oral 0.41 Adult Oral 0.53Naphthalene 91203 4 0.0028 Adult/Child Inhalation 0.0021 Adult/Child Inhalation 0.0053N-N-Dimethylaniline 121697 2 0.11 Child Oral 0.10 Child Oral 0.16N-nitrosodiphenylamine 86306 4 0.62 Adult Oral 0.37 Adult Oral 0.55Phenol 108952 2 0.8 Adult/Child Inhalation 0.57 Adult/Child InhalationPhenylenediamine, o- 95545 1 0.11 Adult Oral 0.070 Adult Oral 0.09Phenylenediamine, p- 106503 1 10 Child Oral 7.0 Child Oral 16Pyridine 110861 2 0.042 Adult/Child Inhalation 0.030 Adult/Child Inhalation 0.066Toluene 108883 3 0.071 Adult/Child Inhalation 0.053 Adult/Child Inhalation 0.12Toluidine, o- 95534 2 0.022 Adult Oral 0.013 Adult Oral 0.017Toluidine, p- 106490 2 0.029 Adult Oral 0.016 Adult Oral 0.021* The complete list of constituents is not included at present because of business confidentiality concerns (continued)

F-5
Appendix F
ChemicalCAS
NumberGroup
Number
90% Leachate Concentration 95% Leachate ConcentrationDeterministic
LeachateConcentration
(mg/L)Concentration
(mg/L) Receptor PathwayConcentration
(mg/L) Receptor Pathway
Table F-2. (continued)
Trichlorobenzene, 1,2,4- 120821 4 0.046 Adult/Child Inhalation 0.034 Adult/Child Inhalation 0.081Xylene, m- 108383 3 100 Child Oral 63 Child OralXylene, o- 95476 3 100 Child Oral 63 Child Oral
Xylenes (total) 1330207 3 0.071 Adult/Child Inhalation 0.051 Adult/Child Inhalation 0.13
NA - Not Applicable because the concentration was > 1,000,000 mg/kg. Note - shading indicates risk-limiting exposure route

F-6
Appendix E
Table F-3. Risk Limiting Waste Concentrations for TAM Sludge Stream*90th Percentile
Adult
ChemicalCAS
NumberGroup
Number
New WasteConcentration
(mg/kg)
Drinking WaterIngestion HQ or
Risk for theADULT
InhalationHazard
Quotient orRisk forShower -ADULT
InhalationHazard
Quotient orRisk for
Bathroom -ADULT
Inhalation HazardQuotient or Risk
for Whole House -ADULT
SummedInhalation
Hazard Quotientor Risk -ADULT
DermalHazard
Quotient orRisk -
ADULT
SummedDrinking
WaterIngestion &Dermal HQor Risk forthe ADULT
1,2-Diphenylhydrazine 122667 4 31 3E-06 5E-08 1E-08 2E-09 7E-08 7E-06 1E-05
Acetone 67641 1 3333 0.4 0.09 0.02 0.0001 0.1101 0.0020 0.40Aniline 62533 2 17 3E-07 0.9 0.1 0.0009 1 1E-08 3E-07Azobenzene 103333 4 716 6E-06 3E-08 9E-09 9E-10 4E-08 4E-06 1E-05Benzaldehyde 100527 2 5000 0.5 NA NA NA NA 0.032 0.52Benzene 71432 2 365 5E-06 5E-06 4E-06 4E-07 9E-06 1E-06 7E-06Benzidine 92875 2 0.03 9E-06 2E-12 4E-13 4E-14 2E-12 8E-07 1E-05Bis(2-ethylhexyl)phthalate 117817 5 NA NA NA NA NA NA NA NABromodichloromethane 75274 6 156 8E-06 7E-06 3E-06 4E-07 1E-05 9E-07 8E-06Chloroaniline, p- 106478 2 250 0.4 NA NA NA NA 0.062 0.47Chlorobenzene 108907 3 36 0.002 0.8 0.3 0.002 1 0.00098 0.0028Chloroform 67663 2 102 4E-07 5E-06 4E-06 4E-07 9E-06 5E-08 5E-07Cresol, p- 106445 2 333 0.4 NA NA NA NA 0.081 0.47Dichlorobenzene, 1,2- 95501 4 1109 0.004 0.8 0.3 0.002 1 0.0049 0.0095Dichlorobenzene, 1,4- 106467 4 2607 5E-06 0.5 0.2 0.001 0.70 5E-06 1E-05Dimethoxybenzidine, 3,3'- 119904 2 518 9E-06 NA NA NA NA 6E-07 1E-05Diphenylamine 122394 4 26524 0.4 NA NA NA NA 0.59 1Ethylbenzene 100414 3 3429 0.02 0.8 0.3 0.002 1 0.017 0.036Formaldehyde 50000 1 7000 0.6 2E-06 5E-07 6E-08 2E-06 0.0050 0.60Methyl isobutyl ketone 108101 2 42 0.004 0.8 0.2 0.0009 1 0.00017 0.0042Methylene chloride 75092 6 927 9E-06 2E-06 1E-06 1E-07 3E-06 5E-07 1E-05Naphthalene 91203 4 17 0.0004 0.8 0.2 0.001 1 0.00041 0.00081N-N-Dimethylaniline 121697 2 300 0.5 NA NA NA NA 0.10 0.58N-Nitrosodiphenylamine 86306 4 7393 5E-06 2E-07 5E-08 5E-09 2E-07 4E-06 1E-05* The complete list of constituents is not included at present because of business confidentiality concerns (continued)

F-7
Appendix F
ChemicalCAS
NumberGroup
Number
New WasteConcentration
(mg/kg)
Drinking WaterIngestion HQ or
Risk for theADULT
InhalationHazard
Quotient orRisk forShower -ADULT
InhalationHazard
Quotient orRisk for
Bathroom -ADULT
Inhalation HazardQuotient or Risk
for Whole House -ADULT
SummedInhalation
Hazard Quotientor Risk -ADULT
DermalHazard
Quotient orRisk -
ADULT
SummedDrinking
WaterIngestion &Dermal HQor Risk forthe ADULT
Table F-3. (continued)
Phenol 108952 2 833 0.01 0.91 0.2 0.001 1 0.001 0.01Phenylenediamine, o- 95545 1 61 1E-05 NA NA NA NA 1E-07 1E-05Phenylenediamine, p- 106503 1 5000 0.5 NA NA NA NA 0.0024 0.50Pyridine 110861 2 29 0.3 0.9 0.2 0.00091 1 0.0069 0.31Toluene 108883 3 665 0.004 0.8 0.3 0.002 1 0.0019 0.0056Toluidine, o- 95534 2 13 9E-06 1E-07 3E-08 3E-09 1E-07 7E-07 1E-05Toluidine, p- 106490 2 23 9E-06 NA NA NA NA 5E-07 1E-05Trichlorobenzene, 1,2,4- 120821 4 3840 0.04 0.8 0.2 0.001 1 0.089 0.13
Xylenes (total) 1330207 3 1247 0.0003 0.7 0.3 0.002 1 0.00031 0.00066NA - Not Applicable because the waste concentration is > 1,000,000 mg/kg.*Shading indicates risk-limiting exposure route.

F-8
Appendix E
Table F-4. Risk Limiting Waste Concentrations for TAM Sludge Stream*90th Percentile
Child
ChemicalCAS
NumberGroup
Number
New WasteConcentration
(mg/kg)
Drinking WaterIngestion HQ or Risk
for the CHILD
Inhalation HazardQuotient or Risk for
Shower - CHILD
Inhalation HazardQuotient or Risk forBathroom - CHILD
Inhalation HazardQuotient or Risk
for Whole House -CHILD
SummedInhalation HazardQuotient or Risk -
CHILD1,2-Diphenylhydrazine 122667 4 31 5E-06 4E-08 1E-08 1E-09 5E-08Acetone 67641 1 3333 1 0.09 0.02 0.0001 0.11Aniline 62533 2 17 2E-07 0.9 0.1 0.0009 1Azobenzene 103333 4 716 2E-06 6E-08 2E-08 2E-09 7E-08Benzaldehyde 100527 2 5000 1 NA NA NA NABenzene 71432 2 365 5E-06 6E-06 4E-06 5E-07 1E-05Benzidine 92875 2 0.03 9E-06 2E-12 4E-13 5E-14 2E-12Bis(2-ethylhexyl)phthalate 117817 5 NA NA NA NA NA NABromodichloromethane 75274 6 156 6E-06 6E-06 3E-06 3E-07 1E-05Chloroaniline, p- 106478 2 250 1 NA NA NA NAChlorobenzene 108907 3 36 0.004 0.8 0.3 0.002 1Chloroform 67663 2 102 4E-07 6E-06 4E-06 5E-07 1E-05Cresol, p- 106445 2 333 1 NA NA NA NADichlorobenzene, 1,2- 95501 4 1109 0.01 0.8 0.3 0.002 1Dichlorobenzene, 1,4- 106467 4 2607 4E-06 0.5 0.2 0.001 0.70Dimethoxybenzidine, 3,3'- 119904 2 518 9E-06 NA NA NA NADiphenylamine 122394 4 26524 0.8 NA NA NA NAEthylbenzene 100414 3 3429 0.04 0.8 0.3 0.002 1Formaldehyde 50000 1 7000 1 2E-06 6E-07 7E-08 2E-06Methyl isobutyl ketone 108101 2 42 0.01 0.8 0.2 0.0009 1Methylene chloride 75092 6 927 9E-06 2E-06 1E-06 1E-07 3E-06Naphthalene 91203 4 17 0.00081 0.8 0.2 0.001 1N-N-Dimethylaniline 121697 2 300 1 NA NA NA NAN-Nitrosodiphenylamine 86306 4 7393 5E-06 2E-07 5E-08 6E-09 3E-07
(continued)Note - Shading indicates risk-limiting exposure route. *The complete list of consituents is not included at present because of business confidentiality concerns

F-9
Appendix F
ChemicalCAS
NumberGroup
Number
New WasteConcentration
(mg/kg)
Drinking WaterIngestion HQ or Risk
for the CHILD
Inhalation HazardQuotient or Risk for
Shower - CHILD
Inhalation HazardQuotient or Risk forBathroom - CHILD
Inhalation HazardQuotient or Risk
for Whole House -CHILD
SummedInhalation HazardQuotient or Risk -
CHILD
Table F-4. (continued)
Phenol 108952 2 833 0.03 0.91 0.2 0.001 1Phenylenediamine, o- 95545 1 61 9E-06 NA NA NA NAPhenylenediamine, p- 106503 1 5000 1 NA NA NA NAPyridine 110861 2 29 0.8 0.9 0.2 0.00091 1Toluene 108883 3 665 0.008 0.8 0.3 0.002 1Toluidine, o- 95534 2 13 8E-06 1E-07 3E-08 4E-09 1E-07Toluidine, p- 106490 2 23 9E-06 NA NA NA NATrichlorobenzene, 1,2,4- 120821 4 3840 0.09 0.8 0.2 0.001 1Xylenes (total) 1330207 3 1247 0.0008 0.7 0.3 0.002 1NA - Not Applicable because the waste concentration is > 1,000,000 mg/kg.*Shading indicates risk-limiting exposure route.

F-10
Appendix E
Table F-5. Risk Limiting Waste Concentrations for TAM Sludge Stream*95th Percentile
Adult
ChemicalCAS
NumberGroup
Number
New WasteConcentration
(mg/kg)
Drinking WaterIngestion HQ or
Risk for theADULT
InhalationHazard
Quotient orRisk forShower -ADULT
InhalationHazard Quotient
or Risk forBathroom -
ADULT
Inhalation HazardQuotient or Risk
for Whole House -ADULT
SummedInhalation
HazardQuotient or
Risk -ADULT
DermalHazard
Quotientor Risk -ADULT
SummedDrinking
WaterIngestion &Dermal HQor Risk forthe ADULT
1,2-Diphenylhydrazine 122667 4 16 6E-06 3E-08 8E-09 9E-10 4E-08 4E-06 1E-05Acetone 67641 1 2000 0.5 0.1 0.02 0.0001 0.12 0.0024 0.50Aniline 62533 2 11 3E-07 0.805 0.1 0.0009 1 2E-08 3E-07Azobenzene 103333 4 360 3E-06 5E-08 1E-08 2E-09 7E-08 7E-06 1E-05Benzaldehyde 100527 2 2500 0.4 NA NA NA NA 0.024 0.42Benzene 71432 2 167 5E-06 6E-06 4E-06 5E-07 1E-05 1E-06 7E-06Benzidine 92875 2 0.01 9E-06 2E-12 4E-13 4E-14 2E-12 8E-07 1E-05Bis(2-ethylhexyl)phthalate 117817 5 NA NA NA NA NA NA NA NABromodichloromethane 75274 6 70 7E-06 7E-06 3E-06 4E-07 1E-05 8E-07 8E-06Chloroaniline, p- 106478 2 143 0.4 NA NA NA NA 0.072 0.51Chlorobenzene 108907 3 17 0.002 0.7 0.3 0.002 1 0.00084 0.0024Chloroform 67663 2 47 4E-07 6E-06 4E-06 4E-07 1E-05 5E-08 5E-07Cresol, p- 106445 2 200 0.4 NA NA NA NA 0.096 0.54Dichlorobenzene, 1,2- 95501 4 665 0.005 1 0.3 0.002 1 0.0060 0.012Dichlorobenzene, 1,4- 106467 4 1276 5E-06 0.5 0.2 0.001 0.70 5E-06 1E-05Dimethoxybenzidine, 3,3'- 119904 2 238 9E-06 NA NA NA NA 7E-07 1E-05Diphenylamine 122394 4 12352 0.4 NA NA NA NA 0.59 1Ethylbenzene 100414 3 1664 0.02 0.7 0.3 0.002 1 0.015 0.031Formaldehyde 50000 1 2500 0.4 1E-06 4E-07 4E-08 2E-06 0.0036 0.40Methyl isobutyl ketone 108101 2 27 0.005 0.9 0.2 0.001 1 0.00020 0.0053Methylene chloride 75092 6 414 1E-05 2E-06 1E-06 1E-07 3E-06 4E-07 1E-05Naphthalene 91203 4 9 0.0004 0.8 0.2 0.001 1 0.00045 0.00086N-N-Dimethylaniline 121697 2 143 0.4 NA NA NA NA 0.095 0.52N-Nitrosodiphenylamine 86306 4 3686 5E-06 2E-07 5E-08 5E-09 2E-07 4E-06 1E-05
(continued)Note - Shading indicates risk-limiting exposure route. *The complete list of constituents is not included at present because of business confidentiality concerns

F-11
Appendix F
ChemicalCAS
NumberGroup
Number
New WasteConcentration
(mg/kg)
Drinking WaterIngestion HQ or
Risk for theADULT
InhalationHazard
Quotient orRisk forShower -ADULT
InhalationHazard Quotient
or Risk forBathroom -
ADULT
Inhalation HazardQuotient or Risk
for Whole House -ADULT
SummedInhalation
HazardQuotient or
Risk -ADULT
DermalHazard
Quotientor Risk -ADULT
SummedDrinking
WaterIngestion &Dermal HQor Risk forthe ADULT
Table F-5. (continued)
Phenol 108952 2 416 0.01 0.9 0.2 0.0009 1 0.001 0.01Phenylenediamine, o- 95545 1 30 1E-05 NA NA NA NA 1E-07 1E-05Phenylenediamine, p- 106503 1 2500 0.5 NA NA NA NA 0.0024 0.50Pyridine 110861 2 17 0.4 0.80 0.105 0.0009 1 0.0076 0.41Toluene 108883 3 333 0.003 0.8 0.3 0.002 1 0.0018 0.0050Toluidine, o- 95534 2 10 9E-06 1E-07 3E-08 3E-09 1E-07 8E-07 1E-05Toluidine, p- 106490 2 15 1E-05 NA NA NA NA 6E-07 1E-05Trichlorobenzene, 1,2,4- 120821 4 1997 0.04 0.9 0.2 0.001 1 0.097 0.14Xylenes (total) 1330207 3 713 0.00030 0.8 0.3 0.002 1 0.00035 0.00065
NA - Not Applicable because the waste concentration is > 1,000,000 mg/kg.*Shading indicates risk-limiting exposure route.

F-12
Appendix E
Table F-6. Risk Limiting Waste Concentrations for TAM Sludge Stream*95th Percentile
Child
ChemicalCAS
NumberGroup
Number
New WasteConcentration
(mg/kg)
DrinkingWater
Ingestion HQor Risk for the
CHILD
InhalationHazard
Quotient orRisk forShower -CHILD
InhalationHazard
Quotient orRisk for
Bathroom -CHILD
InhalationHazard
Quotient orRisk for
Whole House -CHILD
SummedInhalation
HazardQuotient or
Risk - CHILD1,2-Diphenylhydrazine 122667 4 16 6E-06 4E-08 1E-08 1E-09 5E-08Acetone 67641 1 2000 1 0.1 0.02 0.0001 0.12Aniline 62533 2 11 3E-07 0.80 0.1 0.0009 1Azobenzene 103333 4 360 3E-06 6E-08 2E-08 2E-09 9E-08Benzaldehyde 100527 2 2500 1 NA NA NA NABenzene 71432 2 167 4E-06 5E-06 4E-06 4E-07 1E-05Benzidine 92875 2 0.01 9E-06 2E-12 4E-13 5E-14 2E-12Bis(2-ethylhexyl)phthalate 117817 5 NA NA NA NA NA NABromodichloromethane 75274 6 70 6E-06 6E-06 3E-06 3E-07 9E-06Chloroaniline, p- 106478 2 143 1 NA NA NA NAChlorobenzene 108907 3 17 0.004 0.7 0.3 0.002 1Chloroform 67663 2 47 4E-07 6E-06 4E-06 5E-07 1E-05Cresol, p- 106445 2 200 1 NA NA NA NADichlorobenzene, 1,2- 95501 4 665 0.01 1 0.3 0.002 1Dichlorobenzene, 1,4- 106467 4 1276 5E-06 0.5 0.2 0.001 0.701Dimethoxybenzidine, 3,3'- 119904 2 238 8E-06 NA NA NA NADiphenylamine 122394 4 12352 0.8 NA NA NA NAEthylbenzene 100414 3 1664 0.04 0.7 0.3 0.002 1Formaldehyde 50000 1 2500 1 1E-06 4E-07 5E-08 2E-06Methyl isobutyl ketone 108101 2 27 0.01 0.9 0.2 0.001 1
(continued)Note - Shading indicates risk-limiting exposure route. * The complete list of constituents is not included at present because of business confidentiality concerns

F-13
Appendix F
ChemicalCAS
NumberGroup
Number
New WasteConcentration
(mg/kg)
DrinkingWater
Ingestion HQor Risk for the
CHILD
InhalationHazard
Quotient orRisk forShower -CHILD
InhalationHazard
Quotient orRisk for
Bathroom -CHILD
InhalationHazard
Quotient orRisk for
Whole House -CHILD
SummedInhalation
HazardQuotient or
Risk - CHILD
Table F-6. (continued)
Methylene chloride 75092 6 414 8E-06 2E-06 1E-06 1E-07 3E-06Naphthalene 91203 4 9 0.0009 0.8 0.2 0.001 1N-N-Dimethylaniline 121697 2 143 1 NA NA NA NAN-Nitrosodiphenylamine 86306 4 3686 6E-06 2E-07 6E-08 6E-09 3E-07Phenol 108952 2 416 0.03 0.9 0.2 0.0009 1Phenylenediamine, o- 95545 1 30 9E-06 NA NA NA NAPhenylenediamine, p- 106503 1 2500 1 NA NA NA NAPyridine 110861 2 17 0.9 0.80 0.10 0.0009 1Toluene 108883 3 333 0.008 0.8 0.3 0.002 1Toluidine, o- 95534 2 10 9E-06 1E-07 3E-08 4E-09 1E-07Toluidine, p- 106490 2 15 1E-05 NA NA NA NATrichlorobenzene, 1,2,4- 120821 4 1997 0.1 0.9 0.2 0.001 1Xylenes (total) 1330207 3 713 0.00080 0.8 0.3 0.002 1
NA - Not Applicable because the waste concentration is > 1,000,000 mg/kg.*Shading indicates risk-limiting exposure route.

F-14
Appendix E
Table F-7. Risk Limiting Waste Concentrations for TAM Sludge Stream*Deterministic
Adult
ChemicalCAS
NumberGroup
Number New
Was
teC
once
ntra
tion
(m
g/kg
)
Dri
nkin
g W
ater
Inge
stio
n H
Q o
r R
isk
for
the
AD
UL
T
Inha
lati
on H
azar
dQ
uoti
ent
or R
isk
for
Show
er -
AD
UL
T
Inha
lati
on H
azar
dQ
uoti
ent
or R
isk
for
Bat
hroo
m -
AD
UL
T
Inha
lati
on H
azar
dQ
uoti
ent
or R
isk
for
Who
le H
ouse
- A
DU
LT
Sum
med
Inh
alat
ion
Haz
ard
Quo
tien
t or
Ris
k-
AD
UL
T
Der
mal
Haz
ard
Quo
tien
t or
Ris
k -
AD
UL
T
Sum
med
Dri
nkin
gW
ater
Ing
esti
on &
Der
mal
HQ
or
Ris
k fo
rth
e A
DU
LT
1,2-Diphenylhydrazine 122667 4 11 6E-06 4E-08 1E-08 1E-09 5E-08 4E-06 1E-05Acetone 67641 1 5500 0.4 0.1 0.02 0.0001 0.12 0.0023 0.40Aniline 62533 2 18 2E-07 0.9 0.1 0.0009 1 8E-09 2E-07Azobenzene 103333 4 257 3E-06 6E-08 2E-08 2E-09 8E-08 7E-06 1E-05Benzaldehyde 100527 2 3800 0.4 NA NA NA NA 0.027 0.43Benzene 71432 2 97 4E-06 5E-06 3E-06 4E-07 8E-06 1E-06 5E-06Benzidine 92875 2 0.01 8E-06 1E-12 3E-13 4E-14 2E-12 6E-07 8E-06Bis(2-ethylhexyl)phthalate 117817 5 120000 6E-08 0.002 0.0003 0.000002 0.0023 1E-05 1E-05Bromodichloromethane 75274 6 46 6E-06 6E-06 2E-06 3E-07 8E-06 6E-07 6E-06Chloroaniline, p- 106478 2 160 0.4 NA NA NA NA 0.066 0.47Chlorobenzene 108907 3 24 0.002 0.7 0.3 0.002 1 0.0009 0.0029Chloroform 67663 2 27 3E-07 5E-06 3E-06 4E-07 8E-06 4E-08 4E-07Cresol, p- 106445 2 230 0.4 NA NA NA NA 0.092 0.49Dichlorobenzene, 1,2- 95501 4 708 0.004 0.8 0.2 0.002 1 0.0046 0.0086Dichlorobenzene, 1,4- 106467 4 935.000 3E-06 0.24 0.10 0.00069 0.35000 7E-06 1E-05Dimethoxybenzidine, 3,3'- 119904 2 140 8E-06 NA NA NA NA 5E-07 8E-06Diphenylamine 122394 4 18000 0.4 NA NA NA NA 0.61 1Ethylbenzene 100414 3 2200 0.02 0.7 0.3 0.002 1 0.015 0.035Formaldehyde 50000 1 7143 0.5 8E-07 3E-07 3E-08 1E-06 0.0040 0.50
(continued)Note - Shading indicates risk-limiting exposure route. * The complete list of constituents is not included at present because of business confidentiality concerns

F-15
Appendix F
ChemicalCAS
NumberGroup
Number New
Was
teC
once
ntra
tion
(m
g/kg
)
Dri
nkin
g W
ater
Inge
stio
n H
Q o
r R
isk
for
the
AD
UL
T
Inha
lati
on H
azar
dQ
uoti
ent
or R
isk
for
Show
er -
AD
UL
T
Inha
lati
on H
azar
dQ
uoti
ent
or R
isk
for
Bat
hroo
m -
AD
UL
T
Inha
lati
on H
azar
dQ
uoti
ent
or R
isk
for
Who
le H
ouse
- A
DU
LT
Sum
med
Inh
alat
ion
Haz
ard
Quo
tien
t or
Ris
k-
AD
UL
T
Der
mal
Haz
ard
Quo
tien
t or
Ris
k -
AD
UL
T
Sum
med
Dri
nkin
gW
ater
Ing
esti
on &
Der
mal
HQ
or
Ris
k fo
rth
e A
DU
LT
Table F-7. (continued)
Methyl isobutyl ketone 108101 2 40 0.005 0.8 0.2 0.001 1 0.00018 0.0052Methylene chloride 75092 6 325 7E-06 2E-06 1E-06 1E-07 3E-06 4E-07 8E-06Naphthalene 91203 4 40 0.0007 0.8 0.2 0.001 1 0.00074 0.0014N-N-Dimethylaniline 121697 2 167 0.4 NA NA NA NA 0.093 0.49N-Nitrosodiphenylamine 86306 4 2657 6E-06 2E-07 5E-08 6E-09 3E-07 4E-06 1E-05Phenol 108952 2Phenylenediamine, o- 95545 1 36 7E-06 NA NA NA NA 8E-08 8E-06Phenylenediamine, p- 106503 1 6200 0.4 NA NA NA NA 0.0023 0.40Pyridine 110861 2 31 0.4 0.9 0.1 0.0009 1 0.0070 0.41Toluene 108883 3 400 0.003 0.7 0.3 0.002 1 0.0016 0.0046Toluidine, o- 95534 2 7 7E-06 9E-08 2E-08 3E-09 1E-07 6E-07 8E-06Toluidine, p- 106490 2 10 7E-06 NA NA NA NA 4E-07 8E-06Trichlorobenzene, 1,2,4- 120821 4 2628 0.04 0.8 0.2 0.001 1 0.091 0.13Xylenes (total) 1330207 3 907 0.0003 0.7 0.3 0.002 1 0.00032 0.0062
NA - Not Applicable because the waste concentration is > 1,000,000 mg/kg.*Shading indicates risk-limiting exposure route.

F-16
Appendix E
Table F-8. Risk Limiting Leachate Concentrations for TAM Sludge Stream*90th Percentile
Adult
ChemicalCAS
NumberGroup
Number
LeachateConcentration
(mg/L)
Drinking WaterIngestion HQ or
Risk for theADULT
InhalationHazard
Quotient orRisk forShower -ADULT
InhalationHazard
Quotient orRisk for
Bathroom -ADULT
Inhalation HazardQuotient or Risk
for Whole House -ADULT
SummedInhalation
Hazard Quotientor Risk -ADULT
DermalHazard
Quotient orRisk -
ADULT
SummedDrinking
WaterIngestion &Dermal HQor Risk forthe ADULT
1,2-Diphenylhydrazine 122667 4 0.0042 6E-06 3E-08 8E-09 9E-10 4E-08 4E-06 1E-05Acetone 67641 1 5.6 0.5 0.1 0.02 0.0001 0.12 0.0025 0.50Aniline 62533 2 0.029 0.0000003 0.9 0.11 0.0009 1 1E-08 3E-07Azobenzene 103333 4 0.013 3E-06 5E-08 1E-08 2E-09 6E-08 7E-06 1E-05Benzaldehyde 100527 2 5.6 0.4 NA NA NA NA 0.030 0.45Benzene 71432 2 0.11 6E-06 6E-06 4E-06 5E-07 1E-05 1E-06 7E-06Benzidine 92875 2 0.000023 9E-06 1E-12 4E-13 4E-14 2E-12 7E-07 1E-05Bis(2-ethylhexyl)phthalate 117817 5 0.17 5E-08 0.004 0.0006 0.000004 0.0046 1E-05 1E-05Bromodichloromethane 75274 6 0.060 7E-06 7E-06 3E-06 4E-07 1E-05 8E-07 8E-06Chloroaniline, p- 106478 2 0.25 0.5 NA NA NA NA 0.084 0.57Chlorobenzene 108907 3 0.0036 0.002 0.7 0.3 0.002 1 0.00094 0.0026Chloroform 67663 2 0.042 4E-07 6E-06 4E-06 5E-07 1E-05 5E-08 5E-07Cresol, p- 106445 2 0.33 0.5 NA NA NA NA 0.12 0.65Dichlorobenzene, 1,2- 95501 4 0.043 0.004 0.8 0.21 0.002 1 0.0045 0.0087Dichlorobenzene, 1,4- 106467 4 0.11 5E-06 0.5 0.2 0.001 0.70 5E-06 1E-05Dimethoxybenzidine, 3,3'- 119904 2 0.38 9E-06 NA NA NA NA 6E-07 1E-05Diphenylamine 122394 4 1.1 0.4 NA NA NA NA 0.61 1Ethylbenzene 100414 3 0.17 0.01 0.7 0.3 0.002 1 0.015 0.029Formaldehyde 50000 1 11 0.5 1E-06 4E-07 5E-08 2E-06 4E-03 0.50Methyl isobutyl ketone 108101 2 0.042 0.004 0.8 0.2 0.001 1 0.00018 0.0042Methylene chloride 75092 6 0.67 1E-05 2E-06 1E-06 2E-07 4E-06 5E-07 1E-05Naphthalene 91203 4 0.0028 0.0006 0.8 0.2 0.001 1 0.00068 0.0013N-N-Dimethylaniline 121697 2 0.11 0.4 NA NA NA NA 0.10 0.55N-Nitrosodiphenylamine 86306 4 0.62 6E-06 2E-07 5E-08 5E-09 2E-07 5E-06 1E-05
(continued)*Shading indicates risk-limiting exposure route.

F-17
Appendix F
ChemicalCAS
NumberGroup
Number
LeachateConcentration
(mg/L)
Drinking WaterIngestion HQ or
Risk for theADULT
InhalationHazard
Quotient orRisk forShower -ADULT
InhalationHazard
Quotient orRisk for
Bathroom -ADULT
Inhalation HazardQuotient or Risk
for Whole House -ADULT
SummedInhalation
Hazard Quotientor Risk -ADULT
DermalHazard
Quotient orRisk -
ADULT
SummedDrinking
WaterIngestion &Dermal HQor Risk forthe ADULT
Table F-8. (continued)
Phenol 108952 2 0.8 0.01 0.9 0.2 0.0009 1 0.001 0.01Phenylenediamine, o- 95545 1 0.11 1E-05 NA NA NA NA 1E-07 1E-05Phenylenediamine, p- 106503 1 10 0.4 NA NA NA NA 0.0024 0.40Pyridine 110861 2 0.042 0.3 0.9 0.2 0.001 1 0.0072 0.31Toluene 108883 3 0.071 0.003 0.7 0.3 0.002 1 0.0018 0.0050Toluidine, o- 95534 2 0.022 9E-06 1E-07 3E-08 3E-09 1E-07 8E-07 1E-05Toluidine, p- 106490 2 0.029 1E-05 NA NA NA NA 5E-07 1E-05Trichlorobenzene, 1,2,4- 120821 4 0.046 0.04 0.8 0.2 0.001 1 0.088 0.13Xylene, m- 108383 3 100 0.4 NA NA NA NA 0.48 0.94Xylene, o- 95476 3 100 0.4 NA NA NA NA 0.43 0.88Xylenes (total) 1330207 3 0.071 0.0003 0.7 0.3 0.002 1 0.00033 0.00065
Note - Shading indicates risk-limiting exposure route. NA - Not Applicable because the concentration was > 1,000,000 mg/kg.

F-18
Appendix E
Table F-9. Risk Limiting Leachate Concentrations for TAM Sludge Stream*90th Percentile
Child
ChemicalCAS
NumberGroup
Number
LeachateConcentration
(mg/L)
Drinking WaterIngestion HQ or
Risk for theCHILD
Inhalation HazardQuotient or Risk
for Shower -CHILD
Inhalation HazardQuotient or Risk forBathroom - CHILD
Inhalation HazardQuotient or Risk for
Whole House - CHILD
Summed InhalationHazard Quotient or
Risk - CHILD1,2-Diphenylhydrazine 122667 4 0.0042 5E-06 4E-08 9E-09 1E-09 5E-08Acetone 67641 1 5.6 1 0.1 0.02 0.0001 0.1201Aniline 62533 2 0.029 2E-07 0.9 0.11 0.0009 1Azobenzene 103333 4 0.013 2E-06 5E-08 1E-08 2E-09 7E-08Benzaldehyde 100527 2 5.6 1 NA NA NA NABenzene 71432 2 0.11 5E-06 6E-06 4E-06 5E-07 1E-05Benzidine 92875 2 0.000023 8E-06 1E-12 4E-13 4E-14 2E-12Bis(2-ethylhexyl)phthalate 117817 5 0.17 5E-08 0.004 0.0006 0.000004 0.0046Bromodichloromethane 75274 6 0.060 6E-06 6E-06 3E-06 3E-07 9E-06Chloroaniline, p- 106478 2 0.25 1 NA NA NA NAChlorobenzene 108907 3 0.0036 0.004 0.7 0.3 0.002 1Chloroform 67663 2 0.042 4E-07 6E-06 4E-06 5E-07 1E-05Cresol, p- 106445 2 0.33 1 NA NA NA NADichlorobenzene, 1,2- 95501 4 0.043 0.008 0.8 0.21 0.002 1Dichlorobenzene, 1,4- 106467 4 0.11 4E-06 0.5 0.2 0.001 0.70Dimethoxybenzidine, 3,3'- 119904 2 0.38 8E-06 NA NA NA NADiphenylamine 122394 4 1.1 0.8 NA NA NA NAEthylbenzene 100414 3 0.17 0.03 0.7 0.3 0.002 1Formaldehyde 50000 1 11 1 1E-06 4E-07 5E-08 2E-06Methyl isobutyl ketone 108101 2 0.042 0.009 0.8 0.2 0.001 1Methylene chloride 75092 6 0.67 8E-06 2E-06 1E-06 1E-07 3E-06Naphthalene 91203 4 0.0028 0.001 0.8 0.2 0.001 1N-N-Dimethylaniline 121697 2 0.11 1 NA NA NA NAN-Nitrosodiphenylamine 86306 4 0.62 4E-06 2E-07 5E-08 6E-09 3E-07
(continued)Note - Shading indicates risk-limiting exposure route. *Not all constituents are included at present because of business confidentiality concerns

F-19
Appendix F
ChemicalCAS
NumberGroup
Number
LeachateConcentration
(mg/L)
Drinking WaterIngestion HQ or
Risk for theCHILD
Inhalation HazardQuotient or Risk
for Shower -CHILD
Inhalation HazardQuotient or Risk forBathroom - CHILD
Inhalation HazardQuotient or Risk for
Whole House - CHILD
Summed InhalationHazard Quotient or
Risk - CHILD
Table F-9. (continued)
P henol 108952 2 0.8 0.02 0.9 0.2 0.0009 1Phenylenediamine, o- 95545 1 0.11 8E-06 NA NA NA NAPhenylenediamine, p- 106503 1 10 1 NA NA NA NAPyridine 110861 2 0.042 0.7 0.9 0.2 0.001 1Toluene 108883 3 0.071 0.007 0.7 0.3 0.002 1Toluidine, o- 95534 2 0.022 8E-06 1E-07 3E-08 3E-09 1E-07Toluidine, p- 106490 2 0.029 8E-06 NA NA NA NATrichlorobenzene, 1,2,4- 120821 4 0.046 0.08 0.8 0.2 0.001 1Xylene, m- 108383 3 100 1 NA NA NA NAXylene, o- 95476 3 100 1 NA NA NA NAXylenes (total) 1330207 3 0.071 0.0007 0.7 0.3 0.002 1
*Shading indicates risk-limiting exposure route. NA - Not Applicable because the concentration was > 1,000,000 mg/kg.

F-20
Appendix E
Table F-10. Risk Limiting Leachate Concentrations for TAM Sludge Stream*95th Percentile
Adult
ChemicalCAS
NumberGroup
Number
LeachateConcentration
(mg/L)
Drinking WaterIngestion HQ or
Risk for theADULT
InhalationHazard
Quotient orRisk forShower -ADULT
InhalationHazard
Quotient orRisk for
Bathroom -ADULT
InhalationHazard
Quotient orRisk for Whole
House -ADULT
SummedInhalation
HazardQuotient or
Risk -ADULT
Dermal HazardQuotient or
Risk - ADULT
SummedDrinking
WaterIngestion &Dermal HQor Risk forthe ADULT
1,2-Diphenylhydrazine 122667 4 0.003 7E-06 3E-08 9E-09 1E-09 4E-08 4E-06 1E-05
Acetone 67641 1 3.7 0.5 0.1 0.02 0.0001 0.12 0.0023 0.50Aniline 62533 2 0.02 3E-07 0.9 0.1 0.0009 1 2E-08 4E-07Azobenzene 103333 4 0.0086 3E-06 5E-08 1E-08 2E-09 7E-08 7E-06 1E-05Benzaldehyde 100527 2 3.7 0.5 NA NA NA NA 0.028 0.52Benzene 71432 2 0.69 6E-06 5E-06 4E-06 5E-07 1E-05 1E-06 7E-06Benzidine 92875 2 0.000013 9E-06 1E-12 3E-13 4E-14 2E-12 7E-07 1E-05Bis(2-ethylhexyl)phthalate 117817 5 0.048 5E-08 0.003 0.0005 0.000003 0.0035 1E-05 1E-05Bromodichloromethane 75274 6 0.037 7E-06 7E-06 3E-06 4E-07 1E-05 8E-07 8E-06Chloroaniline, p- 106478 2 0.15 0.5 NA NA NA NA 0.072 0.55Chlorobenzene 108907 3 0.0025 0.002 0.7 0.3 0.002 1 0.00088 0.0026Chloroform 67663 2 0.026 5E-07 6E-06 4E-06 5E-07 1E-05 5E-08 5E-07Cresol, p- 106445 2 0.2 0.5 NA NA NA NA 0.10 0.61Dichlorobenzene, 1,2- 95501 4 0.030 0.004 0.8 0.205 0.002 1 0.0044 0.0085Dichlorobenzene, 1,4- 106467 4 0.066 5E-06 0.4 0.1 0.001 0.50 5E-06 1E-05Dimethoxybenzidine, 3,3'- 119904 2 0.22 9E-06 NA NA NA NA 6E-07 1E-05Diphenylamine 122394 4 0.78 0.4 NA NA NA NA 0.61 1Ethylbenzene 100414 3 0.12 0.010 0.7 0.3 0.002 1 0.014 0.029Formaldehyde 50000 1 10 0.6 2E-06 6E-07 7E-08 2E-06 0.0052 0.61Methyl isobutyl ketone 108101 2 0.029 0.005 0.8 0.2 0.001 1 0.00018 0.0051Methylene chloride 75092 6 0.41 1E-05 2E-06 1E-06 2E-07 3E-06 5E-07 1E-05Naphthalene 91203 4 0.0021 0.0007 0.8 0.2 0.001 1 0.00071 0.0014N-N-Dimethylaniline 121697 2 0.1 0.6 NA NA NA NA 0.13 0.75
(continued)Note - Shading indicates risk-limiting exposure route. * Not all constituents are included at present because of business confidentiality concerns
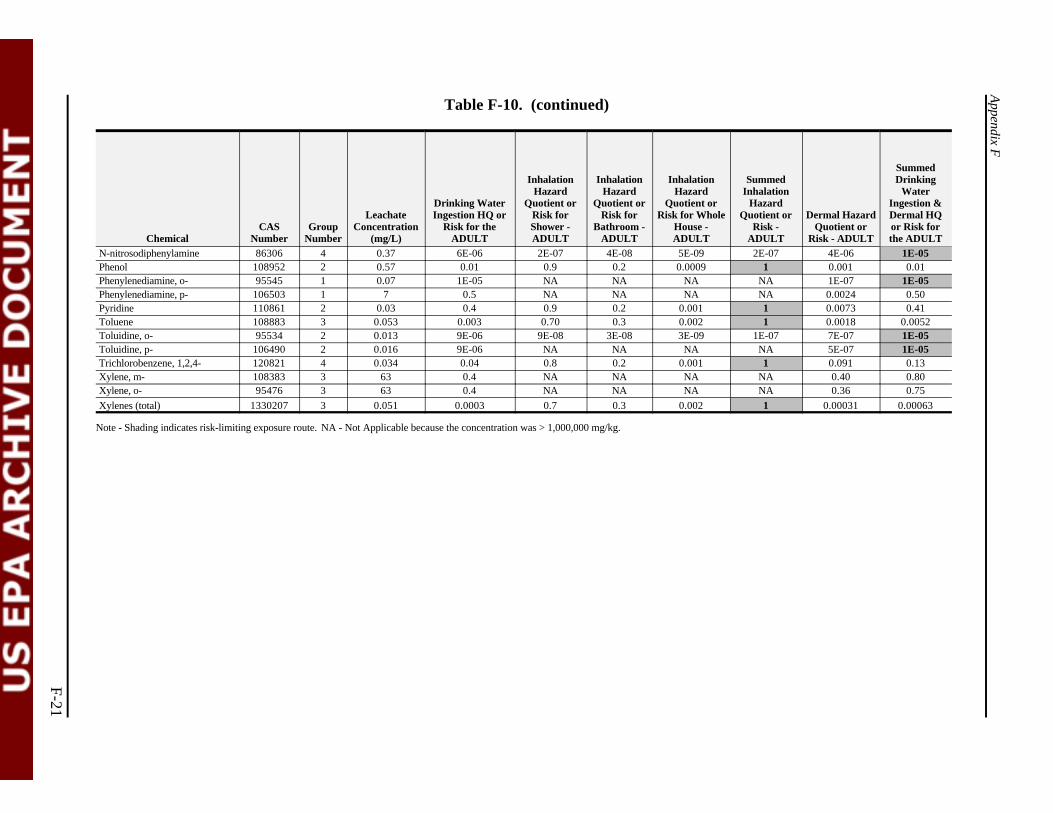
F-21
Appendix F
ChemicalCAS
NumberGroup
Number
LeachateConcentration
(mg/L)
Drinking WaterIngestion HQ or
Risk for theADULT
InhalationHazard
Quotient orRisk forShower -ADULT
InhalationHazard
Quotient orRisk for
Bathroom -ADULT
InhalationHazard
Quotient orRisk for Whole
House -ADULT
SummedInhalation
HazardQuotient or
Risk -ADULT
Dermal HazardQuotient or
Risk - ADULT
SummedDrinking
WaterIngestion &Dermal HQor Risk forthe ADULT
Table F-10. (continued)
N-nitrosodiphenylamine 86306 4 0.37 6E-06 2E-07 4E-08 5E-09 2E-07 4E-06 1E-05Phenol 108952 2 0.57 0.01 0.9 0.2 0.0009 1 0.001 0.01Phenylenediamine, o- 95545 1 0.07 1E-05 NA NA NA NA 1E-07 1E-05Phenylenediamine, p- 106503 1 7 0.5 NA NA NA NA 0.0024 0.50Pyridine 110861 2 0.03 0.4 0.9 0.2 0.001 1 0.0073 0.41Toluene 108883 3 0.053 0.003 0.70 0.3 0.002 1 0.0018 0.0052Toluidine, o- 95534 2 0.013 9E-06 9E-08 3E-08 3E-09 1E-07 7E-07 1E-05Toluidine, p- 106490 2 0.016 9E-06 NA NA NA NA 5E-07 1E-05Trichlorobenzene, 1,2,4- 120821 4 0.034 0.04 0.8 0.2 0.001 1 0.091 0.13Xylene, m- 108383 3 63 0.4 NA NA NA NA 0.40 0.80Xylene, o- 95476 3 63 0.4 NA NA NA NA 0.36 0.75
Xylenes (total) 1330207 3 0.051 0.0003 0.7 0.3 0.002 1 0.00031 0.00063
Note - Shading indicates risk-limiting exposure route. NA - Not Applicable because the concentration was > 1,000,000 mg/kg.

F-22
Appendix E
Table F-11. Risk Limiting Leachate Concentrations for TAM Sludge Stream*95th Percentile
Child
ChemicalCAS
NumberGroup
Number
LeachateConcentration
(mg/L)
Drinking WaterIngestion HQ or
Risk for theCHILD
Inhalation HazardQuotient or Risk
for Shower -CHILD
Inhalation HazardQuotient or Riskfor Bathroom -
CHILD
Inhalation HazardQuotient or Risk
for Whole House -CHILD
SummedInhalation HazardQuotient or Risk -
CHILD1,2-Diphenylhydrazine 122667 4 0.003 5E-06 4E-08 1E-08 1E-09 5E-08Acetone 67641 1 3.7 1 0.1 0.02 0.0001 0.12Aniline 62533 2 0.02 3E-07 0.9 0.1 0.0009 1Azobenzene 103333 4 0.0086 2E-06 6E-08 2E-08 2E-09 8E-08Benzaldehyde 100527 2 3.7 1 NA NA NA NABenzene 71432 2 0.69 5E-06 6E-06 4E-06 5E-07 1E-05Benzidine 92875 2 0.000013 7E-06 1E-12 3E-13 4E-14 2E-12Bis(2-ethylhexyl)phthalate 117817 5 0.048 4E-08 0.003 0.0005 0.000003 0.0035Bromodichloromethane 75274 6 0.037 6E-06 6E-06 3E-06 3E-07 9E-06Chloroaniline, p- 106478 2 0.15 1 NA NA NA NAChlorobenzene 108907 3 0.0025 0.004 0.7 0.3 0.002 1Chloroform 67663 2 0.026 4E-07 6E-06 4E-06 5E-07 1E-05Cresol, p- 106445 2 0.2 1 NA NA NA NADichlorobenzene, 1,2- 95501 4 0.030 0.009 0.8 0.20 0.002 1Dichlorobenzene, 1,4- 106467 4 0.066 4E-06 0.4 0.1 0.001 0.50Dimethoxybenzidine, 3,3'- 119904 2 0.22 7E-06 NA NA NA NADiphenylamine 122394 4 0.78 0.9 NA NA NA NAEthylbenzene 100414 3 0.12 0.04 0.7 0.3 0.002 1Formaldehyde 50000 1 10 1 2E-06 6E-07 7E-08 3E-06Methyl isobutyl ketone 108101 2 0.029 0.01 0.8 0.2 0.001 1Methylene chloride 75092 6 0.41 8E-06 2E-06 1E-06 1E-07 3E-06Naphthalene 91203 4 0.0021 0.001 0.8 0.2 0.001 1N-N-Dimethylaniline 121697 2 0.1 1 NA NA NA NAN-nitrosodiphenylamine 86306 4 0.37 4E-06 2E-07 5E-08 6E-09 3E-07
(continued)Note - Shading indicates risk-limiting exposure route. Not all constituents are included at present because of business confidentiality concerns

F-23
Appendix F
ChemicalCAS
NumberGroup
Number
LeachateConcentration
(mg/L)
Drinking WaterIngestion HQ or
Risk for theCHILD
Inhalation HazardQuotient or Risk
for Shower -CHILD
Inhalation HazardQuotient or Riskfor Bathroom -
CHILD
Inhalation HazardQuotient or Risk
for Whole House -CHILD
SummedInhalation HazardQuotient or Risk -
CHILD
Table F-11. (continued)
Phenol 108952 2 .057 0.03 0.9 0.2 0.0009 1Phenylenediamine, o- 95545 1 0.07 8E-06 NA NA NA NAPhenylenediamine, p- 106503 1 7 1 NA NA NA NAPyridine 110861 2 0.03 0.8 0.9 0.2 0.001 1Toluene 108883 3 0.053 0.008 0.70 0.3 0.002 1Toluidine, o- 95534 2 0.013 7E-06 1E-07 3E-08 3E-09 1E-07Toluidine, p- 106490 2 0.016 7E-06 NA NA NA NATrichlorobenzene, 1,2,4- 120821 4 0.034 0.1 0.8 0.2 0.001 1Xylene, m- 108383 3 63 1 NA NA NA NAXylene, o- 95476 3 63 1 NA NA NA NAXylenes (total) 1330207 3 0.051 0.0008 0.7 0.3 0.002 1
Note - Shading indicates risk-limiting exposure route. NA - Not Applicable because the concentration was > 1,000,000 mg/kg.

Appendix H
Sensitivity Analysis for theGroundwater Pathway

Appendix H
H-3
Appendix H
Sensitivity Analysis for theGroundwater Pathway
H.1 Introduction
The purpose of the groundwater pathway sensitivity analysis is to identify the mostsensitive parameters in the exposure and risk calculations, and their corresponding high-end andcentral tendency values for the subsequent deterministic analysis. The sensitivity of individualparameters is defined as the difference, or ratio, in predicted health risk when the parameter is setto its high-end value compared to the risk corresponding to the central tendency value of thatparameter. The high-end value of a parameter corresponds to its 90th percentile value or its 10th
percentile value, depending on whether a high or a low value of that parameter results in a moreconservative (higher) predicted risk. If data are limited to define the probability distribution of aparameter, the high-end may be set to either the maximum or minimum measured value. Thecentral tendency value corresponds to the 50th percentile (median) value of the parameter.
Section H.2 identifies and examines important parameters in the exposure and riskcalculations. Section H.3 describes the surrogate selection process. Section H.4 describes theapproach for the sensitivity analysis. Section H.5 presents and discusses the sensitivity analysisresults.
H.1.1 Identification and Description of Important Parameters
The various parameters can be grouped into constituent-related parameters, waste- andWMU-related parameters, pathway-related parameters, and intake-related parameters. Thisdiscussion does not include all parameters in the groundwater model or in the exposure and riskequations, but is restricted to those that are expected to be among the most sensitive parameters.
H.1.1.1 Constituent-Related Parameters. The most important parameters in this groupare
# Concentration of constituent in the waste
# Concentration of constituent in the leachate

Appendix H
H-4
# Organic carbon partition coefficient (for organics) or the solid-liquid partitioncoefficient (for metals and inorganics)
# Transformation (hydrolysis) half-life.
In this analysis, the constituent-specific waste concentration is not an independentvariable; rather, it is the quantity that is backcalculated. Under conditions of linear equilibriumpartitioning, the leachate concentration is directly related to the waste concentration, as describedin the methodology for the screening analysis. As a result, the leachate concentration is also notan independent parameter and is not considered in the sensitivity analysis. This leaves partitioncoefficient (kd) or organic carbon partition coefficient (koc), and the hydrolysis half-life as theconstituent-specific parameters to be considered in the sensitivity analysis.
For organic constituents, the product of the constituent-specific koc and the fractionorganic carbon in the waste equals the solid-liquid partition coefficient, kd, which determines therelative amount of constituent that is sorbed to the solid fraction of the waste, relative to theamount present in the leachate. For inorganic constituents, including metals, the effective kd maymore strongly depend on factors other than organic carbon, including groundwater pH.
H.1.1.2 Waste and Landfill-Related Parameters. The significant parameters in thiscategory are
# Landfill surface area# Infiltration rate through the landfill# Landfill operating life# Annual waste amount# Fraction of landfill occupied by dye and pigment industry wastes.
The product of landfill area and infiltration rate equals the annual volumetric leachate fluxthrough the landfill. The product of leachate flux times leachate concentration equals the annualmass of constituent that is released into the subsurface. For a given landfill area, a higherinfiltration rate will mean a higher loading of contaminant into the soil and groundwater, but alsoa more rapid depletion of the constituent in the landfill. Assuming a uniform landfill design(earthen cover, no liner), the infiltration rate is controlled by climatic factors (i.e., it will varydepending on the geographic location of the waste management unit).
The landfill operating life, the annual quantity of filter aid waste, and the fraction of landfillvolume that is occupied by wastes from the dye and pigment industry affect the total amount ofwaste that accumulates in the waste unit. Landfill operating life is not varied in the sensitivityanalysis because 30 years has been defined as the average operating life for municipal landfills(U.S. EPA, 1988). Conversely, there is considerable uncertainty and variation in the annual wastequantity; therefore, this parameter is examined in the sensitivity analysis. The fraction of thelandfill volume that is occupied by dye and pigment industry wastes is calculated using the 30-yearwaste amount, waste density, landfill area, and landfill depth.

Appendix H
H-5
H.1.1.3 Groundwater Pathway-Related Parameters. The most important parametersaffecting dilution and attenuation in the soil and groundwater include:
# Soil type and soil characteristics (including saturated conductivity and watercontent)
# Depth to groundwater
# Saturated zone thickness
# Aquifer hydraulic conductivity
# Hydraulic gradient
# Distance to nearest receptor well
# Depth of well intake point
# Position of well relative to plume centerline.
In support of the 1995 HWIR proposal, a methodology and database were developed torelate a number of the most important soil and groundwater parameters to waste unit location(U.S. EPA, 1997a and 1997b). These location-dependent parameters are: (1) depth togroundwater, (2) saturated zone thickness, (3) aquifer hydraulic conductivity, and (4) hydraulicgradient. These data will be used for this modeling analysis to determine the value of each ofthese parameters at each facility location modeled. Whereas distance to nearest receptor well andposition of the well relative to plume centerline are examined in the sensitivity analysis, depth ofwell intake point is not included. There can be significant differences in groundwaterconcentration at different depths below the water table. However, the depth at which themaximum concentration occurs varies according to well location and the hydrogeologic settingbeing modeled. Therefore, for the sensitivity analysis, the well is placed at the vertical midpointof the plume (determined by the EPACMTP model).
It is important to note that the dilution-attenuation of waste constituents in thegroundwater pathway depends strongly on the pathway-related parameters identified above andon the constituent-specific sorption (kd or koc) parameters and hydrolysis transformation rate. Theeffect of sorption (high koc or kd) will be to retard the movement of constituents relative to therate of groundwater movement, thereby increasing the travel time through both the unsaturatedzone (from the base of the landfill to the water table) and the saturated zone to the receptor well.
For constituents that do not hydrolyze, the primary effect of this retardation will be todelay the time of maximum exposure. For relatively large waste volumes (in which contaminanttransport approaches steady-state conditions), the magnitude of the exposure at the receptor wellis less affected. For smaller waste volumes, such as those being examined in this analysis, themagnitude of the exposure at the receptor well may be significantly affected by retardation. Forconstituents that do hydrolyze, increased travel time means that a greater proportion of the

Appendix H
H-6
constituent mass will have transformed before it reaches the receptor well, which may result inlower exposure and risk (although the risk associated with toxic transformation daughter productsmay be increased). Thus, the relative sensitivity of depth-to-groundwater and distance-to-receptor well may be markedly different for different constituents.
H.1.1.4 Intake-Related Parameters. Parameters in this category include:
# Exposure duration (for carcinogens only)# Exposure frequency# Groundwater intake (ingestion) rate# Body weight.
The intake equation is a linear algebraic equation that allows the evaluation of the effect ofvariations in the above parameters directly without requiring a sensitivity analysis. For instance, ifall other factors remain constant, a doubling of the ingestion rate will lead to a doubling of therisk. Moreover, the parameters in this group act independently of any of the other parametersdiscussed before (all of which affect the exposure concentration) and are also independent of theconstituent being analyzed (with the exception of exposure duration, which is applicable forcarcinogens only).
H.2 Selection of Surrogates for Organic Constituents
Because of the large number of constituents of concern, constituents are grouped based onsubsurface fate and transport characteristics. Then one representative constituent from eachcategory is modeled. The modeled constituent in each category is called a surrogate. Thus, themodeling results for the surrogate can then be applied to each constituent in that category. Themethodology for grouping the constituents and choosing the surrogates is described briefly belowand in greater detail in Appendix C.
H.2.1 Basis for Grouping of Organic Constituents
The constituent list for the Dyes and Pigments Deferred Wastes (Table C1 in Appendix C,Selection of Surrogates) contains a total of 53 organic constituents and 11 inorganics. Thenumber of modeling runs required to model these constituents in the sensitivity analysis wasminimized by exploiting the following features:
# For a given waste management scenario, if two organic constituents have the samewaste and leaching concentrations and the same sorption and hydrolysis ratecoefficients, the model will predict the same receptor well exposure concentration.
# If two organic constituents have the same receptor well exposure concentration,their waste and leachate concentration thresholds will be linearly proportional totheir respective health-based level (HBL) values.

Appendix H
H-7
Combined, these two features make it possible to group constituents based on subsurfacefate and transport characteristics rather than requiring a separate modeling run for each individualconstituent on the list.
For computational efficiency, average transformation rate, 8, is calculated for eachconstituent, constituents are categorized according to their 8 and KOC values, and then themodeling is conducted for one representative constituent in each category. The modeledconstituent in each category is called a surrogate. The modeling results for the surrogate can thenbe applied to each constituent in that category.
H.3 Modeling Methodology
The following sections present the technical approach used to identify the pertinent high-end parameters for each surrogate. The approach is based on the fact that constituents that havethe same or similar sorption (KOC or Kd) and transformation (hydrolysis) characteristics will showthe same or similar parameter sensitivity.
H.3.1 Modeling Methodology for Sensitivity Analysis
The selection of a surrogate for each group is described in Appendix C. Once arepresentative compound from each group was selected, a separate sensitivity analysis wasperformed for each of these surrogates. Only the spent filter aids waste stream was evaluated inthis analysis; that is, a separate sensitivity analysis was not performed for the TAM sludges wastestream. Because of the similarity between these two waste streams, the sensitivity analysis resultsfor the filter aids waste stream can be applied to the TAM sludges waste stream. However, in thenext phase of modeling—the deterministic analysis—the modeling was performed separately forfilter aids and TAM sludges.
The following waste, landfill, and groundwater pathway-related parameters were includedin the sensitivity analysis for each surrogate:
# Annual waste amount
# Landfill area
# Waste unit location, which includes:- Infiltration and recharge rate- Soil type and properties- Depth to groundwater- Saturated zone thickness- Aquifer hydraulic conductivity- Hydraulic gradient
# Distance to receptor well (X-well)
# Distance of receptor well from the plume centerline (Y-well).

Appendix H
H-8
These parameters were varied between high-end and central tendency values to determinethe parameter sensitivity. EPACMTP input parameters other than those identified above were setto their respective central tendency values in all modeling runs.
The waste unit location, treated as one parameter in the analysis, defines a number ofclimatic and hydrogeologic model parameters that are all correlated to the geographic location ofthe waste unit. The high-end and central tendency waste unit locations for the filter aid wastestream were determined by evaluating the geographic distribution of the existing facilities. Underthe assumption that wastes would be sent to a nearby municipal landfill, the climatic (infiltrationrate), soil, and hydrogeologic characteristics for each waste site location were then determinedusing the methodology and databases developed in support of the 1995 HWIR groundwaterpathway analysis (U.S. EPA, 1997a and 1997b).
For the filter aids waste stream, the high-end waste unit location corresponds to a landfilllocated in the vicinity of __________*. Conversely, the central tendency location corresponds toa landfill in the vicinity of __________*. For the TAM sludges waste stream, there is only onefacility, which is located in Jersey City, NJ.
In all analyses, the initial waste concentration was set to an arbitrary value of10,000 mg/kg. It is assumed that the operational life of the landfill is 30 years (U.S. EPA, 1988). Based on preliminary modeling using RTI’s landfill partitioning model, the leaching profile foreach of the surrogates approximates a square pulse of approximately 40 years. Thus, theEPACMTP modeling is conducted by assuming that the waste in the landfill leaches out inuniform fashion over 40 years, with a constant leachate concentration that is determined based onmass balance considerations and so that all the waste constituent mass is leached out after 40years. No hydrolysis transformation inside the landfill is considered.
In the EPACMTP model, receptor well concentration is defined as the concentration atthe well intake point, not an average concentration over the screened interval of the well. Because of the three-dimensional nature of the transport problem, the concentration varies in thevertical direction as well in the horizontal directions. Figure H-1 shows the concentration at thereceptor intake point versus the distance from water table (Z-well) for the filter aids surrogate 1(KOC = 0, 8 = 0.0). Note that the aquifer thickness is 18.6 m. This figure shows that the receptorwell concentration for the high-end X-well case (X-well = 102 m, Y-well = 94 m) could be eithersmaller or larger than the central tendency X-well case (X=430 m, Y=118 m) depending on thevalue chosen for Z-well. However, by definition, the receptor well concentration for the high-endcase should be larger than that for the central tendency case. Additionally, domestic drinkingwater wells are generally relatively shallow due to the increased cost of drilling a deeper well. Therefore, for these reasons and to be protective when performing the risk assessment, thereceptor well intake point is set equal to vertical midpoint of the plume. For the sensitivityanalysis, Z-well = 1.8 m below the water table for the high-end location and Z-well = 8.65 m forthe central tendency case. In other runs in the sensitivity analysis, the well varies between
approximately 5 and 10 m below the water table depending on well location and landfillcharacteristics.

Appendix H
H-9
0.00
0.01
0.02
0.03
0.04
0.05
0.06
0.07
0 5 10 15 20
Distance Below Water Table (m)
Wel
l Int
ake
Con
cent
ratio
nHigh-end X (X=102 m, Y=94 m)
CT Case (X=430 m, Y=118 m)
Figure H-1. Concentration profile throughout the aquifer thickness.
The modeling for the sensitivity analysis is evaluated in terms of the predicted receptorwell exposure concentration, which is calculated as the peak receptor well concentration andmaximum 9- and 30-year average receptor well concentrations. For constant intake parameters,the health risk is directly proportional to the exposure concentration. The sensitivity to otherintake parameters (exposure duration, exposure frequency, ingestion rate, body weight) can bedetermined directly, as discussed previously, and these parameters do not need to be considered inthe EPACMTP modeling runs.
H.3.2 Summary of Simulation Procedure
The sensitivity of individual parameters is defined as the difference, or ratio, in predictedhealth risk when the parameter is set to its high-end value, compared to the risk corresponding tothe central tendency value of that parameter. The high-end value of a parameter corresponds toits 90th percentile value or its 10th percentile value, depending on whether a high or a low value ofthat parameter results in a more conservative (higher) predicted risk. If there is limited data todefine the probability distribution of a parameter, the high end may be set to either the maximumor minimum measured value. The central tendency value corresponds to the 50th percentile(median) value of the parameter.
The sensitivity analysis is conducted by performing a number of modeling runs for eachchosen surrogate. First, all parameters were set to their central tendency values. Then, one at atime, each parameter was set to its high-end value while all the other parameters remained at theircentral tendency values. These values and the data sources are presented in Table H-1. Thesemodeling results are tabulated, and the parameters evaluated, including intake parameters, areranked in order of sensitivity for each group of constituents. Additionally, the two most sensitiveparameters are identified for use in the subsequent deterministic analysis.

Appendix H
*Relevant data are not included at present because of business confidentiality concerns.
H-10
DAF WASTE'CW
CRW
(H-1)
H.4 Modeling Results of Sensitivity Analysis
Following the procedures outlined above, the sensitivity analysis was conducted for thefilter aids waste stream. The modeling results are presented in terms of the DAFWASTE, which isdefined as follows:
where
DAFWASTE = waste dilution-attenuation factor (L/kg)CW = waste concentration (mg/kg)CRW = receptor well concentration (mg/L)
The exit levels for the dyes and pigments industry wastes are defined in terms of initialwaste concentration. Therefore, the DAF is also formulated in terms of waste concentration(rather than leachate concentration, as is usually done). Thus, the DAFWASTE, when multiplied bythe constituent-specific Health-Based Number (HBN), produces the desired threshold wasteconcentration.
The DAFWASTE can be defined for the peak receptor well concentration or for the maximum9-year or 30-year average well concentration; depending upon whether a constituent is acarcinogen or noncarcinogen, the peak or the average receptor well concentration will be ofinterest. Because for all the surrogates for the filter aid waste stream the leachate concentrationprofiles follow a square pulse with a duration of 40 years and dispersion is not strong comparedto advection, there is negligible difference between the peak, the maximum 9-year average, andthe maximum 30-year average receptor well concentrations. This is confirmed by thebreakthrough curves, presented in Figures H-2 and H-3, recorded at the receptor well for thecentral tendency case of surrogates 1 and 5, respectively. The difference between the twosurrogates lies solely in their KOC values, which control the retardation factor for each constituent. Surrogate 1 has a KOC value of ___* L/kg, whereas surrogate 5 has a KOC value of ____* L/kg,the highest among the seven surrogates. Figure H-2 shows that, for a constituent with a low KOC
value, the peak and “T”-year average receptor well concentrations are almost identical for valuesof “T” less than or equal to 30 years.

H-11
Appendix H
Table H-1. Values for EPACMTP Input Parameters
EPACMTP Input Parameter High-End ValueCentral
Tendency Value Data Source
Waste Management Scenario:
CW/CL ratio
Landfill Area (m2)
Initial Leachate Concentration (CL) (mg/L)Regional Recharge Rate (m/yr) Infiltration Rate through Landfill (m/yr)Landfill Depth (m)FractionWaste density (kg/L)
Constituent-specific
HE1 = 420,888HE2 = 8,090
Derivedb
b
2.63Derived____b
Constituent-specific
60,705
Derivedb
b
2.63Derived____b
Derived from CW and CL
(CW = 10,000 mg/kg)EPA Survey of municipal landfills
HE1 = 90th %; HE2 = 10th % U.S. EPA, 1988
Determined from source partitioning modelSet equal to infiltration
HELP modeling analysis for HWIR 1995EPA OSW survey, 50% for Industrial LF
Derived from waste amt, LF area, depth, density
Chemical-Specific Parameters:
Hydrolysis rate (yr-1)Koc (L/kg)Exposure duration (yr)
Constituent-specificConstituent-specific
30
Constituent-specificConstituent-specific
9
Kollig et al., 1993Kollig et al., 1993U.S. EPA, 1997
Note: Parameters in bold face are varied in Sensitivity and High-End Deterministic Analyses.
(continued)

H-12
Appendix H
EPACMTP Input Parameter High-End ValueCentral
Tendency Value Data Source
Table H-1. (continued)
Unsaturated Zone Parameters:
Sat. hydraulic conductivity (cm/h)Hydraulic parameter, "" (cm-1)Hydraulic parameter, $$Residual water contentSaturated water contentDepth to groundwater (m)Organic matter content (%)Bulk density (g/cm3)
b
b
b
b
b
bb
1.60
b
b
b
b
b
bb
1.60
Carsel & Parrish, 1988Carsel & Parrish, 1988Carsel & Parrish, 1988Carsel & Parrish, 1988Carsel & Parrish, 1988
U.S. EPA, 1997a and 1997bCarsel et al., 1988Carsel et al., 1988
Saturated Zone Parameters:
Particle diameter (cm)Saturated thickness (m)Hydraulic conductivity (m/y)Hydraulic gradient (m/m)Longitudinal dispersivity (aL)Transverse dispersivity (aT)Vertical dispersivity (aV)Groundwater temperature (EC)Groundwater pHFraction organic carbon
0.025b
b
b
DerivedDerivedDerived
14.46.8
0.000432
0.025b
b
b
DerivedDerivedDerived
14.46.8
0.000432
U.S. EPA, 1997a and 1997bU.S. EPA, 1997a and 1997bU.S. EPA, 1997a and 1997bU.S. EPA, 1997a and 1997b
Gelhar distribution, U.S. EPA, 1997a and 1997bDerived from aL
Derived from aL
U.S. EPA, 1997a and 1997bU.S. EPA, 1997a and 1997b
EPA STORET database
Receptor Well Location:
X-well distance (m)Y-well distance from plume center-line (m)Z-well distance below water table (m)
1020.01.8
430117.758.65
U.S. EPA, 1997a and 1997bHE = 0
CT = calculated from estimated plume widthvertical center of plume (determined by EPACMTP)
aHigh-end location corresponds to a waste unit located in __________b; central tendency location corresponds to a waste unit located in __________b.bRelevant data are not included at present because of business confidentiality concerns.

Appendix H
*Relevant data are not included at present because of business confidentiality concerns.
H-13
Figure H-2. Breakthrough curve at receptor well: surrogate 1 (KOC=___ *, 88 =0), central tendency case.
Figure H-3. Breakthrough curve at receptor well: surrogate 5 (KOC=_____*, 88 =0), central tendency case.

Appendix H
H-14
Figure H-2 illustrates that, for a constituent with a high KOC value, the peak and 9-yearaverage concentrations are still identical, although the 30-year average concentration may differslightly. Similar conclusions can be drawn concerning other surrogates and high-end parametercases. For this reason, only the DAFWASTE results associated with the 9-year average receptor wellconcentrations are presented here, with the implicit assumption that the DAFWASTE associated withpeak and 30-year average receptor well concentrations is the same as that associated with the 9-year average receptor well concentration.
The chemical-specific values and the results of the central tendency analysis are presentedin Table H-2. All parameters examined in the sensitivity analysis are set to their median values forthe central tendency case. For each surrogate, one parameter at a time is set to its high-end value. The central tendency DAFWASTE values are then compared to each high-end case. Each high-endrun should result in a higher receptor well concentration, and thus a lower DAFWASTE, than thecentral tendency case for that surrogate. The two most sensitive modeling parameters are theparameters whose high-end runs result in the lowest DAFWASTE values. The DAFWASTE valuesfrom the high-end runs are presented in Table H-3, and the DAFWASTE values for the two mostsensitive parameters are highlighted in bold text. A list of the two most sensitive modelingparameters for each surrogate is presented in Table H-4.
Table H-2. Surrogate Characteristics and Resulting DAFWASTE for Central Tendency Case
Group Surrogate KOC (L/kg) l (yr-1)DAFWASTE (L/kg)
Central Tendency Case
1 1 _____a _____a _____a
2 2 _____a _____a _____a
3 3 _____a _____a _____a
4 4 _____a _____a _____a
5 5 _____a _____a _____a
7 6 _____a _____a _____a
12 7 _____a _____a
_____a
aRelevant data are not included at present because of business confidentiality concerns.

Appendix H
H-15
Table H-3. Resulting DAFWASTE (L/kg) for One-Parameter High-End Cases
Surrogate
10%Landfill
Area
90%Landfill
AreaWaste
Amount Location X-well Y-well
1 _____a _____a _____a _____a _____a _____a
2 _____a _____a _____a _____a _____a _____a
3 _____a _____a _____a _____a _____a _____a
4 _____a _____a _____a _____a _____a _____a
5 _____a _____a _____a _____a _____a _____a
6 _____a _____a _____a _____a _____a _____a
7 _____a _____a _____a _____a _____a _____a
aRelevant data are not included at present because of business confidentiality concerns.
Table H-4. Most Sensitive Modeling Parameters
SurrogateFirst Most SensitiveModeling Parameter
Second Most SensitiveModeling Parameter
1 Waste amount X-well
2 Waste amount X-well
3 Waste amount X-well
4 Waste amount X-well
5 Waste amount X-well
6 Waste amount X-well
Note that two values of landfill area were examined in the sensitivity analysis. A largerlandfill area usually results in higher receptor well concentrations; however, for this analysis, onlya small fraction of the waste in the landfill is from filter aids. Using the 90th percentile value forlandfill area results in increased dilution of the leachate plume from the filter aid wastes withleachate from the rest of the landfill, thus resulting in a lower receptor well concentration. Usingthe 10th area actually produces higher receptor well concentrations because the fixed amount offilter aid waste added to the landfill results in more concentrated source plume. This is also partly

Appendix H
H-16
due to the choice of Y-well location. Except for the high-end Y-well case, Y-well is always setmidway between plume centerline and the estimated lateral boundary of the plume. The smallerthe landfill area is, the closer the receptor well is to the plume centerline where groundwaterconcentrations are generally higher.
For surrogates 1 through 6, waste amount is the most sensitive modeling parameter andthe downgradient distance of the receptor well is the second most sensitive modeling parameter. Varying the waste amount to its high-end value resulted in decreasing the DAFWASTE by a factor ofabout 10, and varying X-well to its high-end value resulted in a decrease in the DAFWASTE by afactor of almost 3. There is an inverse linear relationship between DAFWASTE and exposure risk,so when the DAF is decreased by a factor of 10, risk is increased by a factor of 10.
However, the sensitivity analysis must include evaluation of both modeling parameters andintake-related parameters. Since the risk equation is linear, these intake parameters can beevaluated directly without the use of groundwater modeling. The most sensitive of the intake-related parameters is exposure duration, but this parameter is applicable only to carcinogens. Increasing the exposure duration (from 9 to 30 years) for carcinogens increases risk by slightlymore than a factor of 3. Because increasing the waste amount increases risk by a factor of 10,this modeling parameter is, overall, the most sensitive. However, increasing the exposureduration results in a slightly higher increase in risk than using the high-end value for X-well. Thus, for carcinogens, the two most sensitive parameters are waste amount and exposureduration; for noncarcinogens, the most sensitive parameters are waste amount and X-well. Notethat these results were taken to apply to both the spent filter aids waste stream and the TAMsludges waste stream.
For surrogate 7, the hydrolysis rate (8) is so high that even in the central tendency case, allof this constituent is transformed before it reaches the receptor well. For this reason, surrogate 7was not included in the rest of the sensitivity analysis modeling.
H.5 References

Appendix H
H-17
Carsel, Robert and Rudolph Parrish. 1988. Developing joint probability distributions of soil waterretention characteristics. Water Resources Research, 25, (5):755-769.
Carsel, Robert, et al. 1988. Characterizing the uncertainty of pesticide leaching in agriculturalsoils. Journal of Contaminant Hydrology, 2:111-124.
Kollig, Heinz, editor. 1993. Environmental Fate Constants for Organic Chemicals underConsideration for EPA’s Hazardous Waste Identification Projects. EnvironmentalResearch Laboratory, Office of Research and Development, U.S. EnvironmentalProtection Agency, Athens, GA.
Loux, N. T., C. R. Chafin, and S. M. Hassan. 1990. Statistics of Aquifer Material Properties andEmpirical pH-dependent Partitioning Relationships for As (III), As (V), Ba(II), Cd(II),Cr(VI), Cu(II), Hg(II), Ni(II), Pb(II), Sb(V), Se(IV), Tl(I), and Zn(II). Office of Researchand Development, U.S. Environmental Protection Agency, Athens GA.
U.S. EPA (Environmental Protection Agency). 1997a. EPA's Composite Model for LeachateMigration with Transformation Products (EPACMTP) User's Guide. Office of SolidWaste, Washington, DC.
U.S. EPA (Environmental Protection Agency). 1997b. Analysis of Subtitle D WasteManagement Units Databases Used in the Groundwater Pathway Analysis for HWIR. Office of Solid Waste, Washington, DC.
U.S. EPA (Environmental Protection Agency). 1996a. EPA's Composite Model for LeachateMigration with Transformation Products (EPACMTP) Background Document. Office ofSolid Waste, Washington, DC.
U.S. EPA (Environmental Protection Agency). 1996b. EPA's Composite Model for LeachateMigration with Transformation Products (EPACMTP) Background Document for theFinite Source Methodology. Office of Solid Waste, Washington, DC.
U.S. EPA (Environmental Protection Agency). 1996c. EPA's Composite Model for LeachateMigration with Transformation Products (EPACMTP) Background Document for Metals.Office of Solid Waste, Washington, DC.
U.S. EPA, 1993. Parameter Values for EPA’s Composite Model for Landfills (EPACML) Usedin Developing Nationwide Regulations: Toxicity Characteristic Rule. Office of SolidWaste, Washington, DC.
U.S. EPA (Environmental Protection Agency). 1988. National Survey of Solid Waste(Municipal) Landfill Facilities, EPA/530-SW-88-034. Office of Solid Waste,Washington, DC.

Appendix I
Groundwater Pathway DeterministicAnalysis for Metals

Appendix I
I-3
I.1 Introduction
The U. S. Environmental Protection Agency (EPA) analyzed samples from a few facilitiesfor metals, but dropped metals from its list of constituents of concern due to the inability to linkthem directly to production of organic dyes and pigments. EPA found no reported use of metalsin any significant quantity in the production process for the organic dyes and pigments underinvestigation, except for three metals (the identities are not included due to businessconfidentiality concerns). The metal of most potential concern (the identity is not included due tobusiness confidentiality concerns) has limited use in the production of organic dyes and pigments. However, the metal is also widely found in wastewaters and wastewater treatment sludges due toits many and varied industrial uses. Nevertheless, a preliminary deterministic risk analysis forselected metals has been conducted to confirm that these metals are not likely to be of concern inthese wastes. The deterministic analysis of metals is described in this section.
In the sensitivity analysis, the metals evaluated were assigned to the appropriate organicsurrogate group based on their respective calculated “effective” Koc values (Appendix D). For thedeterministic analysis, results of the sensitivity analysis are applied to the metals and thedeterministic modeling for metals was conducted in a manner similar to the sensitivity analysis fororganics.
I.2 Modeling Methodology
I.2.1 Geochemical Characteristics of Metals
The fate of metals in the subsurface is governed by a number of transport mechanismssuch as advection, dispersion, and retardation due to sorption. Advection and dispersion aremechanical processes that do not generally depend on the type of solute. However, theadsorption of metals onto the subsurface soil and aquifer matrix is metal-specific and is expressed,in EPACMTP modeling, in terms of an adsorption distribution coefficient (Kd). The metalsmodeling methodology in EPACMTP assumes that the rate of adsorption reactions is fast relativeto transport rate and that the result of the adsorption process can be described by equilibriumadsorption isotherms.
The metals modeling methodology in EPACMTP incorporates two options to specify theKd for a given metal. Adsorption isotherms for metals with nonlinear sorption behavior arecomputed using U.S. EPA’s geochemical speciation model, MINTEQA2 (Allison et al., 1991);and the isotherms for metals with linear adsorption behavior are pH-dependent and defined byempirical relationships (Loux et al., 1990). The two approaches for calculating the Kd values aredescribed briefly below; more detailed information can be found in U.S. EPA (1996c and 1997a).
In the first approach, the purpose of using a speciation model is to capture the variation inKd due to variability in geochemical conditions in the soil and due to the changing dissolved metalconcentrations. The four geochemical parameters on which adsorption primarily depends are:groundwater pH, concentration of hydrous ferric oxide adsorption sites, concentration ofdissolved and particulate natural organic matter, and concentration of leachate organic acids. Forthe MINTEQA2 modeling, the natural variability of these parameters is divided into three ranges:

Appendix I
I-4
low, medium, and high. Each parameter is then assigned three possible values that correspondapproximately to the midpoint of each range. For each metal with nonlinear adsorption, theMINTEQA2 model is then run over a range of total metal concentrations to produce an isothermfor each combination of the three possible values for the four geochemical parameters. For eachmetal, the 162 isotherms produced in this way are then written to a data file that must accompanythe input file when conducting EPACMTP modeling. EPACMTP then selects the appropriateisotherm based on the input values specified for the four geochemical parameters.
To perform geochemical modeling with MINTEQA2, one must know the adsorptionreactions describing the interaction of the metal with the adsorbing surface. For several metals ofconcern, primarily those that behave as anions in aqueous solution, these reactions are not reliablyknown. Because the MINTEQA2 model cannot be used due to this lack of data, empirical linearrelationships describing the adsorption distribution coefficient as a function of pH are usedinstead. The pH-dependent isotherms are determined through statistical analysis of laboratorymeasurements of soil and aquifer materials and corresponding groundwater and leachate samples(Loux et al., 1990). These isotherms are included in the EPACMTP code, and the appropriate Kd
value is calculated based on the input value specified for groundwater pH.
Table I-1 provides a summary of the geochemical characteristics of each metal to beconsidered in the deterministic modeling. Note that all metals are noncarcinogens except arsenic,which is a carcinogen. Figure I-1 illustrates the sorption isotherms for the metals with nonlinearisotherms. It shows that lead, vanadium, copper, and zinc are the metals that are most stronglysorbed. Shown here are graphs of Kd versus dissolved concentration for six metals with nonlinearadsorption with the geochemical parameters set to the values used in the deterministic analysis.
I.2.2 Leachate Profiles for Metals
Figures I-2 and I-3 show variations of leachate concentrations with time for the eightmetals in the spent filter aids waste stream for the central tendency case and high-end wasteamount case, respectively. Figure I-4 illustrates the variations of leachate concentrations withtime for the eight metals in the TAM sludges waste stream. No high-end waste amount isapplicable to the TAM sludges because only one waste volume was modeled. In these figures, theleachate concentration increases during the first 30 years, which is equal to the landfill operationallife, and then gradually decreases after that.

Appendix I
I-5
Table I-1. Geochemical Characteristics of Metals
MetalEPACMTP
Metal IDType of
Sorption IsothermType of
Health Impact
As 13 Linear Carcinogen
Ba 1 Nonlinear Noncarcinogen
Cr(VI) 3 Linear Noncarcinogen
Cu 9 Nonlinear Noncarcinogen
Ni 5 Nonlinear Noncarcinogen
Pb 6 Nonlinear Noncarcinogen
V 10 Nonlinear Noncarcinogen
Zn 8 Nonlinear Noncarcinogen
I.2.3 Construction of Effective Finite Leachate Source Models
The modified EPACMTP model used to simulate organic constituents with arbitrary leachatehistory cannot be applied to modeling of metals with nonlinear isotherms. For these metals, theEPACMTP model cannot simulate a depleting source; the available options are continuous or finitepulse source leaching. Thus, an “effective” finite leachate source is used for the metals depicted inFigures I-2, I-3, and I-4.
Because metals are highly adsorbed, the travel time to the receptor well is expected to bemuch longer than that for the organic constituents. Figures I-2, I-3, and I-4 show that the initialperiod of 30 years in which the leachate concentration increases is small compared to the entireleaching period (typically hundreds of years). Additionally, these figures show that the leaching after30 years follows an exponential decay curve. This observation is confirmed by Figures I-5 and I-6in which the leachate profiles (after 30 years) for lead and copper (filter aids waste stream, centraltendency waste amount) have been plotted on a logarithmic scale. These figures show that the log(CL) versus time falls on a straight line. Lead and copper were chosen because they represent twoextreme cases in Figure I-2.
To use the existing metals finite source option in the EPACMTP model, two criticalparameters need to be specified: (1) the finite source ratio Cw/CL
0 (waste concentration over initialleachate concentration), and (2) the initial leachate concentration, CL
0. The value of CL0 was
chosen to be the leachate concentration 1 year after the end of the landfill operational life; that isat a time of 31 years. This CL
0 would correspond to the initial value in Figures I-5 and I-6 or theinitial concentration in the decaying part of the curve in Figures I-2, I-3, and I-4. To

Appendix I
*Relevant data are not included at present because of business confidentiality concerns.
I-6
Figure I-1. Nonlinear isotherms for metals.*

Appendix I
*Relevant data are not included at present because of business confidentiality concerns.
I-7
Figure I-2. CT leachate concentration for metals in filter aids waste stream.*
Figure I-3. HE leachate concentration for metals in filter aids waste stream.*
Figure I-4. CT leachate concentration for metals in filter aids waste stream.*
Appendix I
*Relevant data are not included at present because of business confidentiality concerns.
I-8
Figure I-5. Leachate concentration for lead on a semi-log scale.*(initial 30-year period omitted)
Figure I-6. Leachate concentration for lead on a semi-log scale.*(initial 30-year period omitted)

Appendix I
I-9
−= t
CCPdF
ICC
LwhwhLL
)/(exp
00
bI
dF P C Ch hw w L
= −( / )0
CC
Id F P b
W
L h h w
= −
evaluate the ratio Cw/CL0, a comparison is made between the log CL versus time with the physical
depletion model (U.S. EPA, 1996a):
(I-1)
where
I = infiltration rate (m/yr) d = depth of waste unit (m)Fh = volume fraction of waste unit that contains the waste of concernPhw = density of waste (g/cm 3).
The slope, b, in the graph of log CL versus time should be equal to the bracketed term above:
(I-2)
Thus, the ratio Cw/CL0 can be calculated by rearranging Equation I-2:
(I-3)
where b (< 0.0) can be readily found from the leachate data, and the other parameters are allknown a priori. The CL
0 and Cw/CL0 values obtained in this manner guarantee that the finite
source modeling preserves the total leachate mass in the original leachate data, assuming that themass leached out during the first 30 years is negligible.
For arsenic and chromium, the two metals with linear sorption isotherms, the modelingmethodology is the same as for organic constituents. The CL
0 and Cw/CL0 calculated above are
used as the initial leachate concentration and finite source ratio. For these two metals with linearadsorption, the landfill depleting source option is employed instead of finite square pulse, which isused for metals with nonlinear isotherms.
Table I-2 presents the resulting CL0 and Cw/CL
0 values for both the central tendency wasteamount and high-end waste amount cases for the filter aids waste stream. Table I-3 shows the CL
0
and Cw/CL0 values for the central tendency waste amount for the TAM sludges waste stream.

Appendix I
I-10
Table I-2. Effective CL0 and Cw/CL
0 for Metals in Filter Aids Waste Stream
MetalIsotherm
Type
CT Waste Amount High-End Waste Amount
CL0 (mg/L) Cw/CL CL
0 (mg/L) Cw/CL
Relevant data are not included at present because ofbusiness confidentiality concerns.
Table I-3. Effective CL0 and Cw/CL
0 for Metals in TAM Sludges Waste Stream
Metal Isotherm Type
CT Waste Amount
CL0 (mg/L) Cw/CL
As Linear 0.2670 29,933
Ba Nonlinear 0.0877 8,988
Cr(VI) Linear 0.0631 127,180
Cu Nonlinear 0.8250 8,755
Ni Nonlinear 0.3552 22,453
Pb Nonlinear 0.0596 134,660
V Nonlinear 0.0537 149,620
Zn Nonlinear 1.3018 5,996

Appendix I
I-11
I.2.4 Summary of Simulation Procedure for Metals
The deterministic analysis for metals consists of two modeling runs for each constituent: acentral tendency run and a two-parameter high-end run. This modeling is conducted as follows:
For each metal, input parameters are set to their appropriate values; these parametervalues are listed in Table I-4. For the central tendency scenario, all input parameters are set totheir central tendency (median) values. For the high-end scenario, the two most sensitiveparameters are set to their high-end values and the remaining input parameters are set to theircentral tendency values. Note that the depth of the receptor well intake point (Z-well) is set equalto the smaller of 5.0 m and half the aquifer thickness. This treatment of Z-well is the same as isused for the deterministic analysis for organics.
For each metal, the appropriate values for CL0 and Cw/CL
0 (as listed in Tables I-2 and I-3)were specified and the leaching duration (TSOURC) is specified to be derived by EPACMTP; thatis, leaching continues until all contaminant mass has been depleted. For metals with a linearisotherm, IBAT is set to 2 (physical depletion); this is the same setting as is used for thedeterministic analysis conducted for organics. For metals with nonlinear isotherm, IBAT is set to0 (finite pulse leaching). EPACMTP is then run to obtain the desired receptor well concentrations(peak and 9-year or 30-year averages).
The peak and appropriate time-averaged groundwater DAFGW are then calculated for eachmetal. For metals that are noncarcinogens, the DAFGW is defined as the ratio of peak leachateconcentration and the peak receptor well concentration. For metals that are carcinogens, theDAFGW is generally defined as ratio of the maximum 9-year average leachate concentration andthe corresponding maximum 9-average receptor well concentration. However, when exposureduration is one of the high-end parameters, the DAFGW is defined as the ratio of the maximum 30-year average leachate concentration and the corresponding maximum 30-average receptor wellconcentration.
1.3 Deterministic Modeling Results and Discussion
Tables I-5 and I-6 summarize the results of deterministic analysis of metals for the filteraids waste stream for the central tendency scenario and the two-parameter high-end scenarios,respectively. Because of the nonlinear nature of the isotherms for many of the metals included inthis analysis, the leachate concentration, receptor well concentration, leaching duration(TSOURC), and peak arrival time are listed in addition to the DAFGW values. Tables I-7 and I-8present these results for the TAM sludges.
After careful examination of Tables I-5 through I-8, one can draw the followingconclusions:

Appendix I
I-12
Table I-4. EPACMTP Input Parameters for Deterministic Modeling of Metals
Filter Aids TAM Sludges
Relevant data are not included at present because of business confidentiality concerns.

Appendix I
I-13

Appendix I
I-14
Table I-5. Results from Central Tendency Analysis for Metals inFilter Aids Waste Stream
Metal TypeCL
a
(mg/L)CRW
(mg/L) DAFGW
Source Duration(years)
Time to Peak(years)
Relevant data are not included at present because ofbusiness confidentiality concerns.
Table I-6. Results From Two-Parameter High-End Modeling for Metals in Filter Aids
Metal Type 2 High-End ParametersCL
a
(mg/L)CRW
a
(mg/L) DAFGW
SourceDuration(Years)
Time toPeak
(Years)
Relevant data are not included at present because of business confidentiality concerns.

Appendix I
I-15
Table I-7. Results from Central Tendency Analysis for Metals inTAM Sludges Waste Stream
Metal TypeCL
a
(mg/L)CRW
a
(mg/L) DAFGW
Source Duration(years)
Time to Peak(years)
Pb NC 5.96E-020.00E+0
0 1.E+30 13,001 10,000b
Ni NC 3.55E-01 2.14E-03 166 2,168 4,354
Ba NC 8.77E-01 6.04E-03 145 868 978
V NC 5.37E-020.00E+0
0 1.E+30 14,445 10,000b
Cu NC1.48E+0
00.00E+0
0 1.E+30 516 10,000b
Zn NC1.30E+0
0 2.81E-04 4,639 579 8,786
As C 2.67E-01 1.18E-03 227 2,890 3,751
Cr (VI) NC 6.31E-02 3.84E-04 165 12,278 2,973
a CLeach and CRW refer to time average for carcinogen (C) and peak values for noncarcinogen(NC).
b Plume never reached receptor well during the 10,000-year simulation period.
Table I-8. Results from Two-Parameter High-End Modeling for Metals in TAM Sludges
Metal Type 2 High-End ParametersCL
a
(mg/L)CRW
a
(mg/L) DAFGW
SourceDuration(years)
Time toPeak
(years)
Pb NC X-well and Y-well 5.96E-020.00E+0
0 1.E+30 13,001 10,000b
Ni NC X-well and Y-well 3.55E-01 9.62E-02 3.7 2,168 3,476
Ba NC X-well and Y-well 8.77E-01 2.38E-01 3.7 868 659
V NC X-well and Y-well 5.37E-020.00E+0
0 1.E+30 14,445 10,000b
Cu NC X-well and Y-well1.48E+0
00.00E+0
0 1.E+30 516 10,000b

Appendix I
I-16
Zn NC X-well and Y-well1.30E+0
0 2.28E-02 57.2 579 6,906
As CX-well and exposure
duration 2.67E-01 7.07E-02 3.8 2,890 3,710
Cr(VI) NC X-well and Y-well 6.31E-02 1.63E-02 3.9 12,278 1,992
aCL and CRW refer to time average for carcinogen (C), and peak values for noncarcinogen (NC).
bPlume never reached receptor well during the 10,000-year simulation period.

Appendix I
I-17
# For the given input parameters, lead, vanadium, and copper are strongly adsorbedunder both central tendency and two parameter high-end cases regardless of thewaste stream considered. None of these three metals reached the receptor wellwithin the 10,000-year simulation period.
# All metals are characterized by long travel times that are directly proportional tothe magnitude of the effective Kd for each metal (compare Figure I-1).
# For a given scenario, the DAFGW values do not vary much with metals except forlead, vanadium, copper, and zinc. Furthermore, for a given scenario, the DAFGW
values of most metals are comparable to those of organics.
# The DAFGW for zinc is always greater than the corresponding DAFGW values fornickel, barium, arsenic, and chromium. This may be explained by the relativelyshorter leaching duration and longer travel time for zinc as compared to that ofnickel, barium, arsenic, and chromium. A longer travel time and shorter leachingduration lead to more rapid dilution of the plume, resulting in larger DAFGW forzinc.
I.4 Risk-Based Concentrations for Metals
Tables I-9 and I-10 present the results from the high-end deterministic analysis.
Table I-9. TAM Results
Constituent CAS No.Kd
(mL/g)
Receptor Well Concentration(adult) (mg/L)
High-EndDAF
EstimatedLeachate
Concentration(mg/L)
Waste Concentration
(mg/kg)
Lead 7439-92-1 900 NA1.E+3
0 NA NA
Nickel 7440-02-0 150 1 3.7 3.7 103,556
Arsenic 7440-38-2 200 0.001 3.8 0.0038 141
Barium 7440-39-3 60 3.5 3.7 12.95 147,098
Chromium VI 7440-47-3 850 0.25 3.9 0.975 153,403
Copper 7440-50-8 35 NA1.E+3
0 NA NA
Vanadium 7440-62-2 1000 0.351.E+3
0 NA NA
Zinc 7440-66-6 40 15 57.2 858 >1,000,000

Appendix I
I-18
NA = Not applicable.
Note: Arsenic is treated as a carcinogen and two high ends are X-well distance and exposureduration. All other constituents are noncarcinogens and two high ends are X-well distance andY-well in center of plume.
Table I-10. Filter Aid Results
Constituent CAS No.Kd
(mL/g)
Receptor WellConcentration(adult) (mg/L)
High-EndDAF
EstimatedLeachate
Concentration(mg/L)
WasteConcentration
(mg/kg)
Relevant data are not included at present because of business confidentiality concerns.
I.5 References
Allison, J.D., D.S. Brown, and K.H. Novo-Gradic. 1991. MINTEQA2/PRODEFA2, A Chemical Assessment Model for Environmental Systems: Version 4.0 User’s Manual. EPA/600/3-91/021. U.S. Environmental Protection Agency, Athens, GA.
Carsel, Robert and Rudolph Parrish. 1988. Developing joint probability distributions of soil waterretention characteristics. Water Resources Research 25(5):755-769.
Carsel, Robert, et al. 1988. Characterizing the uncertainty of pesticide leaching in agriculturalsoils. Journal of Contaminant Hydrology 2:111-124.
Kollig, Heinz, editor. 1993. Environmental Fate Constants for Organic Chemicals underConsideration for EPA’s Hazardous Waste Identification Projects. U.S. EnvironmentalProtection Agency, Environmental Research Laboratory, Office of Research andDevelopment, Athens, GA.
Loux, N. T., C. R. Chafin, and S. M. Hassan. 1990. Statistics of Aquifer Material Properties andEmpirical pH-dependent Partitioning Relationships for As (III), As (V), Ba(II), Cd(II),Cr(VI), Cu(II), Hg(II), Ni(II), Pb(II), Sb(V), Se(IV), Tl(I), and Zn(II). Office of Researchand Development, U.S. Environmental Protection Agency, Athens GA.

Appendix I
I-19
U.S. EPA (Environmental Protection Agency). 1988. Draft National Survey of Solid Waste(Municipal) Landfill Facilities. EPA/530-SW-88-034. Office of Solid Waste,Washington, DC.
U.S. EPA (Environmental Protection Agency). 1993. Parameter Values for EPA’s CompositeModel for Landfills (EPACML) Used in Developing Nationwide Regulations: ToxicityCharacteristic Rule. Office of Solid Waste, Washington, DC.
U.S. EPA (Environmental Protection Agency). 1996a. EPA's Composite Model for LeachateMigration with Transformation Products (EPACMTP) Background Document. Office ofSolid Waste, Washington, DC.
U.S. EPA (Environmental Protection Agency). 1996b. EPA's Composite Model for LeachateMigration with Transformation Products (EPACMTP) Background Document for theFinite Source Methodology, Office of Solid Waste, Washington, DC.
U.S. EPA (Environmental Protection Agency). 1996c. EPA's Composite Model for LeachateMigration with Transformation Products (EPACMTP) Background Document for Metals.Office of Solid Waste, Washington, DC.
U.S. EPA (Environmental Protection Agency). 1997a. EPA's Composite Model for LeachateMigration with Transformation Products (EPACMTP) User's Guide, Office of SolidWaste, U.S. EPA, Washington, DC.
U.S. EPA (Environmental Protection Agency). 1997b. Analysis of Subtitle D WasteManagement Units Databases Used in the Groundwater Pathway Analysis for HWIR. Office of Solid Waste, U.S. EPA, Washington, DC.