dynamic 3d qsar techniques: applications in...
TRANSCRIPT

Dynamic 3D QSAR techniques: applications in toxicology
Ovanes Mekenyana,*, Nina Nikolovab, Patricia Schmiederc
aLaboratory of Mathematical Chemistry, University ‘Prof. As. Zlatarov’, 8010 Bourgas, BulgariabCentral Laboratory of Parallel Processing, Bulgarian Academy of Sciences, ‘Acad. G.Bonchev’ str. 25A, 1756 Sofia, Bulgaria
cNational Health and Environmental Effects Laboratory, Mid-Continent Ecology Division, 6201 Congdon Boulevard, Duluth, MN 55804, USA
Abstract
Two dynamic techniques recently developed to account for conformational flexibility of chemicals in three-dimensional (3D)
quantitative structure–activity relationships (QSARs) are presented. A basic assumption underlying both methods is that
chemical behavior in complex biological systems is context-dependent. A molecule can exist and interact in a variety of
conformations. Selection of the appropriate ‘active’ conformer(s) in QSAR studies is a task as important as the selection of
appropriate molecular parameters because multiple conformers of one chemical can differ significantly in the value of their
calculated molecular descriptors. In the dynamic approaches for selection of active conformers in correlative QSAR studies,
biological activity is modeled as a function of molecular descriptors derived from specifically selected active conformers, rather
than as a property derived from the lowest-energy gas-phase conformer. In a recent pattern recognition approach all
energetically reasonable conformers are taken into account to derive the common reactivity pattern (COREPA) of structurally
diverse but biologically similar chemicals (and ultimately conformers). The COREPA method is based on the assumption that
chemicals which elicit similar biological behavior through a common mechanism of interaction with the biological ‘receptor’ of
interest, should possess a commonality in the values of their steric and/or electronic parameters, thus yielding a COREPA.
Applicability of these techniques, based on the same underlying principles, is illustrated. In addition to the impact of
conformational flexibility of chemicals in 3D QSAR models, the applicability of various molecular descriptors is discussed. The
proposed classification could be useful as guidance for selection of appropriate molecular parameters for modeling a variety of
toxicity endpoints according to the specificity of the underlying interactions.
q 2002 Elsevier Science B.V. All rights reserved.
Keywords: Three-dimensional quantitative structure–activity relationships; Conformational flexibility; Three-dimensional-screening;
Molecular descriptors; Receptor binding
1. Introduction
Quantitative structure – activity relationships
(QSARs or more general SARs) are based on a
fundamental principle in chemistry, that chemical
properties and the biological behavior elicited is
a direct result of chemical structure. Once established,
such SARs can be used to predict the activity of
untested chemicals. Two conceptually different
approaches have been implemented in SAR studies.
In correlative approaches, the variation in molecular
structure (assessed quantitatively by molecular
descriptors) within a congeneric series of compounds
is assumed correlated with the observed change in the
endpoint under study (e.g. toxicity), thus providing
0166-1280/03/$ - see front matter q 2002 Elsevier Science B.V. All rights reserved.
PII: S0 16 6 -1 28 0 (0 2) 00 6 25 -5
Journal of Molecular Structure (Theochem) 622 (2003) 147–165
www.elsevier.com/locate/theochem
* Corresponding author. Tel./fax: þ359-56-880239.
E-mail address: [email protected] (O. Mekenyan).
insight as to the molecular mechanisms controlling
the modeled endpoint. On the other hand, pattern
recognition approaches attempt to identify common
stereoelectronic characteristics among structures that
elicit similar biological activity. The recognized
common structural characteristics can then be
employed to screen large and structurally hetero-
geneous databases for identification of potentially
active chemicals eliciting toxicity by the same
mechanism of action. Both SAR approaches are
successfully employed only if the modeled chemical
or biological endpoint is a result of a common
interaction mechanism.
Because chemical interactions are three-dimen-
sional (3D) events, QSARs often depend on the 3D
molecular models adopted for the chemicals under
study. This certainly applies to receptor-site mapping
models dealing directly with molecular shapes and
fields. Correlative QSARs may also be influenced
indirectly when employing electronic quantum-
chemical descriptors that generally depend on 3D
structure. The conventional 3D QSAR methods are
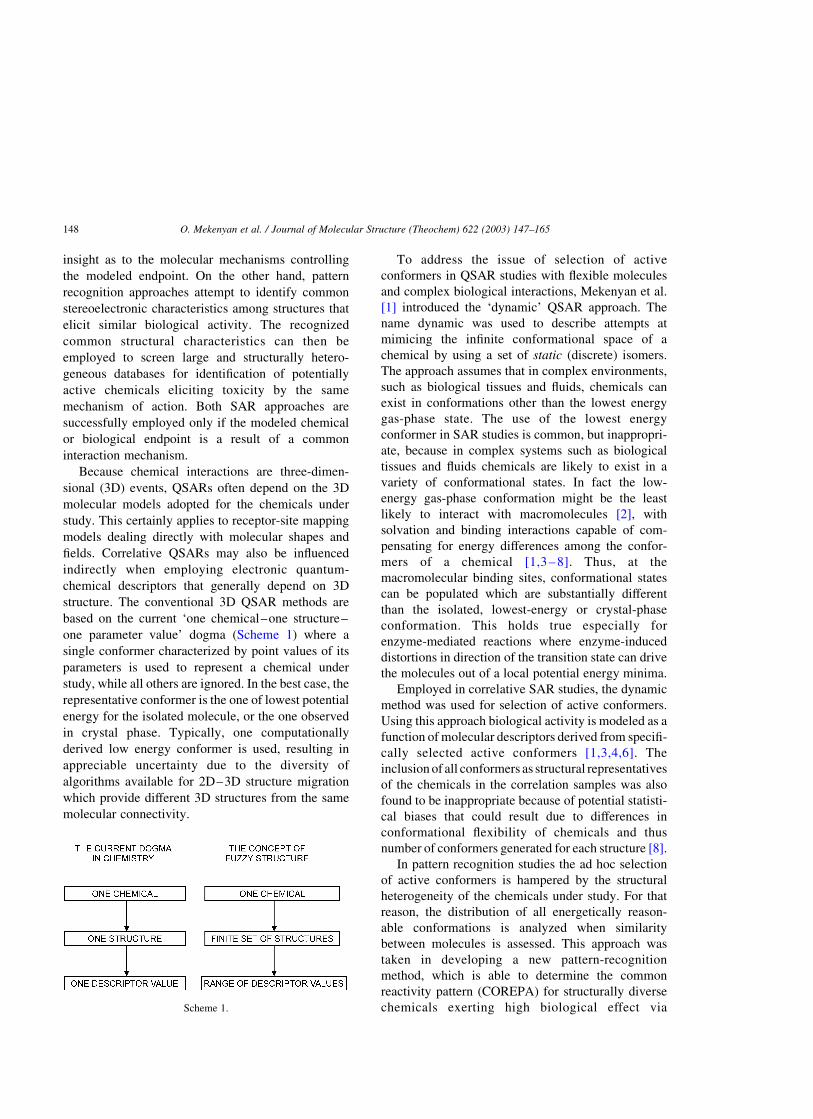
based on the current ‘one chemical–one structure–
one parameter value’ dogma (Scheme 1) where a
single conformer characterized by point values of its
parameters is used to represent a chemical under
study, while all others are ignored. In the best case, the
representative conformer is the one of lowest potential
energy for the isolated molecule, or the one observed
in crystal phase. Typically, one computationally
derived low energy conformer is used, resulting in
appreciable uncertainty due to the diversity of
algorithms available for 2D–3D structure migration
which provide different 3D structures from the same
molecular connectivity.
To address the issue of selection of active
conformers in QSAR studies with flexible molecules
and complex biological interactions, Mekenyan et al.
[1] introduced the ‘dynamic’ QSAR approach. The
name dynamic was used to describe attempts at
mimicing the infinite conformational space of a
chemical by using a set of static (discrete) isomers.
The approach assumes that in complex environments,
such as biological tissues and fluids, chemicals can
exist in conformations other than the lowest energy
gas-phase state. The use of the lowest energy
conformer in SAR studies is common, but inappropri-
ate, because in complex systems such as biological
tissues and fluids chemicals are likely to exist in a
variety of conformational states. In fact the low-
energy gas-phase conformation might be the least
likely to interact with macromolecules [2], with
solvation and binding interactions capable of com-
pensating for energy differences among the confor-
mers of a chemical [1,3 – 8]. Thus, at the
macromolecular binding sites, conformational states
can be populated which are substantially different
than the isolated, lowest-energy or crystal-phase
conformation. This holds true especially for
enzyme-mediated reactions where enzyme-induced
distortions in direction of the transition state can drive
the molecules out of a local potential energy minima.
Employed in correlative SAR studies, the dynamic
method was used for selection of active conformers.
Using this approach biological activity is modeled as a
function of molecular descriptors derived from specifi-
cally selected active conformers [1,3,4,6]. The
inclusion of all conformers as structural representatives
of the chemicals in the correlation samples was also
found to be inappropriate because of potential statisti-
cal biases that could result due to differences in
conformational flexibility of chemicals and thus
number of conformers generated for each structure [8].
In pattern recognition studies the ad hoc selection
of active conformers is hampered by the structural
heterogeneity of the chemicals under study. For that
reason, the distribution of all energetically reason-
able conformations is analyzed when similarity
between molecules is assessed. This approach was
taken in developing a new pattern-recognition
method, which is able to determine the common
reactivity pattern (COREPA) for structurally diverse
chemicals exerting high biological effect viaScheme 1.
O. Mekenyan et al. / Journal of Molecular Structure (Theochem) 622 (2003) 147–165148
the same mode of action [9,10]. It is assumed that
chemicals which elicit similar biological behavior
through a common mode of action should possess a
commonality in their stereoelectronic (reactivity)
pattern. Elucidation of this pattern requires examin-
ation of the conformational flexibility of the
compounds in an attempt to reveal areas in the
multidimensional descriptor space which are most
populated by the conformers of the biologically
active molecules and least populated by conformers
of inactive chemicals, simultaneously (see also Ref.
[6]). COREPA circumvents the problems of con-
former alignment and selection, and initial assump-
tions concerning specific atoms/fragments in a
pharmacophore are not obligatory. The method
defines the COREPA by analyzing conformational
distribution of chemicals across global and local
reactivity parameter(s) potentially associated with
the specific biological endpoint under study.
Examples of the QSAR techniques developed
utilizing principles described above are presented in
next sections.
2. Fuzzy logic and 3D structure modeling
Within the single (lowest energy) conformer
representation of chemical structure, the corre-
sponding geometric and electronic parameters
have single, discrete point values. Such truth-values
and the associated logic have been designated as
crisp in the fuzzy logic theory [11,12]. These
parameters are subject to classical prepositional
logic, based on the two-value principle. According
to this principle, every preposition is either true or
false and can be treated as Boolean truth-values of
classical logic. In other words, one chemical either
can or cannot possess specific parameter values.
This classical logic, however, does not match the
real world due to conformational flexibility of
chemicals and the fact that the lowest energy
conformer is not necessarily the active one. Which
conformer is active is context-dependent, influenced
by the biological macromolecules and biochemical
environment present, and therefore the specificity
of the interaction partners and reaction media could
significantly influence the choice of active con-
former(s).
In a recent study, we have shown that even
stereochemically rigid steroids are conformationally
flexible within the retained stereochemistry of the
natural enantiomer [9,13]. The range of 10.6 kcal/mol
for formation enthalpies (within AM1 Hamiltonian)
was found to be within the range of experimental
receptor binding energies for these molecules (10–
20 kcal/mol). Additionally, the conformer intercon-
version barrier was found to be no greater than
10.9 kcal/mol and thus comparable with the confor-
mer formation enthalpies. Steroid conformer inter-
conversions were therefore found to be feasible
kinetically, as well as thermodynamically. Thus,
conformational flexibility of these hormones should
be taken into account when receptor or pharmaco-
phore mapping approaches are employed [13].
A conclusion of the above analysis is that structural
information derived from a single conformer may be
insufficient for a complete structural description of a
chemical and could cause a subsequent failure in SAR
analysis. It appears that the classical prepositional
logic of two options, namely true and false, when
associated with a single geometrical representation of
a chemical needs to be replaced by the fuzzy logic of
an infinite set of geometries describing conformation-
al space of molecules. In order to overcome the
infinity problem, however, one could make confor-
mational space discrete using a finite number of
conformers to represent the whole space. Thus, by
analogy with the notion of fuzzy molecular graphs [11,
12], we propose the use of fuzzy chemical structures
where the atoms, bonds and valence angles are
assumed to carry crisp information, whereas the
torsion angles carry fuzzy information. In other
words, when describing conformational space, the
atoms, bonds and valence angles are fixed, thus
forming the static elements of the molecule, whereas
torsion angles are varied, thus forming its flexible
components.
It has been found that conformational flexibility
has significant impact on molecular electronic struc-
ture and associated properties, as has been illustrated,
for example, with several series of androgen and
estrogen receptor ligands [9,10,13–15]. For a given
compound, conformers within the formation enthalpy
range of 20 kcal/mol exhibited significant variation in
potentially relevant electronic descriptors (the
20 kcal/mol threshold for selection of potentially
O. Mekenyan et al. / Journal of Molecular Structure (Theochem) 622 (2003) 147–165 149
active conformers falling within experimental binding
energies). To illustrate the point, conformers of
hydroxyflutamide (again, those conformers within
the energetically reasonable formation enthalpy range
of 20 kcal/mol) had calculated parameter values
spanning over 0.63 eV for ELUMO, a range of
1.09 eV for EHOMO, 0.61 eV for EHOMO – LUMO gap,
and 6.51 D for dipole moment (m ). The conformers of
steroid structures included in the same analysis
spanned somewhat smaller parameter ranges (likely
due to their stereochemical rigidity which was
maintained during conformer generation), but were
also noteworthy. Conformers of methyltriendone had
a range of 0.30 eV for ELUMO, 0.18 eV for EHOMO,
0.46 eV for EHOMO – LUMO, and 1.60 D for m. The
observation that relatively small energy differences
between conformers of a chemical can yield signifi-
cant variation in electronic structure highlights the
necessity to represent the molecular parameter values
as finite ranges for each chemical, instead of single
point values. Hence, the application of fuzzy logic in
the handling of chemical structures requires the one
chemical–one structure–one parameter value prin-
ciple to be modified to a ‘one chemical–finite set of
structures– range of parameter values’ principle
(Scheme 1). Currently in textbooks, catalogues, and
databases, the property values listed are for one
conformer of a chemical, usually in a specific solution
or immobilized in a solid phase. Significant amounts
of structural and property (activity) information are
therefore missing, due to the lack of experimental and/
or theoretical studies on the relationship of confor-
mational change and associated variability in par-
ameter values.
It should also be noted that true values in fuzzy
logic, i.e. the parameter values corresponding to
conformationally multiplied chemicals, should be
considered as possibility values rather than as
stochastic. The possibility character is derived from
the assumption that active conformers are reaction
and environment specific, and that the selection of
conformers in structure–activity studies should be
considered in the context of the specificity of the
interaction rather than as a result of random choice.
There are many attempts to solve the issue of
conformational freedom of chemicals in QSAR
studies for drug design and for screening of 3D
structure databases. In the former case, the traditional
QSAR packages provide conformational analysis in
an attempt to solve the problem of generating the
lowest energy conformer. However, as mentioned
previously, the selection of active conformers in
QSAR analysis is as important as the selection of
significant molecular descriptors. Similarly, the use of
a rigid search, based on single conformer represen-
tation of chemicals is likely to fail to identify
structures that, due to their flexibility, could adopt
the conformation of a query pharmacophore. The
alternative flexible search using the query to direct the
conformational changes needed to find a match are
based on distance geometry [16,17], systematic
search [18–20], random-search [21], genetic [22,
23], and directed tweak [24] algorithms. These
algorithms for searching conformational space are
discussed and compared by Clark et al. [25]. For 3D
flexible searching, Murrall and Davies [26] have
suggested the direct application of distance range
screens with user defined tolerances.
Newly developed modeling approaches and associ-
ated techniques allowing interpretation of fuzzy
molecular structure are presented in Section 3,
with examples of QSAR applications discussed in
Section 4.
3. Dynamic techniques for 3D-structuremanipulation in QSAR analysis
The main feature of the 3D QSAR approaches
presented in this work is the consideration of
conformational flexibility of chemicals. Techniques
for exploring conformational space of chemicals are
included as an initial step in the development of 3D
QSARs. Two algorithms have been developed within
the OASIS software system to handle conformer
generation and evaluation for QSAR application.
Following is a short description of these algorithms,
however, readers are encouraged to consult the
respective references for a detailed presentation of
the approaches.
3.1. Algorithms for conformer generation
3.1.1. Systematic search by the 3DGEN algorithm
The 3DGEN technique [27] is a combinatorial
procedure for systematic search of conformational
O. Mekenyan et al. / Journal of Molecular Structure (Theochem) 622 (2003) 147–165150
space. It initiates from molecular topology and
generates all conformers in the context of steric
constraints (e.g. distances between non-bonded
atoms, ring-closure limits, torsional resolution) and
expert rules (e.g. likelihood of intramolecular hydro-
gen bonds, cis/trans or L/D isomers). A unique aspect
of the approach involves the initial propagation of an
acyclic 3D model of the molecular skeleton. The
construction of this skeleton initiates from a specified
atom of the molecule based on its topochemical
ranking (a ranking based on connectivity and atom
type). A bond ‘under construction’ in this acyclic
model is positioned in space by using a recursive
procedure based on the 3D information of previously
established bonds. This includes the atom type and
hybridization of the atoms incident to the bond being
constructed as well as the two atoms associated with
the previously completed bond. Cyclic fragments
incident to the bond being constructed are also
addressed. Bond lengths and valence angles are
determined through a molecular mechanics parame-
terization. During the propagation of the acyclic
model, cyclic character is gained through defined
ring-closure constraints. Rotamers associated with all
torsional angles that meet hybridization and specified
geometric constraints are retained. In summary, the
approach incorporates the conformational flexibility
of saturated cyclic molecular fragments, as opposed to
other techniques, that explore conformational space
formed by rotations around acyclic single bonds only.
With strained molecules the possible violation of
imposed geometric constraints are corrected with a
strain-relief procedure (pseudo molecular mechanics,
PMM) based on a truncated force field energy-like
function, where the electrostatic terms are omitted
[27]. In fact, the PMM force field involves additive
interatomic interactions for bond lengths, valence
angles, dihedral angles, out-of-plane bends of sp2
conjugated sites and Lennard-Jones repulsions of non-
bonded sites. The basic form and parameterization of
the interatomic interactions mentioned above was
taken from the Chem-X force field [28,29]. Geometry
optimization is further completed by quantum-chemi-
cal methods. Usually, MOPAC 93 [30,31] is employed
by making use of the AM1 Hamiltonian. Next, the
conformers are screened to eliminate those, whose
heat of formation, DHf0, is greater from the DHf
0
associated with the conformer with absolute energy
minimum by user defined threshold. Usually, 20 kcal/
mol (or 15 kcal/mol) threshold is employed based on
experimental evidence that the free energy of binding
to some steroid hormones is in the range of 210 to
220 kcal/mol [7,32,33], which would provide the
necessary energy to elevate conformers from the
low(est) energy state during binding. Subsequently,
conformational degeneracy, due to molecular sym-
metry and geometry convergence is detected within a
user defined torsion angle resolution.
3.1.2. Genetic algorithm for conformational coverage
A new approach for coverage of chemical
conformational space by a limited number of
conformers [34] was developed to evaluate confor-
mational flexibility of molecules. Instead of using
the systematic search whose time-complexity
increases exponentially with degrees of freedom, a
genetic algorithm (GA) is employed to minimize
3D similarity among the generated conformers.
This makes the problem computationally feasible
even for large, flexible molecules. The 3D
similarity of a pair of conformers is assumed
reciprocal to the root-mean-square (RMS) distance
between identical atomic sites, using an alignment
which minimizes this distance. Thus, in contrast to
traditional GA, the fitness of a conformer is not
quantified individually, but only in conjunction
with the population it belongs to. The approach
handles the following stereochemical and confor-
mational degrees of freedom: rotation around
acyclic single and double bonds, inversion of
stereocenters, flip of free corners in saturated
rings, reflection of pyramids on the junction of
two or three saturated rings. The latter two were
particularly introduced to encompass structural
diversity of polycyclic structures. However, they
generally affect valence angles and can be
restricted up to a certain level of severity of such
changes. Stereochemical modifications are totally/
selectively disabled when the stereochemistry is
exactly/partially specified on input. For the chemi-
cals under study, the stereochemistry of the active
enantiomer is maintained during conformer gener-
ation. The reproducibility and robustness of GA
runs, and subsequent density of coverage of
conformational space can be controlled by the
ratio between parents and children.
O. Mekenyan et al. / Journal of Molecular Structure (Theochem) 622 (2003) 147–165 151
Each of the generated conformations is submitted
to geometry optimization procedure as described in
Section 3.1.1.
3.2. Classification of molecular descriptors in 3D
QSARs
Besides selection of active conformers to represent
chemicals in 3D QSAR studies, one needs to assess
the molecular geometric and electronic structure as
well as the physicochemical parameters of the
chemicals under investigation. The selection of
molecular descriptors is not a trivial task. Usually,
this problem is addressed by applying robust statisti-
cal tools in an attempt to avoid the frequently faced
conflict between a small number of observations and a
large number of molecular parameters in the descrip-
tor pool. The latter could result in chance correlations
according to the criteria of Topliss and Edwards [35].
Conventionally 3:1 or 5:1 ratio between observations
and molecular parameters is assumed as optimal.
However, it should be emphasized that often the
number of modeling parameters evaluated in this ratio
is erroneously counted from the ultimate model, and
not reflective of the initial data matrix.
Traditionally only statistical tools are relied upon
to reduce the cardinality of descriptors in the initial
data matrix. Our belief is, however, that informal
assessments should be used first to reduce this
cardinality, with statistical tools applied afterwards.
These informal assessments should be based on
known, or hypothesized, mechanisms of chemical–
biological interaction, which would allow elimination
of molecular descriptors unlikely to be associated
with the endpoint under study, i.e. would eliminate the
‘noise’ in the descriptor pool. To accomplish this we
propose a classification of toxic endpoints and
molecular descriptors according to the specificity of
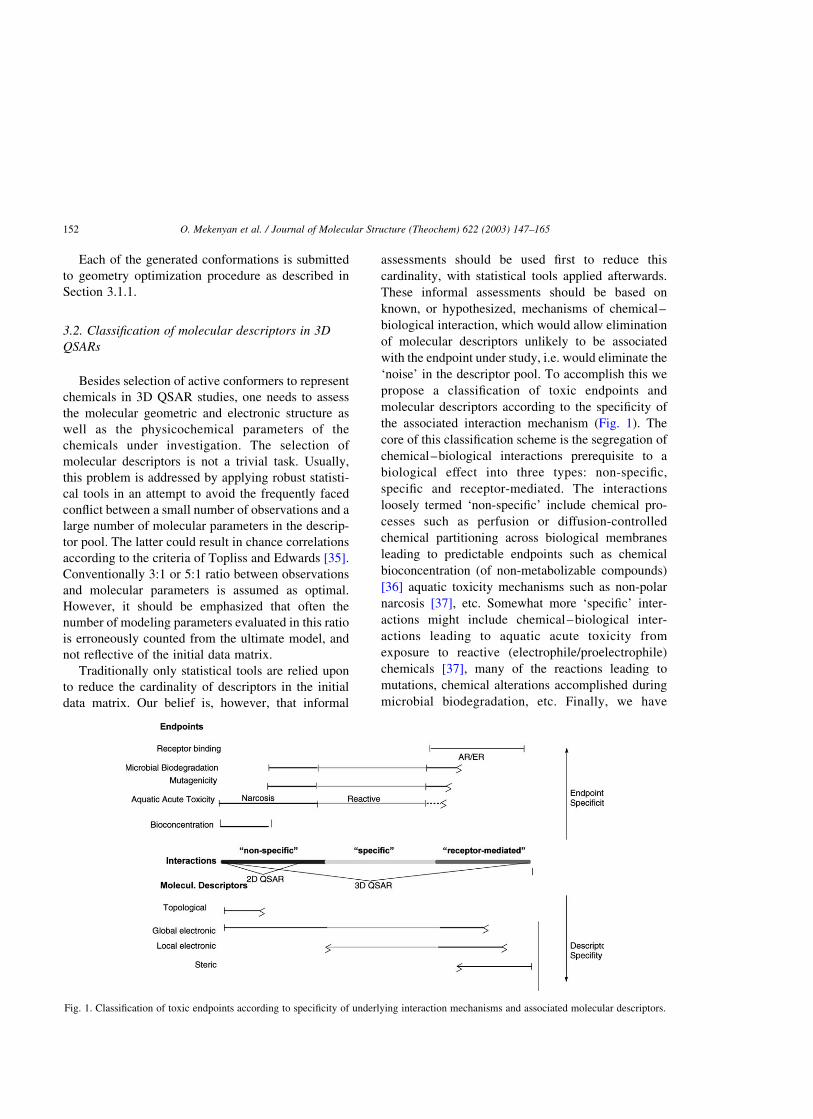
the associated interaction mechanism (Fig. 1). The
core of this classification scheme is the segregation of
chemical–biological interactions prerequisite to a
biological effect into three types: non-specific,
specific and receptor-mediated. The interactions
loosely termed ‘non-specific’ include chemical pro-
cesses such as perfusion or diffusion-controlled
chemical partitioning across biological membranes
leading to predictable endpoints such as chemical
bioconcentration (of non-metabolizable compounds)
[36] aquatic toxicity mechanisms such as non-polar
narcosis [37], etc. Somewhat more ‘specific’ inter-
actions might include chemical–biological inter-
actions leading to aquatic acute toxicity from
exposure to reactive (electrophile/proelectrophile)
chemicals [37], many of the reactions leading to
mutations, chemical alterations accomplished during
microbial biodegradation, etc. Finally, we have
Fig. 1. Classification of toxic endpoints according to specificity of underlying interaction mechanisms and associated molecular descriptors.
O. Mekenyan et al. / Journal of Molecular Structure (Theochem) 622 (2003) 147–165152
considered ‘receptor-mediated’ interactions that
induce subsequent conformational change in receptor
proteins and are associated with endpoints such as
gene activation, cell proliferation, etc.
The chemical processes associated with non-
specific interactions include reversible processes
which may be associated with underlying weak
electrostatic (Van der Waals) forces, and include
interactions during which chemical bonding in
molecules is not irreversibly altered. As a result,
these non-specific interactions yield reversible toxic
effects. Note that these are not strict categorizations,
but represent a continuum of chemical–biochemical
interactions. For instance, weak interactions (Van der
Waals, H-bonding) also underlie reversible receptor-
mediated events. Moreover, if we take into account
the interacting targets (e.g. nucleophilic sites targeted
by electrophilic chemicals producing acute aquatic
reactive toxicity), these effects can have pronounced
specificity. A specific interaction, for example,
includes interactions involving formation of covalent
bonds. In contrast to electrostatic effects, these
interactions have specific character due to direction-
ality (i.e. well-defined orientation) of covalent bonds.
The bond rearrangements in these interactions
produce irreversible toxic effects. The receptor-
mediated interactions have been elegantly described
as reversible ligand–receptor–effector interactions
with conformationally flexible ligands binding with
the receptor and inducing conformational change such
that the new complex allows interaction with effector
sites [38]. The site–site binding interactions between
reaction centers are weak, i.e. with non-specific
character in accordance with underlying chemical
(electrostatic) forces.
The molecular descriptors that are calculable from
chemical structure assess different aspects of molecu-
lar structure and hence ability of chemicals to take
part in different interactions. For example, topological
indices describe non-metric geometry and therefore
could describe non-specific interactions and related
endpoints, such as chemical penetration (diffusion),
acute aquatic non-polar narcosis, etc. The same holds
to some extent for global electronic indices, which in
addition to the non-specific interactions, encompass
the area of specific interactions as well, strongly
dependent upon molecular geometry. Hence,
these molecular descriptors should be considered in
developing QSARs for mutagenicity, aquatic reactive
toxicity, etc. The global electronic descriptors also
extend to the realm of receptor-mediated interactions,
and have been found useful in quantifying the global
reactivity of receptor ligands. Local electronic
reactivity parameters describe the ability of atomic
sites and fragments to take part mostly in specific
interactions dependent upon the reactive groups
present, and subsequently should be used for model-
ing toxic endpoints such as reactive acute toxicity,
biodegradation, receptor mediated effects, etc. These
parameters, however, could also be used for assessing
propensity of chemicals to take part in weak
interactions; hence, they are also included in the list
of parameters available to describe non-specific
interactions. Finally, specific steric parameters, such
as distances between fragments and/or atomic sites
have also shown to be critically important for deriving
mechanistically reasonable models for receptor-
mediated effects.
The list of parameters used routinely in OASIS
system [39] includes:
(i) Non-specific molecular descriptors, such as
topological indices;
(ii) Specific electronic descriptors: Global electronic
parameters such as heat of formation (DHf),
LUMO energy (ELUMO), HOMO energy
(EHOMO), HOMO–LUMO energy gap (Egap),
electronegativity (EN); dipole moment (m ),
volume polarizability (VolP), degree of stretch-
ing or compactness (quantified as sum of
interatomic steric distances, GW), greatest
interatomic distance (Lmax), planarity (normal-
ized sum of torsion angles in a molecule) are
included, here. VoIP is defined as a sum of
atomic self-polarizabilities, and describe the
averaged ability of a compound to change
electron density as its atoms during chemical
interactions (lower VoIP values reflect higher
charge localizations and more polarizable, i.e.
less lipophilic are molecules). Van der Waals
surface, solvent accessible surface (SAS1.5;
assuming water as a solvent) calculated by
making use of Connoly algorithm [40] and
charged partial surface areas (CPSAs) as intro-
duced in Ref. [41] by Stanton and Jurs
could be included in the group of specific
O. Mekenyan et al. / Journal of Molecular Structure (Theochem) 622 (2003) 147–165 153
physicochemical parameters.
Local electronic descriptors include atomic
charges (qi), frontier atomic charges (f HOMOi and
f LUMOi ), donor and acceptor superdelocalizabil-
ities (SEi and SN
i ), and self-atomic polarizability
(pi), where i denotes a given atomic site of the
molecule.
(iii) Specific steric descriptors, such as the steric
distance between atoms i and j (dij).
All molecular descriptors described above except
topological indices, could be used for deriving 3D
QSAR.
3.3. Selection of active conformers in correlative
QSAR studies
According to basic assumptions, in complex
reaction environments or with solvents of different
polarity one should expect that a molecule can
populate different conformational states depending
on the particular interaction step, such as tissue
partitioning, substrate–receptor complex formation,
etc. [1]. Moreover, the specificity of the processes
allows for particular conformers to be active for the
different endpoints under investigation. The identifi-
cation of those conformers, however, is a difficult
problem, especially when the equilibrium among
conformational states is easily attained. At the present
time there is no general approach identifying the ‘real’
conformers among computed ones.
The method combines a conformation generation
routine with a module for conformer screening. It
begins with the generation of an exhaustive set of
conformers and allows one to select conformers based
on the problem being addressed, by using a hierarch-
ical set of screening rules. Thus, one selects a specific
conformer among the finite set of isomers describing
the fuzzy molecular structure. The screening stage is
based on the stereoelectronic molecular structure of
selected conformers assessed by quantum chemical
methods. Then, in an interactive mode, the user has
the opportunity to introduce working hypotheses in
the selection of conformers. As was mentioned, great
variation in stereoelectronic indices among different
conformers of a given molecule often results, which
again points to the conclusion that the selection of
active conformers appears to be as crucial for QSAR
analysis as the selection of suitable molecular
descriptors.
Conformers can be selected based on their
distribution across specific physico-chemical and/or
stereoelectronic parameters. The conformer distri-
bution (number of conformers belonging to a certain
range of parameter values) is displayed as a selected
number of parameter windows, evenly dividing the
whole parameter range. There are a variety of
selection schemes, which can be applied after
examining the conformer distributions, providing:
(i) Prevailing values of the parameter of interest
(select conformers belonging to the most popu-
lated window of the relevant electronic or
geometric property).
(ii) Extreme values of the parameters of interest
(select conformers providing the values of
maximum or minimum relevant molecular prop-
erty). Thus for example, one can select lowest
energy conformers having minimum values of
heats of formation. One can also obtain the
conformers with the highest electron acceptor
(donor) properties, taking those having minimum
(maximum) values of ELUMO (EHOMO) or
maximum (minimum) values of acceptor
(donor) superdelocalizabilities or the respective
frontier charges at specific atomic sites.
(iii) Certain Boltzmann-weighted populations
according to
Pi½%� ¼ exp½2ðDHif 2 DH1
f Þ=RT�=
Sn exp½2ðDHif 2 DH1
f Þ=RT�100 ð1Þ
with P i[%] denoting the percent level of
population of the conformation i with heat of
formation DHif at 298 K (as quantified by AM1).
(iv) Descriptor values weighted according to con-
former-specific values for each compound.
Different averaging methods including arith-
metic, geometric, quadratic, and harmonic
methods are provided.
3.4. COREPA method
COREPA is a pattern recognition type of QSAR
approach providing visualization and interpretation
of reactivity pattern of biologically similar
O. Mekenyan et al. / Journal of Molecular Structure (Theochem) 622 (2003) 147–165154
chemicals [9,10]. The approach is based on the
premise that the similar biological behavior of
topologically dissimilar chemicals is due to a
commonality in their stereoelectronic (3D) struc-
tures, as described by common ranges of selected
stereoelectronic descriptors. The core of the
approach is the procedure for evaluation of 3D
similarity between chemicals accounting for their
conformational flexibility (referred to as the
“dynamic” 3D similarity method in Mekenyan
et al. [42]). The commonly used 3D similarity
methods compare 3D structural patterns of fixed
molecular geometries and do not account for
structural differences due to conformational flexi-
bility of the molecules. Thus, two conformers each
representing compared molecules could deviate
significantly in their stereoelectronic structure in
terms of reactivity parameter values whereas other
conformers of both molecules could populate a
common range of variation for those parameters.
To employ the COREPA method, conformer
generation routines (Sections 3.1 and 3.2) are used
to establish conformers of each chemical within a
certain energy range of the lowest energy structure.
The set of conformers of each chemical could be
considered as statistical ensembles that, in turn, could
impose weighing of the associated distributions (e.g.
according to the Boltzman’s statistics). Presently,
however, we are reluctant to overestimate the gas-
phase energetic assessment of conformers accounting
for the complexity of biological interactions.
All conformers of a given chemical are plotted
across a molecular descriptor axis, thus forming a
discrete distribution for the chemical relative to the
selected descriptor. For the global molecular
descriptors, each conformer is represented by single
point value of the parameter. For atomic par-
ameters, several descriptor values associated with
various local sites (atoms) of the conformer are
allocated across the parameter axis. Each parameter
point value is considered to be a midpoint of
continuous probability distribution. Lorenz distri-
bution has been used in the original COREPA
implementation [10]
fðxÞ ¼
G2
� �2
G2
� �2þðx2 x?Þ
2G ð2Þ
where G is the half-width of the distribution
function around the probability maxima. The higher
the values of G the flatter are the density function
wðxÞ: Various probabilistic functions are in use in
the present version of COREPA, including but not
limited to:
Gaussian distribution:
fðxÞ ¼1
hffiffiffiffi2p
p e2ðx2x0Þ2=2h2
ð3Þ
Laplace distribution:
fðxÞ ¼ 12
e2x: ð4Þ
The conformer distribution of a chemical is obtained
as a normalized sum of these probability distributions.
The normalization is performed by dividing the sum
of individual distributions by the number of con-
formers. This normalization ensures the area of the
obtained distribution to be unified, and hence the
resulting distribution function to be considered as a
probability density. Thus, for a sample of descriptor
values x1; x2;…; xn associated with a chemical a
probability density function is constructed as
pðxÞ ¼1
nh
Xn
i¼1
fx 2 xi
h
� �ð5Þ
known as the Kernel density estimation, where wðxÞ is
any probability density function (called ‘kernel’) for
which
ðfðxÞdx ¼ 1;
ðfðxÞdx ¼ 0 ð6Þ
and h is a smoothing parameter defining the smooth-
ness (wideness) of individual probability functions
(G ø h; for Lorenz density function). Apparently, the
probability density estimation wðxÞ and resulting pðxÞ
depend on the value of the smoothing parameter h. The
higher the h values the flatter are wðxÞ and pðxÞ: The
relation between kernels wðxÞ and resulting probability
density function pðxÞ constructed as a sum of the
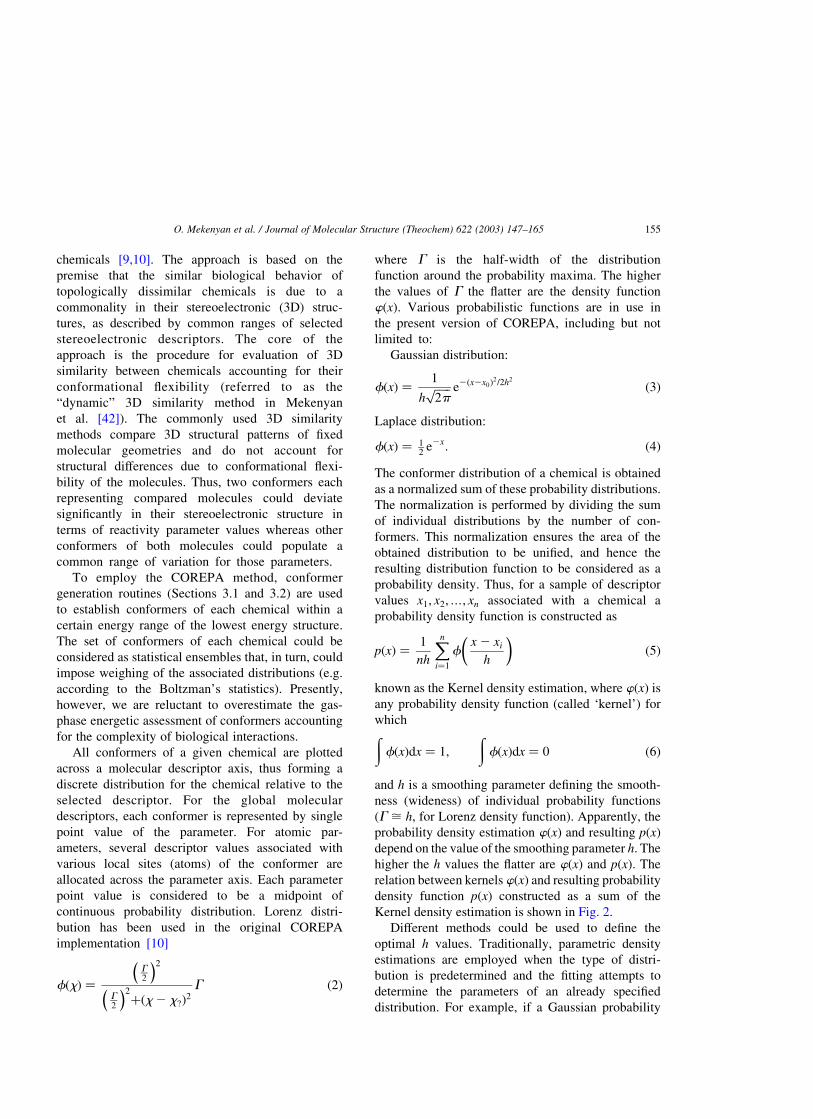
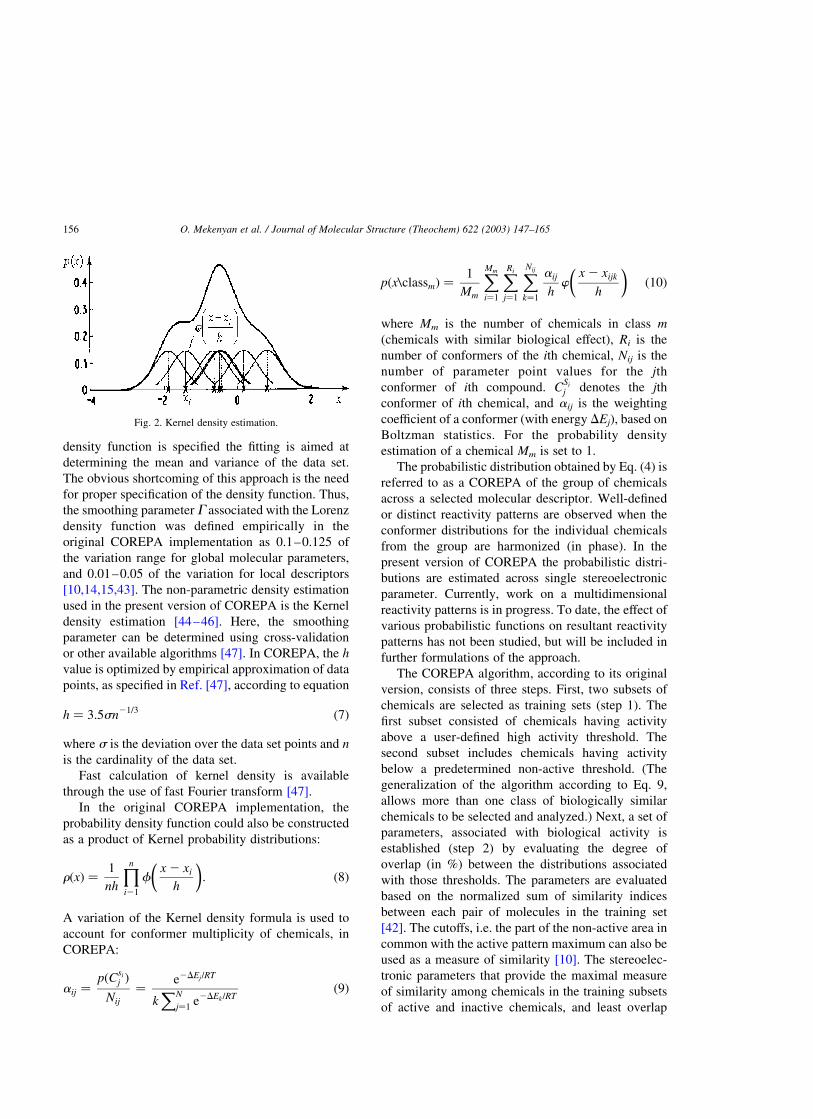
Kernel density estimation is shown in Fig. 2.
Different methods could be used to define the
optimal h values. Traditionally, parametric density
estimations are employed when the type of distri-
bution is predetermined and the fitting attempts to
determine the parameters of an already specified
distribution. For example, if a Gaussian probability
O. Mekenyan et al. / Journal of Molecular Structure (Theochem) 622 (2003) 147–165 155
density function is specified the fitting is aimed at
determining the mean and variance of the data set.
The obvious shortcoming of this approach is the need
for proper specification of the density function. Thus,
the smoothing parameter G associated with the Lorenz
density function was defined empirically in the
original COREPA implementation as 0.1–0.125 of
the variation range for global molecular parameters,
and 0.01–0.05 of the variation for local descriptors
[10,14,15,43]. The non-parametric density estimation
used in the present version of COREPA is the Kernel
density estimation [44–46]. Here, the smoothing
parameter can be determined using cross-validation
or other available algorithms [47]. In COREPA, the h
value is optimized by empirical approximation of data
points, as specified in Ref. [47], according to equation
h ¼ 3:5sn21=3 ð7Þ
where s is the deviation over the data set points and n
is the cardinality of the data set.
Fast calculation of kernel density is available
through the use of fast Fourier transform [47].
In the original COREPA implementation, the
probability density function could also be constructed
as a product of Kernel probability distributions:
rðxÞ ¼1
nh
Yn
i21
fx 2 xi
h
� �: ð8Þ
A variation of the Kernel density formula is used to
account for conformer multiplicity of chemicals, in
COREPA:
aij ¼pðC
si
j Þ
Nij
¼e2DEj=RT
kXN
j¼1e2DEk =RT
ð9Þ
pðx\classmÞ ¼1
Mm
XMm
i¼1
XRi
j¼1
XNij
k¼1
aij
hw
x 2 xijk
h
� �ð10Þ
where Mm is the number of chemicals in class m
(chemicals with similar biological effect), Ri is the
number of conformers of the ith chemical, Nij is the
number of parameter point values for the jth
conformer of ith compound. CSi
j denotes the jth
conformer of ith chemical, and aij is the weighting
coefficient of a conformer (with energy DEj), based on
Boltzman statistics. For the probability density
estimation of a chemical Mm is set to 1.
The probabilistic distribution obtained by Eq. (4) is
referred to as a COREPA of the group of chemicals
across a selected molecular descriptor. Well-defined
or distinct reactivity patterns are observed when the
conformer distributions for the individual chemicals
from the group are harmonized (in phase). In the
present version of COREPA the probabilistic distri-
butions are estimated across single stereoelectronic
parameter. Currently, work on a multidimensional
reactivity patterns is in progress. To date, the effect of
various probabilistic functions on resultant reactivity
patterns has not been studied, but will be included in
further formulations of the approach.
The COREPA algorithm, according to its original
version, consists of three steps. First, two subsets of
chemicals are selected as training sets (step 1). The
first subset consisted of chemicals having activity
above a user-defined high activity threshold. The
second subset includes chemicals having activity
below a predetermined non-active threshold. (The
generalization of the algorithm according to Eq. 9,
allows more than one class of biologically similar
chemicals to be selected and analyzed.) Next, a set of
parameters, associated with biological activity is
established (step 2) by evaluating the degree of
overlap (in %) between the distributions associated
with those thresholds. The parameters are evaluated
based on the normalized sum of similarity indices
between each pair of molecules in the training set
[42]. The cutoffs, i.e. the part of the non-active area in
common with the active pattern maximum can also be
used as a measure of similarity [10]. The stereoelec-
tronic parameters that provide the maximal measure
of similarity among chemicals in the training subsets
of active and inactive chemicals, and least overlap
Fig. 2. Kernel density estimation.
O. Mekenyan et al. / Journal of Molecular Structure (Theochem) 622 (2003) 147–165156
between overall patterns associated with those subsets
(i.e. most distinct patterns) are assumed to be related
to biological activity and used in the subsequent step
of the algorithm. The COREPAs are described in
terms of molecular descriptor ranges around the
probability maxima of the probability distributions
across relevant molecular descriptors (step 3). The
width of these ranges depends on values of above
discussed smoothing parameter. Ultimately, the gen-
eral reactivity pattern for the biological activity of
concern (SAR model) is obtained as a hierarchically
ordered collection of the parameter ranges determined
from reactivity patterns associated with each relevant
molecular descriptor (see Section 3.5).
The dissimilarity between overall patterns of active
and non-active chemicals, as well as between overall
patterns and chemical-specific distributions, can be
evaluated by an Euclidean distance metric (D ) based
on the squared differences between distribution
densities over the entire range of the parameter
variation. The Euclidean distance metric will also be
used to compare distributions derived from different
chemical training sets or for training sets derived from
different weighting schemes (e.g. different energy
thresholds for conformer selection; see Section 3.1.).
The Euclidean distance metric can also be used to
ascertain the extent to which an overall probability
distribution of active or non-active chemicals is
influenced by a specific chemical(s). In this respect,
the ‘stability’ of a pattern is assessed statistically by a
‘leave-one-out’ procedure. The Euclidean distance
metric is used to iteratively assess differences between
patterns derived for n vs. n 2 1 chemicals in the
training subsets. Variation of similarity indices, cut-
offs between overall patterns of active and inactive
chemicals, and associated parameter ranges can also
be quantified. More stable patterns are associated with
smaller Euclidean distances, variations in similarity
indices, and corresponding parameter ranges.
The COREPA algorithm circumvents the problems
in existing 3D pharmacophore mapping methods such
as the:
† selection of active conformers (all energetically
reasonable conformers are taken into account);
† predetermination of toxicophores (atomic sites and
fragments with differing levels of generality can be
used in establishing reactivity patterns);
† alignment of conformers to a lead compound
(conformer distributions of chemicals are naturally
ordered across descriptor axis with no necessity to
overlap templates).
3.5. COREPA model decision tree and rule interpreter
The ultimate SAR model was described as a
logistical decision tree. The latter consisted of multiple
hierarchically ordered rules based on parameter ranges
that comprise COREPAs. Boolean logic operators
were used to establish ‘rules’ in the decision tree. If the
value of a parameter calculated for a conformer is
found in a range of the molecular descriptor defined by
a confidence limit with a probability of P%, around the
pattern maximum, then it is assumed that the
conformer meets the specific requirement with a
probability P%. If a chemical had to meet two
successive stereoelectronic requirements to equal or
exceed an activity threshold (with probabilities PA and
PB, respectively), the total probability of meeting both
requirements (PA and B) is obtained as a product of the
probabilities of meeting the two requirements separ-
ately, i.e. PA and B ¼ PA·PB. If the value of the
parameter calculated for a conformer falls outside of at
least one of the parameter ranges, then the overall
probability of having an activity above that specified
threshold is 0. As seen, the approach offered flexibility
in establishing hazard ranking protocols for unknown
compounds based on choices of activity thresholds and
confidence limits around pattern maxima. It must be
stressed that the probability outcomes from the
decision tree should not be viewed in absolute terms.
Rather, the output from the algorithm permits a relative
ranking of unknown chemicals in terms of their
likelihood to have an activity above the user-defined
threshold.
To simplify presentation of the rule interpreter, a
binary version of the decision tree could be used. In
the binary version, a value of 100% was assigned to
chemical if at least one of its conformers fall within
the range of the molecular descriptor defined by a
confidence limit with a probability of P% around the
pattern maximum. This simplified version provided a
discrimination of chemicals as being active or non-
active. Thus, the chemicals with similar binding
affinity have at least one conformer that meets all the
specified parameter ranges, whereas those from
O. Mekenyan et al. / Journal of Molecular Structure (Theochem) 622 (2003) 147–165 157
the other activity ranges should have no conformers
that meet all the multi-parameter requirements
simultaneously. The binary version of the rule
interpreter is usually employed in the COREPA
screening applications.
4. Dynamic techniques applied to toxicity studies
4.1. Selection of active conformers in 3D QSAR
studies
Dynamic QSAR techniques for selection of active
conformers were successfully employed for modeling
the toxicity of unsaturated alcohols [1], semicarba-
zides [4], and a-terthienyls [48]. More recently these
techniques have been applied to development of
QSARs for the aryl hydrocarbon receptor (AhR) [3],
and estrogen receptor (ER) [5] binding of congeneric
chemicals. The results obtained are illustrated below
by presenting the different schemes of deriving QSAR
for AhR binding (log(1/EC50) of 14 polychlorinated
biphenyls (PCBs) [3]. Multiple conformers (103),
optimized by the PM3 Hamiltonian, were generated
for the 14 compounds analyzed. A stacking type of
interaction with AhR was hypothesized and the
receptor affinity of PCBs was hypothesized to be
correlated with the energies of frontier orbitals,
particularly the energy of the lowest unoccupied
molecular orbital (ELUMO). This was chosen as a
relevant molecular descriptor due to the experimental
findings that charge-transfer complexes are obtained
with a charge delocalization toward PCBs. A poor
correlation between AhR binding and ELUMO was
found r2 ¼ 0:38 when all conformers were included
in the correlation sample. It was not significantly
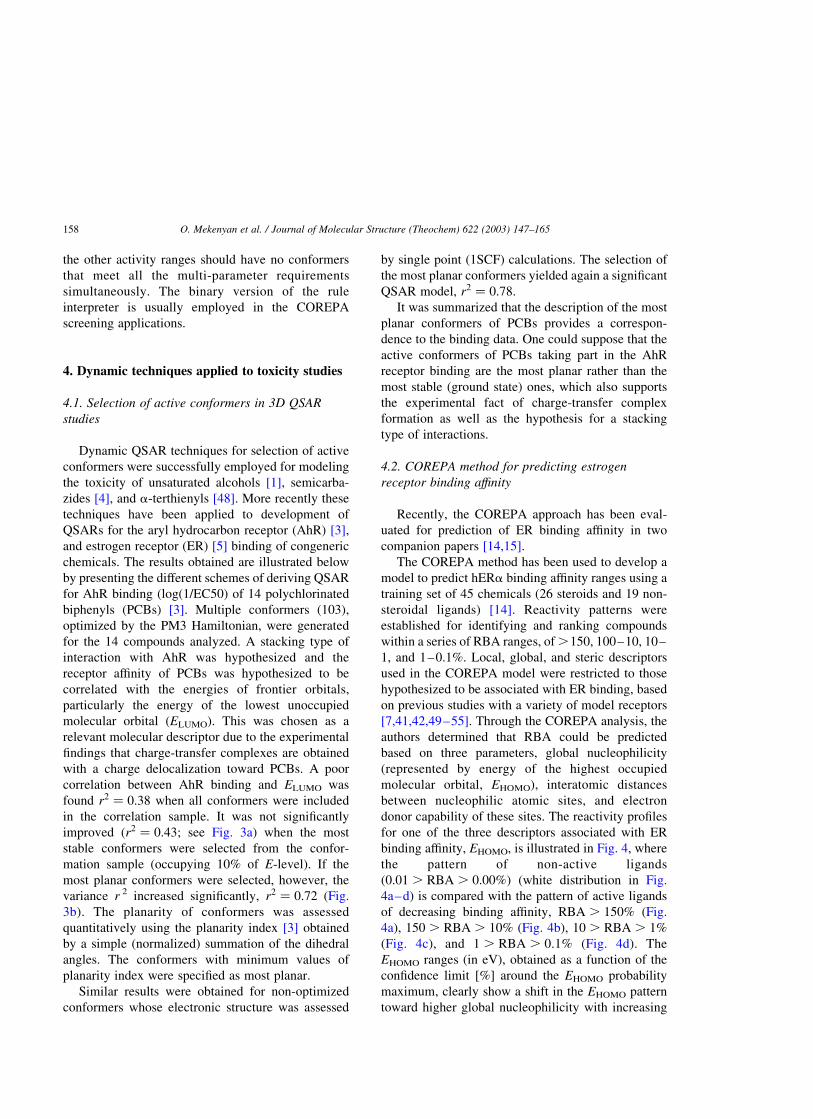
improved (r2 ¼ 0:43; see Fig. 3a) when the most
stable conformers were selected from the confor-
mation sample (occupying 10% of E-level). If the
most planar conformers were selected, however, the
variance r 2 increased significantly, r2 ¼ 0:72 (Fig.
3b). The planarity of conformers was assessed
quantitatively using the planarity index [3] obtained
by a simple (normalized) summation of the dihedral
angles. The conformers with minimum values of
planarity index were specified as most planar.
Similar results were obtained for non-optimized
conformers whose electronic structure was assessed
by single point (1SCF) calculations. The selection of
the most planar conformers yielded again a significant
QSAR model, r2 ¼ 0:78:
It was summarized that the description of the most
planar conformers of PCBs provides a correspon-
dence to the binding data. One could suppose that the
active conformers of PCBs taking part in the AhR
receptor binding are the most planar rather than the
most stable (ground state) ones, which also supports
the experimental fact of charge-transfer complex
formation as well as the hypothesis for a stacking
type of interactions.
4.2. COREPA method for predicting estrogen
receptor binding affinity
Recently, the COREPA approach has been eval-
uated for prediction of ER binding affinity in two
companion papers [14,15].
The COREPA method has been used to develop a
model to predict hERa binding affinity ranges using a
training set of 45 chemicals (26 steroids and 19 non-
steroidal ligands) [14]. Reactivity patterns were
established for identifying and ranking compounds
within a series of RBA ranges, of .150, 100–10, 10–
1, and 1–0.1%. Local, global, and steric descriptors
used in the COREPA model were restricted to those
hypothesized to be associated with ER binding, based
on previous studies with a variety of model receptors
[7,41,42,49–55]. Through the COREPA analysis, the
authors determined that RBA could be predicted
based on three parameters, global nucleophilicity
(represented by energy of the highest occupied
molecular orbital, EHOMO), interatomic distances
between nucleophilic atomic sites, and electron
donor capability of these sites. The reactivity profiles
for one of the three descriptors associated with ER
binding affinity, EHOMO, is illustrated in Fig. 4, where
the pattern of non-active ligands
(0.01 . RBA . 0.00%) (white distribution in Fig.
4a–d) is compared with the pattern of active ligands
of decreasing binding affinity, RBA . 150% (Fig.
4a), 150 . RBA . 10% (Fig. 4b), 10 . RBA . 1%
(Fig. 4c), and 1 . RBA . 0.1% (Fig. 4d). The
EHOMO ranges (in eV), obtained as a function of the
confidence limit [%] around the EHOMO probability
maximum, clearly show a shift in the EHOMO pattern
toward higher global nucleophilicity with increasing
O. Mekenyan et al. / Journal of Molecular Structure (Theochem) 622 (2003) 147–165158
RBA values. Thus, the lower boundaries of these
ranges 28.82, 29.6, 29.7, and 29.8 eV (one-sided
EHOMO ranges are used in the decision tree)
correspond to the above four activity ranges. This
result is consistent with the hypothesis that more
active ER ligands have higher nucleophilicity [5,53].
The steric and electronic requirements associated
with each RBA range were organized in a
hierarchical decision tree, whose output is an
estimated probability that a conformer would bind
to the hER within a given RBA range (Fig. 5).
Prescreen criteria, based on the necessary structural
requirements for eliciting minimal ER binding
affinity, i.e. RBA $ 0.1% are used to accelerate
the screening. Conformers which have EHOMO
values of less than 210.0 eV, nucleophilic sites
R: C, O, N, Cl, F, and S not meeting the least
conservative charge screen of 20.33 to 20.22 a.u.,
at least one cyclic fragment or steroids
not conforming stereochemical requirements of
Fig. 3. Variation of observed AhR binding affinity versus energy of lowest unoccupied molecular orbitals (ELUMO) for PCBs: (a) lowest energy
conformers; (b) most planar conformers.
O. Mekenyan et al. / Journal of Molecular Structure (Theochem) 622 (2003) 147–165 159
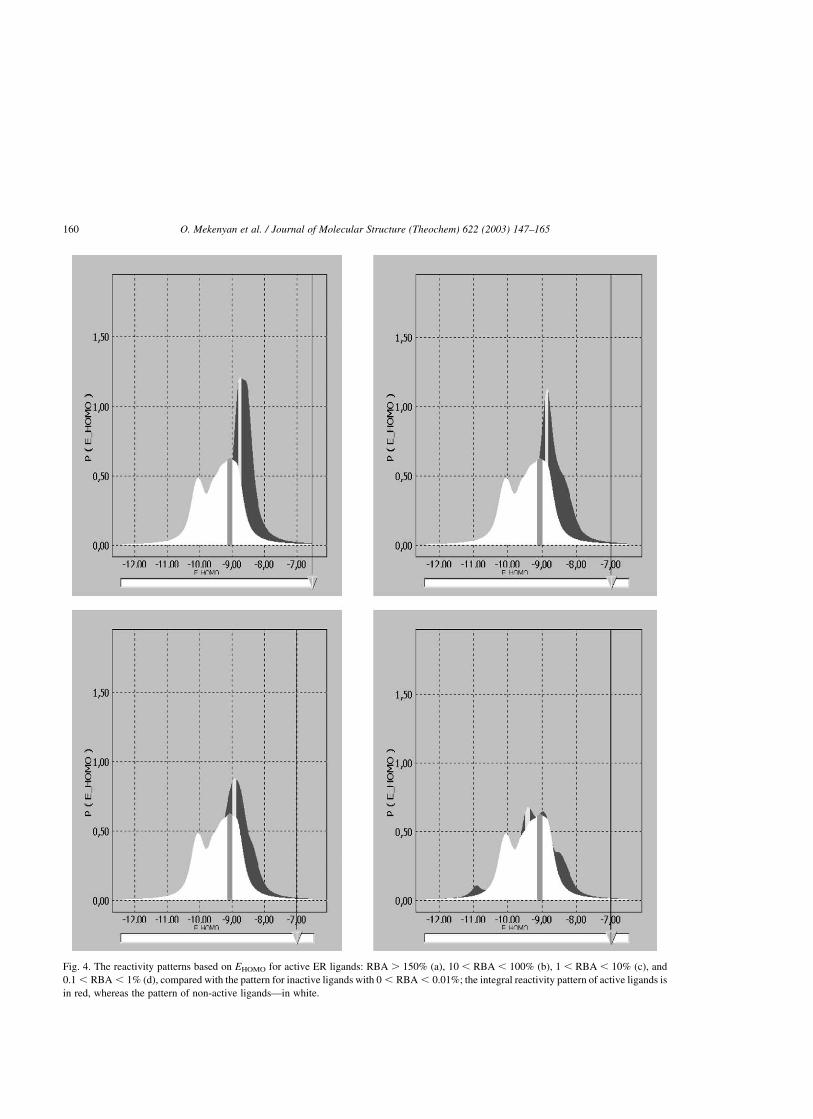
Fig. 4. The reactivity patterns based on EHOMO for active ER ligands: RBA . 150% (a), 10 , RBA , 100% (b), 1 , RBA , 10% (c), and
0.1 , RBA , 1% (d), compared with the pattern for inactive ligands with 0 , RBA , 0.01%; the integral reactivity pattern of active ligands is
in red, whereas the pattern of non-active ligands—in white.
O. Mekenyan et al. / Journal of Molecular Structure (Theochem) 622 (2003) 147–165160
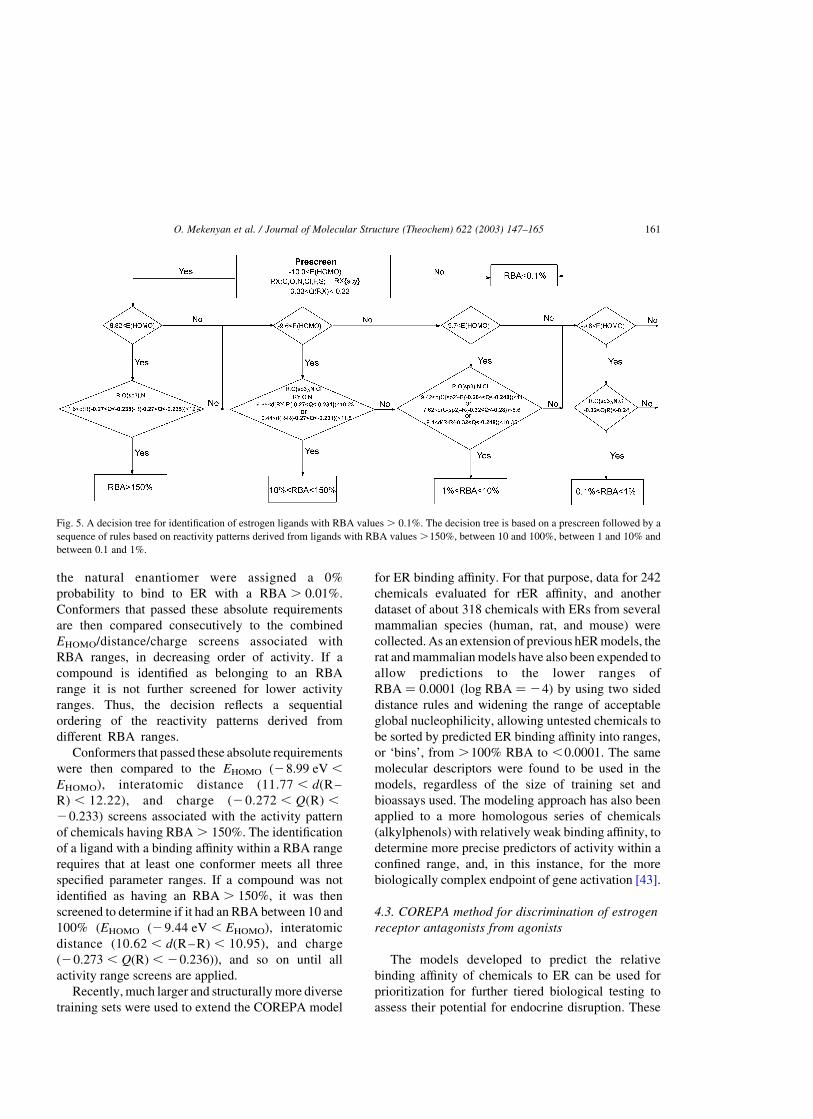
the natural enantiomer were assigned a 0%
probability to bind to ER with a RBA . 0.01%.
Conformers that passed these absolute requirements
are then compared consecutively to the combined
EHOMO/distance/charge screens associated with
RBA ranges, in decreasing order of activity. If a
compound is identified as belonging to an RBA
range it is not further screened for lower activity
ranges. Thus, the decision reflects a sequential
ordering of the reactivity patterns derived from
different RBA ranges.
Conformers that passed these absolute requirements
were then compared to the EHOMO (28.99 eV ,
EHOMO), interatomic distance (11.77 , d(R –
R) , 12.22), and charge (20.272 , Q(R) ,
20.233) screens associated with the activity pattern
of chemicals having RBA . 150%. The identification
of a ligand with a binding affinity within a RBA range
requires that at least one conformer meets all three
specified parameter ranges. If a compound was not
identified as having an RBA . 150%, it was then
screened to determine if it had an RBA between 10 and
100% (EHOMO (29.44 eV , EHOMO), interatomic
distance (10.62 , d(R – R) , 10.95), and charge
(20.273 , Q(R) , 20.236)), and so on until all
activity range screens are applied.
Recently, much larger and structurally more diverse
training sets were used to extend the COREPA model
for ER binding affinity. For that purpose, data for 242
chemicals evaluated for rER affinity, and another
dataset of about 318 chemicals with ERs from several
mammalian species (human, rat, and mouse) were
collected. As an extension of previous hER models, the
rat and mammalian models have also been expended to
allow predictions to the lower ranges of
RBA ¼ 0.0001 (log RBA ¼ 24) by using two sided
distance rules and widening the range of acceptable
global nucleophilicity, allowing untested chemicals to
be sorted by predicted ER binding affinity into ranges,
or ‘bins’, from .100% RBA to ,0.0001. The same
molecular descriptors were found to be used in the
models, regardless of the size of training set and
bioassays used. The modeling approach has also been
applied to a more homologous series of chemicals
(alkylphenols) with relatively weak binding affinity, to
determine more precise predictors of activity within a
confined range, and, in this instance, for the more
biologically complex endpoint of gene activation [43].
4.3. COREPA method for discrimination of estrogen
receptor antagonists from agonists
The models developed to predict the relative
binding affinity of chemicals to ER can be used for
prioritization for further tiered biological testing to
assess their potential for endocrine disruption. These
Fig. 5. A decision tree for identification of estrogen ligands with RBA values . 0.1%. The decision tree is based on a prescreen followed by a
sequence of rules based on reactivity patterns derived from ligands with RBA values .150%, between 10 and 100%, between 1 and 10% and
between 0.1 and 1%.
O. Mekenyan et al. / Journal of Molecular Structure (Theochem) 622 (2003) 147–165 161
models, however, are not able to distinguish potential
receptor antagonism from agonism, and hence the
type of in vivo response. Recently, the COREPA
approach has also been employed as a discrimination
tool for ER antagonists from agonists [56]. It has been
suggested that steroid receptor antagonists are less
compact than agonists, which eventually prohibits
proper alignment of the former by the receptor protein
helices. As a result of the alignment prohibition the
transactivation process is prevented. The COREPA
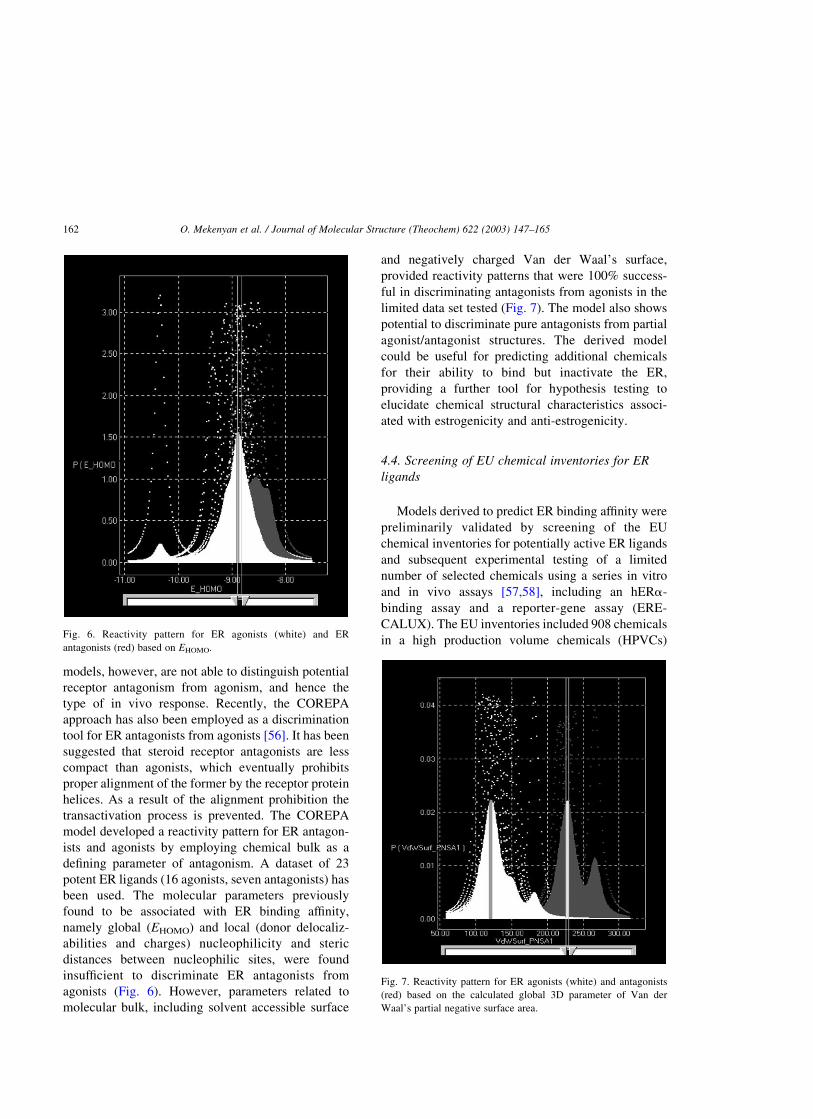
model developed a reactivity pattern for ER antagon-
ists and agonists by employing chemical bulk as a
defining parameter of antagonism. A dataset of 23
potent ER ligands (16 agonists, seven antagonists) has
been used. The molecular parameters previously
found to be associated with ER binding affinity,
namely global (EHOMO) and local (donor delocaliz-
abilities and charges) nucleophilicity and steric
distances between nucleophilic sites, were found
insufficient to discriminate ER antagonists from
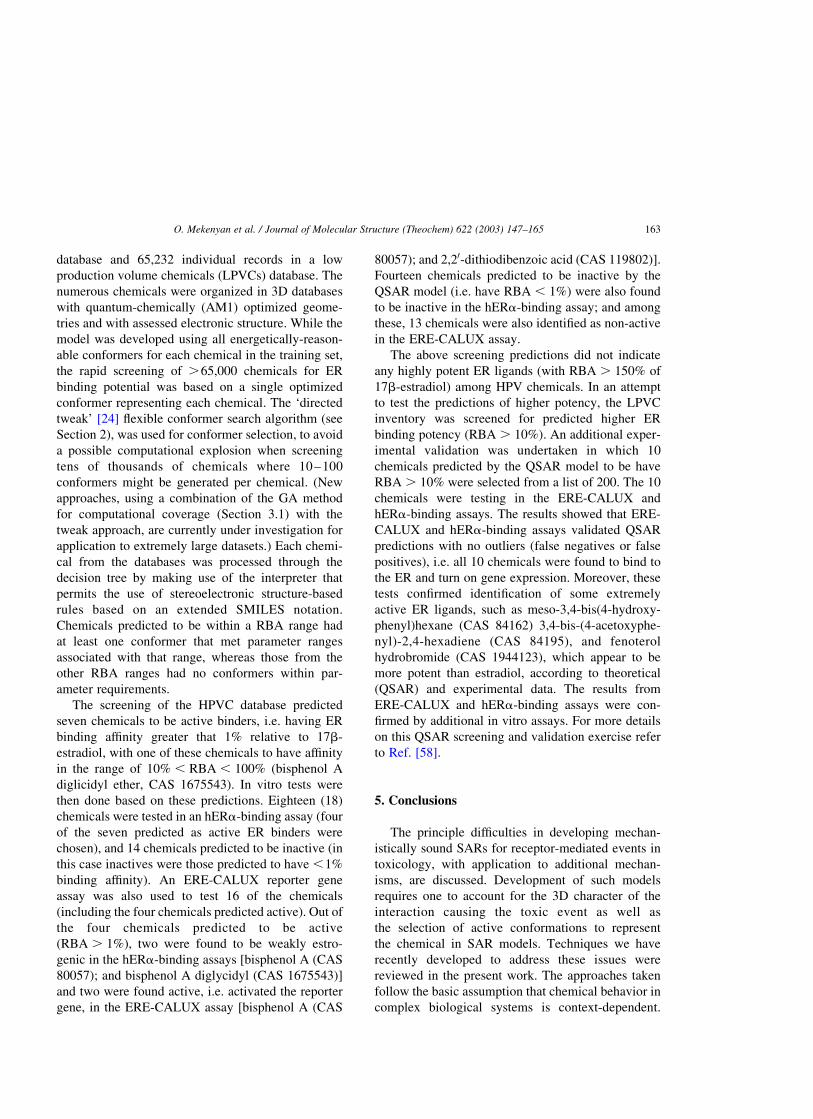
agonists (Fig. 6). However, parameters related to
molecular bulk, including solvent accessible surface
and negatively charged Van der Waal’s surface,
provided reactivity patterns that were 100% success-
ful in discriminating antagonists from agonists in the
limited data set tested (Fig. 7). The model also shows
potential to discriminate pure antagonists from partial
agonist/antagonist structures. The derived model
could be useful for predicting additional chemicals
for their ability to bind but inactivate the ER,
providing a further tool for hypothesis testing to
elucidate chemical structural characteristics associ-
ated with estrogenicity and anti-estrogenicity.
4.4. Screening of EU chemical inventories for ER
ligands
Models derived to predict ER binding affinity were
preliminarily validated by screening of the EU
chemical inventories for potentially active ER ligands
and subsequent experimental testing of a limited
number of selected chemicals using a series in vitro
and in vivo assays [57,58], including an hERa-
binding assay and a reporter-gene assay (ERE-
CALUX). The EU inventories included 908 chemicals
in a high production volume chemicals (HPVCs)Fig. 6. Reactivity pattern for ER agonists (white) and ER
antagonists (red) based on EHOMO.
Fig. 7. Reactivity pattern for ER agonists (white) and antagonists
(red) based on the calculated global 3D parameter of Van der
Waal’s partial negative surface area.
O. Mekenyan et al. / Journal of Molecular Structure (Theochem) 622 (2003) 147–165162
database and 65,232 individual records in a low
production volume chemicals (LPVCs) database. The
numerous chemicals were organized in 3D databases
with quantum-chemically (AM1) optimized geome-
tries and with assessed electronic structure. While the
model was developed using all energetically-reason-
able conformers for each chemical in the training set,
the rapid screening of .65,000 chemicals for ER
binding potential was based on a single optimized
conformer representing each chemical. The ‘directed
tweak’ [24] flexible conformer search algorithm (see
Section 2), was used for conformer selection, to avoid
a possible computational explosion when screening
tens of thousands of chemicals where 10–100
conformers might be generated per chemical. (New
approaches, using a combination of the GA method
for computational coverage (Section 3.1) with the
tweak approach, are currently under investigation for
application to extremely large datasets.) Each chemi-
cal from the databases was processed through the
decision tree by making use of the interpreter that
permits the use of stereoelectronic structure-based
rules based on an extended SMILES notation.
Chemicals predicted to be within a RBA range had
at least one conformer that met parameter ranges
associated with that range, whereas those from the
other RBA ranges had no conformers within par-
ameter requirements.
The screening of the HPVC database predicted
seven chemicals to be active binders, i.e. having ER
binding affinity greater that 1% relative to 17b-
estradiol, with one of these chemicals to have affinity
in the range of 10% , RBA , 100% (bisphenol A
diglicidyl ether, CAS 1675543). In vitro tests were
then done based on these predictions. Eighteen (18)
chemicals were tested in an hERa-binding assay (four
of the seven predicted as active ER binders were
chosen), and 14 chemicals predicted to be inactive (in
this case inactives were those predicted to have ,1%
binding affinity). An ERE-CALUX reporter gene
assay was also used to test 16 of the chemicals
(including the four chemicals predicted active). Out of
the four chemicals predicted to be active
(RBA . 1%), two were found to be weakly estro-
genic in the hERa-binding assays [bisphenol A (CAS
80057); and bisphenol A diglycidyl (CAS 1675543)]
and two were found active, i.e. activated the reporter
gene, in the ERE-CALUX assay [bisphenol A (CAS
80057); and 2,20-dithiodibenzoic acid (CAS 119802)].
Fourteen chemicals predicted to be inactive by the
QSAR model (i.e. have RBA , 1%) were also found
to be inactive in the hERa-binding assay; and among
these, 13 chemicals were also identified as non-active
in the ERE-CALUX assay.
The above screening predictions did not indicate
any highly potent ER ligands (with RBA . 150% of
17b-estradiol) among HPV chemicals. In an attempt
to test the predictions of higher potency, the LPVC
inventory was screened for predicted higher ER
binding potency (RBA . 10%). An additional exper-
imental validation was undertaken in which 10
chemicals predicted by the QSAR model to be have
RBA . 10% were selected from a list of 200. The 10
chemicals were testing in the ERE-CALUX and
hERa-binding assays. The results showed that ERE-
CALUX and hERa-binding assays validated QSAR
predictions with no outliers (false negatives or false
positives), i.e. all 10 chemicals were found to bind to
the ER and turn on gene expression. Moreover, these
tests confirmed identification of some extremely
active ER ligands, such as meso-3,4-bis(4-hydroxy-
phenyl)hexane (CAS 84162) 3,4-bis-(4-acetoxyphe-
nyl)-2,4-hexadiene (CAS 84195), and fenoterol
hydrobromide (CAS 1944123), which appear to be
more potent than estradiol, according to theoretical
(QSAR) and experimental data. The results from
ERE-CALUX and hERa-binding assays were con-
firmed by additional in vitro assays. For more details
on this QSAR screening and validation exercise refer
to Ref. [58].
5. Conclusions
The principle difficulties in developing mechan-
istically sound SARs for receptor-mediated events in
toxicology, with application to additional mechan-
isms, are discussed. Development of such models
requires one to account for the 3D character of the
interaction causing the toxic event as well as
the selection of active conformations to represent
the chemical in SAR models. Techniques we have
recently developed to address these issues were
reviewed in the present work. The approaches taken
follow the basic assumption that chemical behavior in
complex biological systems is context-dependent.
O. Mekenyan et al. / Journal of Molecular Structure (Theochem) 622 (2003) 147–165 163
A molecule can exist and interact in a variety of
conformations, with solvation and binding inter-
actions capable of compensating for energy differ-
ences among the conformers. It was shown that
selection of active conformers in QSAR studies is as
important as the selection of appropriate molecular
descriptors because the conformers of same chemicals
differ significantly in their descriptor values.
In the approach for selection of active conformers
in QSAR studies, biological activity is modeled as a
function of molecular descriptors derived from
specifically selected active conformers, rather than
as a property derived from the lowest-energy gas-
phase conformer. In a recent pattern-recognition
approach the COREPA of structurally dissimilar
chemicals acting via the same mechanism of action
is determined. This is based on the assumption that
chemicals, which elicit similar biological behavior
through a common mechanism should possess a
commonality in their stereoelectronic (reactivity)
pattern. Elucidation of this pattern requires examin-
ation of the conformational flexibility of the com-
pounds to allow evaluation of molecular similarity in
the context of specific interaction.
Applicability of both techniques were illustrated
by presenting QSAR models derived for Ah
binding affinity of PCBs and ER binding affinity
of structurally diverse chemicals. COREPA models
were found to be promising in 3D screening of
large chemical inventories, as demonstrated by
experimental validation within the EDAEP project.
Besides the impact of conformational flexibility of
chemicals in QSAR the role of different molecular
descriptors is discussed. In this respect, a classifi-
cation of descriptors according to their ability to
describe molecular interaction is suggested. This
classification could be useful as guidance for selection
of appropriate molecular parameters for modeling
different toxic endpoints according to specificity of
the underlying interactions.
Acknowledgements
This research was supported, in part, by a US EPA
Cooperative Agreement (CR CR828823-01) with the
Bourgas University ‘As. Zlatarov’, Bulgaria. This
paper has been subjected to review by the National
Health and Environmental Effects Research Labora-
tory and approved for publication. Approval does not
signify that the contents reflect the views of the
Agency, nor does mention of trade names or
commercial products constitute endorsement or rec-
ommendation for use.
References
[1] O.G. Mekenyan, J.M. Ivanov, G.D. Veith, S.P. Bradbury,
Quant. Struct.–Act. Relat. 13 (1994) 302.
[2] E.L. Eliel, in: W.A. Warr (Ed.), Chemistry in Three
Dimensions, Chemical Structures, vol. 1, Springer, Berlin,
1993.
[3] O.G. Mekenyan, G.D. Veith, D.J. Call, G.T. Ankley, Environ.
Health Perspect. 104 (1996) 1302.
[4] O.G. Mekenyan, T.W. Schultz, G.D. Veith, V.B. Kamenska,
J. Appl. Toxicol. 16 (1996) 355.
[5] S.P. Bradbury, O.G. Mekenyan, G.T. Ankley, Environ. Chem.
Toxicol. 15 (1996) 1945.
[6] S.P. Bradbury, O.G. Mekenyan, G.T. Ankley, Environ.
Toxicol. Chem. 17 (1998) 15.
[7] T. Wiese, S.C. Brooks, J. Steroid, Biochem. Mol. Biol. 50
(1994) 61.
[8] S.D. Dimitrov, O.G. Mekenyan, Chemometrics Intell. Lab.
Syst. 39 (1997) 1.
[9] O.G. Mekenyan, J.M. Ivanov, S.H. Karabunarliev, S.P.
Bradbury, G.T. Ankley, W. Karcher, Environ. Sci. Technol.
31 (1997) 3702.
[10] O.G. Mekenyan, N. Nikolova, S.H. Karabunarliev, S.P.
Bradbury, G.D. Ankley, B. Hansen, Quant. Struct.–Act.
Relat. 18 (1999) 139.
[11] T. Laidboeur, I. Laude, I.P. Bangov, D. Cabrol-Bass, J. Chem.
Inf. Comput. Sci. 34 (1994) 171.
[12] I. Bangov, Fuzzy logic in computer-aided structure elucida-
tion, in: D. Rouvray (Ed.), Fuzzy Logic in Chemistry,
Academic Press, New York, 1997.
[13] J.M. Ivanov, O.G. Mekenyan, S.P. Bradbury, G. Schuurmann,
Quant. Struct.–Act. Relat. 17 (1998) 437.
[14] S. Bradbury, V. Kamenska, P. Schmieder, G. Ankley, O.
Mekenyan, Toxicol. Sci. 58 (2000) 253.
[15] O. Mekenyan, V. Kamenska, P. Schmieder, G. Ankley, S.
Bradbury, Toxicol. Sci. 58 (2000) 270.
[16] G.M. Crippen, T.F. Havel, Distance Geometry and Molecular
Conformation, Wiley, New York, 1988.
[17] J.M. Blaney, G.M. Crippen, A. Dearing, J.S. Dixon, DGEOM:
Distance Geometry, QCPE program number 590, Department
of Chemistry, Indiana University, Bloomington, IN.
[18] M. Lipton, W.C. Still, J. Comput. Chem. 9 (1988) 343.
[19] R.A. Dammkoehler, S.F. Karasek, E.F.B. Shands, G.R.
Marshall, J. Comput.-Aided Mol. Des. 3 (1989) 3.
[20] SYBYL, Tripos Associates Inc., St Louis, MO.
[21] M. Saunders, K.N. Houk, Y.D. Wu, W.C. Still, M. Lipton, G.
Chang, W.C. Guida, J. Am. Chem. Soc. 112 (1990) 1419.
O. Mekenyan et al. / Journal of Molecular Structure (Theochem) 622 (2003) 147–165164
[22] D.E. Goldeberg, Genetic Algorithms in Search Optimization
and Machine Learning, Addison-Wesley, Wokingam, MA,
1989.
[23] A.W.R. Payne, R.C. Glent, J. Mol. Graph. 11 (1993) 74.
[24] T. Hurst, J. Chem. Inf. Comput. Sci. 34 (1994) 90.
[25] D.E. Clark, G. Jones, P. Willett, P.W. Kenny, R.C. Glen,
J. Chem. Inf. Comput. Sci. 34 (1994) 197.
[26] N.W. Murrall, E.K. Davies, J. Chem. Inf. Comput. Sci. 30
(1990) 312.
[27] J.M. Ivanov, S.H. Karabunarliev, O.G. Mekenyan, J. Chem.
Inf. Comput. Sci. 34 (1994) 234.
[28] E.K. Davie, N.M. Murrall, Comput. Chem. 13 (1989) 149.
[29] D.N.J. White, Spec. Rep. Chem. Soc. 6 (1978) 38.
[30] J.J.P. Stewart, J. Comput.-Aided Mol. Des. 4 (1990) 1.
[31] J.J.P. Stewart, MOPAC 93, Fujitsu Limited, 9-3, Nakase 1-
Chome, Mihama-ku, Chiba-city, Chiba 261, Japan, and
Stewart Computational Chemistry, 15210 Paddington Circle,
Colorado Springs, CO, 1993.
[32] G.M. Anstead, S.R. Wilson, J.A. Katzenellebogen, J. Med.
Chem. 32 (1989) 2163.
[33] G.M. Anstead, K.E. Carlson, J.A. Katzenellenbogen, Steroids
62 (1997) 268.
[34] O.G. Mekenyan, D. Dimitrov, N. Nikolova, S. Karabunarliev,
Chem. Inf. Comput. Sci. 39 (1999) 997.
[35] J.G. Topliss, R.P. Edwards, J. Med. Chem. 22 (1979) 1238.
[36] G.D. Veith, D.L. DeFoe, B.V. Bergstedt, J. Fish. Res. Board
Can. 36 (1979) 1040.
[37] C.L. Russom, S.P. Bradbury, A.R. Carlson, SAR/QSAR
Environ. Res. 4 (1995) 83.
[38] D.M. Kraichely, J. Sun, J.A. Katzenellenbogen, B.S. Katze-
nellenbogen, Endocrinology 141 (2000) 3534.
[39] O.G. Mekenyan, S.H. Karabunarliev, J.M. Ivanov, D.N.
Dimitrov, Comput. Chem. 18 (1994) 173.
[40] M.L. Connoly, J. Appl. Crystallogr. 16 (1983) 548.
[41] D.T. Stanton, P.C. Jurs, Anal. Chem. 62 (1990) 2323.
[42] O.G. Mekenyan, J.M. Ivanov, S.H. Karabunarliev, B. Hansen,
G.T. Ankley, S.P. Bradbury, in: F. Chen, G. Schuurmann
(Eds.), Proceedings of the VII Workshop on Quantitative
Structure Activity Relationships in Environmental Sciences,
1996, SETAC Press, Pensacola, FL, 2000, pp. 39–57.
[43] P. Schmieder, A. Aptula, E. Routledge, J. Sumpter, O.
Mekenyan, Environ. Toxicol. Chem. 19 (2000) 1727.
[44] L. Devroye, L. Gyorfi, G. Lugosi, A Probabilistic Theory of
Pattern Recognition, Springer, Berlin, 1996.
[45] R. Duda, P. Hart, D. Stork, Pattern Classification, second ed.,
Wiley, New York, 2000.
[46] G. McLachlan, Discriminant Analysis and Statistical Pattern
Recognition, Wiley, New York, 1992.
[47] B.W. Silverman, Density Estimation for Statistics and Data
Analysis, Chapman & Hall, London, 1986.
[48] G.D. Veith, O.G. Mekenyan, G.T. Ankley, D.J. Call, Environ.
Sci. Technol. 29 (1995) 1267.
[49] R.A. Goldstein, J.A. Katzenellenbogen, Z.A. Luthey-Schulten,
D.A. Seielstad, P.G. Wolynes, Proc. Natl Acad. Sci. 90 (1993)
9949.
[50] J.A. VanderKuur, T. Wiese, S.C. Brooks, Biochemistry 32
(1993) 7002.
[51] D.F.V. Lewis, M.G. Parker, R.J.B. King, J. Steroid Biochem.
Mol. Biol. 52 (1995) 55.
[52] C.L. Waller, J.D. McKinney, Chem. Res. Toxicol. 8 (1995)
847.
[53] C.L. Waller, T.I. Oprea, K. Chae, H.K. Park, K.S. Korach,
S.C. Laws, T.E. Wiese, W.R. Kelce, L. Earl Gray Jr., Chem.
Res. Toxicol. 9 (1996) 1240.
[54] C.L. Waller, B.W. Juma, L. Earl Gray Jr., W.R. Kelce,
Toxicol. Appl. Pharmacol. 137 (1996) 219.
[55] J.M. Wurtz, W. Bourguet, J.P. Renaud, V. Vivat, P. Chambon,
D. Moras, H. Gronemeyer, Nat. Struct. Biol. 3 (1996) 87.
[56] P.K. Schmieder, Y. Koleva, O.G. Mekenyan, SAR/QSAR
Environ. Res. 13 (2002) 353.
[57] EU (DGXII) Project IC20-CT98-0114 (EDAEP), 2000.
[58] O. Mekenyan, V. Kamenska, R. Serafimova, L. Poellinger, A.
Brouwer, J. Walker, SAR/QSAR Environ. Res. 13(6) (2002)
579.
O. Mekenyan et al. / Journal of Molecular Structure (Theochem) 622 (2003) 147–165 165