dynamic quantum clustering - lc2009/homelc2009.ita.br/a-marvin.pdf · dynamic quantum clustering a...
TRANSCRIPT

Strange Bedfellows:
Quantum Mechanics and Data
Mining ?
Dynamic Quantum Clustering
a new, visual approach to data mining
Marvin Weinstein and David Horn

What’s The Problem ?
If a grocery store customer
buys formula and diapers, how
likely are they to buy beer ?

Predicting Taste (Clustering)….
A netflix customer has
watched a certain set of
movies, what is the next
movie they would like to
watch ? (Amazon……..)
Business Information-Boeing Airlines
Boeing keeps the database
of breakdowns for its clients,
but they don’t really tell
Boeing what went wrong.

Scoring Insurance and Credit
Who is a safe bet for a loan
or insurance policy ?

Biology and Medicine
Affymetrix chip measures the
expression of ~7000 genes. Can
we identify types of Leukemia
from gene expression alone ?

Recap….
Physics, Biology, Medicine
Intelligence and Homeland security
Financial analysis, Diplomacy, Insurance, Loans
All collect large datasets
Sorting through such a data set and extracting
relevant information and/or searching for
structures is referred to as data mining.
The general concept of data mining is clear, but
data mining is not well defined !

The Data Miner’s
Lament
or
The Curse of High
Dimension
When lots of features are measured, finding
clusters is hard to do.
Questions:
◦ How can we reduce the dimension (number of
features) of a problem ?
◦ How can we best plot the data ?

ingular
alue
ecomposition
Introducing the
The Swiss Army Knife
of data mining

What is SVD?
What is the best way to look at data
when there are n samples and m features
measured ?
◦ Consider an n x m – matrix M. The SVD decomposition
of this matrix writes the matrix as:
◦ Where U is n x n
V is m x m
S is n x m and only has
non-vanishing stuff on diagonal

A Simple Example:
Data Direction
Coord
inate
s in n
ew
data
basis
More data than
coordinates.
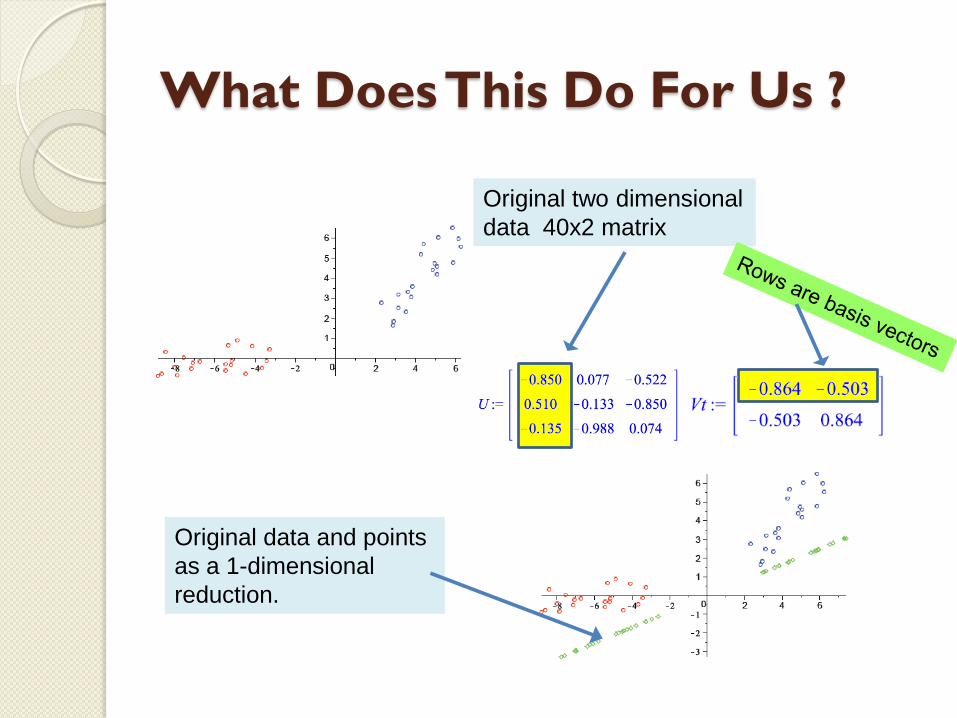
What Does This Do For Us ?
Original two dimensional
data 40x2 matrix
Original data and points
as a 1-dimensional
reduction.

Image Compression
Consider a matrix M which is a picture
The SVD decomposition lets us write M as
Define
approximation:

How well does this work ?
Any data
matrix is
a picture,
or at least
like a
picture!

What About Clustering ?
Okay, so now we have the best reduced
coordinates to plot the data, what is next.
◦ If clusters are obvious then no problem !
◦ But usually things are more
like this
◦ Need clustering algorithms!
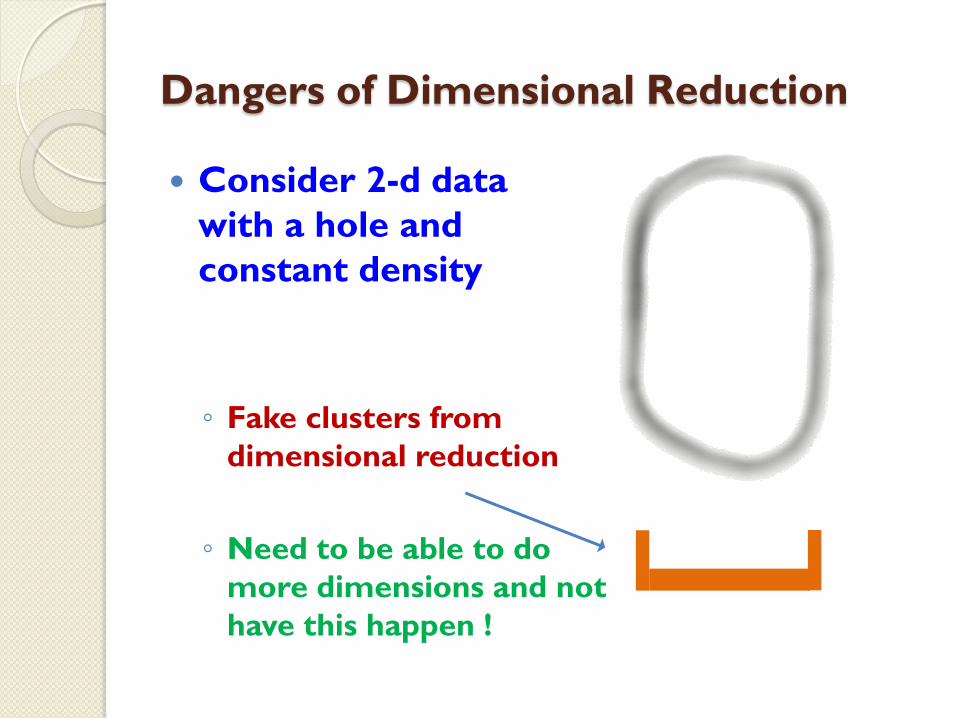
Dangers of Dimensional Reduction
Consider 2-d data
with a hole and
constant density
◦ Fake clusters from
dimensional reduction
◦ Need to be able to do
more dimensions and not
have this happen !

Hierarchical Clustering
Divisive
Agglomerative

Terminology
Hierarchical Clustering is often based on a distance function Hierarchical decomposition can be either
◦ Agglomerative hierarchical (bottom up)
◦ Divisive (top down)
Some agglomerative algorithms:K-means
C-means
Quality threshold
Other approaches◦ Diffusion geometry
.
Our method, Dynamic Quantum Clustering (DQC) is different in that it makes no initial assumptions about the number of clusters
These all depend upon
the way in which one starts
the clustering process

Dynamic Quantum Clustering

DQC – dynamic quantum clustering
The approach we have patented is very
different from existing methods.
◦ Step 1: Map the problem into a problem in
quantum mechanics
◦ Step 2: Use the properties of the quantum
problem to have the clusters form without
input from the user.

Starting Point:
The Parzen Window Estimator

Quantum Clustering (QC): Idea
Amplifying peaks and valleys…
◦ Given a wave-function which is a sum of
Gaussians, is there a potential for which it is
the ground-state of the Schrodinger equation ?
◦ Yes!!!

The Potential For Crabs In 2-d
The Crab problem – Once upon a time there was a museum which had a display case with 200 crab carapaces.
◦ The crabs were distinguished by color, male female and one of two species
◦ But the shells sat in the sun for many years and faded
◦ So, in an attempt to reclassify them they made 5 measurements of size of shell and claws.

The Potential For Crabs In 2-d
Procedure:
◦ Create the Parzen window estimator (a sum of Gaussians in 2-dim)
◦ Form the potential function
Result:The minima capture the clusters to a high degree.
◦ Problem: In high dimensions, finding minima and movingpoints is difficult.

The Method
Exploit the fact the potential function came from a problem in quantum mechanics
Mantra:◦ Heisenberg equations of motion for
expectation values of the position operators satisfy the classical equations of motion…
Translation: Centers of the wave-functions roll downhill.

Ehrenfest’sTheorem
We have a potential function
where the wave-function is a
sum of Gaussians
Each component wave-function is
centered on the original data point .
◦ Thus
◦ Each Gaussian evolves
in time and Ehrenfest
says it satisfies the
semi-classical version
of Newton’s laws

Doing a Fast Computation
Solving the time-dependent Schrodinger
equation in n-dimensions is time consuming for
a non-trivial potential
◦ It is sufficient for this problem, given
to compute
◦ Then exponentiate the finite matrix and compute the
time evolution of the expectation values. ◦ (see my earlier talk on quantum calisthenics)
Note m

Crabs In Action
Data set is 5-dimensionalSVD decompostion of data matrix reduced to 3-d


Two Ways to Exploit DQC
First , when no a-priori classification is available
◦ Blind searches for clusters in data. Use all of the features
run DQC to find clusters. Then examine the clusters to
see what points in the same cluster have in common
Second, one has data classified by means which have
nothing to do with the features measured
◦ The goal is to identify those features which are most
related to the pre-existing classification.

Example From Biology
Data set is amino acid assay of protein coat of a
class of rotoviruses (tobacco mosaic,….)
Question: Given just the amino acid data can
we identify the number of different viruses and
group the ones which belong to the same
group?
◦ Can one identify the features (i.e., amino acids) most
important to the grouping?

Evolving The Virus Data
The mass
parameter
is crucial to
combining
sub-clusters.
DQC explores
the topology
of nearby
minima by
varying the
mass. This is
intrinsically
quantum
mechanical
(tunneling).

Medicine/Biology: Cancer Data
Affymetrix gene chip assay of 72 leukemia patients
◦ 2 types: ALL and AML
ALL divided into T-cell and B-cell
AML divided into patients who underwent treatment and those who did not
Question: Can you identify cancer groups based on gene expression?
◦ Problem: data
Noise
Most genes have nothing to do with specific cancer
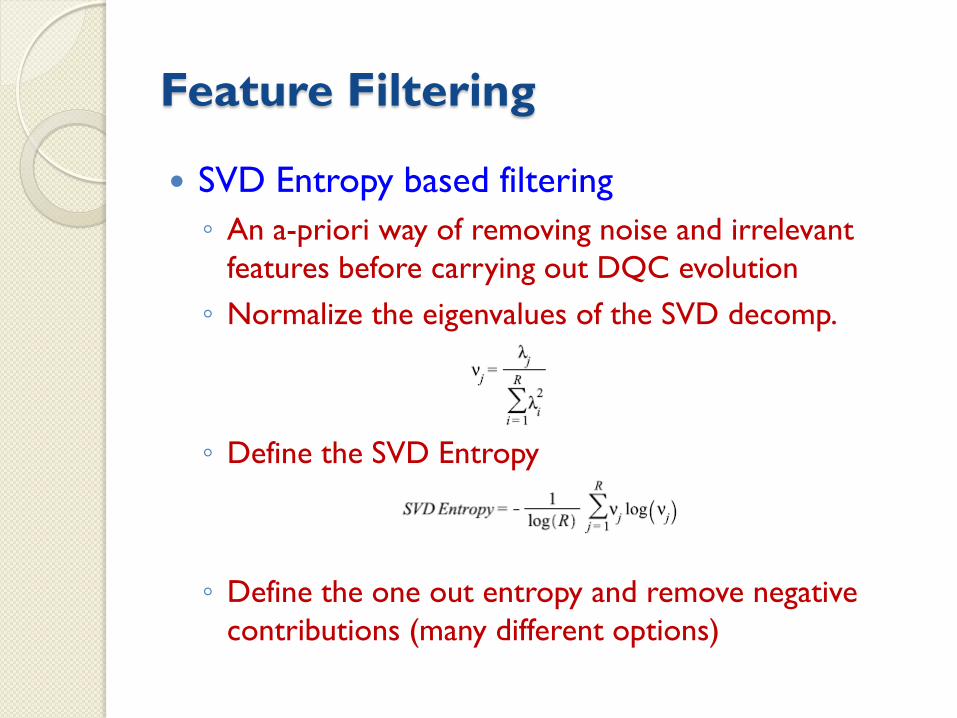
Feature Filtering
SVD Entropy based filtering
◦ An a-priori way of removing noise and irrelevant
features before carrying out DQC evolution
◦ Normalize the eigenvalues of the SVD decomp.
◦ Define the SVD Entropy
◦ Define the one out entropy and remove negative
contributions (many different options)

Feature Filtering In Practice
Unfiltered and filtered Leukemia data

Several Stages of Filtering
Data before and after DQC evolution
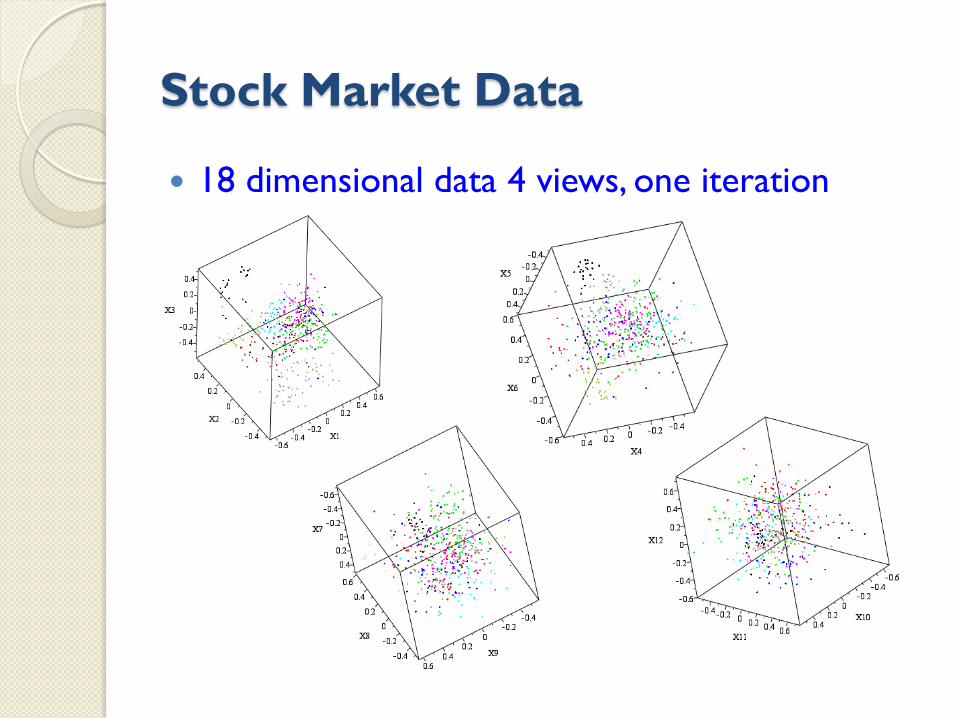
Stock Market Data
18 dimensional data 4 views, one iteration

Physics Data: SUSY Models

Recap
How does DQC differ from other methods ?
Unlike k-means, no choice of number of clusters, nor maximum distance, is required from the outset
No dependence upon the way in which one starts the clustering process
There is much less of a tendency to produce many small sub-clusters as one uses higher dimensional data (thanks to mass parameter)
Highly visual : visual analytics is hot (Georgia Tech and Homeland Security).

Clustering and Data Analysis
Given a good training set which clusters well
under DQC and which has identified groups
◦ Can we use this to classify new data sets?
◦ Yes ! (tried on stock market data)
◦ Yes ! (Used this on the physics data)
◦ Method: Incorporate training set with new data
But, only use the training set to generate the quantum
potential
Run a DQC evolution stage to have stuff migrate
towards most appropriate identified cluster
Here the coloring and visual aspect is important