dynamic reorganization of chromatin accessibility ...bcb.dfci.harvard.edu/~gcyuan/mypaper/umesh;...
TRANSCRIPT

Article
Dynamic Reorganization o
f Chromatin AccessibilitySignatures during Dedifferentiation of SecretoryPrecursors into Lgr5+ Intestinal Stem CellsGraphical Abstract
Highlights
d Bmi1Gfp cells are endocrine cells and not dedicated
facultative stem cells
d CD69 and CD274 mark related goblet cell precursors that
regenerate Lgr5+ ISCs
d CD69+CD274+ and Bmi1GFP+ cells contain a unique signature
of open chromatin sites
d Chromatin and RNA profiles of these cells shift to resemble
Lgr5+ ISCs after injury
Jadhav et al., 2017, Cell Stem Cell 21, 65–77July 6, 2017 ª 2017 Elsevier Inc.http://dx.doi.org/10.1016/j.stem.2017.05.001
Authors
Unmesh Jadhav, Madhurima Saxena,
NicholasK.O’Neill, ..., ZacharyHerbert,
Kazutaka Murata,
Ramesh A. Shivdasani
In Brief
Jadhav et al. identify an active enhancer
signature that distinguishes Lgr5+
intestinal stem cells (ISCs) from Bmi1GFP+
and other secretory cells, including
CD69+CD274+ goblet cell precursors.
These specialized cells dedifferentiate
into Lgr5+ ISCs in response to stem cell
attrition, which is accompanied by
dynamic rearrangements in open
chromatin signatures.
Cell Stem Cell
Article
Dynamic Reorganization of Chromatin AccessibilitySignatures during Dedifferentiation of SecretoryPrecursors into Lgr5+ Intestinal Stem CellsUnmesh Jadhav,1,2 Madhurima Saxena,1,2 Nicholas K. O’Neill,1 Assieh Saadatpour,3,4 Guo-Cheng Yuan,3,4,5
Zachary Herbert,6 Kazutaka Murata,1,2 and Ramesh A. Shivdasani1,2,5,7,8,*1Department of Medical Oncology and Center for Functional Cancer Epigenetics, Dana-Farber Cancer Institute, Boston, MA 02215, USA2Department of Medicine, Harvard Medical School, Boston, MA 02215, USA3Department of Biostatistics and Computational Biology, Dana-Farber Cancer Institute, Boston, MA 02215, USA4Harvard TH Chan School of Public Health, Boston, MA 02215, USA5Harvard Stem Cell Institute, Cambridge, MA 02138, USA6Molecular Biology Core Facility, Dana-Farber Cancer Institute, Boston, MA 02215, USA7Department of Medicine, Brigham and Women’s Hospital, Boston, MA 02215, USA8Lead Contact
*Correspondence: [email protected]
http://dx.doi.org/10.1016/j.stem.2017.05.001
SUMMARY
Replicating Lgr5+ stem cells and quiescent Bmi1+
cells behave as intestinal stem cells (ISCs) in vivo.Disrupting Lgr5+ ISCs triggers epithelial renewalfrom Bmi1+ cells, from secretory or absorptive pro-genitors, and from Paneth cell precursors, revealinga high degree of plasticity within intestinal crypts.Here, we show that GFP+ cells from Bmi1GFP miceare preterminal enteroendocrine cells andwe identifyCD69+CD274+ cells as related goblet cell precursors.Upon loss of native Lgr5+ ISCs, both populationsrevert toward an Lgr5+ cell identity. While active his-tone marks are distributed similarly between Lgr5+
ISCs and progenitors of both major lineages, thou-sands of cis elements that control expression of line-age-restrictedgenesare selectively open in secretorycells. This accessibility signature dynamically con-verts to that of Lgr5+ ISCs during crypt regeneration.Beyond establishing the nature of Bmi1GFP+ cells,these findings reveal how chromatin status under-lies intestinal cell diversity and dedifferentiation torestore ISC function and intestinal homeostasis.
INTRODUCTION
Self-renewal of the intestinal epithelium is sustained principally
by Lgr5+ stem cells that lie at the bottom of intestinal crypts and
replicate daily (Barker et al., 2007). It is unclear if a separate pool
of quiescent stem cells is dedicated to replenishing Lgr5+ intesti-
nal stem cells (ISCs) when necessary (Barker, 2014; Richmond
et al., 2016; Sangiorgi and Capecchi, 2008; Takeda et al., 2011).
Ambiguous expression domains of Cre recombinase in lineage-
tracing studies and of putative molecular markers fuel the uncer-
tainty. Chromatin states can shed useful light on cell populations
and on the basis for ISC recovery after ablative injuries.
Ideas about a facultative pool of reserve ISCs originated in ob-
servations on rare cells that residemainly in crypt tier 4 and retain
S phase labels for long periods, indicating replicative quiescence
(Potten, 1998). These label-retaining cells (LRCs) share many
features (small numbers, locations near tier 4, and infrequent
cell division; Sangiorgi and Capecchi, 2008; Yan et al., 2012)
with GFP+ cells in mice that express GFP from the Bmi1 locus,
Bmi1Gfp (Hosen et al., 2007). Attesting to their stem cell potential,
BmiGfp cells generate colonies in culture and increase in number
when Lgr5+ ISCs are ablated in vivo (Sangiorgi and Capecchi,
2008; Yan et al., 2012), a circumstance in which aBmi1-express-
ing population is the source of new ISCs (Tian et al., 2011). One
problem in interpreting these data is that Bmi1 is expressed
throughout intestinal crypts, including Lgr5+ ISC and transit-
amplifying (TA) cells (Itzkovitz et al., 2011; Munoz et al., 2012),
in sharp contrast to the few GFP+ cells found in BmiGfp mice (Li
et al., 2014; Yan et al., 2012). Therefore, although Bmi1 is often
regarded as a specific marker of quiescent ISCs, GFP+ cells in
BmiGfp mouse intestines represent a subset of Bmi1-expressing
cells (Itzkovitz et al., 2011; Li et al., 2014), and because TA cells
may express Cre recombinase in BmiCre mice, it is difficult to
pinpoint the source of replenished Lgr5+ ISCs by lineage tracing
(Tian et al., 2011). Identification of crypt cells by chromatin
states and new molecular markers may help resolve these
open questions.
Damage to Lgr5+ ISC triggers crypt regeneration not only from
Bmi1+ cells but also from specified enterocytes (Ent) and secre-
tory (Sec) progenitors (Pros) (Tetteh et al., 2016; van Es et al.,
2012). Even LRCs, which were previously thought to represent
quiescent ISC (Potten, 1998) but are now recognized as precur-
sors of terminal Paneth and some enteroendocrine (EE) cells,
contribute to the salvage (Buczacki et al., 2013; Li et al., 2016).
This considerable plasticity implies that diverse crypt cells either
have similar chromatin states or efficiently overcome a chro-
matin barrier when recruited to dedifferentiate into ISCs. Judging
by the active histone modifications H3K4me2 and H3K27ac,
the cis-element profiles of Lgr5+ ISC, Sec-Pro and Ent-Pro are
strikingly similar (Kim et al., 2014). This similarity may explain
divergence of the two intestinal lineages by lateral inhibition,
Cell Stem Cell 21, 65–77, July 6, 2017 ª 2017 Elsevier Inc. 65
but it is unclear how it engenders crypt cell diversity, including
Bmi1Gfp cells.
Here, we show that BmiGfp cells are preterminal EE cells and
identify related goblet cell precursors that express CD69 and
CD274. Neither population seems to represent a dedicated
pool of quiescent ISCs, but both dedifferentiate rapidly in
response to ablation of native ISCs. We identify thousands of
genome sites where chromatin is selectively open in Sec-Pro,
BmiGfp, and CD69+CD274+ cells, but not in ISCs or Ent-Pros.
Although these sites lack strong histone activation marks, they
are bona fide enhancers for Sec-restricted genes. Upon loss
of native ISCs, the distinctive chromatin signature of Bmi1Gfp
and CD69+CD274+ cells reverts dynamically toward that of
Lgr5+ cells. This transition reflects the rapid breach of a chro-
matin barrier when specified crypt cells are enlisted to restore
ISC function.
RESULTS
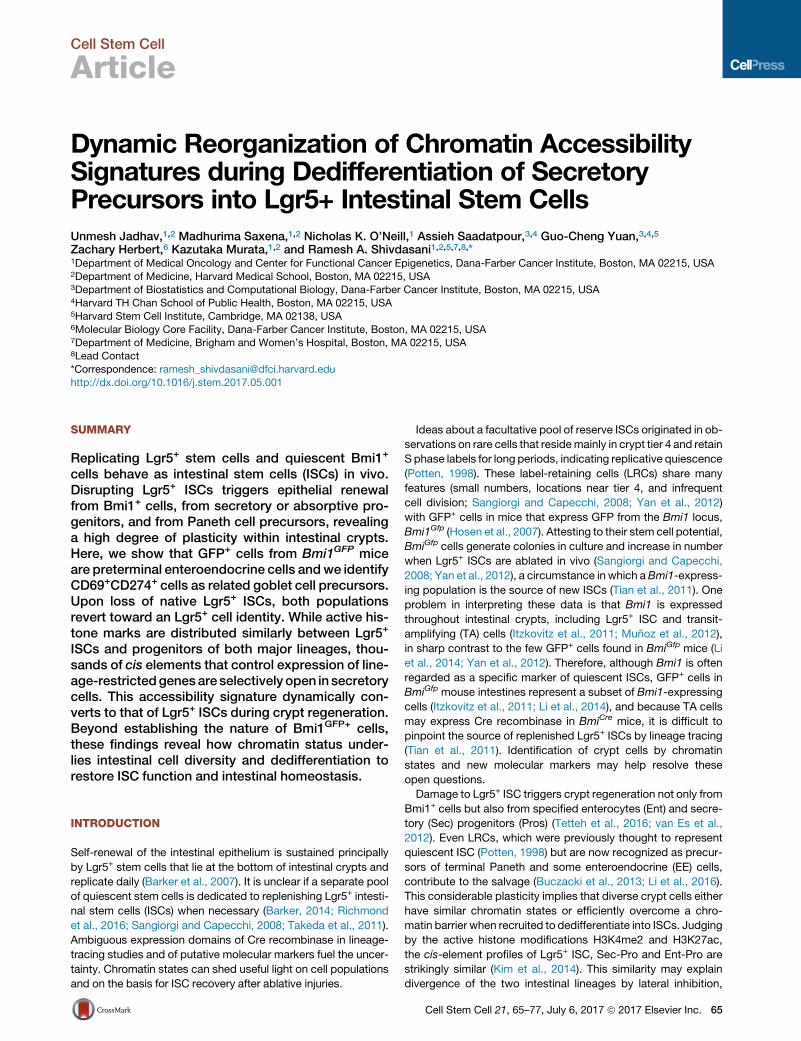
Bmi1Gfp Cells Are Mature EE Cells and Not a DedicatedPool of ‘‘Reserve’’ ISCsIn duodenal crypts inBmiGfpmice (Hosen et al., 2007), GFP+ cells
lie just above the Lgr5+ ISC and Paneth cell zone (Figure 1A). To
determine the lineage of these GFP+ cells, we isolated them by
flow cytometry (Figure S1A) and compared their RNA
sequencing (RNA-seq) profiles to those of Lgr5+ ISCs (Barker
et al., 2007), Sec-Pros isolated from wild-type crypts after phar-
macologic inhibition of Notch signaling (van Es et al., 2005), and
Ent-Pros from Atoh1�/� crypts (Kim et al., 2014) (Table S1; Fig-
ure S1B); high Epcam mRNA levels confirmed the epithelial
origin of each population (Figure S1B). We also profiled Lgr5+
ISCs harvested from another mouse strain, Lgr5Dtr-Gfp (Tian
et al., 2011) and Sec-Pros isolated after genetic disruption of
Notch activity (Kim et al., 2014) (Figure S1C). Hundreds of tran-
scripts were enriched or present exclusively in Bmi1Gfp cells,
such as the Serpina1 cluster, transcription factors (TFs) of
the Ets/Fli/Fev family, and especially genes known for EE cell
expression (Figures 1B and S1D). In principal-component anal-
ysis (PCA), Bmi1Gfp cells accounted for the bulk of variation (Fig-
ure 1C). Compared to the other populations, transcripts present
selectively (>3-fold, q < 0.05) in Bmi1Gfp cells were depleted
in the ‘‘Cell cycle’’ category and enriched for ‘‘Quiescence’’
and ‘‘Targets of fusion transcription factor EWSR1-FLI1’’ (Fig-
ure S1E). Thus, Bmi1Gfp cells have an mRNA profile distinct
from Lgr5+ ISCs and crypt progenitors.
Because one prevalent view is that BmiGfp cells represent
quiescent ISCs that periodically replenish the pool of Lgr5+ ISC
(Li et al., 2014; Richmond et al., 2016; Yan et al., 2012), we
sought to determine their position within the crypt hierarchy.
We used successive changes in mRNA expression to derive
quantitative scores for every possible trajectory among stem,
progenitor, and the abundant differentiated villus cell types: en-
terocytes and goblet cells (STAR Methods; Figure S1F). Among
every possible model, those in which BmiGfp cells spawn Lgr5+
ISCs or progenitors gave unfavorable scores; only a model
where they originate in Sec-Pros gave a high positive score (Fig-
ure 1D). In line with this result, crypts lacking ATOH1, a TF
required for Sec specification (Shroyer et al., 2007; Yang et al.,
2001), were largely devoid ofBmi1Gfp cells (Figures 1E and S1G).
66 Cell Stem Cell 21, 65–77, July 6, 2017
Bmi1Gfp cells lacked transcripts classically ascribed to goblet
or Paneth cells; rather, they were enriched for canonical EE
genes, with the hormone Ghrelin being particularly abundant
and specific (Figure S2A). We therefore purified crypt EE and
Paneth cells using flow cytometry for CD24 and Ulex europaeus
agglutinin (Wong et al., 2012), verified the purity of various cell
isolates by RT-PCR analysis of established lineage markers (Fig-
ure S2B), and profiled transcripts using RNA-seq (Table S1).
Gene set enrichment analysis (GSEA) (Subramanian et al.,
2005) and trajectory analysis indicated that Bmi1Gfp cells are
related most closely to EE cells (Figures 1F and S2C). Moreover,
91% of BmiGfp cells showed high expression of the EE-specific
marker CHGA (Figure 1G), and the population is enriched for
RNAs encoding many hormones and TFs known to control EE
cells (Figures S2D and S2E). These data reveal Bmi1Gfp cells
as non-replicating ChgA+ EE cells, with high expression of hor-
mone RNAs and Neurod1 (compared to Neurog3), suggesting
advanced differentiation (Li et al., 2012); our trajectory data sug-
gest preterminal EE maturity (Figure S2C). Bmi1Gfp cells thus do
not seem to represent a dedicated pool of reserve ISCs, though
they may when necessary dedifferentiate into Lgr5+ ISCs, like
other precursors (Buczacki et al., 2013; Schwitalla et al., 2013;
Tetteh et al., 2016; van Es et al., 2012; Westphalen et al.,
2014). Notably, no crypt cells have been captured in the act of
dedifferentiation.
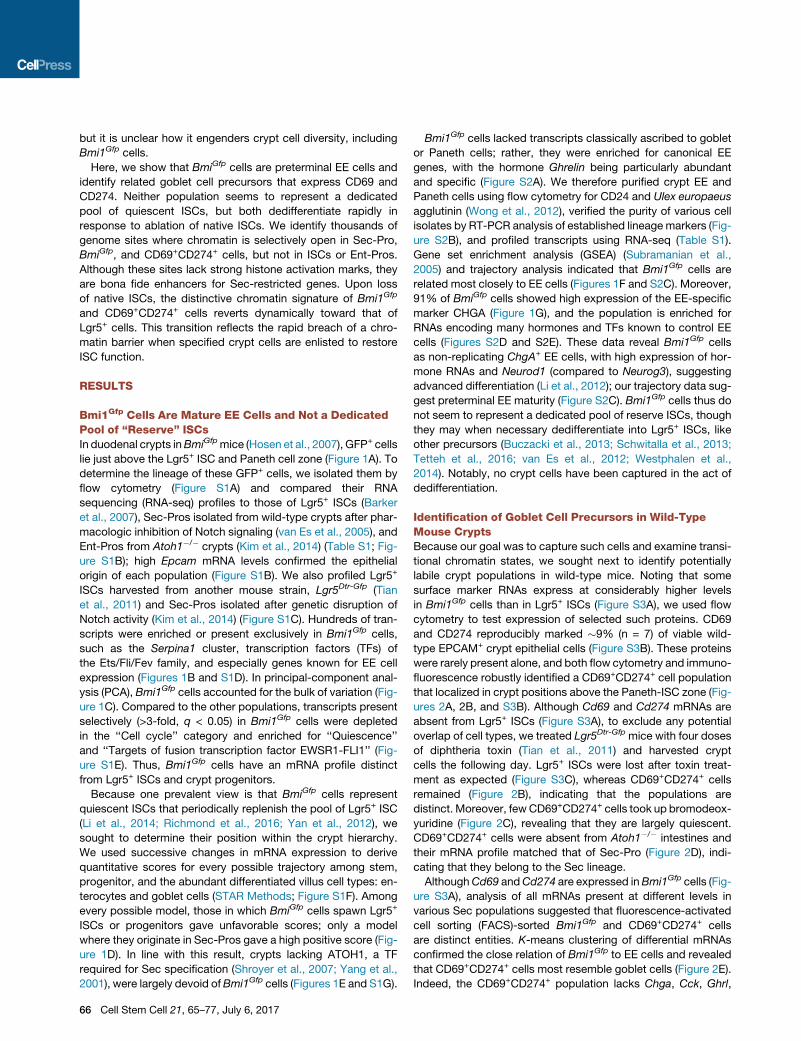
Identification of Goblet Cell Precursors in Wild-TypeMouse CryptsBecause our goal was to capture such cells and examine transi-
tional chromatin states, we sought next to identify potentially
labile crypt populations in wild-type mice. Noting that some
surface marker RNAs express at considerably higher levels
in Bmi1Gfp cells than in Lgr5+ ISCs (Figure S3A), we used flow
cytometry to test expression of selected such proteins. CD69
and CD274 reproducibly marked �9% (n = 7) of viable wild-
type EPCAM+ crypt epithelial cells (Figure S3B). These proteins
were rarely present alone, and both flow cytometry and immuno-
fluorescence robustly identified a CD69+CD274+ cell population
that localized in crypt positions above the Paneth-ISC zone (Fig-
ures 2A, 2B, and S3B). Although Cd69 and Cd274 mRNAs are
absent from Lgr5+ ISCs (Figure S3A), to exclude any potential
overlap of cell types, we treated Lgr5Dtr-Gfp mice with four doses
of diphtheria toxin (Tian et al., 2011) and harvested crypt
cells the following day. Lgr5+ ISCs were lost after toxin treat-
ment as expected (Figure S3C), whereas CD69+CD274+ cells
remained (Figure 2B), indicating that the populations are
distinct. Moreover, fewCD69+CD274+ cells took up bromodeox-
yuridine (Figure 2C), revealing that they are largely quiescent.
CD69+CD274+ cells were absent from Atoh1�/� intestines and
their mRNA profile matched that of Sec-Pro (Figure 2D), indi-
cating that they belong to the Sec lineage.
AlthoughCd69 andCd274 are expressed inBmi1Gfp cells (Fig-
ure S3A), analysis of all mRNAs present at different levels in
various Sec populations suggested that fluorescence-activated
cell sorting (FACS)-sorted Bmi1Gfp and CD69+CD274+ cells
are distinct entities. K-means clustering of differential mRNAs
confirmed the close relation of Bmi1Gfp to EE cells and revealed
that CD69+CD274+ cells most resemble goblet cells (Figure 2E).
Indeed, the CD69+CD274+ population lacks Chga, Cck, Ghrl,
A Bmi1GfpLgr5Gfp
Bmi1GfpLgr5Gfp
ISC -1
ISC -2
EP -1
EP -2
SP -1
SP -2
Bmi1-1
Bmi1-2
E
ISC (Lgr5+)
Ent-ProSec-Pro
Bmi1Gfp
- 698 - 66
F
ISC (Lgr5+)
Ent-ProSec-Pro
Bmi1Gfp
+ 963
Bmi1Gfp
Ent-ProSec-Pro
ISC (Lgr5+)
- 265 - 331
Enteroendocrine Paneth
Enr
ichm
ent S
core NES=1.49
q<0.001
0.5
0.4
0.3
0.2
0.1
0
-0.1
GGFP Merged
B
D
Enteroendocrine Goblet
Enr
ichm
ent S
core NES=1.62
q<0.001
0.5
0.4
0.3
0.2
0.1
0
-0.1
ISCBmi1Gfp
SP
EP
C
Atoh1+/+
ChgaSerpina1c
CHGA
Bmi1Gfp
103 104 105
SSC-A
GF
P
104
103
102
101
SSC-A
GF
P
104
103
102
101
103 104 105
Atoh1-/-
Serpina1a
(0-100)) (0-2,000)
CHGA+
(91.3%)
Bmi1Gfp
Figure 1. Bmi1Gfp Cells Belong to the EE Lineage
(A) Confocal microscopy on optically cleared tissue confirms the distinct locations of Lgr5+ ISCs (crypt base) and Bmi1Gfp cells (higher crypt tiers). Scale
bar, 10 mm.
(B) RNA-seq tracks illustrating Bmi1Gfp cell-restricted genes, including the Serpina1 cluster and EE marker Chga.
(C) Principal-component analysis (PCA) of mRNA differences among crypt cells. Bmi1Gfp cells are distinct from others along principal component (PC1). Three
ISC samples were derived from Lgr5Gfp and two from Lgr5Dtrmice. Two Sec-Pro samples each were isolated after pharmacologic or genetic Notch inhibition. SP,
Sec-Pro; EP, Ent-Pro.
(D) Cell trajectory models based on global mRNA levels imputeBmi1Gfp cells as descendants of Sec-Pros. Scores reflect monotonic expression changes for each
trajectory.
(E) Flow cytometry plots showing lack of Bmi1Gfp cells in Atoh1�/� crypts.
(F) Gene set enrichment analysis (GSEA) of the 500 highest expressed genes in Bmi1Gfp cells in relation to EE, Paneth, and goblet cell transcriptomes.
(G) Co-expression of GFP and CHGA in Bmi1Gfp duodenal cells (n = 165 cells). Representative individual and merged fluorescence images are displayed. Scale
bar, 20 mm.
See also Figures S1 and S2.
Cell Stem Cell 21, 65–77, July 6, 2017 67
D
A
B C
CD 69 MergedCD 274C
D 2
74
CD 69
7.8%C
D 2
74
CD 69
7.3%
CD
274
CD 69
0.26%
CD++, Lgr5-GFP
FE
NES= 1.83q<0.001
0.5
0.4
0.3
0.2
0.1
0
SP EP
Enr
ichm
ent S
core
Atoh1-/-
Lgr5Dtr-Gfp (Post-DT)
Wild type
G
Fcgbp
SP
Bmi1
EE
CD++
Goblet
Paneth
(0 – 2,000)
Goblet
Sec-Pro
(-44)
CD69+ CD274+
Paneth
(+2,366) (-388) Enteroendocrine
8,95
3 ge
nes
SP Bmi1 EE CD++ Gob Pan
Min Max
Tac1
Reg4
Chga
Ghrl
Cck
Fgf1
Smad1
Aqp3
Muc13
Fcgbp
Muc2
Zg16
Lyz1Defa5
Gob
let
depl
eted
Bm
i1G
fp/ E
EG
ob
let
/CD
++
Pan
eth
(q < 0.05, 3X )
CD++ BrdU
CD69+CD274+
Brdu-
(92.8%)
Lgr5Cre-GfpWild type
(legend on next page)
68 Cell Stem Cell 21, 65–77, July 6, 2017
and other abundant EE transcripts but selectively expresses
known goblet cell genes (Pelaseyed et al., 2014; Zhu
et al., 2016) (Figures 2E, 2F, and S3D). mRNA flux in the
Sec lineage also gave the best score for the trajectory Sec-
Pro / CD69+CD274+ cells / goblet cells (Figure 2G). Thus,
CD69+CD274+ crypt cells represent a wild-type Sec population
that is anatomically close to the ISC zone and strongly biased
toward goblet cell differentiation.
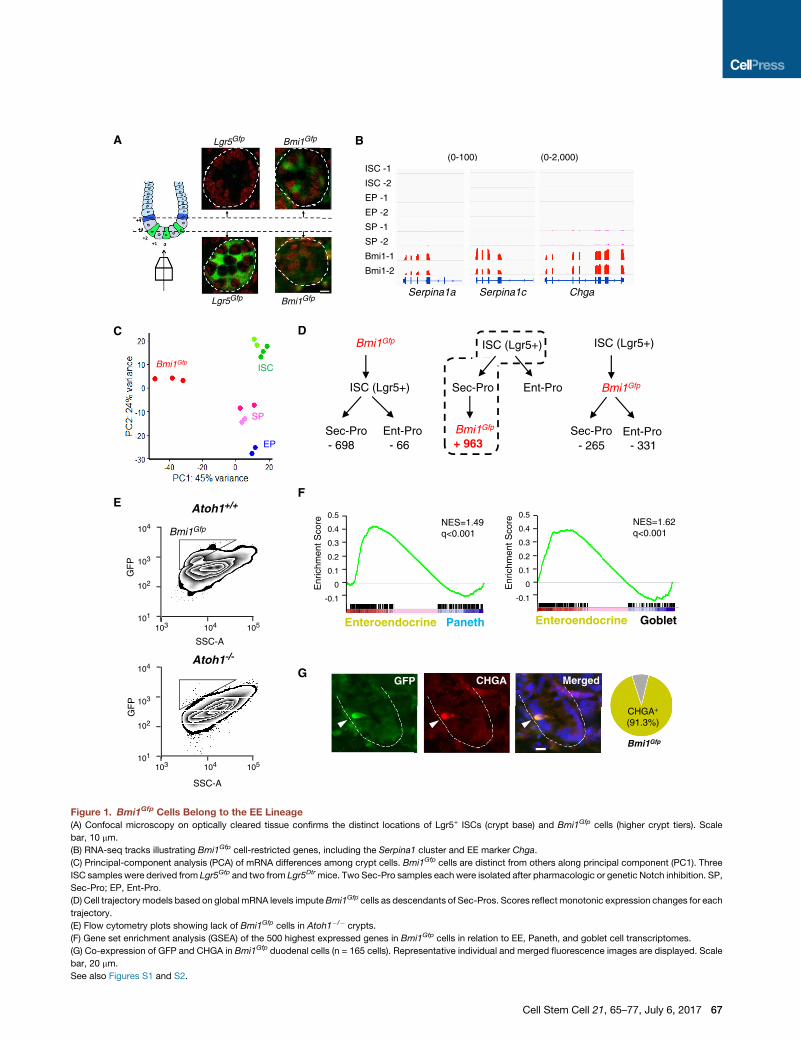
mRNA Changes Identify Sec Cells in the Act ofDedifferentiationLineage tracing studies have elegantly revealed the origins of
new Lgr5+ ISC, generally days or weeks after injury to the native
ISC pool (Barker, 2014). To detect such a transition in Bmi1Gfp
cells, we confirmed that 10 Gy whole-body g-irradiation elimi-
nates Lgr5+ ISCs, as reported previously (Metcalfe et al.,
2014), delivered this dose to Bmi1Gfp mice, and isolated GFP+
cells 36 hr later. Because the Lgr5 locus is unmodified in these
mice, GFP+ cells originate exclusively in the Bmi1Gfp population,
and the short interval enabled capture of cells during their
possible conversion to GFP� ISCs. Irradiated Bmi1Gfp mice
yielded three to four times more GFP+ cells than unirradiated
controls, as reported previously (Tian et al., 2011; Yan et al.,
2012). After irradiation, Bmi1Gfp cells showed mRNA features
that normally signify either Bmi1Gfp cells or Lgr5+ ISCs (but not
both); reduced levels of otherwise abundant and specific tran-
scripts, such as the Serpina1 cluster, were particularly evident
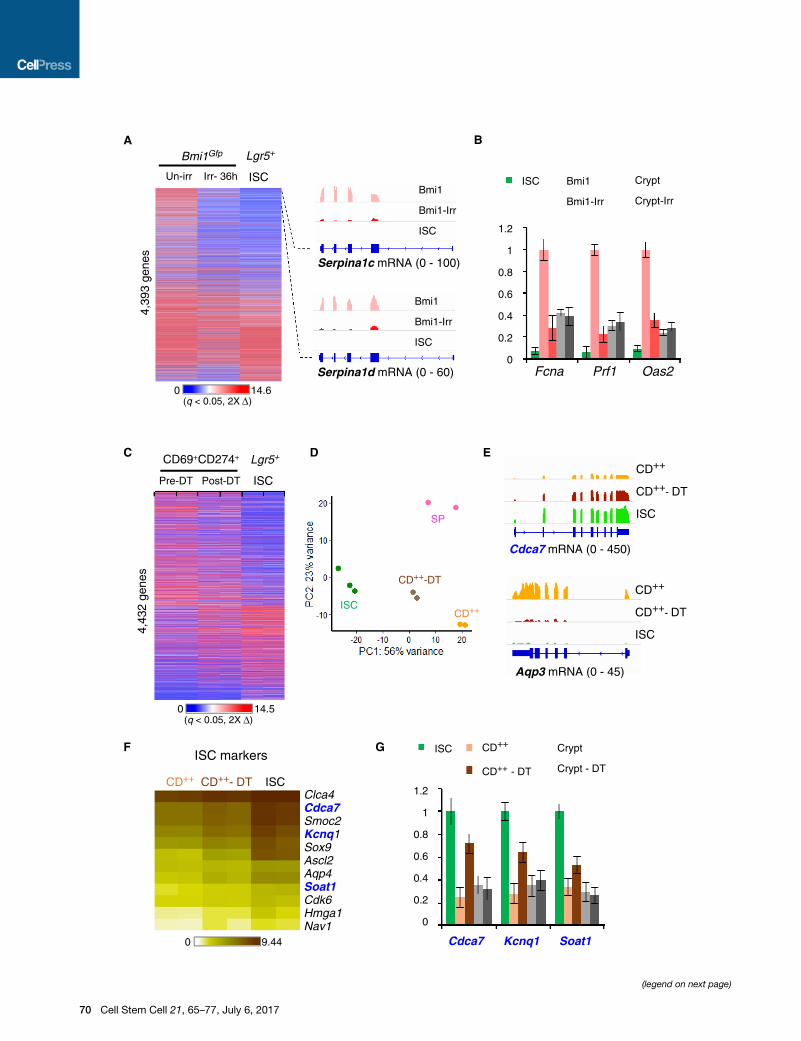
(Figure 3A). RT-PCR analysis of changes in Bmi1Gfp cells,
compared to bulk crypt cells isolated before and after irradiation,
demonstrated the specificity of this response (Figures 3B and
S3E). Thus, radiation-induced loss of native ISCs forces Bmi1Gfp
cells into a genuine transition.
To determine whether CD69+CD274+ cells also can revert into
ISCs, we were sensitive to the possibility that, beyond elimi-
nating Lgr5+ cells, g-irradiation might directly affect other cell
types. We therefore treated Lgr5Dtr-Gfp mice with diphtheria
toxin, which ablates Lgr5+ ISCs selectively (Tian et al., 2011).
We verified that Lgr5+ ISCs begin to return 2 days after the last
dose of toxin and harvested CD69+CD274+ cells 1 day after
this final dose, i.e., while GFP+ cells are absent from the crypt
(Figure S3C). We observed attenuation of CD69+CD274+ cell-
specific genes and clear activation of genes ordinarily expressed
only in ISCs (Figure 3C). PCA placed post-toxin cells in a discrete
group, related more closely than parental CD69+CD274+ cells to
Lgr5+ ISC (Figure 3D), and at least half among a panel of 12 strin-
gently defined ISC-specific genes (Munoz et al., 2012) were
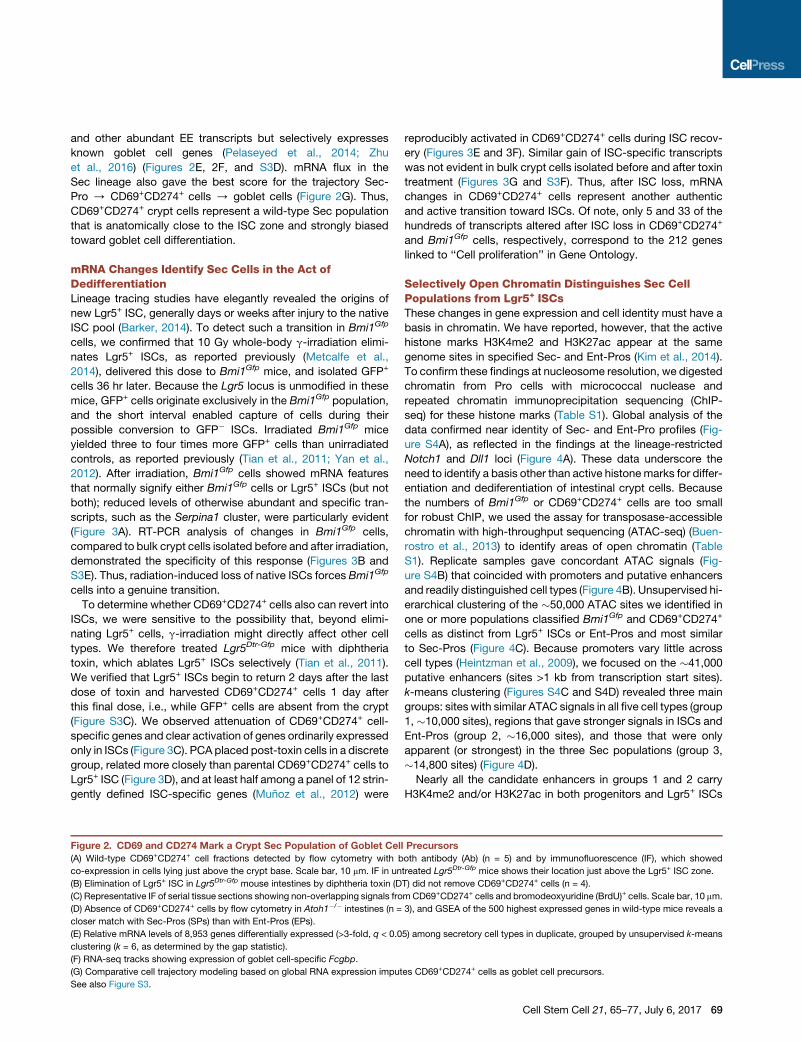
Figure 2. CD69 and CD274 Mark a Crypt Sec Population of Goblet Cel(A) Wild-type CD69+CD274+ cell fractions detected by flow cytometry with b
co-expression in cells lying just above the crypt base. Scale bar, 10 mm. IF in un
(B) Elimination of Lgr5+ ISC in Lgr5Dtr-Gfp mouse intestines by diphtheria toxin (D
(C) Representative IF of serial tissue sections showing non-overlapping signals fro
(D) Absence of CD69+CD274+ cells by flow cytometry in Atoh1�/� intestines (n =
closer match with Sec-Pros (SPs) than with Ent-Pros (EPs).
(E) Relative mRNA levels of 8,953 genes differentially expressed (>3-fold, q < 0.0
clustering (k = 6, as determined by the gap statistic).
(F) RNA-seq tracks showing expression of goblet cell-specific Fcgbp.
(G) Comparative cell trajectory modeling based on global RNA expression imput
See also Figure S3.
reproducibly activated in CD69+CD274+ cells during ISC recov-
ery (Figures 3E and 3F). Similar gain of ISC-specific transcripts
was not evident in bulk crypt cells isolated before and after toxin
treatment (Figures 3G and S3F). Thus, after ISC loss, mRNA
changes in CD69+CD274+ cells represent another authentic
and active transition toward ISCs. Of note, only 5 and 33 of the
hundreds of transcripts altered after ISC loss in CD69+CD274+
and Bmi1Gfp cells, respectively, correspond to the 212 genes
linked to ‘‘Cell proliferation’’ in Gene Ontology.
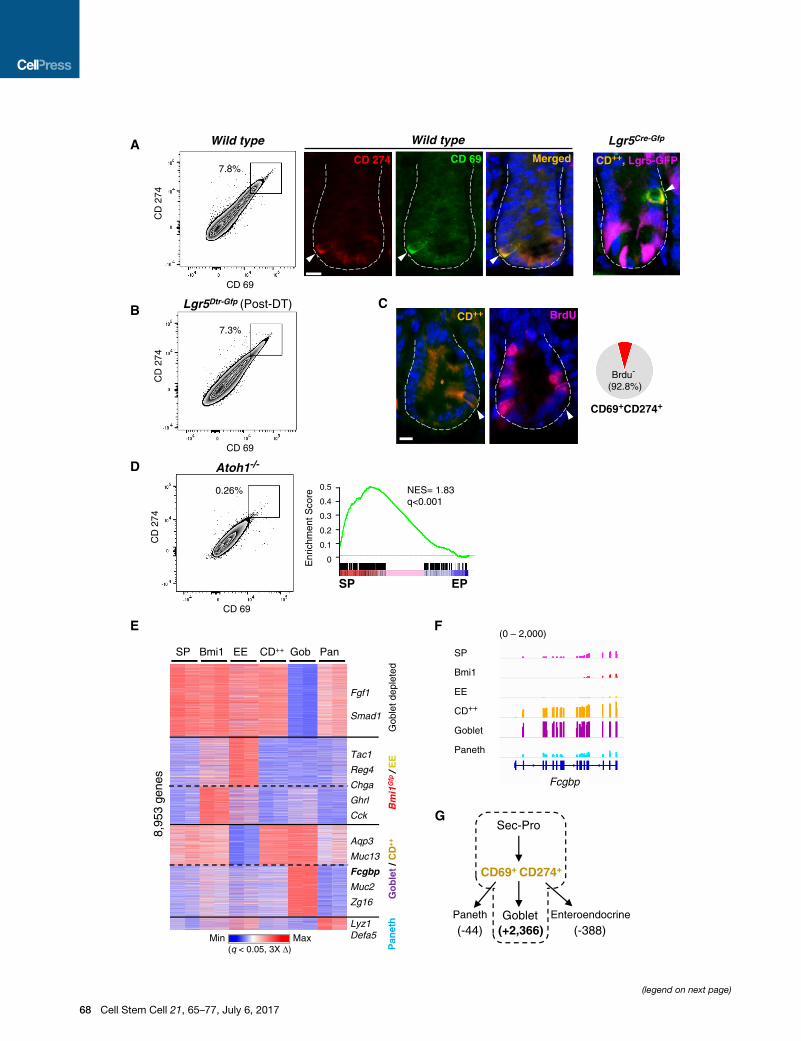
Selectively Open Chromatin Distinguishes Sec CellPopulations from Lgr5+ ISCsThese changes in gene expression and cell identity must have a
basis in chromatin. We have reported, however, that the active
histone marks H3K4me2 and H3K27ac appear at the same
genome sites in specified Sec- and Ent-Pros (Kim et al., 2014).
To confirm these findings at nucleosome resolution, we digested
chromatin from Pro cells with micrococcal nuclease and
repeated chromatin immunoprecipitation sequencing (ChIP-
seq) for these histone marks (Table S1). Global analysis of the
data confirmed near identity of Sec- and Ent-Pro profiles (Fig-
ure S4A), as reflected in the findings at the lineage-restricted
Notch1 and Dll1 loci (Figure 4A). These data underscore the
need to identify a basis other than active histone marks for differ-
entiation and dediferentiation of intestinal crypt cells. Because
the numbers of Bmi1Gfp or CD69+CD274+ cells are too small
for robust ChIP, we used the assay for transposase-accessible
chromatin with high-throughput sequencing (ATAC-seq) (Buen-
rostro et al., 2013) to identify areas of open chromatin (Table
S1). Replicate samples gave concordant ATAC signals (Fig-
ure S4B) that coincided with promoters and putative enhancers
and readily distinguished cell types (Figure 4B). Unsupervised hi-
erarchical clustering of the �50,000 ATAC sites we identified in
one or more populations classified Bmi1Gfp and CD69+CD274+
cells as distinct from Lgr5+ ISCs or Ent-Pros and most similar
to Sec-Pros (Figure 4C). Because promoters vary little across
cell types (Heintzman et al., 2009), we focused on the �41,000
putative enhancers (sites >1 kb from transcription start sites).
k-means clustering (Figures S4C and S4D) revealed three main
groups: sites with similar ATAC signals in all five cell types (group
1, �10,000 sites), regions that gave stronger signals in ISCs and
Ent-Pros (group 2, �16,000 sites), and those that were only
apparent (or strongest) in the three Sec populations (group 3,
�14,800 sites) (Figure 4D).
Nearly all the candidate enhancers in groups 1 and 2 carry
H3K4me2 and/or H3K27ac in both progenitors and Lgr5+ ISCs
l Precursorsoth antibody (Ab) (n = 5) and by immunofluorescence (IF), which showed
treated Lgr5Dtr-Gfp mice shows their location just above the Lgr5+ ISC zone.
T) did not remove CD69+CD274+ cells (n = 4).
m CD69+CD274+ cells and bromodeoxyuridine (BrdU)+ cells. Scale bar, 10 mm.
3), and GSEA of the 500 highest expressed genes in wild-type mice reveals a
5) among secretory cell types in duplicate, grouped by unsupervised k-means
es CD69+CD274+ cells as goblet cell precursors.
Cell Stem Cell 21, 65–77, July 6, 2017 69
A
F
B
ISC
SP
CD++
CD++-DT
C E
Serpina1d mRNA (0 - 60)
D
Bmi1
Bmi1-Irr
ISC
CD++ CD++- DT ISC
ISC markers
0 9.44
Clca4Cdca7Smoc2Kcnq1Sox9Ascl2Aqp4Soat1Cdk6Hmga1Nav1
Serpina1c mRNA (0 - 100)
Bmi1
Bmi1-Irr
ISC
Cdca7 mRNA (0 - 450)
CD++
CD++- DT
ISC
G
Aqp3 mRNA (0 - 45)
CD++
CD++- DT
ISC
CD69+CD274+ Lgr5+
ISC
4,43
2 ge
nes
0 14.5
Pre-DT Post-DT
(q < 0.05, 2X )
4,39
3 ge
nes
0 14.6
Lgr5+
ISC
Bmi1Gfp
Un-irr Irr- 36h
(q < 0.05, 2X )
Fcna Prf1 Oas2
1.2
1
0.8
0.6
0.4
0.2
0
Bmi1
Bmi1-Irr
ISC Crypt
Crypt-Irr
CD++
CD++ - DT
ISC Crypt
Crypt - DT
Cdca7 Kcnq1 Soat1
1.2
1
0.8
0.6
0.4
0.2
0
(legend on next page)
70 Cell Stem Cell 21, 65–77, July 6, 2017
(Figure 4D) and correspond to sites previously identified (Kim
et al., 2014) by ChIP-seq for these active histone marks (Fig-
ure S4D). In contrast, regions in group 3 lack these marks
and had therefore eluded detection previously. Sites open in
Ent-Pros gave ATAC signals of comparable strength in Lgr5+
ISCs, while chromatin access in CD69+CD274+ and Bmi1Gfp
cells resembled Sec-Pros (Figures 4D and 4E). This dominance
of group 2 enhancers in Lgr5+ ISCs and Ent-Pros, and of group
3 enhancers in the Sec lineage, is striking.
Regions of Selectively Open Chromatin in Sec CellsRepresent Bona Fide Active cis ElementsMany active embryonic stem cell (ESC) enhancers have open
chromatin but lack H3K27ac (Pradeepa et al., 2016), similar to
group 3 sites in Sec cells (Figures 4D and S4D). Because such
discrepancy between open chromatin and active histone marks
is not appreciated widely in adult tissues, we asked if group 3
sites correspond to functional enhancers. ChIP-seq for the
poised enhancer feature H3K4me1 (Figure S5A) (Shlyueva
et al., 2014) gave stronger signals than the other marks, revealing
H3K4me1 at many group 3 sites (Figures 5A and 5B). Of note,
this mark also appeared at the same sites in Sec- and Ent-
Pros; thus, the three histonemarks associated with enhancer ac-
tivity showed high concordance with ATAC signals across all cell
types (Figure S5B). In further support of the bona fides of group 3
regions, ATAC signals are comparable to those in group 2 (Fig-
ures 4D and 4E), many of the sites are also accessible in lympho-
cytes (Lara-Astiaso et al., 2014), and nearby genes are as or
more enriched for distinctive biological processes than those
near well-marked enhancers in group 2 (Figure S5C). Moreover,
while group 2 regions are enriched in motifs for known entero-
cyte-active factors (HNF4A and CDX2; Verzi et al., 2010), those
in group 3 are equally enriched for distinct TF sequence motifs
(ETS, FLI, FEV, and RUNX; Figure S5C). FEV in particular is ex-
pressed in rare crypt cells that lie just above the ISC zone, coin-
cident with CD69+ cells (Figure 5C), and RNA expression and
ATAC signals for several TF genes in the FL1/FEV family are spe-
cific to Sec cells (Figure 5D). Finally, many loci, including CD69,
showed Sec cell-restricted ATAC- and RNA-seq signals (Fig-
ure 5E), much as the signals at Lgr5 were restricted to ISC (Fig-
ure S5D). To assess global trends in cell-restricted gene control,
we applied a GSEA approach (Subramanian et al., 2005) to relate
cell-type-specific transcripts (Figure 2E) to sites of open chro-
matin. While no set of specific genes was preferentially located
near group 2 regions (Figure S5E), those enriched in Bmi1Gfp
Figure 3. Modulation of Gene Expression in BmiGfp and CD69+CD274+
(A) mRNA changes inBmiGfp cells before and after g-irradiation. The 4,393 genes d
in descending order of baseline differences; RNA levels in post-irradiated BmiGfp
levels of BmiGfp cell-specific Serpina1 transcripts.
(B) qRT-PCR analysis showing that changes in gene expression triggered by ISC
biological triplicates).
(C) mRNA changes in CD69+CD274+ cells (CD2+) before and after ISC loss. The 4,4
arranged in descending order of differences, and RNA levels in CD2+ cells after d
(D) PCA of mRNA modulation showing that, upon DT-induced ISC loss, CD2+ ce
(E) Representative RNA-seq data showing increase of ISC-specific (Cdca7) and
(F) Heatmap representation of 12 stringently defined ISC marker genes (Munoz e
(G) qRT-PCR analysis showing selective gain of ISC maker genes in CD2+ cells co
biological triplicates).
See also Figure S3.
cells and Sec-Pros were preferentially located near group 3 sites
(Figure 5F). Thus, these areas of selective chromatin access
are authentic enhancers for Sec-specific genes associated
with distinct TFs and biologic functions.
Dynamic Transitions of Open Chromatin inDedifferentiating Crypt Sec CellsThe nearly identical profiles of chromatin access in Lgr5+ ISC
and Ent-Pro (Figure 4D) imply a low barrier for the latter cells
to replace lost Lgr5+ ISCs, as occurs after g-irradiation (Tetteh
et al., 2016). However, Dll1+ Sec-Pros (van Es et al., 2012)
and label-retaining cells (Buczacki et al., 2013) also can replace
lost Lgr5+ ISCs, and Bmi1Gfp and CD69+CD274+ cells both tran-
sition toward Lgr5+ ISCs (Figure 3). The abundance of additional
enhancers (group 3) in the Sec lineage implies that these cells
must traverse this chromatin barrier when they dedifferentiate.
To witness chromatin dynamics during dedifferentiation, first
we harvested Bmi1Gfp cells 24 hr and 36 hr after 10 Gy g-irradi-
ation and compared the ATAC profiles to those of Bmi1Gfp cells
from unirradiated mice. Unsupervised clustering based on ATAC
signals in all populations placed the post-radiation cells closer to
Lgr5+ ISCs than to the parental cells (Figure 6A). Post-radiation
cells showed low ATAC signal at many group 3 regions that
are unequivocally accessible in unirradiated Bmi1Gfp cells and
stronger signals at many ISC-specific sites (Figure 6B); the latter
effect may be dampened by the inability to capture fully reverted
cells, whose diminished Bmi1 expression would reduce GFP
to sub-threshold levels. We then compared chromatin from
CD69+CD274+ cells isolated before and after ablation of ISC in
Lgr5Dtr mice. Again, the baseline profile of accessible chromatin
shifted dramatically to that of Lgr5+ ISCs, showing loss of group 3
and gain of group 2 enhancers (Figures 6C and 6D). Although we
isolated cells based on CD69 and CD274, which are restricted
to Lgr5� cells (Figures 2B and S3A), the gain of group 2 en-
hancers was extensive, in agreement with activation of genes
usually restricted to Lgr5+ ISCs (Figure 3D-F). Global analyses
confirmed significant adaptive modulation of chromatin state
during Sec cell dedifferentiation, irrespective of the cell source
(Bmi1Gfp or CD69+274+) or the mode of ISC attrition (Figures
6E and S6).
DISCUSSION
At least two mutually exclusive intestinal crypt cell types mani-
fest stem cell behavior in vivo: cycling Lgr5+ cells (Barker et al.,
Cells upon Lgr5+ ISC Lossifferentially expressed (>2-fold, q < 0.05) in Lgr5+ andBmiGfp cells are arranged
cells are shown alongside. Representative RNA-seq tracks showing reduced
loss occur in BmiGfp and not all crypt cells (n = 3 each; error bars are SD from
32 genes differentially expressed (>2-fold, q < 0.05) in Lgr5+ and CD2+ cells are
iphtheria toxin (DT) are shown in the middle.
lls cluster away from native CD2+ and closer to ISCs.
reduction of goblet-specific (Aqp3) transcripts.
t al., 2012).
mpared to bulk populations of crypt cells (n = 3 each; error bars are SDs from
Cell Stem Cell 21, 65–77, July 6, 2017 71
B
D E
C
A
SP-1
SP-2
CD++-1
CD++-2
Bmi1-1
Bmi1-2
ISC-1
ISC-2
EP-1
EP-2
ISC EP SP Bmi1 CD++
H3K4me2 H3K27acISC EP SP EP SP
Gro
up 1
Gro
up 2
Gro
up 3
0 5 0 22 0 18-1.5 +1.5
7,50
2si
tes
16,2
91si
tes
14,8
35si
tes
(0-20)
(0-25)
(0-50)
Notch1
EP
SPH3K
4me2
H3K
27ac
RN
A
(0-35)
(0-35)
EP
SP
EP
SP(0-200)
Dll1
Group 2Group 3
Lgr5+ ISC
4
0
Bmi1Gfp cell
4
0
4
0CD69+ CD274+
ISC-1
ISC-2
EP-1
EP-2
SP-1
SP-2
CD++-1
CD++-2
Bmi1-1
Bmi1-2
(0-20)
Thumpd3 Fli1
Figure 4. Distinctive Profile of Chromatin Access Separates Sec Cells, Including BmiGfp and CD69+CD274+, from ISC and Ent Cells
(A) ChIP- and RNA-seq data tracks showing similar locations and strength of active enhancer marks H3K4me2 and H3K27ac along loci specifically expressed in
Sec-Pros (SPs; Dll1) and Ent-Pros (EPs; Notch1).
(B) ATAC signal tracks from duplicates of each crypt cell type at loci that illustrate differential chromatin access.
(C) Matrix of Spearman correlation coefficients for global chromatin access derived from ATAC-seq data. Sec-Pro, Bmi1Gfp, and CD2+ cells cluster separately
from ISCs and Ent-Pros.
(D) Heatmaps showingK-means-derived grouping of 41,167 regions (>1 kb from TSSs) of ATAC- identified open chromatin alongside active histonemarks (Chip-
seq) at the same sites. ChIP data on ISCs were reported previously from sonicated chromatin (Kim et al., 2014); MNase-ChIP data on EPs and SPs are new to
this study.
(E) Average ATAC signals at group 2 and group 3 enhancers in ISCs, Bmi1Gfp cells, and CD2+ cells.
See also Figure S4.
72 Cell Stem Cell 21, 65–77, July 6, 2017
Gro
up 3
A
-3.5 +3.5
ISC
EP
SP
Bmi1
CD++
EP SPH3K4me1
CD69, FEV
CD69G
roup
2
Bmi1 ISC
NES=1.27q<0.001
0.45
0.30
0.15
0-0.05E
nric
hmen
t Sco
re
Group 3 linked genes
FEV
B
D
0
350
22
C
ISCEPSP
Bmi1
CD++
EPSP
ATA
C (0
-20)
H3K
4me1
(0-1
8)4922502D21Rik
ISC
EP
SP
Bmi1
CD++
Sec
Sec
E F
SP ISC
NES=1.1q<0.001
0.45
0.30
0.15
0-0.05E
nric
hmen
t Sco
re
(log2
fold
-)
CSI/ 1i
mB egnahc
diffe
rent
ial A
TAC
differential RNA(log2 fold-change Bmi1/ISC)
Ascl2
Olfm4
Fli1
CD69
Group 3 regionGroup 2 region
mR
NA
(0-15)
CD69
ATA
C (0-25)
Ets1
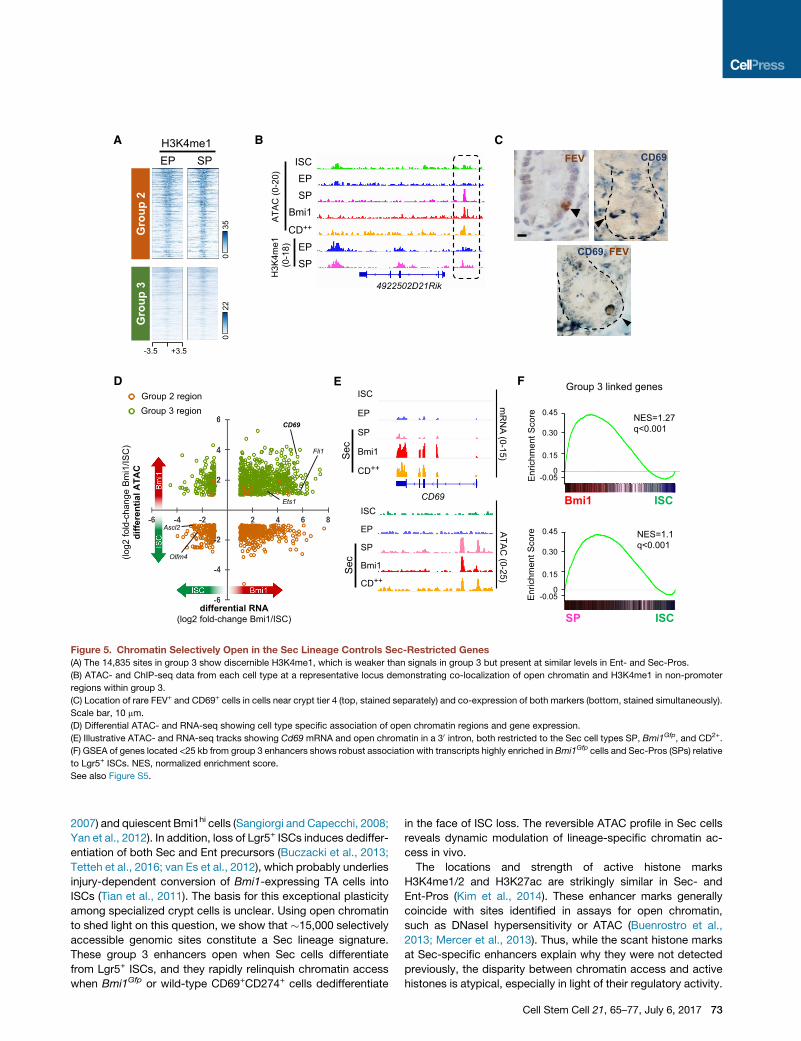
Figure 5. Chromatin Selectively Open in the Sec Lineage Controls Sec-Restricted Genes(A) The 14,835 sites in group 3 show discernible H3K4me1, which is weaker than signals in group 3 but present at similar levels in Ent- and Sec-Pros.
(B) ATAC- and ChIP-seq data from each cell type at a representative locus demonstrating co-localization of open chromatin and H3K4me1 in non-promoter
regions within group 3.
(C) Location of rare FEV+ and CD69+ cells in cells near crypt tier 4 (top, stained separately) and co-expression of both markers (bottom, stained simultaneously).
Scale bar, 10 mm.
(D) Differential ATAC- and RNA-seq showing cell type specific association of open chromatin regions and gene expression.
(E) Illustrative ATAC- and RNA-seq tracks showing Cd69 mRNA and open chromatin in a 30 intron, both restricted to the Sec cell types SP, Bmi1Gfp, and CD2+.
(F) GSEA of genes located <25 kb from group 3 enhancers shows robust association with transcripts highly enriched in Bmi1Gfp cells and Sec-Pros (SPs) relative
to Lgr5+ ISCs. NES, normalized enrichment score.
See also Figure S5.
2007) and quiescent Bmi1hi cells (Sangiorgi and Capecchi, 2008;
Yan et al., 2012). In addition, loss of Lgr5+ ISCs induces dediffer-
entiation of both Sec and Ent precursors (Buczacki et al., 2013;
Tetteh et al., 2016; van Es et al., 2012), which probably underlies
injury-dependent conversion of Bmi1-expressing TA cells into
ISCs (Tian et al., 2011). The basis for this exceptional plasticity
among specialized crypt cells is unclear. Using open chromatin
to shed light on this question, we show that �15,000 selectively
accessible genomic sites constitute a Sec lineage signature.
These group 3 enhancers open when Sec cells differentiate
from Lgr5+ ISCs, and they rapidly relinquish chromatin access
when Bmi1Gfp or wild-type CD69+CD274+ cells dedifferentiate
in the face of ISC loss. The reversible ATAC profile in Sec cells
reveals dynamic modulation of lineage-specific chromatin ac-
cess in vivo.
The locations and strength of active histone marks
H3K4me1/2 and H3K27ac are strikingly similar in Sec- and
Ent-Pros (Kim et al., 2014). These enhancer marks generally
coincide with sites identified in assays for open chromatin,
such as DNaseI hypersensitivity or ATAC (Buenrostro et al.,
2013; Mercer et al., 2013). Thus, while the scant histone marks
at Sec-specific enhancers explain why they were not detected
previously, the disparity between chromatin access and active
histones is atypical, especially in light of their regulatory activity.
Cell Stem Cell 21, 65–77, July 6, 2017 73
A B
CD
E
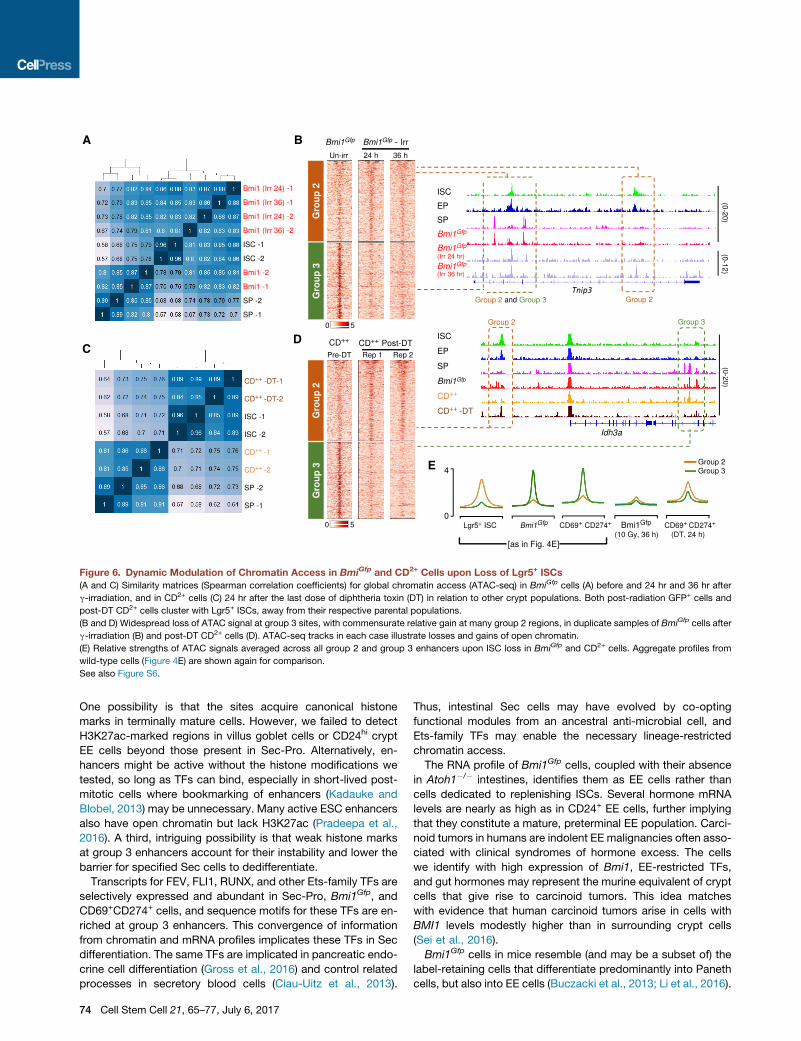
Figure 6. Dynamic Modulation of Chromatin Access in BmiGfp and CD2+ Cells upon Loss of Lgr5+ ISCs
(A and C) Similarity matrices (Spearman correlation coefficients) for global chromatin access (ATAC-seq) in BmiGfp cells (A) before and 24 hr and 36 hr after
g-irradiation, and in CD2+ cells (C) 24 hr after the last dose of diphtheria toxin (DT) in relation to other crypt populations. Both post-radiation GFP+ cells and
post-DT CD2+ cells cluster with Lgr5+ ISCs, away from their respective parental populations.
(B and D) Widespread loss of ATAC signal at group 3 sites, with commensurate relative gain at many group 2 regions, in duplicate samples of BmiGfp cells after
g-irradiation (B) and post-DT CD2+ cells (D). ATAC-seq tracks in each case illustrate losses and gains of open chromatin.
(E) Relative strengths of ATAC signals averaged across all group 2 and group 3 enhancers upon ISC loss in BmiGfp and CD2+ cells. Aggregate profiles from
wild-type cells (Figure 4E) are shown again for comparison.
See also Figure S6.
One possibility is that the sites acquire canonical histone
marks in terminally mature cells. However, we failed to detect
H3K27ac-marked regions in villus goblet cells or CD24hi crypt
EE cells beyond those present in Sec-Pro. Alternatively, en-
hancers might be active without the histone modifications we
tested, so long as TFs can bind, especially in short-lived post-
mitotic cells where bookmarking of enhancers (Kadauke and
Blobel, 2013) may be unnecessary. Many active ESC enhancers
also have open chromatin but lack H3K27ac (Pradeepa et al.,
2016). A third, intriguing possibility is that weak histone marks
at group 3 enhancers account for their instability and lower the
barrier for specified Sec cells to dedifferentiate.
Transcripts for FEV, FLI1, RUNX, and other Ets-family TFs are
selectively expressed and abundant in Sec-Pro, Bmi1Gfp, and
CD69+CD274+ cells, and sequence motifs for these TFs are en-
riched at group 3 enhancers. This convergence of information
from chromatin and mRNA profiles implicates these TFs in Sec
differentiation. The same TFs are implicated in pancreatic endo-
crine cell differentiation (Gross et al., 2016) and control related
processes in secretory blood cells (Ciau-Uitz et al., 2013).
74 Cell Stem Cell 21, 65–77, July 6, 2017
Thus, intestinal Sec cells may have evolved by co-opting
functional modules from an ancestral anti-microbial cell, and
Ets-family TFs may enable the necessary lineage-restricted
chromatin access.
The RNA profile of Bmi1Gfp cells, coupled with their absence
in Atoh1�/� intestines, identifies them as EE cells rather than
cells dedicated to replenishing ISCs. Several hormone mRNA
levels are nearly as high as in CD24+ EE cells, further implying
that they constitute a mature, preterminal EE population. Carci-
noid tumors in humans are indolent EE malignancies often asso-
ciated with clinical syndromes of hormone excess. The cells
we identify with high expression of Bmi1, EE-restricted TFs,
and gut hormones may represent the murine equivalent of crypt
cells that give rise to carcinoid tumors. This idea matches
with evidence that human carcinoid tumors arise in cells with
BMI1 levels modestly higher than in surrounding crypt cells
(Sei et al., 2016).
Bmi1Gfp cells in mice resemble (and may be a subset of) the
label-retaining cells that differentiate predominantly into Paneth
cells, but also into EE cells (Buczacki et al., 2013; Li et al., 2016).
Surface expression of CD69 and CD274 marks a third Sec pop-
ulation, whichmay include some Bmihi cells and LRCs butmainly
contains immature goblet cells. Thus, different approaches have
identified precursors for all three major Sec cell types: goblet,
EE, and Paneth. It is likely significant that each of these precur-
sors resides close to ISCs, in crypt tiers where the Ent and Sec
lineages diverge as cells exit the ISC compartment. On the one
hand, chromatin profiles suggest that Ent-Pros might face a
lower barrier to dedifferentiate into ISCs than Sec cells. On the
other hand, the magnitude of mRNA (Figure 3) and chromatin
(Figure 6) shifts in dedifferentiating Bmi1Gfp and CD69+CD274+
cells suggests adaptation of a large fraction of cells. Taken
together, the observations suggest that Ent or Sec cells closest
to ISCs may be best positioned to perceive ISC deficiency and
dedifferentiate in response.
In summary, we show that Bmi1Gfp and CD69+CD274+ cells
are preterminal EE and goblet cells, respectively, that revert to
the ISC state when native ISCs are depleted. Our findings also
reveal a coherent basis for efficient conversion of lineage-spec-
ified crypt cells into ISCs. The distinctive properties of Lgr5+ ISCs
and the Sec lineage may largely reflect differential chromatin ac-
cess at group 3 enhancers, which relinquish this access under
conditions of ISC loss.
STAR+METHODS
Detailed methods are provided in the online version of this paper
and include the following:
d KEY RESOURCES TABLE
d CONTACT FOR REAGENT AND RESOURCE SHARING
d EXPERIMENTAL MODEL AND SUBJECT DETAILS
B Mice
d METHOD DETAILS
B Mouse treatments
B Purification of intestinal epithelial cells
B Detection of proteins
B RNA-seq
B ATAC-seq
B ChIP-seq
d QUANTIFICATION AND STATISTICAL ANALYSIS
B Computational analyses
B Modeling of lineage trajectories
d DATA AND SOFTWARE AVAILABILITY
SUPPLEMENTAL INFORMATION
Supplemental Information includes six figures and two tables and can be
found with this article online at http://dx.doi.org/10.1016/j.stem.2017.05.001.
AUTHOR CONTRIBUTIONS
U.J. and R.A.S. designed the study. U.J., M.S., Z.H., and K.M. acquired data.
U.J., N.K.O., A.S., and G.-C.Y. performed computational analyses. R.A.S. in-
terpreted data and supervised the study. U.J. and R.A.S. wrote the paper, with
input from all authors.
ACKNOWLEDGMENTS
This work was supported by the Intestinal Stem Cell Consortium (grant
U01DK103152) of the NIDDK and NIAID; NIH awards R01DK081113 (R.A.S.
and G.-C.Y.), F32DK103453 (U.J.), and P50CA127003; and gifts from the
Neuroendocrine Tumor Research Foundation and Pan-Mass Challenge. We
thank F. de Sauvage, T. Honjo, and S. Robine for generously sharing
Lgr5Dtr-Gfp, RbpjFl, and Villin-CreER-T2 mice and Myles Brown, Manasvi Shah,
Calvin Kuo, and David Breault for valuable discussions.
Received: August 30, 2016
Revised: February 21, 2017
Accepted: May 4, 2017
Published: June 22, 2017
SUPPORTING CITATIONS
The following references appear in the Supplemental Information: San Roman
et al. (2015).
REFERENCES
Anders, S., Pyl, P.T., and Huber, W. (2015). HTSeq–a Python framework to
work with high-throughput sequencing data. Bioinformatics 31, 166–169.
Barker, N. (2014). Adult intestinal stem cells: critical drivers of epithelial
homeostasis and regeneration. Nat. Rev. Mol. Cell Biol. 15, 19–33.
Barker, N., van Es, J.H., Kuipers, J., Kujala, P., van den Born, M., Cozijnsen,
M., Haegebarth, A., Korving, J., Begthel, H., Peters, P.J., and Clevers, H.
(2007). Identification of stem cells in small intestine and colon by marker
gene Lgr5. Nature 449, 1003–1007.
Buczacki, S.J., Zecchini, H.I., Nicholson, A.M., Russell, R., Vermeulen, L.,
Kemp, R., and Winton, D.J. (2013). Intestinal label-retaining cells are secretory
precursors expressing Lgr5. Nature 495, 65–69.
Buenrostro, J.D., Giresi, P.G., Zaba, L.C., Chang, H.Y., and Greenleaf, W.J.
(2013). Transposition of native chromatin for fast and sensitive epigenomic
profiling of open chromatin, DNA-binding proteins and nucleosome position.
Nat. Methods 10, 1213–1218.
Ciau-Uitz, A., Wang, L., Patient, R., and Liu, F. (2013). ETS transcription factors
in hematopoietic stem cell development. Blood Cells Mol. Dis. 51, 248–255.
el Marjou, F., Janssen, K.P., Chang, B.H., Li, M., Hindie, V., Chan, L., Louvard,
D., Chambon, P., Metzger, D., and Robine, S. (2004). Tissue-specific and
inducible Cre-mediated recombination in the gut epithelium. Genesis 39,
186–193.
Gross, S., Garofalo, D.C., Balderes, D.A., Mastracci, T.L., Dias, J.M.,
Perlmann, T., Ericson, J., and Sussel, L. (2016). The novel enterochromaffin
marker Lmx1a regulates serotonin biosynthesis in enteroendocrine cell line-
ages downstream of Nkx2.2. Development 143, 2616–2628.
Hama, H., Kurokawa, H., Kawano, H., Ando, R., Shimogori, T., Noda, H.,
Fukami, K., Sakaue-Sawano, A., and Miyawaki, A. (2011). Scale: a chemical
approach for fluorescence imaging and reconstruction of transparent mouse
brain. Nat. Neurosci. 14, 1481–1488.
Han, H., Tanigaki, K., Yamamoto, N., Kuroda, K., Yoshimoto, M., Nakahata, T.,
Ikuta, K., and Honjo, T. (2002). Inducible gene knockout of transcription factor
recombination signal binding protein-J reveals its essential role in T versus B
lineage decision. Int. Immunol. 14, 637–645.
Heintzman, N.D., Hon, G.C., Hawkins, R.D., Kheradpour, P., Stark, A., Harp,
L.F., Ye, Z., Lee, L.K., Stuart, R.K., Ching, C.W., et al. (2009). Histone modifi-
cations at human enhancers reflect global cell-type-specific gene expression.
Nature 459, 108–112.
Heinz, S., Benner, C., Spann, N., Bertolino, E., Lin, Y.C., Laslo, P., Cheng, J.X.,
Murre, C., Singh, H., and Glass, C.K. (2010). Simple combinations of lineage-
determining transcription factors prime cis-regulatory elements required for
macrophage and B cell identities. Mol. Cell 38, 576–589.
Hosen, N., Yamane, T., Muijtjens, M., Pham, K., Clarke, M.F., and Weissman,
I.L. (2007). Bmi-1-green fluorescent protein-knock-in mice reveal the dynamic
regulation of bmi-1 expression in normal and leukemic hematopoietic cells.
Stem Cells 25, 1635–1644.
Itzkovitz, S., Lyubimova, A., Blat, I.C., Maynard, M., van Es, J., Lees, J., Jacks,
T., Clevers, H., and van Oudenaarden, A. (2011). Single-molecule transcript
Cell Stem Cell 21, 65–77, July 6, 2017 75
counting of stem-cell markers in the mouse intestine. Nat. Cell Biol. 14,
106–114.
Kadauke, S., and Blobel, G.A. (2013). Mitotic bookmarking by transcription
factors. Epigenetics Chromatin 6, 6.
Kim, T.H., Li, F., Ferreiro-Neira, I., Ho, L.L., Luyten, A., Nalapareddy, K., Long,
H., Verzi, M., and Shivdasani, R.A. (2014). Broadly permissive intestinal chro-
matin underlies lateral inhibition and cell plasticity. Nature 506, 511–515.
Langmead, B., and Salzberg, S.L. (2012). Fast gapped-read alignment with
Bowtie 2. Nat. Methods 9, 357–359.
Lara-Astiaso, D., Weiner, A., Lorenzo-Vivas, E., Zaretsky, I., Jaitin, D.A., David,
E., Keren-Shaul, H., Mildner, A., Winter, D., Jung, S., et al. (2014).
Immunogenetics. Chromatin state dynamics during blood formation. Science
345, 943–949.
Li, H.J., Kapoor, A., Giel-Moloney, M., Rindi, G., and Leiter, A.B. (2012). Notch
signaling differentially regulates the cell fate of early endocrine precursor cells
and their maturing descendants in the mouse pancreas and intestine. Dev.
Biol. 371, 156–169.
Li, N., Yousefi, M., Nakauka-Ddamba, A., Jain, R., Tobias, J., Epstein, J.A.,
Jensen, S.T., and Lengner, C.J. (2014). Single-cell analysis of proxy reporter
allele-marked epithelial cells establishes intestinal stem cell hierarchy. Stem
Cell Reports 3, 876–891.
Li, N., Nakauka-Ddamba, A., Tobias, J., Jensen, S.T., and Lengner, C.J.
(2016). Mouse label-retaining cells are molecularly and functionally distinct
from reserve intestinal stem cells. Gastroenterology 151, 298–310.
Love, M.I., Huber, W., and Anders, S. (2014). Moderated estimation of fold
change and dispersion for RNA-seq data with DESeq2. Genome Biol. 15, 550.
McLean, C.Y., Bristor, D., Hiller, M., Clarke, S.L., Schaar, B.T., Lowe, C.B.,
Wenger, A.M., and Bejerano, G. (2010). GREAT improves functional interpre-
tation of cis-regulatory regions. Nat. Biotechnol. 28, 495–501.
Mercer, T.R., Edwards, S.L., Clark, M.B., Neph, S.J., Wang, H., Stergachis,
A.B., John, S., Sandstrom, R., Li, G., Sandhu, K.S., et al. (2013). DNase I-hy-
persensitive exons colocalize with promoters and distal regulatory elements.
Nat. Genet. 45, 852–859.
Metcalfe, C., Kljavin, N.M., Ybarra, R., and de Sauvage, F.J. (2014). Lgr5+ stem
cells are indispensable for radiation-induced intestinal regeneration. Cell Stem
Cell 14, 149–159.
Munoz, J., Stange, D.E., Schepers, A.G., van de Wetering, M., Koo, B.K.,
Itzkovitz, S., Volckmann, R., Kung, K.S., Koster, J., Radulescu, S., et al.
(2012). The Lgr5 intestinal stem cell signature: robust expression of proposed
quiescent ’+40 cell markers. EMBO J. 31, 3079–3091.
Pelaseyed, T., Bergstrom, J.H., Gustafsson, J.K., Ermund, A., Birchenough,
G.M., Sch€utte, A., van der Post, S., Svensson, F., Rodrıguez-Pineiro, A.M.,
Nystrom, E.E., et al. (2014). The mucus and mucins of the goblet cells and en-
terocytes provide the first defense line of the gastrointestinal tract and interact
with the immune system. Immunol. Rev. 260, 8–20.
Pinello, L., Xu, J., Orkin, S.H., and Yuan, G.C. (2014). Analysis of chromatin-
state plasticity identifies cell-type-specific regulators of H3K27me3 patterns.
Proc. Natl. Acad. Sci. USA 111, E344–E353.
Potten, C.S. (1998). Stem cells in gastrointestinal epithelium: numbers, char-
acteristics and death. Philos. Trans. R. Soc. Lond. B Biol. Sci. 353, 821–830.
Pradeepa, M.M., Grimes, G.R., Kumar, Y., Olley, G., Taylor, G.C., Schneider,
R., and Bickmore, W.A. (2016). Histone H3 globular domain acetylation iden-
tifies a new class of enhancers. Nat. Genet. 48, 681–686.
Quinlan, A.R., and Hall, I.M. (2010). BEDTools: a flexible suite of utilities for
comparing genomic features. Bioinformatics 26, 841–842.
Ramırez, F., D€undar, F., Diehl, S., Gr€uning, B.A., and Manke, T. (2014).
deepTools: a flexible platform for exploring deep-sequencing data. Nucleic
Acids Res. 42, W187–W191.
Richmond, C.A., Shah, M.S., Carlone, D.L., and Breault, D.T. (2016). An
enduring role for quiescent stem cells. Dev. Dyn. 245, 718–726.
Robinson, J.T., Thorvaldsdottir, H., Winckler, W., Guttman, M., Lander, E.S.,
Getz, G., and Mesirov, J.P. (2011). Integrative genomics viewer. Nat.
Biotechnol. 29, 24–26.
76 Cell Stem Cell 21, 65–77, July 6, 2017
San Roman, A.K., Tovaglieri, A., Breault, D.T., and Shivdasani, R.A. (2015).
Distinct Processes and Transcriptional Targets Underlie CDX2 Requirements
in Intestinal Stem Cells and Differentiated Villus Cells. Stem Cell Reports 5,
673–681.
Sangiorgi, E., and Capecchi, M.R. (2008). Bmi1 is expressed in vivo in intestinal
stem cells. Nat. Genet. 40, 915–920.
Schindelin, J., Arganda-Carreras, I., Frise, E., Kaynig, V., Longair, M., Pietzsch,
T., Preibisch, S., Rueden, C., Saalfeld, S., Schmid, B., et al. (2012). Fiji: an
open-source platform for biological-image analysis. Nat. Methods 9, 676–682.
Schwitalla, S., Fingerle, A.A., Cammareri, P., Nebelsiek, T., Goktuna, S.I.,
Ziegler, P.K., Canli, O., Heijmans, J., Huels, D.J., Moreaux, G., et al. (2013).
Intestinal tumorigenesis initiated by dedifferentiation and acquisition of
stem-cell-like properties. Cell 152, 25–38.
Sei, Y., Feng, J., Zhao, X., Forbes, J., Tang, D., Nagashima, K., Hanson, J.,
Quezado, M.M., Hughes, M.S., and Wank, S.A. (2016). Polyclonal Crypt
Genesis and Development of Familial Small Intestinal Neuroendocrine
Tumors. Gastroenterology 151, 140–151.
Shlyueva, D., Stampfel, G., and Stark, A. (2014). Transcriptional enhancers:
from properties to genome-wide predictions. Nat. Rev. Genet. 15, 272–286.
Shroyer, N.F., Helmrath, M.A., Wang, V.Y., Antalffy, B., Henning, S.J., and
Zoghbi, H.Y. (2007). Intestine-specific ablation of mouse atonal homolog 1
(Math1) reveals a role in cellular homeostasis. Gastroenterology 132,
2478–2488.
Subramanian, A., Tamayo, P., Mootha, V.K., Mukherjee, S., Ebert, B.L.,
Gillette, M.A., Paulovich, A., Pomeroy, S.L., Golub, T.R., Lander, E.S., and
Mesirov, J.P. (2005). Gene set enrichment analysis: a knowledge-based
approach for interpreting genome-wide expression profiles. Proc. Natl.
Acad. Sci. USA 102, 15545–15550.
Takeda, N., Jain, R., LeBoeuf, M.R., Wang, Q., Lu, M.M., and Epstein, J.A.
(2011). Interconversion between intestinal stem cell populations in distinct
niches. Science 334, 1420–1424.
Tetteh, P.W., Basak, O., Farin, H.F., Wiebrands, K., Kretzschmar, K., Begthel,
H., van den Born, M., Korving, J., de Sauvage, F., van Es, J.H., et al. (2016).
Replacement of lost Lgr5-positive stem cells through plasticity of their enter-
ocyte-lineage daughters. Cell Stem Cell 18, 203–213.
Tian, H., Biehs, B., Warming, S., Leong, K.G., Rangell, L., Klein, O.D., and de
Sauvage, F.J. (2011). A reserve stem cell population in small intestine renders
Lgr5-positive cells dispensable. Nature 478, 255–259.
Trapnell, C., Roberts, A., Goff, L., Pertea, G., Kim, D., Kelley, D.R., Pimentel,
H., Salzberg, S.L., Rinn, J.L., and Pachter, L. (2012). Differential gene and tran-
script expression analysis of RNA-seq experiments with TopHat and Cufflinks.
Nat. Protoc. 7, 562–578.
van Es, J.H., van Gijn, M.E., Riccio, O., van den Born, M., Vooijs, M., Begthel,
H., Cozijnsen, M., Robine, S., Winton, D.J., Radtke, F., and Clevers, H. (2005).
Notch/gamma-secretase inhibition turns proliferative cells in intestinal crypts
and adenomas into goblet cells. Nature 435, 959–963.
van Es, J.H., Sato, T., van de Wetering, M., Lyubimova, A., Nee, A.N.,
Gregorieff, A., Sasaki, N., Zeinstra, L., van den Born, M., Korving, J., et al.
(2012). Dll1+ secretory progenitor cells revert to stem cells upon crypt dam-
age. Nat. Cell Biol. 14, 1099–1104.
Verzi, M.P., Shin, H., He, H.H., Sulahian, R., Meyer, C.A., Montgomery,
R.K., Fleet, J.C., Brown, M., Liu, X.S., and Shivdasani, R.A. (2010).
Differentiation-specific histone modifications reveal dynamic chromatin in-
teractions and partners for the intestinal transcription factor CDX2. Dev.
Cell 19, 713–726.
Westphalen, C.B., Asfaha, S., Hayakawa, Y., Takemoto, Y., Lukin, D.J., Nuber,
A.H., Brandtner, A., Setlik, W., Remotti, H., Muley, A., et al. (2014). Long-lived
intestinal tuft cells serve as colon cancer-initiating cells. J. Clin. Invest. 124,
1283–1295.
Wong, V.W., Stange, D.E., Page, M.E., Buczacki, S., Wabik, A., Itami, S., van
de Wetering, M., Poulsom, R., Wright, N.A., Trotter, M.W., et al. (2012). Lrig1
controls intestinal stem-cell homeostasis by negative regulation of ErbB sig-
nalling. Nat. Cell Biol. 14, 401–408.

Yan, K.S., Chia, L.A., Li, X., Ootani, A., Su, J., Lee, J.Y., Su, N., Luo, Y.,
Heilshorn, S.C., Amieva, M.R., et al. (2012). The intestinal stem cell markers
Bmi1 and Lgr5 identify two functionally distinct populations. Proc. Natl.
Acad. Sci. USA 109, 466–471.
Yang, Q., Bermingham, N.A., Finegold, M.J., and Zoghbi, H.Y. (2001).
Requirement of Math1 for secretory cell lineage commitment in the mouse
intestine. Science 294, 2155–2158.
Zhang, Y., Liu, T., Meyer, C.A., Eeckhoute, J., Johnson, D.S., Bernstein, B.E.,
Nusbaum, C., Myers, R.M., Brown, M., Li, W., and Liu, X.S. (2008). Model-
based analysis of ChIP-Seq (MACS). Genome Biol. 9, R137.
Zhu, C., Chen, Z., and Jiang, Z. (2016). Expression, distribution and role of
aquaporin water channels in human and animal stomach and intestines. Int.
J. Mol. Sci. 17, 17.
Cell Stem Cell 21, 65–77, July 6, 2017 77
STAR+METHODS
KEY RESOURCES TABLE
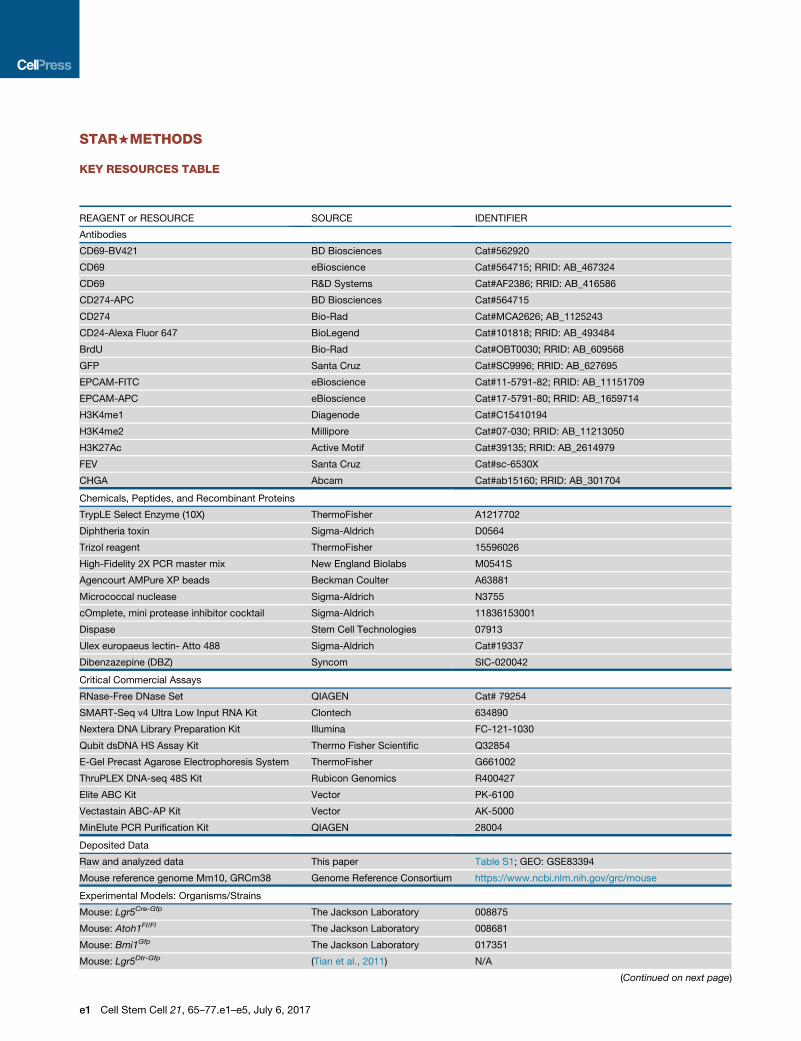
REAGENT or RESOURCE SOURCE IDENTIFIER
Antibodies
CD69-BV421 BD Biosciences Cat#562920
CD69 eBioscience Cat#564715; RRID: AB_467324
CD69 R&D Systems Cat#AF2386; RRID: AB_416586
CD274-APC BD Biosciences Cat#564715
CD274 Bio-Rad Cat#MCA2626; AB_1125243
CD24-Alexa Fluor 647 BioLegend Cat#101818; RRID: AB_493484
BrdU Bio-Rad Cat#OBT0030; RRID: AB_609568
GFP Santa Cruz Cat#SC9996; RRID: AB_627695
EPCAM-FITC eBioscience Cat#11-5791-82; RRID: AB_11151709
EPCAM-APC eBioscience Cat#17-5791-80; RRID: AB_1659714
H3K4me1 Diagenode Cat#C15410194
H3K4me2 Millipore Cat#07-030; RRID: AB_11213050
H3K27Ac Active Motif Cat#39135; RRID: AB_2614979
FEV Santa Cruz Cat#sc-6530X
CHGA Abcam Cat#ab15160; RRID: AB_301704
Chemicals, Peptides, and Recombinant Proteins
TrypLE Select Enzyme (10X) ThermoFisher A1217702
Diphtheria toxin Sigma-Aldrich D0564
Trizol reagent ThermoFisher 15596026
High-Fidelity 2X PCR master mix New England Biolabs M0541S
Agencourt AMPure XP beads Beckman Coulter A63881
Micrococcal nuclease Sigma-Aldrich N3755
cOmplete, mini protease inhibitor cocktail Sigma-Aldrich 11836153001
Dispase Stem Cell Technologies 07913
Ulex europaeus lectin- Atto 488 Sigma-Aldrich Cat#19337
Dibenzazepine (DBZ) Syncom SIC-020042
Critical Commercial Assays
RNase-Free DNase Set QIAGEN Cat# 79254
SMART-Seq v4 Ultra Low Input RNA Kit Clontech 634890
Nextera DNA Library Preparation Kit Illumina FC-121-1030
Qubit dsDNA HS Assay Kit Thermo Fisher Scientific Q32854
E-Gel Precast Agarose Electrophoresis System ThermoFisher G661002
ThruPLEX DNA-seq 48S Kit Rubicon Genomics R400427
Elite ABC Kit Vector PK-6100
Vectastain ABC-AP Kit Vector AK-5000
MinElute PCR Purification Kit QIAGEN 28004
Deposited Data
Raw and analyzed data This paper Table S1; GEO: GSE83394
Mouse reference genome Mm10, GRCm38 Genome Reference Consortium https://www.ncbi.nlm.nih.gov/grc/mouse
Experimental Models: Organisms/Strains
Mouse: Lgr5Cre-Gfp The Jackson Laboratory 008875
Mouse: Atoh1Fl/Fl The Jackson Laboratory 008681
Mouse: Bmi1Gfp The Jackson Laboratory 017351
Mouse: Lgr5Dtr-Gfp (Tian et al., 2011) N/A
(Continued on next page)
e1 Cell Stem Cell 21, 65–77.e1–e5, July 6, 2017
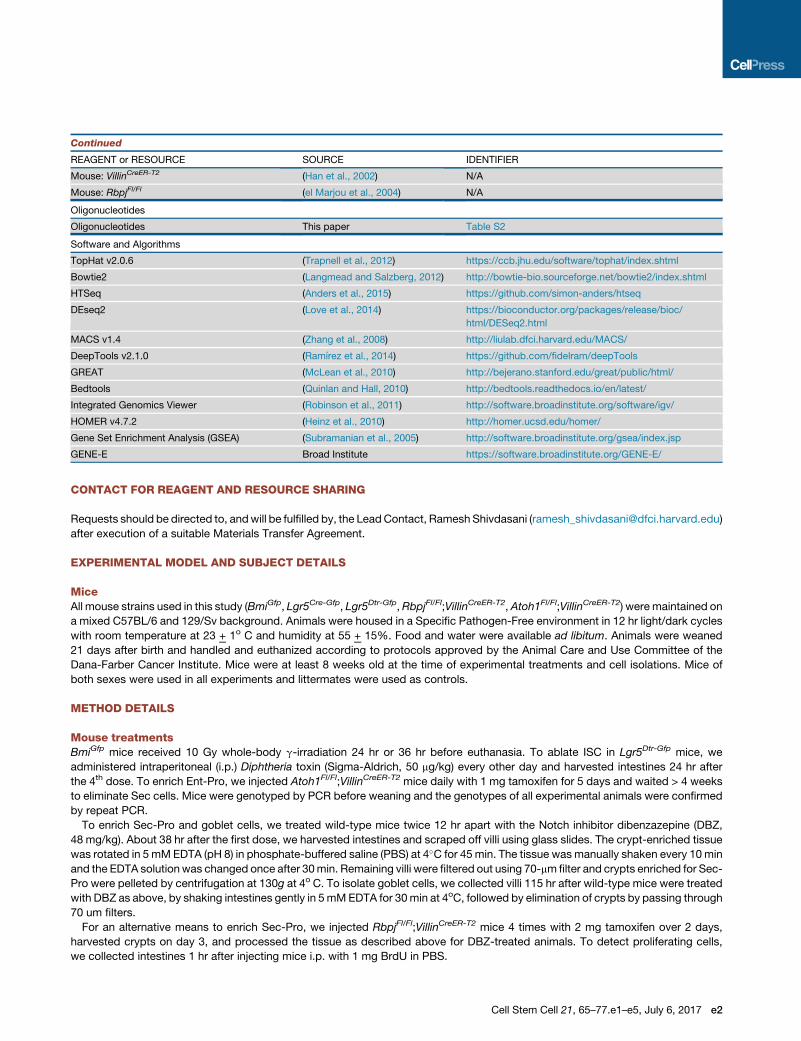
Continued
REAGENT or RESOURCE SOURCE IDENTIFIER
Mouse: VillinCreER-T2 (Han et al., 2002) N/A
Mouse: RbpjFl/Fl (el Marjou et al., 2004) N/A
Oligonucleotides
Oligonucleotides This paper Table S2
Software and Algorithms
TopHat v2.0.6 (Trapnell et al., 2012) https://ccb.jhu.edu/software/tophat/index.shtml
Bowtie2 (Langmead and Salzberg, 2012) http://bowtie-bio.sourceforge.net/bowtie2/index.shtml
HTSeq (Anders et al., 2015) https://github.com/simon-anders/htseq
DEseq2 (Love et al., 2014) https://bioconductor.org/packages/release/bioc/
html/DESeq2.html
MACS v1.4 (Zhang et al., 2008) http://liulab.dfci.harvard.edu/MACS/
DeepTools v2.1.0 (Ramırez et al., 2014) https://github.com/fidelram/deepTools
GREAT (McLean et al., 2010) http://bejerano.stanford.edu/great/public/html/
Bedtools (Quinlan and Hall, 2010) http://bedtools.readthedocs.io/en/latest/
Integrated Genomics Viewer (Robinson et al., 2011) http://software.broadinstitute.org/software/igv/
HOMER v4.7.2 (Heinz et al., 2010) http://homer.ucsd.edu/homer/
Gene Set Enrichment Analysis (GSEA) (Subramanian et al., 2005) http://software.broadinstitute.org/gsea/index.jsp
GENE-E Broad Institute https://software.broadinstitute.org/GENE-E/
CONTACT FOR REAGENT AND RESOURCE SHARING
Requests should be directed to, andwill be fulfilled by, the LeadContact, Ramesh Shivdasani ([email protected])
after execution of a suitable Materials Transfer Agreement.
EXPERIMENTAL MODEL AND SUBJECT DETAILS
MiceAll mouse strains used in this study (BmiGfp, Lgr5Cre-Gfp, Lgr5Dtr-Gfp,RbpjFl/Fl;VillinCreER-T2, Atoh1Fl/Fl;VillinCreER-T2) were maintained on
a mixed C57BL/6 and 129/Sv background. Animals were housed in a Specific Pathogen-Free environment in 12 hr light/dark cycles
with room temperature at 23 + 1o C and humidity at 55 + 15%. Food and water were available ad libitum. Animals were weaned
21 days after birth and handled and euthanized according to protocols approved by the Animal Care and Use Committee of the
Dana-Farber Cancer Institute. Mice were at least 8 weeks old at the time of experimental treatments and cell isolations. Mice of
both sexes were used in all experiments and littermates were used as controls.
METHOD DETAILS
Mouse treatmentsBmiGfp mice received 10 Gy whole-body g-irradiation 24 hr or 36 hr before euthanasia. To ablate ISC in Lgr5Dtr-Gfp mice, we
administered intraperitoneal (i.p.) Diphtheria toxin (Sigma-Aldrich, 50 mg/kg) every other day and harvested intestines 24 hr after
the 4th dose. To enrich Ent-Pro, we injected Atoh1Fl/Fl;VillinCreER-T2 mice daily with 1 mg tamoxifen for 5 days and waited > 4 weeks
to eliminate Sec cells. Mice were genotyped by PCR before weaning and the genotypes of all experimental animals were confirmed
by repeat PCR.
To enrich Sec-Pro and goblet cells, we treated wild-type mice twice 12 hr apart with the Notch inhibitor dibenzazepine (DBZ,
48 mg/kg). About 38 hr after the first dose, we harvested intestines and scraped off villi using glass slides. The crypt-enriched tissue
was rotated in 5 mMEDTA (pH 8) in phosphate-buffered saline (PBS) at 4�C for 45 min. The tissue wasmanually shaken every 10 min
and the EDTA solutionwas changed once after 30min. Remaining villi were filtered out using 70-mmfilter and crypts enriched for Sec-
Pro were pelleted by centrifugation at 130g at 4o C. To isolate goblet cells, we collected villi 115 hr after wild-type mice were treated
with DBZ as above, by shaking intestines gently in 5mMEDTA for 30min at 4oC, followed by elimination of crypts by passing through
70 um filters.
For an alternative means to enrich Sec-Pro, we injected RbpjFl/Fl;VillinCreER-T2 mice 4 times with 2 mg tamoxifen over 2 days,
harvested crypts on day 3, and processed the tissue as described above for DBZ-treated animals. To detect proliferating cells,
we collected intestines 1 hr after injecting mice i.p. with 1 mg BrdU in PBS.
Cell Stem Cell 21, 65–77.e1–e5, July 6, 2017 e2
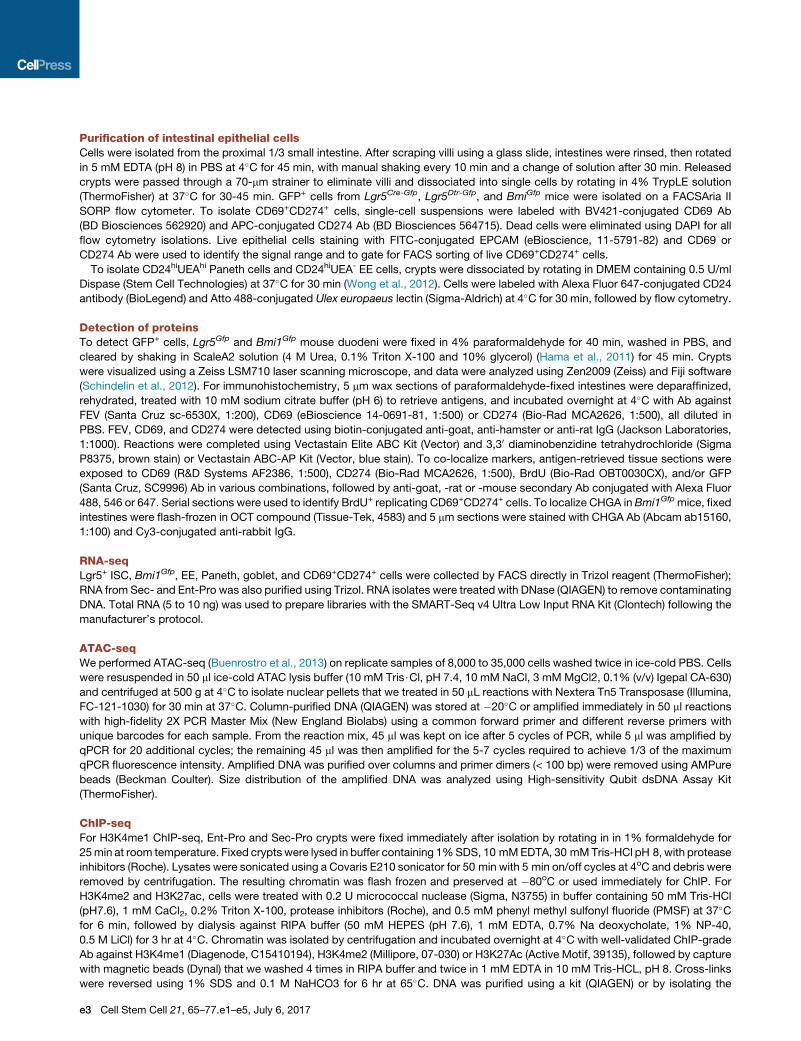
Purification of intestinal epithelial cellsCells were isolated from the proximal 1/3 small intestine. After scraping villi using a glass slide, intestines were rinsed, then rotated
in 5 mM EDTA (pH 8) in PBS at 4�C for 45 min, with manual shaking every 10 min and a change of solution after 30 min. Released
crypts were passed through a 70-mm strainer to eliminate villi and dissociated into single cells by rotating in 4% TrypLE solution
(ThermoFisher) at 37�C for 30-45 min. GFP+ cells from Lgr5Cre-Gfp, Lgr5Dtr-Gfp, and BmiGfp mice were isolated on a FACSAria II
SORP flow cytometer. To isolate CD69+CD274+ cells, single-cell suspensions were labeled with BV421-conjugated CD69 Ab
(BD Biosciences 562920) and APC-conjugated CD274 Ab (BD Biosciences 564715). Dead cells were eliminated using DAPI for all
flow cytometry isolations. Live epithelial cells staining with FITC-conjugated EPCAM (eBioscience, 11-5791-82) and CD69 or
CD274 Ab were used to identify the signal range and to gate for FACS sorting of live CD69+CD274+ cells.
To isolate CD24hiUEAhi Paneth cells and CD24hiUEA- EE cells, crypts were dissociated by rotating in DMEM containing 0.5 U/ml
Dispase (Stem Cell Technologies) at 37�C for 30 min (Wong et al., 2012). Cells were labeled with Alexa Fluor 647-conjugated CD24
antibody (BioLegend) and Atto 488-conjugated Ulex europaeus lectin (Sigma-Aldrich) at 4�C for 30 min, followed by flow cytometry.
Detection of proteinsTo detect GFP+ cells, Lgr5Gfp and Bmi1Gfp mouse duodeni were fixed in 4% paraformaldehyde for 40 min, washed in PBS, and
cleared by shaking in ScaleA2 solution (4 M Urea, 0.1% Triton X-100 and 10% glycerol) (Hama et al., 2011) for 45 min. Crypts
were visualized using a Zeiss LSM710 laser scanning microscope, and data were analyzed using Zen2009 (Zeiss) and Fiji software
(Schindelin et al., 2012). For immunohistochemistry, 5 mm wax sections of paraformaldehyde-fixed intestines were deparaffinized,
rehydrated, treated with 10 mM sodium citrate buffer (pH 6) to retrieve antigens, and incubated overnight at 4�C with Ab against
FEV (Santa Cruz sc-6530X, 1:200), CD69 (eBioscience 14-0691-81, 1:500) or CD274 (Bio-Rad MCA2626, 1:500), all diluted in
PBS. FEV, CD69, and CD274 were detected using biotin-conjugated anti-goat, anti-hamster or anti-rat IgG (Jackson Laboratories,
1:1000). Reactions were completed using Vectastain Elite ABC Kit (Vector) and 3,30 diaminobenzidine tetrahydrochloride (Sigma
P8375, brown stain) or Vectastain ABC-AP Kit (Vector, blue stain). To co-localize markers, antigen-retrieved tissue sections were
exposed to CD69 (R&D Systems AF2386, 1:500), CD274 (Bio-Rad MCA2626, 1:500), BrdU (Bio-Rad OBT0030CX), and/or GFP
(Santa Cruz, SC9996) Ab in various combinations, followed by anti-goat, -rat or -mouse secondary Ab conjugated with Alexa Fluor
488, 546 or 647. Serial sections were used to identify BrdU+ replicating CD69+CD274+ cells. To localize CHGA in Bmi1Gfpmice, fixed
intestines were flash-frozen in OCT compound (Tissue-Tek, 4583) and 5 mm sections were stained with CHGA Ab (Abcam ab15160,
1:100) and Cy3-conjugated anti-rabbit IgG.
RNA-seqLgr5+ ISC, Bmi1Gfp, EE, Paneth, goblet, and CD69+CD274+ cells were collected by FACS directly in Trizol reagent (ThermoFisher);
RNA from Sec- and Ent-Pro was also purified using Trizol. RNA isolates were treated with DNase (QIAGEN) to remove contaminating
DNA. Total RNA (5 to 10 ng) was used to prepare libraries with the SMART-Seq v4 Ultra Low Input RNA Kit (Clontech) following the
manufacturer’s protocol.
ATAC-seqWe performed ATAC-seq (Buenrostro et al., 2013) on replicate samples of 8,000 to 35,000 cells washed twice in ice-cold PBS. Cells
were resuspended in 50 ml ice-cold ATAC lysis buffer (10 mM Tris$Cl, pH 7.4, 10 mM NaCl, 3 mMMgCl2, 0.1% (v/v) Igepal CA-630)
and centrifuged at 500 g at 4�C to isolate nuclear pellets that we treated in 50 mL reactions with Nextera Tn5 Transposase (Illumina,
FC-121-1030) for 30 min at 37�C. Column-purified DNA (QIAGEN) was stored at �20�C or amplified immediately in 50 ml reactions
with high-fidelity 2X PCR Master Mix (New England Biolabs) using a common forward primer and different reverse primers with
unique barcodes for each sample. From the reaction mix, 45 ml was kept on ice after 5 cycles of PCR, while 5 ml was amplified by
qPCR for 20 additional cycles; the remaining 45 ml was then amplified for the 5-7 cycles required to achieve 1/3 of the maximum
qPCR fluorescence intensity. Amplified DNA was purified over columns and primer dimers (< 100 bp) were removed using AMPure
beads (Beckman Coulter). Size distribution of the amplified DNA was analyzed using High-sensitivity Qubit dsDNA Assay Kit
(ThermoFisher).
ChIP-seqFor H3K4me1 ChIP-seq, Ent-Pro and Sec-Pro crypts were fixed immediately after isolation by rotating in in 1% formaldehyde for
25min at room temperature. Fixed crypts were lysed in buffer containing 1%SDS, 10 mMEDTA, 30 mMTris-HCl pH 8, with protease
inhibitors (Roche). Lysates were sonicated using a Covaris E210 sonicator for 50 min with 5 min on/off cycles at 4oC and debris were
removed by centrifugation. The resulting chromatin was flash frozen and preserved at �80oC or used immediately for ChIP. For
H3K4me2 and H3K27ac, cells were treated with 0.2 U micrococcal nuclease (Sigma, N3755) in buffer containing 50 mM Tris-HCl
(pH7.6), 1 mM CaCl2, 0.2% Triton X-100, protease inhibitors (Roche), and 0.5 mM phenyl methyl sulfonyl fluoride (PMSF) at 37�Cfor 6 min, followed by dialysis against RIPA buffer (50 mM HEPES (pH 7.6), 1 mM EDTA, 0.7% Na deoxycholate, 1% NP-40,
0.5 M LiCl) for 3 hr at 4�C. Chromatin was isolated by centrifugation and incubated overnight at 4�C with well-validated ChIP-grade
Ab against H3K4me1 (Diagenode, C15410194), H3K4me2 (Millipore, 07-030) or H3K27Ac (Active Motif, 39135), followed by capture
with magnetic beads (Dynal) that we washed 4 times in RIPA buffer and twice in 1 mM EDTA in 10 mM Tris-HCL, pH 8. Cross-links
were reversed using 1% SDS and 0.1 M NaHCO3 for 6 hr at 65�C. DNA was purified using a kit (QIAGEN) or by isolating the
e3 Cell Stem Cell 21, 65–77.e1–e5, July 6, 2017
mononucleosome fraction in 2% E-gels (Invitrogen). Libraries were prepared using ThruPLEX kits (Rubicon, R400427), and DNA size
distribution was confirmed using High-sensitivity Qubit dsDNA Assay Kit (ThermoFisher).
All libraries (RNA-seq, ATAC-seq, and ChIP-seq) were sequenced on a NextSeq 500 instrument (Illumina) to obtain 75 bp single-
end reads.
QUANTIFICATION AND STATISTICAL ANALYSIS
Given the potential variability among animals and low abundance of Bmi1Gfp and CD69+CD274+ cells, all immunohistochemistry
(Figure 5C) and immunofluorescence (Figures 2A and 3B) studies used tissue from at least 3 independent animals (N = 3). Similarly,
in co-localization studies to illustrate the endocrine phenotype of Bmi1Gfp cells (Figure 1G) we interrogated large number of cells
(N = 165). To ensure reproducibility of purification methods for Bmi1Gfp and CD69+CD274+ cells by flow cytometry, all experiments
involving FACS occurred on at least 3 and as many as 9 individual animals (N = 3 to 9, Figures 2A, 2B, 2D, S1G, S2B, and S3B).
For consistency in analysis and representation, FACS data from 50,000 cells were analyzed in every experiment using FlowJo v10
software (FlowJo LLC).
To confirm cell purity achieved in our isolation approaches, and to exclude potential biases introduced by RNA-seq library prep-
aration, sequencing and data processing, we conducted semiquantitative RT-PCR analysis on mRNAs from three independent an-
imal samples (N = 3) using primers for cell-specific markers (Figure S2B) and confirmed relative enrichment of known lineage
markers. Similarly, we confirmed expression changes revealed by RNA-seq inBmi1Gfp and CD69+CD274+ cells upon Lgr5+ ISC abla-
tion by RT-PCR analysis of RNA samples from at least three independent (N = 3) animals, using whole crypts (Figures 3B and S3E) or
ISC (Figures 3G and S3F) to determine basal expression.
Computational analysesRaw reads from mRNA-, ChIP-, and ATAC-seq were aligned to the mouse genome (Mm10, Genome Reference Consortium
GRCm38) using TopHat v2.0.6 (Trapnell et al., 2012) or Bowtie2 (Langmead and Salzberg, 2012). For RNA-seq, transcript levels
were expressed as read counts using HTSeq (Anders et al., 2015). Data were normalized and sample variability assessed by principal
component analysis in DEseq2 (Love et al., 2014). Differential expression was defined using the indicated fold-changes and false-
discovery rate (FDR) 0.05 using DEseq2. We used GENE-E software (Broad Institute) to generate heatmaps of RNA levels, averaged
from replicate samples in reads per kb of transcript per 1M mapped reads (RPKM).
For ATAC- and ChIP-seq, aligned signals in raw (bam) files were filtered to remove PCR duplicates and reads that aligned to mul-
tiple locations; the remainder is listed in Table S1. Peaks were identified usingMACS v1.4 (Zhang et al., 2008) with the p-value cut-off
10-5. ATAC peaks from Lgr5+ ISC, Sec-Pro, Ent-Pro, Bmi1Gfp, and CD69+CD274+ cells were pooled and the 50,347 unique peaks
were used in sample correlations (Figures 4C, S4B, 6A, and 6B). Promoters (regions < 1 kb from TSSs) were discarded, leaving
41,167 sites as candidate enhancers. Raw signals from individual samples or merged, highly correlated replicates (Figure S4B)
from a given cell type were converted to signal files (bigWig) using DeepTools v2.1.0 (Ramırez et al., 2014). To compare open chro-
matin across cell types, signals were quantile-normalized using Haystack (Pinello et al., 2014), with 50-bp windows. Normalized
signals ± 1.5 kb from center of ATAC peaks were used for unsupervised k-means clustering in DeepTools v2.1.0. The optimum num-
ber of clusters was determined by gap statistics (Figure S4C) and the 8 resulting clusters were merged, according to similarity of
signal patterns, into 3 distinct groups (Figure S4D).
To determine correlations among multiple ATAC-seq samples, read counts from all samples under consideration were summa-
rized over pooled ATAC peaks into a matrix using DeepTools. Samples were clustered using hierarchical clustering and heatmap
scales reflect the full range of sample-to-sample Spearman correlation coefficients (Figures 4C, 6A, 6C, and S6). Enhancer
ATAC-seq signals were determined using 50 bp bins over +1.5 kb or +3.5 kb from the center of the regions and plotted as heatmaps
using DeepTools in descending order of themean signal over +1.5 kb, as determined for each cluster in Figure 4D. The same order of
sites was maintained for plotting regions from Groups 1, 2 and 3 in Figures 5A, 6B, 6D, S4D, and S5C. The same signal values were
used to generate aggregate profile plots in DeepTools.
Ontologies associated with genes located within 25 kb of ATAC regions were identified using GREAT analysis v3.0 (McLean et al.,
2010). To identify biological processes enriched in cell populations, we applied Gene Set Enrichment Analysis (GSEA) (Subramanian
et al., 2005) to curated Biocarta, Kegg, and chemical and genetic perturbation sets from the molecular signature database (MSigDB),
using default parameters. Genes within 25 kb of enhancers in Groups 2 and 3were identified using Bedtools (Quinlan and Hall, 2010).
Enriched expression of these gene setswas determined in different populations using theGSEA approach (Subramanian et al., 2005);
significance of the enrichment scores (FDR) was determined using 1,000 permutations of random gene sets of similar size. Similarly,
500 transcripts with the highest enrichment in Bmi1Gfp or CD69+CD274+ cells were analyzed to determine specificity for Ent- or
Sec-Pro and EE, Paneth or goblet cells (Figures 1F and 2D). Loci were visualized using the Integrated Genomics Viewer v2.3 (Rob-
inson et al., 2011). Motifs enriched in ATAC regions were identified using the HOMER de novo algorithm v4.7.2 (Heinz et al., 2010)
based on the cumulative binomial distribution.
Modeling of lineage trajectoriesTo define cell relationships, we constructed a mathematical model based on the simplifying assumption of monotonic changes,
i.e., directions of change in mRNA expression are consistent from mother to daughter cells along a trajectory. For any trajectory
Cell Stem Cell 21, 65–77.e1–e5, July 6, 2017 e4

A/B/C, where A, B and C represent different cell populations, we defined a coherence score based on the direction of change
of differentially expressed (q < 0.05) genes. For any gene g˛N=diffðA;BÞXdiffðB;CÞXdiffðA;CÞ, where diff denotes the gene set
differentially expressed in two cell types, the coherence score dg = + 1 if transcript levels increase or decrease consistently along
the trajectory, and as dg = � 1 otherwise. The weighted sum of dg’s, where each gene is weighted by the magnitude of log fold-
change���log FC
C=Ag
��� , then gives an aggregated coherence score=
Pg˛N
���log FC
C=Ag
��� ,dg. High positive scores for a trajectory indicate
consistency of monotonic gene expression, and negative scores reflect opposing changes in many genes, along the trajectory, e.g.,
the ISC/EP/Enterocyte and ISC/SP/Goblet cells trajectories gave the expected high positive scores (Figure S1F).
DATA AND SOFTWARE AVAILABILITY
The accession number for the data reported in Table S1 is GEO: GSE83394.
e5 Cell Stem Cell 21, 65–77.e1–e5, July 6, 2017