dynamic signal analysis & data acquisition - hzrad · dynamic signal analysis & data...
TRANSCRIPT

HANDHELD & HIGH CHANNEL COUNT SYSTEMS
DYNAMIC SIGNAL ANALYSIS & DATA ACQUISITION
W W W . C R Y S TA L I N S T R U M E N T S . C O M

TWO FORM FACTORS,ONE SOLUTION.
The CoCo series of handheld analyzers and the Spider-80X high channel measurement system provides users with the flexiblity to create a dynamic signal analysis solution according to their needs. Portability, remote monitoring, and preloaded operations are all possible with Crystal Instruments’ DSA solutions.

CUSTOMIZABLE & HANDHELDDYNAMIC SIGNAL ANALYZERS
CoCo-80 & CoCo-90The CoCo is a handheld data recorder, dynamic signal analyzer, and vibration data collector. The CoCo is ideal for a wide range of industries; including machine condition monitoring, automotive, aviation, aerospace, electronics, and military. These industries demand easy, quick, and accurate data recording in addition to real-time processing in the field. The CoCo units are lightweight, battery powered handheld systems with unparalleled performance and accuracy. The intuitive user interface is specifically designed for easy operation while still providing a wide variety of analysis functions.
The CoCo hardware platform supports two different software working modes: Dynamic Signal Analyzer (DSA) and Vibration Data Collector (VDC). Each working mode has its own user interface and navigation structure. DSA mode is designed for mechanical structure analysis, testing and optimization, electrical, geophysics, and a wide range of other applications. VDC mode is dedicated to route-based machine condition monitoring, vibration data collection, and trending.
PerformanceThe CoCo hardware utilizes a dual processor architecture. An XScale CPU handles the user interface, project configuration, power management, network communication, and all peripherals. A high-speed floating point DSP manages the data input/output and real-time processing. The CoCo is also configured with large RAM and NAND flash memory for mass data storage. The patented design eliminates the need for multiple front-end gain settings, while at the same time delivering a dynamic range of more than 150 dBFS.
ReliabilityThe CoCo battery lasts up to 10 hours. Special thermo and low power design eliminates the need for a cooling fan, which increases the battery operating time.
CRYSTALINSTRUMENTS.COM | PAGE 1

Data RecorderMax Data Recording Rate: 102.4 kHz, 8 channels simultaneouslyReal-Time Spectral Bandwidth: 46 kHzReal-Time Frequency Response + Recording Rate: 1 excitation plus 7 response inputs with sampling rate up to 102.4 kHz when streaming recording is disabled; up to 64 kHz when streaming recording is enabled.
Frequency Response Function (FRF)By utilizing the FFT technique, FRF with phase and coherence can be computed using various excitation sources, including white or pink noise. FRF can also be computed using triggered transient capture and average. In swept sine tests the tracking filters will be applied to obtain the FRF.
Acoustic AnalysisThe CoCo has strong capabilities to compute octave analysis with real-time filters. Various sound level meter (SLM) measurements can be calculated according to the IEC and ISO standards.
Order TrackingRaw time streams, real-time order tracks and order spectra, narrow band RPM spectra and fixed band RPM spectra, overall RPM spectrum, and order tracks with phase relative to tachometer signals can all be measured.
Co
Co
SE
RIE
S D
YN
AM
IC S
IGN
AL
AN
ALY
ZE
R
SO
FT
WA
RE
OP
TIO
NS
& F
EA
TU
RE
S
PAGE 2 | CRYSTALINSTRUMENTS.COM
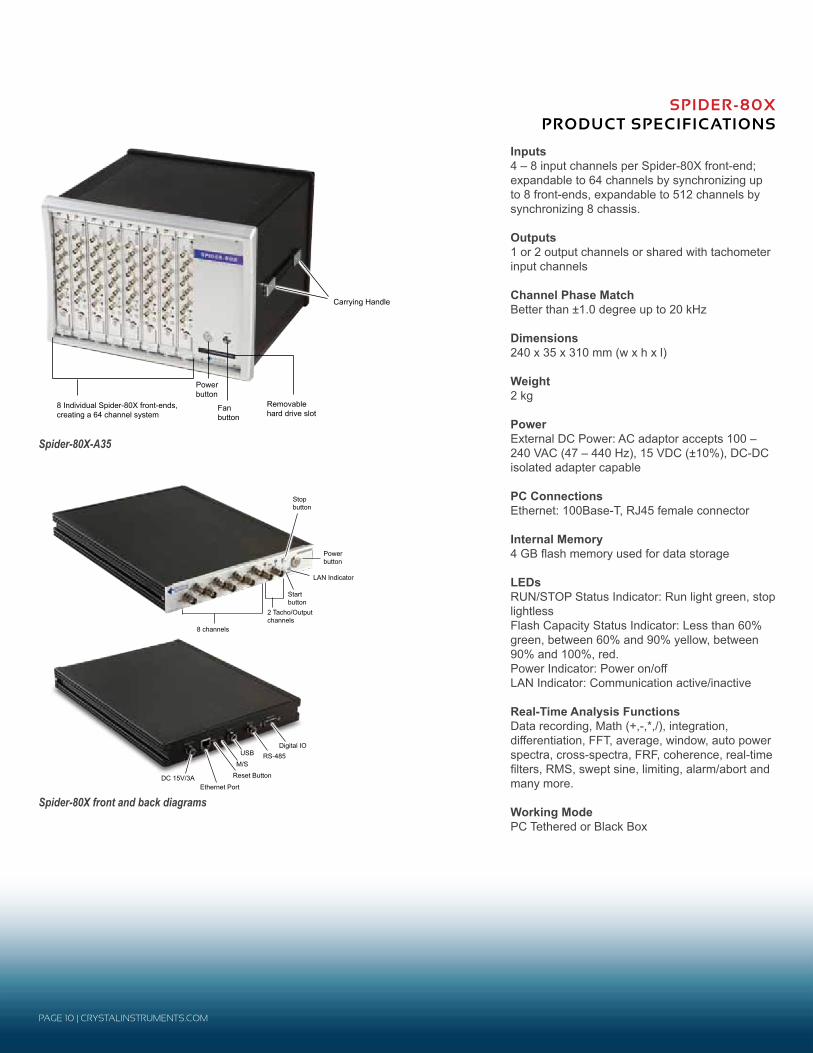
Zoom FFTWith ZOOM spectrum analysis, the user can achieve a very high frequency resolution without computing the entire spectrum. The CoCo computes the FRF, coherence, auto power spectra and phase spectra within a user-defined ZOOM frequency band.
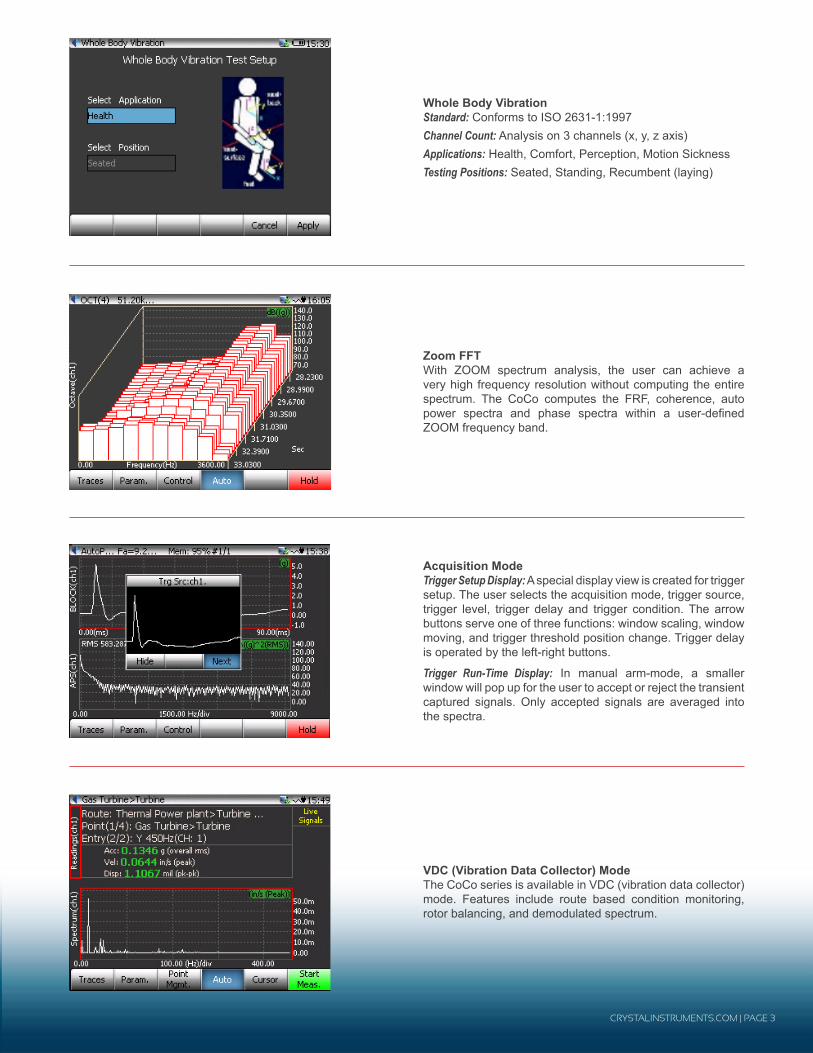
Whole Body VibrationStandard: Conforms to ISO 2631-1:1997Channel Count: Analysis on 3 channels (x, y, z axis)Applications: Health, Comfort, Perception, Motion SicknessTesting Positions: Seated, Standing, Recumbent (laying)
Acquisition ModeTrigger Setup Display: A special display view is created for trigger setup. The user selects the acquisition mode, trigger source, trigger level, trigger delay and trigger condition. The arrow buttons serve one of three functions: window scaling, window moving, and trigger threshold position change. Trigger delay is operated by the left-right buttons.
Trigger Run-Time Display: In manual arm-mode, a smaller window will pop up for the user to accept or reject the transient captured signals. Only accepted signals are averaged into the spectra.
VDC (Vibration Data Collector) ModeThe CoCo series is available in VDC (vibration data collector) mode. Features include route based condition monitoring, rotor balancing, and demodulated spectrum.
CRYSTALINSTRUMENTS.COM | PAGE 3

Configurable Signal Analysis (CSA) is a new concept introduced and adopted by Crystal Instruments in its newest generation of dynamic signal analyzer systems, including the CoCo-80. It allows the user to dynamically configure the DSP (Digital Signal Processing) functions so that the data processing flow can be customized from application to application. The result is a portable, customizable handheld signal analyzer which includes specialized, powerful functions while maintaining a very clean and simple user interface for day to day operation. CSA is a unique feature that is currently available only in Crystal Instruments products.
Unlike the traditional approach, CSA is user customizable. With CSA, the user can flexibly apply various math operations to live data streams without changing the installed program. The processing algorithm is a combination of user customizable math functions. Most of these algorithms are fairly simple, such as add, subtract, multiply and divide operations. Some others are very sophisticated, such as calculating the Frequency Response Functions (FRFs), between all the channels. The user can choose and apply the analysis functions of their choice, or combine them to meet their particular needs. The user can also cascade these algorithms in sequence combining several functions to generate a very advanced new function. With this approach, the CoCo DSP systems are enabled with “unlimited” application functionality.
CSA EditorCustomization of a CSA script is done within the CSA Editor which is integrated into the Crystal Instruments EDM software. The CSA Editor uses an intuitive drag and drop graphic language that makes configuring the CSA an easy-to-learn visual process.
CONFIGURABLE SIGNAL ANALYSISFOR DYNAMIC SIGNAL ANALYZERS
CSA script (XML)
DSP Real-time Execution
Interpretation
User Interface
A typical CSA (configurable signal analysis) script
Power button Indicator
light
5.7 inch color LCD display
Dedicated keypad allows user to start, stop, & record data. Allows quick display settings.
Directional & enter buttons
Escape or back button
Shift button
Durable strap
Function keys
Additional loop for strap adjustment
Microphone input for annotation
Headphone input
Reset SD card slot
Ethernet
USB Host
USB Client
PAGE 4 | CRYSTALINSTRUMENTS.COM

The CoCo-80 is configured with 2, 4, or 8 channels. The CoCo-90 features 16 channels in the same form factor as the CoCo-80.
Power button Indicator
light
5.7 inch color LCD display
Dedicated keypad allows user to start, stop, & record data. Allows quick display settings.
Directional & enter buttons
Escape or back button
Shift button
Durable strap
Function keys
Additional loop for strap adjustment
Microphone input for annotation
Headphone input
Reset SD card slot
Ethernet
USB Host
USB Client
CRYSTALINSTRUMENTS.COM | PAGE 5
CoCo PRODUCT SPECIFICATIONSThe CoCo-80 is equipped with 2, 4, or 8 input channels through BNC connectors. It can accurately measure and record both dynamic and static signals. The mass flash memory can record 8 channels of streaming signals simultaneously (up to 102.4 kHz) while computing real-time time and frequency based functions. An embedded signal source channel provides various signal output waveforms that are synchronized with the input sampling rate.
The CoCo-90 is equipped with 16 input channels employing LEMO connectors. It can accurately measure and record both dynamic and static signals. The mass flash memory can record 16 channels of streaming signals simultaneously (up to 51.2 kHz) while computing real-time time and frequency based functions. An embedded signal source channel provides various signal output waveforms that are synchronized with the input sampling rate. LEMO to BNC adapters are provided.
Inputs of CoCo-80Up to 8 BNC connectors, built-in IEPE current source, single-ended or differential, AC or DC coupling, 150 dBFS dynamic range, dual 24-bit A/D converters, range ±10 Volts (Optional ±20 Volts range)
Inputs of CoCo-9016 LEMO connectors, built-in IEPE current source, single-ended, AC or DC coupling, 100 dB dynamic range, 24-bit A/D converters, range ±10 Volts
Output1 SMB connector, 100 dB dynamic range, 24-bit A/D converter
Audio3.5 mm Audio Jack Stereo connector for earphones, plus built-in speaker and microphone
Dimensions231 x 170 x 69 mm
Weight1.71 kg including battery
PowerAC Adapter: 110-240 Volts ACMax Power Consumption: 14 wattsBattery Operations: up to 10 hours in automatic mode
Host Interface2 USB ports, 100 Base-T Ethernet, SD Card
Maximum Sampling Rate102.4 kHz simultaneously (CoCo-80 only)
Flash Memory4 GB used for system and data storage
LCD5.7 inch LED backlight, 320 x 240 resolution, color
Typical Real-time Analysis FunctionsMath (+,-,*, /), integration, differentiation, FFT, averaging, windowing, auto power spectra, cross spectra, FRF, coherence, real-time filters, RMS, octave, order tracking, swept sine, limiting, alarm/abort and much more.
Vibration Data Collection Functions RMS, true-RMS, overall-RMS, waveforms, spectrum, demodulated spectrum, trending and alarm, 2 plane balancing. Measure acceleration, velocity, displacement and tachometer.

HIGH CHANNEL COUNT DYNAMIC SIGNAL ANALYSIS
High Precision Front-end DesignThe Spider-80X analog input channels provide extremely high precision measurements. Each channel has single-ended or differential AC or DC input coupling. It can also provide IEPE (ICPTM) input mode (AC coupling with a 4 mA constant current from a 22 VDC source) for use with industry-standard accelerometers with built-in amplifiers. The ability to read TEDS (Transducer Electronic Data Sheet) identification from the attached transducer completes the channel’s compliance with IEEE 1451.4.
In some models, built-in charge amplifiers are available. For pyrotechnic and other high-shock applications or tests involving very high DUT (device under test) temperature, each input channel can accept charge-mode piezoelectric sensor input directly without using an expensive external charge amplifier.
It is unnecessary to adjust the input sensitivity of any channel; these are fixed at ±20 Volts. Each channel provides an unprecedented dynamic range of 150 dBFS, detecting voltages as small as 600 nV. This is accomplished by applying two 24-bit analog-to-digital converters to each channel and combining their outputs in accordance with our United States Patent number 7,302,354.
Simple Network ConnectionEthernet connectivity allows Spiders to be located far from their host PC. This distributed structure greatly reduces noise and electrical interference in the system.
Time Synchronization between Multiple Hardware Front-ends with only Ethernet CableThe Spider-80X is built on IEEE 1588 Precision Time Protocol (PTP) time synchronization technology. Spider-80X front-ends on the same network synchronize within 50 ns accuracy, which guarantees ±1° cross-channel phase match up to 20 kHz across the complete system. With this unique technology and high-speed Ethernet data transfer, the distributed components on the network truly act as one integrated system.
Black Box ModeBlack Box mode enables Spider-80X operation without a PC. In this mode, a PC is used only to configure the control system before the system starts operation and to download data after the test is completed. During the test, the controller operates autonomously, according to a preset schedule or in response to a connected iPad.
PAGE 6 | CRYSTALINSTRUMENTS.COM

SP
IDE
R-8
0X
DY
NA
MIC
SIG
NA
L A
NA
LYS
ISS
OF
TW
AR
E F
EA
TU
RE
S &
OP
TIO
NS
Frequency Response Function (FRF)The Spider-80X performs FRF analysis, a function which computes the structural response to steady-state osciliatory excitation. An important application of dynamic signal analysis is characterizing the input-output behavior of physical systems. With linear systems, the output can be predicted from a known input if the fequency response function of the system is known.
Octave Analysis and Sound Level Meters (SLM)Both octave filter and sound level meters are implemented based on high precision real-time filters. FFT spectral analysis, octave analysis and sound level meter analysis can be executed at the same time.
Time Waveform RecordingIn addition to saving spectral data, the Spider-80X has the ability to record time wave form data. Raw time wave form data from an array of different sensors is displayed and recorded at sampling rates of up to 102.4 kHz. On the fly processing is also available with different data conditioning modules applied to the raw incoming time streams. Data conditioning includes algebraic functions (addition, subtraction, multiplication, and division), digital filtering, integration, differentiation, calibration, and other math operations applied to the continuous incoming time streams.
Automated Schedule and Limiting TestAutomated limit test function allows the Spider front-end to conduct automated limit checking for time or frequency signals. The function is supported in both PC tethered mode and Black Box mode. Limiting signals are designed using the EDM software on the host PC. There are four elements in a limiting test: signals being tested, upper or lower limits applied, testing schedule, and testing log.
CRYSTALINSTRUMENTS.COM | PAGE 7

iPad Application for DSA The EDM App for iPad by Crystal Instruments is available from the Apple App Store. The EDM App allows access to the Spider-80X front-end when operating in Black Box mode. Users will be able to access a preloaded test on their iPad to run and control the Spider-80X as long as they are within the range of a wireless network. The display window shows one or multiple signals. Users can print or email screen shots.
Real-Time Digital FiltersReal-time digital filters are applied in the data conditioning phase. The user designs the filter model with a graphic design tool provided and uploads the filter design parameters to the front-end for real-time calculation. The graphic design tool draws the filter performance in vertical axis with dB unit and horizontal axis in relative frequency.
Shock Response Spectrum (SRS) AnalysisCompute the SRS for all channels using maxi-max, maximum negative, and maximum positive analysis techniques. A reference profile is available.
PAGE 8 | CRYSTALINSTRUMENTS.COM

Spider-80XThe Spider-80X, a compact package, is designed for applications in three fields: dynamic data acquisition, vibration control, and machine monitoring. It features eight analog input channels and two channels that may be software selected as analog outputs for vibration control or tachometer inputs for the analysis of rotating machinery. A single Spider-80X front-end is a complete two-output controller with the same high quality patented dual ADC input technology as the Spider-81 series. The Spider-80X inputs provide absolute/differential and AC/DC/IEPE coupling choices; charge mode is an available option. The Spider-80X also provides the same time sync Ethernet connectivity and 4 GB flash memory for data and program storage. Multiple Spider-80X front-ends may be linked together using the (eight-into-one) Spider-HUB industrial Ethernet switch and storage can be increased to 250 GB by adding a Spider-NAS mass storage device.
Spider-80X-A35 The Spider-80X-A35 is a dedicated eight-bay frame that houses from one to eight Spider-80X front-ends. It has built-in Spider-HUB circuitry and built-in Spider-NAS mass storage capability. The Spider-80X-A35 includes a line-powered power supply and internal cables to integrate all the front-ends installed. Users can build systems with 8 to 64 input channels and 2 to 16 outputs. Up to eight Spider-80X-A35 boxes may be integrated using a single Spider-HUB to achieve a system with 512 inputs and 128 output or tachometer channels. This system provides the ultimate in flexibility. It may be used as one large system, or separated into eight smaller systems. The entire system or any of its component Spider-80X front-ends may be used to run controlled vibration tests or to execute signal analysis missions.
Spider-HUBThe Spider-HUB Ethernet switch supports the latest IEEE 1588v2 technology. The Spider-HUB guarantees time-stamping accuracy within 50 nanoseconds and can be configured for 1588v2 Master, Boundary Clock, and Transparent Clock functionality.
With a total of ten Ethernet ports, the modular design of the Spider-HUB provides users with greater flexibility and quick expansion of multiple switches. A choice between front or rear wiring, the small footprint, and low energy consumption make the Spider-HUB suitable for a variety of industrial applications.
IEEE 1588 can be used together with Synchronous Ethernet (SyncE) to ensure the high quality transport of timing information across the network. The IEEE 1588v2 and SyncE implementation on the Spider-HUB allow network devices to accurately time synchronize up to 20 ns with locked phase.
Spider-NASThe Spider-NAS (Network Attached Storage) is a dedicated storage device designed to work with Crystal Instruments Spider front-ends, including the Spider-80X and the Spider-81. Each Spider-NAS device supports up to eight Spider front-ends to collect both streaming time waveform data and spectral data. An Ethernet connection in back connects to a computer for data download and configuration.
At the center of the Spider-NAS, sits a removable 250 GB serial ATA (SATA) Solid State Disk (SSD). This SSD not only provides greater shock protection than a classic hard drive but it also features a faster boot up time (less than 15 seconds) and is particularly energy efficient.
Spider-HUB Industrial Ethernet Switch
Spider-NAS Storage Device
Spider-80X-A35 with 64 channels and one Spider-80X front-end (right)
CRYSTALINSTRUMENTS.COM | PAGE 9
Removable hard drive slot
Power button
Fan button
8 Individual Spider-80X front-ends, creating a 64 channel system
Carrying Handle
8 input channels
2 Tacho/Output channels
Start button
Stop button
LAN Indicator
Power button
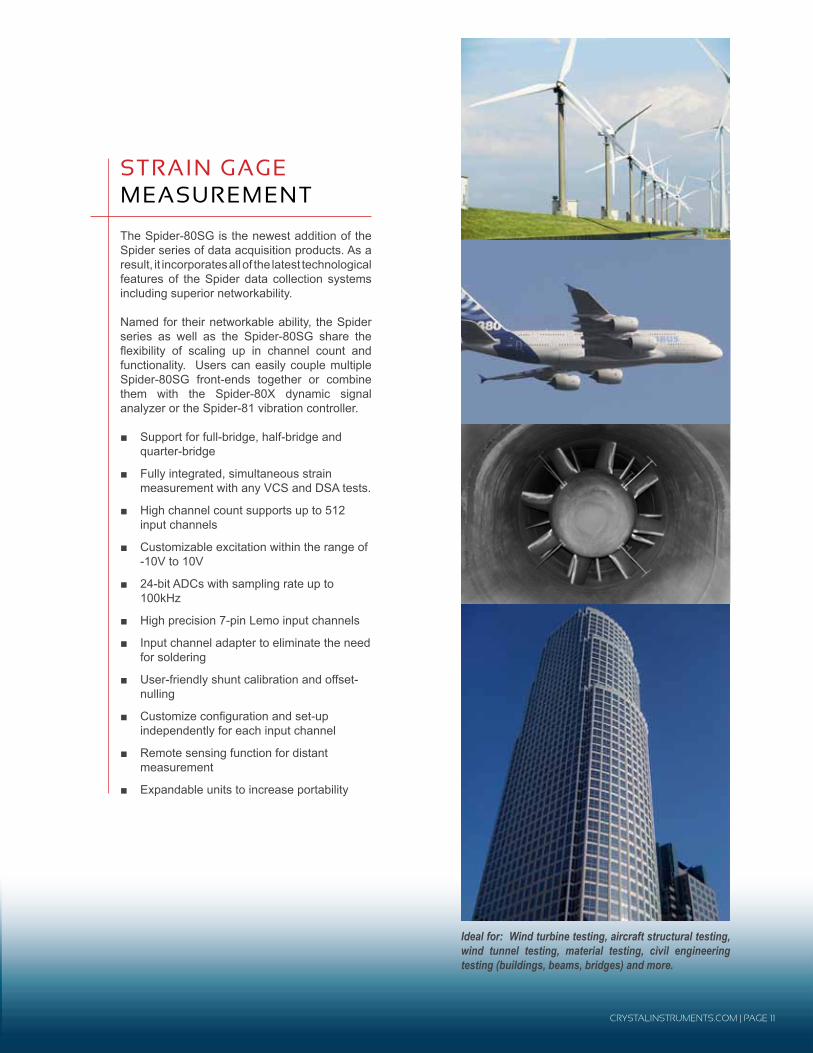
Inputs4 – 8 input channels per Spider-80X front-end; expandable to 64 channels by synchronizing up to 8 front-ends, expandable to 512 channels by synchronizing 8 chassis.
Outputs1 or 2 output channels or shared with tachometer input channels
Channel Phase MatchBetter than ±1.0 degree up to 20 kHz
Dimensions240 x 35 x 310 mm (w x h x l)
Weight2 kg
PowerExternal DC Power: AC adaptor accepts 100 – 240 VAC (47 – 440 Hz), 15 VDC (±10%), DC-DC isolated adapter capable
PC ConnectionsEthernet: 100Base-T, RJ45 female connector
Internal Memory4 GB flash memory used for data storage
LEDsRUN/STOP Status Indicator: Run light green, stop lightlessFlash Capacity Status Indicator: Less than 60% green, between 60% and 90% yellow, between 90% and 100%, red.Power Indicator: Power on/offLAN Indicator: Communication active/inactive
Real-Time Analysis FunctionsData recording, Math (+,-,*,/), integration, differentiation, FFT, average, window, auto power spectra, cross-spectra, FRF, coherence, real-time filters, RMS, swept sine, limiting, alarm/abort and many more.
Working ModePC Tethered or Black Box
SPIDER-80X PRODUCT SPECIFICATIONS
Spider-80X-A35
8 channels
2 Tacho/Output channels
Start button
Stop button
LAN Indicator
Power button
Ethernet Port
Reset Button
M/S
USB RS-485Digital IO
DC 15V/3A
Spider-80X front and back diagrams
PAGE 10 | CRYSTALINSTRUMENTS.COM
CRYSTALINSTRUMENTS.COM | PAGE 11
The Spider-80SG is the newest addition of the Spider series of data acquisition products. As a result, it incorporates all of the latest technological features of the Spider data collection systems including superior networkability.
Named for their networkable ability, the Spider series as well as the Spider-80SG share the flexibility of scaling up in channel count and functionality. Users can easily couple multiple Spider-80SG front-ends together or combine them with the Spider-80X dynamic signal analyzer or the Spider-81 vibration controller.
Support for full-bridge, half-bridge and quarter-bridge
Fully integrated, simultaneous strain measurement with any VCS and DSA tests.
High channel count supports up to 512 input channels
Customizable excitation within the range of -10V to 10V
24-bit ADCs with sampling rate up to 100kHz
High precision 7-pin Lemo input channels
Input channel adapter to eliminate the need for soldering
User-friendly shunt calibration and offset-nulling
Customize configuration and set-up independently for each input channel
Remote sensing function for distant measurement
Expandable units to increase portability
STRAIN GAGEMEASUREMENT
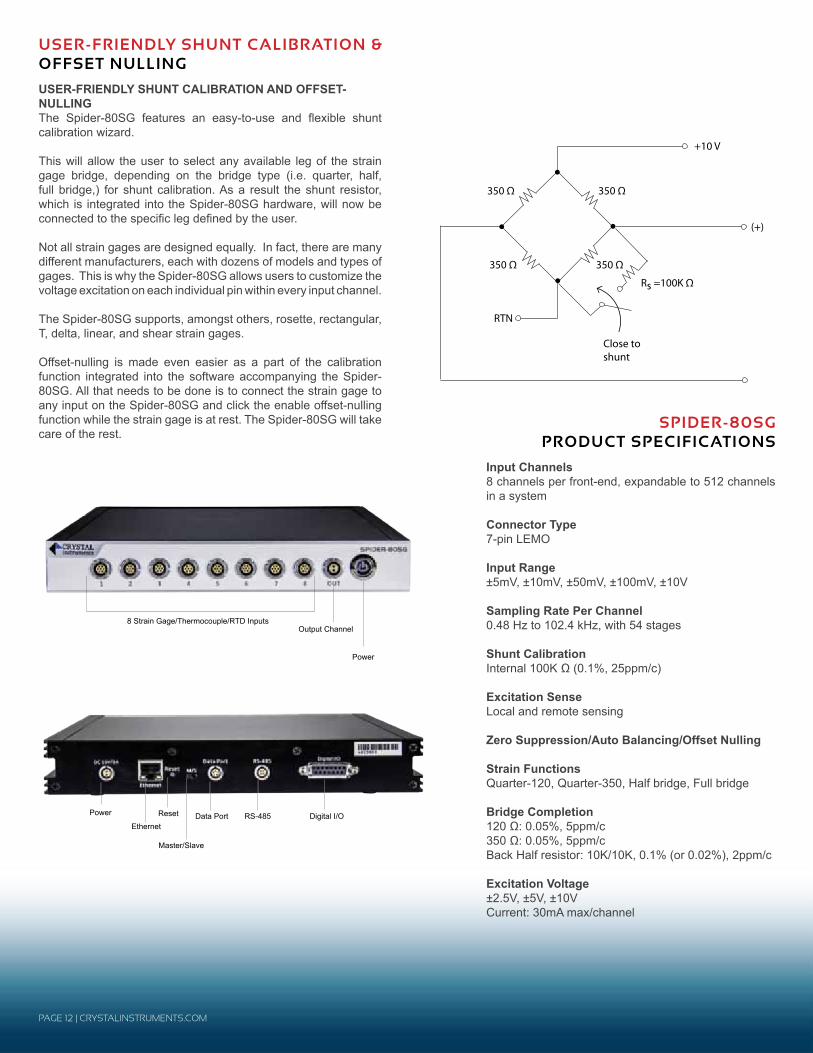
Ideal for: Wind turbine testing, aircraft structural testing, wind tunnel testing, material testing, civil engineering testing (buildings, beams, bridges) and more.
PAGE 12 | CRYSTALINSTRUMENTS.COM
Input Channels8 channels per front-end, expandable to 512 channels in a system
Connector Type7-pin LEMO
Input Range±5mV, ±10mV, ±50mV, ±100mV, ±10V
Sampling Rate Per Channel0.48 Hz to 102.4 kHz, with 54 stages
Shunt CalibrationInternal 100K Ω (0.1%, 25ppm/c)
Excitation SenseLocal and remote sensing
Zero Suppression/Auto Balancing/Offset Nulling
Strain FunctionsQuarter-120, Quarter-350, Half bridge, Full bridge
Bridge Completion120 Ω: 0.05%, 5ppm/c350 Ω: 0.05%, 5ppm/cBack Half resistor: 10K/10K, 0.1% (or 0.02%), 2ppm/c
Excitation Voltage±2.5V, ±5V, ±10VCurrent: 30mA max/channel
SPIDER-80SG PRODUCT SPECIFICATIONS
8 Strain Gage/Thermocouple/RTD InputsOutput Channel
Power
Power
Ethernet
Reset
Master/Slave
Data Port RS-485 Digital I/O
8 Strain Gage/Thermocouple/RTD InputsOutput Channel
Power
Power
Ethernet
Reset
Master/Slave
Data Port RS-485 Digital I/O
350 Ω
350 Ω350 Ω
350 Ω
RTN
+10 V
(+)
Rs =100K Ω
Close to shunt
USER-FRIENDLY SHUNT CALIBRATION AND OFFSET-NULLINGThe Spider-80SG features an easy-to-use and flexible shunt calibration wizard.
This will allow the user to select any available leg of the strain gage bridge, depending on the bridge type (i.e. quarter, half, full bridge,) for shunt calibration. As a result the shunt resistor, which is integrated into the Spider-80SG hardware, will now be connected to the specific leg defined by the user.
Not all strain gages are designed equally. In fact, there are many different manufacturers, each with dozens of models and types of gages. This is why the Spider-80SG allows users to customize the voltage excitation on each individual pin within every input channel.
The Spider-80SG supports, amongst others, rosette, rectangular, T, delta, linear, and shear strain gages.
Offset-nulling is made even easier as a part of the calibration function integrated into the software accompanying the Spider-80SG. All that needs to be done is to connect the strain gage to any input on the Spider-80SG and click the enable offset-nulling function while the strain gage is at rest. The Spider-80SG will take care of the rest.
USER-FRIENDLY SHUNT CALIBRATION &OFFSET NULLING

CRYSTALINSTRUMENTS.COM | PAGE 13
OCTAVE ANALYSIS & SOUND LEVEL METER (SLM)
Acoustics measurements are performed for a variety of reasons, including: product design, production testing, machine performance, and process control. Crystal Instruments’ CoCo and Spider series have capable acoustic measurement facilities including real-time octave, 1/3 octave filters, and sound level meter functions. Crystal Instruments provides an easy to use yet powerful toolbox for acquiring and viewing acoustic signals. Digital octave band filters and raw time data recording can be performed simultaneously for a detailed investigation of noise problems.
The CoCo series hardware is ideal for portable applications that require acoustic measurements from 2 to 16 channels. The Spider series meets the requirements for measurements from 4 input channels going up to 512 channels!
Onboard IEPE (ICP®) transducer power capability allows for direct connection to pre-polarized microphones when used with an ICP microphone preamplifier. Traditional condenser microphones are also easily accommodated by connecting the direct voltage signal from the microphone power supply into an input channel. White and pink noise signals can be produced using the waveform generator. This feature is very useful when performing absorption measurements using a speaker.
Real-time Octave AnalysisThe acoustic data acquisition software option for CoCo and Spider hardware includes real-time octave filters, sound level meters, and microphone calibration functions. These three operations allow users to perform many acoustic measurement operations.
The octave analysis option applies a bank of real-time filters with 1/1, 1/3rd, 1/6th, or 1/12th octave resolution. The input time stream is split into fractional frequency-band signals (octave bands) which can be saved. Frequency weighting can be applied to the octave bands to simulate human hearing, and time weighting can be applied to adjust sensitivity to short duration events. The resulting octave spectra can be saved periodically and displayed on a waterfall plot to observe how the spectrum changes in time. The RMS time history can also be saved as a time trace of a given octave band.
The 1/1 and 1/3 octave analysis is implemented using a real-time band-pass filtering with decimation technique. The data stream is processed continuously, and fed into a bank of decimation filters. Band-pass filters are then applied to the output of each stage of the decimation filters. This provides extremely accurate filter shapes that comply with worldwide acoustic standards: ANSI std. S1.11:2004, Order 3 Type 1-D and IEC 61260-1995.
Sound Level Meter (SLM) results
Overlaid Spectra with Time Trace
EDM Octave-APS-Waveform overlaid composite

PAGE 14 | CRYSTALINSTRUMENTS.COM
Acoustic Measurement: Sound Level MeterThe Sound Level Meter (SLM) is a related application in the acoustic data acquisition software. This module is also referred to as an Overall Level Meter. The SLM applies a frequency weighting filter to the input signal and time weighting to the filter’s output. Various acoustic measurements are then extracted from both the input and output signals of this frequency weighting filter.
All of the features that you would expect from an acoustic measurement device are present…and then some! A, B, C, and linear weighting functions; fast, slow, impulse, and peak detectors; and user selectable high and low-pass filtering. The tremendous dynamic range that all Crystal Instruments products offer take the worry out of setting voltage ranges precisely to avoid under-range or overload conditions.
Built-in Microphone CalibrationMicrophone calibration is easily handled by using a traditional microphone calibrator together with the online calibration feature. Simply define the frequency and amplitude of the reference signal, and the Crystal Instruments system will automatically detect the input channel that the calibration signal is applied to and then calculate the necessary calibration constants. Offsets are calculated and stored for later reference. Calibration can also be accomplished by entering microphone sensitivity values directly in the channel parameter setup page.
Simultaneous Recording and Octave AnalysisBoth the CoCo and Spider series are designed with simultaneous time-stream recording capability. While the acoustic analysis is processed in real time, the raw time data of the CoCo can be recorded onto either internal flash memory or an SD card, and that of the Spider can be recorded into internal flash memory or an external dedicated Spider-NAS storage device.
The raw time data of all input channels can be recorded at full analysis frequency band. After recording, the saved files can be processed by using EDM Post Analyzer which provides the identical analysis algorithm to those available in the real time mode.
The CoCo-80 combines with a microphone to take measurements inside an anechoic chamber
Sound Level Meter (SLM) results
More Sound Level Meter (SLM) results

CRYSTALINSTRUMENTS.COM | PAGE 15
ROTATIONAL DYNAMICACQUISITION & ANALYSIS
The high channel count Spider systems and CoCo portable instruments provide a wide range of real-time order tracking capability to understand the noise and vibration induced within rotating and reciprocating machines. Fixed and variable speed machines are accommodated as are both structural vibration and condition monitoring diagnostics. Multiple tachometer inputs can be processed for accurate speed tracking during analysis. Spectral mapping, order tracking, time history and orbit data analysis are all available.
Additionally, Crystal Instruments provides post processing order tracking capability in its Post Analyzer (PA) that generates the same analysis results as real-time order tracking. The user can simply record the raw data together with tachometer signals and process them later.
Advanced Digital ProcessingAll measurements in the order domain are derived from an advanced digital resampling method. High speed DSP processing allows synchronization of the analyzer’s sampling rate to a tachometer signal. The analyzer’s sampling rate continuously adjusts to track variation in shaft speed. After data sampling, a flexible radix FFT converts the time/angle data into the frequency/order domain. The flexible radix algorithm provides a much broader choice of resolutions and spans than does a power-of-2 FFT for extraction of the order amplitude values as a function of RPM. Order tracking extracts the amplitude at a single order and plots it against machine speed (RPM). Real-time order tracking offers advantages over fixed sample rate techniques. It provides better tracking performance when the RPM varies quickly. Additionally, it provides precise control over the order resolution of the measurement. For instance, users can specify that the order resolution be 1/10 of an order for all measurements. There are also significant benefits in order amplitude estimation provided by the real-time order tracking method. Since the sampling rate is synchronized to the tachometer signal, the data in each frame is always exactly periodic with respect to the fundamental speed. That is, there are always an integer number of cycles for the fundamental and its harmonics in each data frame. Because of this periodicity, there is no need to use a spectral window, such as a Hann window, in the tracking calculation. This results in a more accurate estimate of the amplitude for each order.

PAGE 16 | CRYSTALINSTRUMENTS.COM
Real-Time Order Tracks and Order SpectraReal-Time order tracks are the amplitude history signals of certain “rotational orders” graphed against the machine’s RPM. Multiple order tracks can be measured, displayed, and saved. Order spectra are auto power spectra that are normalized to orders. All order tracks can have the optional phase which is phase measurement relative to the tachometer signal.
The RPM range can be from 10 to 10,000. The acquisition modes include: Free Run, Run Up, Run Down, Run Up and Down, Run Down and Up order tracks can be scaled with linear peak, linear RMS, or power scaling. Constant Band Frequency SpectraConstant band frequency spectrum displays the auto power spectrum of the selected fixed band of frequencies and is computed using FFT analysis within the fixed band of interest. 3D plots using time or RPM as the reference are available along with 3D extractions of desired orders of interest. The available spectrum amplitude units includes EUpk, EUrms, EU2rms, EU2/Hz, and EU2•s/Hz Order Tracks with Phase Order tracks with phase are order spectra with the associated phase measurement relative to the tachometer signal. All the measurement specifications are the same as real-valued order tracks, except that order tracks with phase can also be displayed as Bode, Polar, or Nyquist plots. Furthermore, with this option the orbit display can be enabled for any two data channels. Tachometer ProcessingThe tachometer is stored as a time history. The user may view either the original tachometer input waveform or the resulting RPM-versus-time translation. A tachometer channel can be used to extract the order track of any input channel or channels. Tachometer signal processing automatically eliminates any “glitches” in the tachometer pulse train and reconstructs the best estimate pulse signal for phase measurement.
Shaft
Key
Tachometer Probe(key phasor) Shaft
Encoder
Precision Period Detector
1/rev
... or ...
n/rev
Sample-Time Interpolator
Sampling Constants
NnN/rev
Low-Pass Digital Reconstruction Filter
Digital Angle History
DFT
Order-Normalized Digital Spectrum
Sampling Rate Control
Digital Time History
FFT
Power Spectrum
Analog-to-Digital Converter
High Sample Rate (xed frequency)
Fixed Bandwidth Anti-Aliasing Filter
Analog Time
History
Vibration Transducer

CRYSTALINSTRUMENTS.COM | PAGE 17
Orbit AnalysisOnline orbits can be displayed and monitored on a standard two-channel orbit diagram chart. For advanced analysis a throughput recording including a tachometer or vibration signal can be post-processed using the orbit analysis tool in Post Analyzer. This provides averaging, filtering and order based orbit displays with a replay feature for visualizing changes over a change in machine speed.
Display FlexibilityMeasurements can be viewed in real time as the data is being acquired and analyzed. On line displays include the time histories, orbit plots, order spectra, order tracks, waterfalls, spectrograms, and contour plots. Users can also view the instantaneous RPM as a function of time.
Waterfall displays provide a good overview of an entire run-up or run-down measurement. To better understand the measurement results, users can easily change the viewing angle so that effects of order related excitation and structural resonance excitation are immediately obvious.
Waterfall displays include a “slice” mode that provides a plot of a cut across the order or RPM axes. To view a particular slice, simply position the 3D cursor. Users can view the order track for a given order, or fractional order, or view the amplitude-versus-order spectrum at a given RPM. This capability allows the user to quickly zero in on the problem’s root cause.
Color map presentations further enhance problem diagnosis capabilities. For example, spectrograms, or color intensity plots make it very easy to differentiate order related responses from excitation due of a structural resonance. Color contour, or topographic maps, also provide added graphic insight into the nature of a vibration or acoustic response.
A full complement of cursors – single, dual, peak, valley, harmonic and sideband provide precise numeric readout of critical data features. Users also have complete and easy control of the orientation, scaling, colors, etc., enabling the creation of insightful data visualizations.
Polar Plot screenshot from the handheld CoCo-80.

PAGE 18 | CRYSTALINSTRUMENTS.COM
AUTOMATED PRODUCTION TESTING SOLUTIONS
Automated production testing is critical in today’s competitive manufacturing environment. Companies can no longer rely on variable costs, non-uniformity, and potential health hazards that come with a laborer-based manufacturing line. This is no less true for sound and vibration tests, ranging from in-process burn-in tests to product validation and verification tests. The measurement tools and intelligence behind present day manufacturing include data acquisition equipment as well as closed-loop control. And while these systems may not take part in the assembly of any goods, they are just as important to ensure quality control for both components coming into an assembly line and products going out.
Crystal Instruments has evolved a synergistic solution to such testing involving custom hardware and application-focused software. The Spider-80X system is a complete multi-channel analyzer/controller with IEEE 1588 Precision Time Protocol (PTP) Ethernet communication. It can be programmed to accomplish multiple complex measurement tasks using a workstation or PC in combination with Engineering Data Management (EDM) software. Thereafter, the PC can be (optionally) disconnected and tests run in “Black Box” mode without an attached computer. Control of the Spider front-end may be accomplished through an Apple iPad™ tablet using the EDM App for iPad.
EDM serves as the standardized human interface to all Crystal Instruments’ vibration control systems (VCS) and dynamic signal analyzers (DSA). Regardless of the specific application, channel count or language (English, Japanese, Chinese, Russian) the user interface presents the same “look and feel”. Through EDM, the user can create custom interfaces and greatly simplified operating interfaces for specific product tests. Users can also generate custom reports using XML, OpenOffice, PDF, and Microsoft Word templates.
The Spider-81 being used in a “pass/fail” test
Preloaded tests run without an attached computer

CRYSTALINSTRUMENTS.COM | PAGE 19
The Spider API is the gateway to integration with LabView, Matlab and other scripting software. Spider front-ends operate from Android, Linux and iOS in addition to Microsoft Windows. A single iPhone, tablet or PC can control multiple Spider front-ends at distributed locations running disparate tests from a single control screen.
Event-Action Rules (EAR) allows users to customize the system’s response to every test event. User defined events include: signal exceeds a limit profile, signal is less than a limit profile, normal end-of-test, loss-of-signal or any of number of the events encountered during a VCS test. Responses include: halting a test, starting a different test, flashing the control screen, initiating a recording, sending a screen message, sending a text message, or sending an email. Users can program loops using EAR. Every event is logged on a cloud server and is identified by the text of a customized event string (only on EDM Cloud).
Limit Testing (LT) may be applied to a Time Block, Auto Spectrum, FRF, Coherence, Octave Spectrum, Sound-Level Measurements, RMS or Peak value. Spectra and time histories are tested by comparing against a custom test signal; a template which must bound the measured signal. Each test signal may be either an upper or lower limit and may contain up to 64 segments. Up to 64 test signals may be applied to a single measurement.
Burn-in testing for electronic products is a type of testing that is easily automated with sound and vibration instrumentation. For example, consider cell phones, a consumer product produced in the thousands which contains both a microphone and a speaker. These two audio components almost always need to be run through a burn-in test, which is easily automated using the Spider-80X. The Spider-80X provides a stimulating programmable function generator and data collecting input channels.
The methods for testing vary but the principles remain the same. One of the two output channels of the Spider-80X runs through a series of tones or pulses to test the phone’s receiver while the input channels listen to a prerecorded sound clip played out through the speaker. Either time waveform data or spectral data can be collected and pass/fail tolerances set within Crystal Instruments Engineering Data Management (EDM) software.
EDM or EDM Cloud Email
Service
Step 1:EDM sets the alarm limit together with a special message string, such as “Exceeding Limit”.
Step 2:When an alarm event happens, the customized string, “Exceeding Limit” will be sent to the EDM Cloud email service.
Step 3:User will receive an alarm email
Testing status can be viewed on any PC, iPad or even smart phone.

PAGE 20 | CRYSTALINSTRUMENTS.COM
Scalability is a one of the benefits of automation and this is why the Spider-80X is designed as a networked device. With an Ethernet connection on the Spider-80X, multiple front-ends are connected to test tens if not hundreds of cell phones at a time. This may seem a bit excessive until one considers using not just a single microphone per cell-phone but rather using a microphone array to capture and map a planer response or even a 3-dimensional hemisphere of sound around the cell phone.
However, burn-in tests are not the only type of automated production tests performed with sound and vibration instrumentation. Product validation and verification are also an important part of production line testing. Such tests range from validating incoming components to verifying a finished product assembled from them.
Virtually all turbine manufacturers carefully match-tune the component blades of their steam and gas turbines. This involves accurately measuring the natural frequency of one or more vibration modes of each blade individually, while the blade is root-restrained by a standardized fixture. Different manufacturers implement such tests in various manners, but all rely upon measuring the forced vibration response of the blade. The most accurate frequency determinations are made from frequency response functions (FRF), wherein both the stimulating force and resulting vibration are simultaneously measured.
Other products are quality-audited for consistent natural frequencies, to indicating consistent geometry. Often, the damping factor of each mode is also measured and used as an indication of proper assembly and freedom from cracked components. As an example, large artillery shells are impulse-tested using an instrumented hammer and a microphone. When struck, the shell rings like a bell. Each shell must exhibit natural frequencies within an acceptable scatter-band. Shells with high damping factors are subsequently inspected for cracks.
Frequency response functions characterize the linear relationship between a measured input and output and conveys an enormous amount of information. An accompanying two-channel measurement, the coherence function, determines if two signals are linearly related. It is an ideal indicator of throughput linearity, an important characteristic of most electronic circuits and many mechanical structures.
Limit signals display
TestingSchedule
Alarm Event Setup
Setup
TestingLog
SummaryReport
Beep, send message to Host PC, etc.
Events and Report
Compare the signals and their limits in runtime.
An illustration of the automatic testing process.

CRYSTALINSTRUMENTS.COM | PAGE 21
CONTINUOUS DATA RECORDING AND POST ANALYSIS
IntroductionIn a time-critical test, it is highly desirable to record the raw time data continuously, so that the data can be analyzed later when more time is available for a complete review. Integral raw data recording eliminates the need for a separate recording device so necessary just a few years ago.
The CoCo and Spider platforms simultaneously perform both real-time processing and continuous data recording. In most of real-time applications, the raw data can be recorded at any desired sampling rate with full 32-bit floating point precision. To increase the reliability of data recording, a special check sum algorithm is always applied to the measurements.
For example in a typical FFT process, the raw data time streams (full bandwidth, sampled at the instrument’s highest sample rate) and/or the continuous output of a bandwidth-reducing data conditioning process can be recorded at a lower sample rate on the system’s storage media while the real-time filtering and spectral analysis is in progress. This same design philosophy is incorporated in both CoCo portable devices and Spider high channel count systems.
While being recorded, the measured values can be graphically displayed as y/t or y/x diagrams, as bar charts, as waterfalls, FFT, PSD, tachometer speed, or numerical statistics displays with a simple mouse-click. EDM software allows users to design an individual graphical visualization for each desired real-time measurement.
The recording system processes virtually every physical quantity, including: temperature, voltage, stress, strain, pressure, force, acceleration and frequency. Even high channel count applications using hundreds of channels can be configured within a very short time and are handled safely and efficiently.
The recording function is driven by user-defined events. On both CoCo and Spider front-ends the recording “action” can be initiated via various events, including: hard button press, user software command, defined trigger-condition event, digital input event, third party software command, defined alarm limit event, fixed timer, etc.
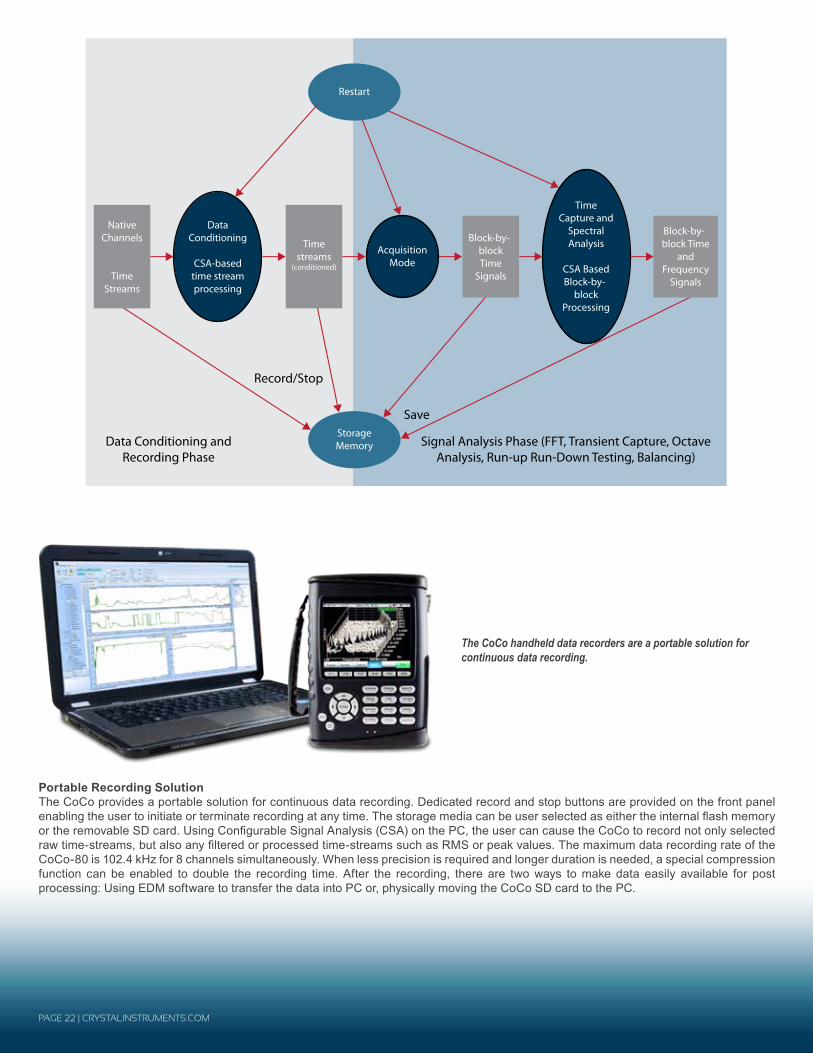
PAGE 22 | CRYSTALINSTRUMENTS.COM
Data Conditioning and Recording Phase
Signal Analysis Phase (FFT, Transient Capture, Octave Analysis, Run-up Run-Down Testing, Balancing)
Data Conditioning
CSA-based time stream processing
Acquisition Mode
Time Capture and
Spectral Analysis
CSA Based Block-by-
block Processing
Storage Memory
Native Channels
Time Streams
Time streams
(conditioned)
Block-by-block Time
and Frequency
Signals
Block-by-block Time
Signals
Restart
Record/Stop
Save
Portable Recording Solution The CoCo provides a portable solution for continuous data recording. Dedicated record and stop buttons are provided on the front panel enabling the user to initiate or terminate recording at any time. The storage media can be user selected as either the internal flash memory or the removable SD card. Using Configurable Signal Analysis (CSA) on the PC, the user can cause the CoCo to record not only selected raw time-streams, but also any filtered or processed time-streams such as RMS or peak values. The maximum data recording rate of the CoCo-80 is 102.4 kHz for 8 channels simultaneously. When less precision is required and longer duration is needed, a special compression function can be enabled to double the recording time. After the recording, there are two ways to make data easily available for post processing: Using EDM software to transfer the data into PC or, physically moving the CoCo SD card to the PC.
The CoCo handheld data recorders are a portable solution for continuous data recording.

CRYSTALINSTRUMENTS.COM | PAGE 23
High Channel Count Solution Using Spider Front-endsFor high channel count applications, the data recording can be realized on Spider systems via either of two approaches: record the time-stream data into the flash memory on each of Spider front-end or, record the time-stream data into an external storage device, such as the Spider-NAS. (One Spider-NAS can service up to eight Spider-80X data acquisition front-ends simultaneously.) Either way, the data recording path does not involve the system’s Ethernet connection. This provides robust recording while preserving network communication bandwidth. The Spider-NAS (Network Attached Storage) is a dedicated storage device that works with front-end modules from Crystal Instruments, including the Spider-80X, Spider-80SG, Spider-81, and Spider-DAQ. Eight dedicated high-speed data buses interface directly with each Spider front-end. Each Spider-NAS dedicated data port communicates at speeds up to 480 MB/second. The Spider-NAS can store simultaneous data from all (64 maximum) attached dynamic measurement channels at a sample rate as high as 102.4 kHz, or as low as a few samples per second. An Ethernet port is used to configure and control the Spider-NAS.
Typical Data Storage on the Spider-NASGeneral Functions NTFS file system: Supports single large data file (2 TB max)
Data format: ASAM ODS data format Data samples are in 32-bit single precision floating point Data file access: EDM, FTP, removable disk Configuration Tool: EDM software from Crystal Instruments
Storage Speed Up to 64 channels, each sampled at up to 102.4 kHz sampling rate retained with 32-bit floating point format (per IEEE 754-2008)
Aggregate speed is greater than 26 MB/secondTypical Storage Duration for a 250 GB Disk 4 channel at 1k Hz/ch sampling rate: 4660 hours
8 channel at 5k Hz/ch sampling rate: 466 hours 8 channel at 102.4 kHz/ch sampling rate: 23 hours 64 channel at 102.4 kHz/ch sampling rate: 3 hours
Management Wake-on LAN, Keyboard Power-on, Timer Power-on System power management, AC power failure recovery Watch Dog Timer
Remote Operation on Recorded DataUsing EDM Cloud, a web-based software tool, the recorded data can be remotely accessed and downloaded to an authorized PC anywhere in the world. This feature is particularly useful for remote machine monitoring or structure health monitoring. Multiple Spider front-ends can be installed throughout a processing factory or at a single machine location. The vibration signals and their extracted characteristic values can be recorded continuously. Using EDM Cloud, the data files can be downloaded to any user site for periodic evaluation or interplant comparison.
The Spider-NAS features eight dedicated high-speed data buses and a removable 250 GB serial ATA (SATA) Solid State Disk (SSD).
High channel count system for data recording diagram.

PAGE 24 | CRYSTALINSTRUMENTS.COM
VERSATILE REPORT FUNCTIONS
In the EDM software, the report function allows users to create a report in several formats including OpenOffice, XML, Microsoft Word, ActiveX and PDF. The report is template-based and completely customizable.
Users can customize the logo, margins, orientation of the paper, font, and the content. Microsoft Word/Office does not need to be installed in order to create reports. In Review Mode, batch reports can be made for the signals saved in multiple runs. Using ActiveX reporting, signal displays in the report can be rescaled, analyzed, and zoomed.
User can select from various templates for creating reports
Plot reports can be generated by simply right-clicking the mouse
Company logos can be inserted into the template header or footer
Reports can be in WORD, XML or PDF format
“Active Report” allows the user to ZOOM in and out like a graph on the report
Generate typical hardware calibration reports

CRYSTALINSTRUMENTS.COM | PAGE 25
EDM POST ANALYZER
To offer a complete package of both real-time analysis and post processing, Crystal Instruments developed EDM supportive applications to include three separate software modules: Post Analyzer, Waveform Editor, and File Converter. Post Analyzer (PA) contains many powerful post processing tools with batch processing capability. The basic structure of supportive applications is:
Post Analyzer is an independent Windows application that analyzes the data files on a computer using various algorithms. PA has three versions: PA Viewer allows the user to view data and create reports; PA Basic has FFT spectral analysis and 3D signal display functions; PA Premium has more advanced functions such as octave filters and order tracking.
Waveform Editor is an independent Windows application that allows the user to cut, edit, or merge the time waveforms.
File Converter is an independent Windows application that converts files in various data formats to standard ATFX format.
PA Viewer is standard while PA Basic and PA Premium are optional.
Post Analyzer
Waveform Editor
File Converter
PA Viewer
PA Basic
PA Premium
EDM Basic and Premium VersionsThere are two versions of EDM software. The EDM Basic version enables data file management, file export, signal viewing, and report generation. EDM Basic does not have data file post-processing functions. EDM Basic is included at no additional cost with the purchase of CoCo hardware.
In addition to all of the EDM Basic functions, EDM Premium has VDC functions, post-processing capability for dynamic signal analysis, and vibration data collector database management. It is available as an upgrade from the EDM Basic software.
User InterfaceEDM is a computer software tool that is used to manage one or more CoCo-80 devices connected to the PC. The physical connection is made through either USB or Ethernet. The EDM software intelligently searches through the connected hardware devices and browses into the remote device to look at its hardware property or software files. Data files are downloaded by drag-and-drop. The user is able to download multiple files and to view the files simultaneously.
EDM is also used as a terminal to configure the CoCo devices. Project files are uploaded with one mouse click. Post ProcessingEDM Post Processing includes a convenient tool to browse through raw data files and make selections for additional post processing. The selected time data is then analyzed using the CSA technique where the process is created using graphic functional elements designed for filtering, spectral analysis, and time-frequency analysis.
Data File Browsing and SelectionA unique algorithm is developed to help users quickly browse through any segment of raw data files even when the files include gigabytes of data.
EDM BASIC & PREMIUM
Customizable Styles: EDM is built completely upon the Microsoft.NET technology. The user interface has a modern look and is customizable per individual preferences.
Customizable Engineering Units: Since the data model is built on ASAM-ODS, signal engineering units are carefully handled. The user displays the signals with user selectable quantity and units.

CRYSTAL INSTRUMENTS 2370 OWEN STREETSANTA CLARA, CA 95054 (USA)
PHONE: +1-408-986-8880 FAX: +1-408-834-7818
EMAIL: [email protected]
To find a distributor near you, please visit our website:
© 2014 Crystal Instruments Corporation. All Rights Reserved. 09/2014
Notice: This document is for informational purposes only and does not set forth any warranty, expressed or implied, concerning any equipment, equipment feature, or service offered or to be offered by Crystal Instruments. Crystal Instruments reserves the right to make changes to this document at any time, without notice, and assumes no responsibility for its use. This informational document describes features that may not be currently available. Contact a Crystal Instruments sales representative for information on features and product availability.