dynamic simulation studies of the frequency response final ... · lbnl-4146e ernest orlando...
TRANSCRIPT
LBNL-4146E
ERNEST ORLANDO LAWRENCE BERKELEY NATIONAL LABORATORY
Dynamic Simulation Studies of the Frequency Response of the Three U.S. Interconnections with Increased Wind Generation
Peter Mackin, Ron Daschmans, Ben Williams, Brian Haney, Randall Hunt, Jeff Ellis Utility Systems Efficiencies, Inc. December 2010 The work described in this report was funded by the Federal Energy Regulatory Commission, Office of Electric Reliability through a subcontract administered by the Lawrence Berkeley National Laboratory, which is operated by the University of California for the U.S. Department of Energy under Contract No. DE-AC02-05CH11231.

Disclaimer
This document was prepared as an account of work sponsored by the United States Government. While this document is believed to contain correct information, neither the United States Government nor any agency thereof, nor The Regents of the University of California, nor any of their employees, makes any warranty, express or implied, or assumes any legal responsibility for the accuracy, completeness, or usefulness of any information, apparatus, product, or process disclosed, or represents that its use would not infringe privately owned rights. Reference herein to any specific commercial product, process, or service by its trade name, trademark, manufacturer, or otherwise, does not necessarily constitute or imply its endorsement, recommendation, or favoring by the United States Government or any agency thereof, or The Regents of the University of California. The views and opinions of authors expressed herein do not necessarily state or reflect those of the United States Government or any agency thereof, or The Regents of the University of California. Ernest Orlando Lawrence Berkeley National Laboratory is an equal opportunity employer.
Dynamic Simulation Studies of the Frequency Response of the Three U.S. Interconnections with Increased Wind Generation
LBNL-4146E
Dynamic Simulation Studies of the Frequency Response of the Three U.S. Interconnections with Increased Wind
Generation
Peter Mackin, Ron Daschmans, Ben Williams, Brian Haney, Randall Hunt, Jeff Ellis
Utility Systems Efficiencies, Inc.
December 2010
The work described in this report was funded by the Federal Energy Regulatory Commission, Office of Electric Reliability through a subcontract administered by the Lawrence Berkeley National Laboratory, which is operated by the University of California for the U.S. Department of Energy under Contract No. DE-AC02-05CH11231.


Dynamic Simulation Studies of the Frequency Response of the Three U.S. Interconnections with Increased Wind Generation
i
Abstract
Utility Systems Efficiencies, Inc. was tasked by Lawrence Berkeley National Laboratory (LBNL) to conduct dynamic simulation studies of the three U.S. interconnections (Eastern, Western, and Texas). The simulations were prepared in support of LBNL’s project for the Federal Energy Regulatory Commission to study frequency-response-related issues that must be addressed to operate the power system reliably with large amounts of variable renewable generation.1 The objective of the simulation studies of each interconnection was to assess the effects of different amounts of wind generation on frequency behavior of each interconnection following a sudden loss of generation. The scenarios created to study these effects considered an operating circumstance in which system load is at or close to its minimum. The event studied was the sudden loss of the largest amount of generation recorded within each interconnection. The simulations calculated the impact of this event on interconnection frequency for three levels of wind generation. In addition to varying the amount of wind generation, the simulations varied the amount of operating reserves between a high level representative of current operating practices and a low level representative of the minimum required by present operating rules.
1 Eto, J., J. Undrill, P. Mackin, R. Daschmans, B. Williams, B. Haney, R. Hunt, J. Ellis, H. Illian, C. Martinez, M. O’Malley, K. Coughlin, and K. Hamachi-LaCommare. 2010. Use of Frequency Response Metrics to Assess the Planning and Operating Requirements for Reliable Integration of Variable Renewable Generation. LBNL-4142E. Berkeley: Lawrence Berkeley National Laboratory.


Dynamic Simulation Studies of the Frequency Response of the Three U.S. Interconnections with Increased Wind Generation
iii
Acknowledgments
The work described in this report was funded by the Federal Energy Regulatory Commission, Office of Electric Reliability through a subcontract issued by the Lawrence Berkeley National Laboratory, which is operated by the University of California for the U.S. Department of Energy under Contract No. DE-AC02-05CH11231. The Principal Investigator for the overall project is Joseph H. Eto, Lawrence Berkeley National Laboratory. The project team expresses its appreciation to the Western Electric Coordinating Council, Electricity Reliability Council of Texas, the Eastern Interconnection Reliability Assessment Group, and system planners in the Eastern Interconnection for graciously providing interconnection-wide system models that were used in the study. Each was helpful and forthcoming in answering the technical questions we asked to better understand the system models. The project team also acknowledges reviews of earlier drafts of this report provided by John Undrill and Mark O’Mally. The study authors, alone, however, bear sole responsibility for technical adequacy of the analysis methods and the accuracy of the study results.

Dynamic Simulation Studies of the Frequency Response of the Three U.S. Interconnections with Increased Wind Generation
v
Table of Contents
Abstract ............................................................................................................................................ i
Acknowledgments.......................................................................................................................... iii
Table of Contents .............................................................................................................................v
Table of Figures and Tables .......................................................................................................... vii
Acronyms and Abbreviations ........................................................................................................ ix
Executive Summary ....................................................................................................................... xi
1. Introduction .................................................................................................................................1
2. Frequency Response Study of Wind Generation in the Western Interconnection ......................3 2.1 WECC 2012 System Model and the Dynamic Simulation Tool .........................................3 2.2 Preparation of the WECC System Model ............................................................................3
2.2.1 Minimum System Load and Load Composition ..........................................................4 2.2.2 Wind Turbine Models ..................................................................................................5 2.2.3 Generation-Loss Event and Under-Frequency Load Shedding ...................................6 2.2.4 Wind Generation and Operating Reserve Scenarios ....................................................7
2.3 Presentation of Simulation Results ......................................................................................8
3. Frequency Response Study of Wind Generation in the Texas Interconnection ........................13 3.1 ERCOT 2012 System Model and the Dynamic Simulation Tool ......................................13 3.2 Preparation of the Texas Interconnection System Model ..................................................13
3.2.1 Minimum System Load and Load Composition ........................................................14 3.2.2 Wind Turbine Models ................................................................................................15 3.2.3 Generation-Loss Event and Under-Frequency Load Shedding .................................15 3.2.4 Wind Generation and Operating Reserve Scenarios ..................................................16
3.3 Presentation of Simulation Results ....................................................................................17
4. Frequency Response Study of Wind Generation in the Eastern Interconnection .....................23 4.1 Eastern Interconnection System Models and the Dynamic Simulation Tool ....................23 4.2 Preparation of the ERAG-MMWG System Model ............................................................23
4.2.1 Load Composition ......................................................................................................24 4.2.2 Generation-Loss Event and Under-Frequency Load Shedding .................................24 4.2.3 Initial Simulation of the Eastern Interconnection Following the Sudden Loss of 4,500 MW of Generation .......................................................................................................24
References ......................................................................................................................................25

Dynamic Simulation Studies of the Frequency Response of the Three U.S. Interconnections with Increased Wind Generation
vii
Table of Figures and Tables
Figure 2-1. Western Interconnection System Load – January 9, 2009 .......................................... 4 Figure 2-2. Western Interconnection Load Composition - 2012 Minimum System Load ............ 5 Figure 2-3. Simulated Western Interconnection System Frequency Behavior Over the First 19
Seconds Following the Sudden Loss of the 2,800 MW of Generation for the High Reserves Case .................................................................................................................... 9
Figure 2-4. Simulated Western Interconnection System Frequency Behavior Over the First 19 Seconds Following the Sudden Loss of the 2,800 MW Generation for the Low Reserves Cases .................................................................................................................................. 9
Figure 2-5. The Power Delivered by Primary Frequency Control Actions Provided by Generator Governors in the Low and High Reserves Cases ............................................................ 10
Figure 3-1. Texas Interconnection System Load – June 5, 2009 ................................................. 14 Figure 3-2. Texas Interconnection Load Composition - 2012 Light System Load ..................... 15 Figure 3-3. Simulated Texas Interconnection System Frequency Behavior Over the First 19
Seconds Following the Sudden Loss of the 2,450 MW of Generation for the High and Low Reserves Cases ........................................................................................................ 17
Figure 3-4. The Effect of Power Delivered by Primary Frequency Control Actions on System Frequency following the Sudden Loss of 2,450 MW of Generation – Low Reserves and 0 GW of Wind ................................................................................................................. 20
Figure 3-5. The Power Delivered (and Load Removed) by Primary Frequency Control Actions via Generator Governors and Load Acting as a Resource following the Sudden Loss of 2,450 MW of Generation – Low Reserves and 0 GW of Wind ...................................... 20
Figure 3-6. The Effect of Power Delivered by Primary Frequency Control Actions on Frequency following the Sudden Loss of 2,450 MW of Generation – Low Reserves and 14.4 GW of Wind ................................................................................................................................ 21
Figure 3-7. The Power Delivered (and Load Removed) by Primary Frequency Control Actions following the Sudden Loss of 2,450 MW of Generation – Low Reserves and 14.4 GW of Wind ................................................................................................................................ 21
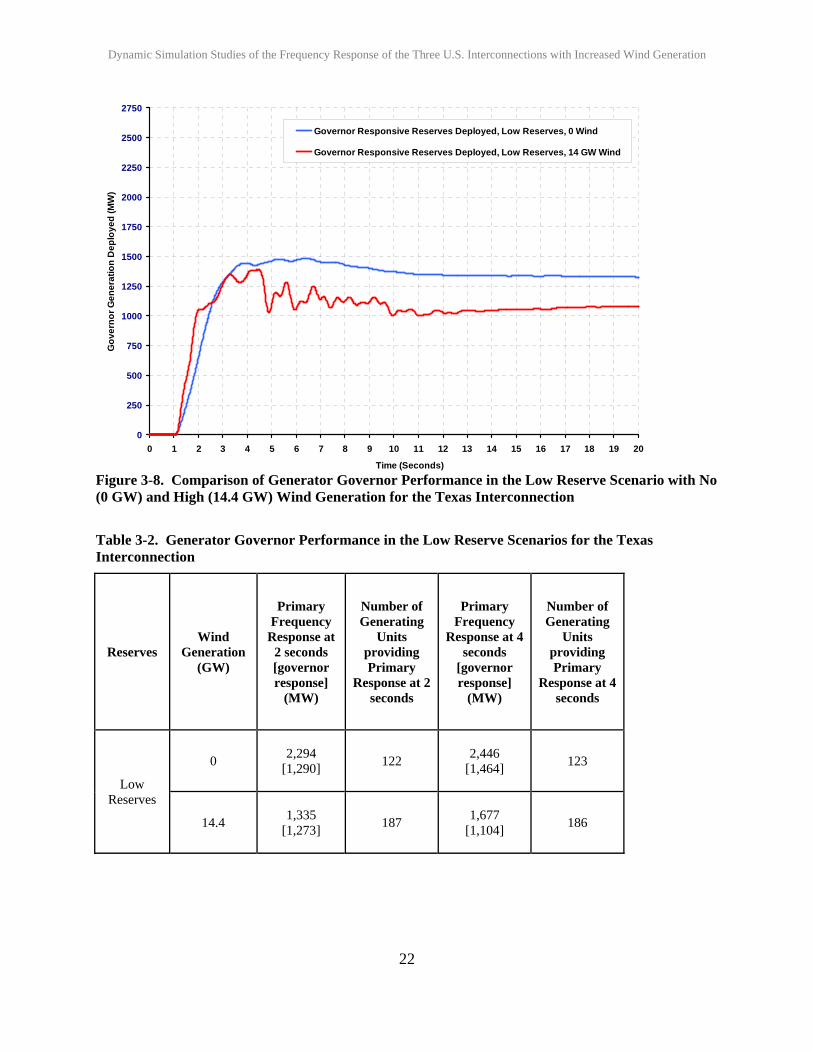
Figure 3-8. Comparison of Generator Governor Performance in the Low Reserve Scenario with No (0 GW) and High (14.4 GW) Wind Generation for the Texas Interconnection ........ 22
Table 2-1. Summary of Dynamic Simulation Results for the Western Interconnection ............. 11 Table 3-1. Summary of Dynamic Simulation Results for the ERCOT Interconnection ............. 18 Table 3-2. Generator Governor Performance in the Low Reserve Scenarios for the Texas
Interconnection ................................................................................................................ 22


Dynamic Simulation Studies of the Frequency Response of the Three U.S. Interconnections with Increased Wind Generation
ix
Acronyms and Abbreviations
COI California-Oregon Intertie ERAG Eastern Interconnection Reliability Assessment Group ERCOT Electricity Reliability Council of Texas FERC Federal Energy Regulatory Commission GE General Electric GW gigawatt (109 watts) Hz hertz LaaR Load acting as a Resource LBNL Lawrence Berkeley National Laboratory MMWG Multiregional Modeling Working Group MW megawatt (106 watts) PDCI Pacific DC Inter-tie PSLF Positive Sequence Load Flow PSS/E Power System Simulator for Engineering USE Utility Systems Efficiencies, Inc VAR voltage-ampere reactive WECC Western Electricity Coordinating Council

Dynamic Simulation Studies of the Frequency Response of the Three U.S. Interconnections with Increased Wind Generation
xi
Executive Summary
Utility Systems Efficiencies, Inc. was tasked by Lawrence Berkeley National Laboratory (LBNL) to conduct dynamic simulation studies of the three U.S. interconnections (Eastern, Western, and Texas). The simulations were prepared in support of LBNL’s project for the Federal Energy Regulatory Commission to study frequency-response-related issues that must be addressed to operate the power system reliably with large amounts of variable renewable generation.2 The objective of the simulation studies of each interconnection was to assess the effects of different amounts of wind generation on frequency behavior of each interconnection following a sudden loss of generation. The scenarios created to study these effects considered an operating circumstance in which system load is at or close to its minimum. The event studied was the sudden loss of the largest amount of generation recorded within each interconnection. The simulations calculated the impact of this event on interconnection frequency for three levels of wind generation. In addition to varying the amount of wind generation, the simulations varied the amount of operating reserves between a high level based on current operating practices and a low level based on the minimum required by present operating rules. The simulations were performed using commercially available, production-grade power flow and dynamic simulation tools. The system models that form the basis for the studies were provided by industry planners within each of the interconnections. The simulations were conducted by varying the level of wind generation contained in system models provided to the project team; no wind, convention generation, nor transmission were added to the system models. The simulations of the Western Interconnection modeled the dynamic performance of wind turbines using recently the certified generic Type 3 wind turbine model. The simulations of the Texas Interconnection modeled the dynamic performance of wind turbines using the wind turbine models contained in the system model provided to the project team. In addition, the simulations of the Texas Interconnection also studied the effect of redispatch procedures that increased the effectiveness of primary frequency control provided by generator governors. The principal findings from the simulation studies of the Western Interconnection are: For the high operating reserve cases and for all three levels of wind generation, the frequency nadir remains well above the highest under-frequency load-shedding set point, which is 59.5 Hertz (Hz). The initial rates of frequency decline are nearly identical, but the frequency nadirs are slightly lower as the level of wind generation increases. For the low operating reserves cases, the frequency nadirs are close to, but slightly above, the highest under-frequency load-shedding set point. The initial rates of frequency decline are slightly greater and the frequency nadirs are noticeably lower as the level of wind generation increases. The principal findings from the simulation studies of the Texas Interconnection are: For both the high and low reserves cases and for all three levels of wind generation, all frequency nadirs are 2 Eto, J., J. Undrill, P. Mackin, R. Daschmans, B. Williams, B. Haney, R. Hunt, J. Ellis, H. Illian, C. Martinez, M. O’Malley, K. Coughlin, and K. Hamachi-LaCommare. 2010. Use of Frequency Response Metrics to Assess the Planning and Operating Requirements for Reliable Integration of Variable Renewable Generation. LBNL-4142E. Berkeley: Lawrence Berkeley National Laboratory.

Dynamic Simulation Studies of the Frequency Response of the Three U.S. Interconnections with Increased Wind Generation
xii
well above the under-frequency load-shedding set point, which is 59.3 Hz. The initial rates of frequency decline vary in part because of the amount of wind generation, but more so because of the amount and characteristics of the generators governors providing primary frequency control actions. The frequency nadirs are very similar due to the combined effect of the dispatch to increase the effectiveness of generator governors and load shed through the Load acting as a Resource (LaaR) program. No comparable simulation studies were performed of the Eastern Interconnection. An initial simulation of a recent event involving the sudden loss of large amount generation on the Eastern Interconnection was conducted. Following a review of the simulation results, the project sponsor directed the project team to not pursue additional simulations.
Dynamic Simulation Studies of the Frequency Response of the Three U.S. Interconnections with Increased Wind Generation
1
1. Introduction
Utility Systems Efficiencies, Inc. (USE) was tasked by Lawrence Berkeley National Laboratory (LBNL) to conduct dynamic simulation studies of the three U.S. interconnections (Eastern, Western, and Texas). The simulations were prepared in support of LBNL’s project for the Federal Energy Regulatory Commission (FERC) to study frequency-response issues that must be addressed to operate the power system reliably with large amounts of variable renewable generation.3 The objective of the simulation studies of each interconnection was to assess the effects of different amounts of wind generation on frequency behavior of each interconnection following a sudden loss of generation. The scenarios created to study these effects considered an operating circumstance in which system load is at or close to its minimum. The event studied was the sudden loss of the largest amount of generation recorded within each interconnection. The simulations calculated the impact of this event on interconnection frequency for three levels of wind generation. In addition to varying the amount of wind generation, the simulations varied the amount of operating reserves between a high level representative of current operating practices and a low level representative of the minimum required by present operating rules. The studies of each interconnection share the following important features: First, all simulations were conducted using the same commercially available, production-grade simulation tools that are currently used by industry: General Electric (GE) Positive Sequence Load Flow (PSLF) for the Western Interconnection and Siemens Power Technologies International Power System Simulator for Engineering (PSS/E) for the Texas and Eastern Interconnections.4 Second, the project team relied on system models developed and used by the industry to study and establish reliability-based system operating limits. Planners in each interconnection provided the project team with system models representing light-load conditions expected for 2012. Third, the project team took the amount, type, and location of generation (including wind generation) as well as the topology and properties of the transmission system represented in the system models as given. Therefore, no wind (or conventional) generation and no transmission was added to the system models. As discussed in Eto (2010), this places a limit on the amount of wind generation that can be studied in each interconnection.
3 Eto, J., J. Undrill, P. Mackin, R. Daschmans, B. Williams, B. Haney, R. Hunt, J. Ellis, H. Illian, C. Martinez, M. O’Malley, K. Coughlin, and K. Hamachi-LaCommare. 2010. Use of Frequency Response Metrics to Assess the Planning and Operating Requirements for Reliable Integration of Variable Renewable Generation. LBNL-4142E. Berkeley: Lawrence Berkeley National Laboratory. 4 General Electric Positive Sequence Load Flow Software (PSLF). http://www.gepower.com/prod_serv/products/utility_software/en/ge_pslf/index.htm. Siemens Power Technologies International Power System Simulator for Engineering (PSS/E). http://www.energy.siemens.com/hq/en/services/power-transmission-distribution/power-technologies-international/
Dynamic Simulation Studies of the Frequency Response of the Three U.S. Interconnections with Increased Wind Generation
2
Fourth, the loss of generation event studied is based on the largest such event observed in each interconnection. These events are often the same ones that are routinely considered by planners within each interconnection in establishing interregional and system operating limits. Fifth, the project team endeavored to follow accepted modeling practices in conducting the simulations. When the cases were prepared for simulation, generation redispatch and operating reserves levels were established separately for each balancing authority to maintain power flows among balancing authorities at levels established in the interconnections’ system models. In conducting the simulations, the team made minor adjustments to ensure that voltage limits defined for the cases were observed.5 The sections of this report follow the chronological order in which the studies were conducted, starting with the Western Interconnection, followed by the Texas Interconnection, and, finally, the Eastern Interconnection. Each section also follows a consistent structure. First, the interconnection is briefly introduced. Second, the system model provided by interconnection planners for use in the study is described, along with the name and version of the simulation tool used to conduct the studies. Third, the steps taken to modify the system models for use in the simulations are described, including the wind generation and operating reserves scenarios that were studied. Fourth, the results of the simulations are presented along with observations by the project team on the results. The reader is referred to Eto (2010) for additional interpretation and discussion of the simulation results.
5 Since this study is focused on the frequency nadir following the sudden loss of generation, all simulations were conducted for a period of 20 seconds. See Undrill (2010) for a discussion of the impacts of wind generation on power system frequency control over longer time periods, involving both primary and secondary frequency control.
Dynamic Simulation Studies of the Frequency Response of the Three U.S. Interconnections with Increased Wind Generation
3
2. Frequency Response Study of Wind Generation in the Western Interconnection
The Western Interconnection covers nearly 1.8 million square miles and includes the provinces of Alberta and British Columbia in Canada, the northern portion of Baja California in Mexico, and all or portions of the 14 contiguous western U.S. states in between. The Western Electricity Coordinating Council (WECC) is the regional entity responsible for coordinating and promoting bulk electric system reliability in the Western Interconnection.6 2.1 WECC 2012 System Model and the Dynamic Simulation Tool
For our simulation studies of Western Interconnection frequency behavior following the sudden loss of generation with different amounts of wind generation and operating reserve, we obtained a system model developed by WECC and used the principal simulation tool used by planners in WECC. The system model we obtained is known as the WECC 2012-13 Light Winter case. WECC approved it for use on January 7, 2009. The model contains 3,344 generators totaling 258 gigawatts (GW) of installed generating capacity. Wind generation accounts for 9 GW of this generating capacity. For the 2012-13 Light Winter case, 1,593 generators are dispatched to serve 107 GW of load, plus 4 GW in losses. The flows on the California - Oregon Inter-tie (COI) and Pacific DC Inter-tie (PDCI) for this case are from south to north at approximately 2,900 megawatts (MW) and 1,900 MW, respectively. Following the 1996 West Coast blackouts, WECC members devoted considerable effort to updating, validating, and calibrating their dynamic system models. A principal focus was to calibrate the generation plant governor models for primary frequency control action to actual recorded performance and explicit representation of plant secondary control actions that can and do sometimes override primary frequency control actions (Pereira et al 2003). We used the version 17.0_02 of the GE PSLF simulation tool to conduct power flow and dynamic simulation studies using the WECC system model. WECC system planners routinely use this tool to conduct reliability studies of the Western Interconnection (WECC 2009). 2.2 Preparation of the WECC System Model
Preparing the WECC system model for use in our study involved the following four steps: 1) Reduce system load from 110 GW and lower generation in the 2012-13 Light Winter case developed by WECC to 80 GW, which is representative of the minimum load of the interconnection; 2) Specify the generator models to use in simulating the dynamic performance of wind turbines; 3) Identify the generation-loss event and the highest under-frequency load-shedding set point, which establishes the lowest acceptable frequency nadir following the loss of
6 http://www.wecc.biz/About/Pages/default.aspx
Dynamic Simulation Studies of the Frequency Response of the Three U.S. Interconnections with Increased Wind Generation
4
generation; and 4) Develop scenarios with varying amounts of wind generation and operating reserve. 2.2.1 Minimum System Load and Load Composition
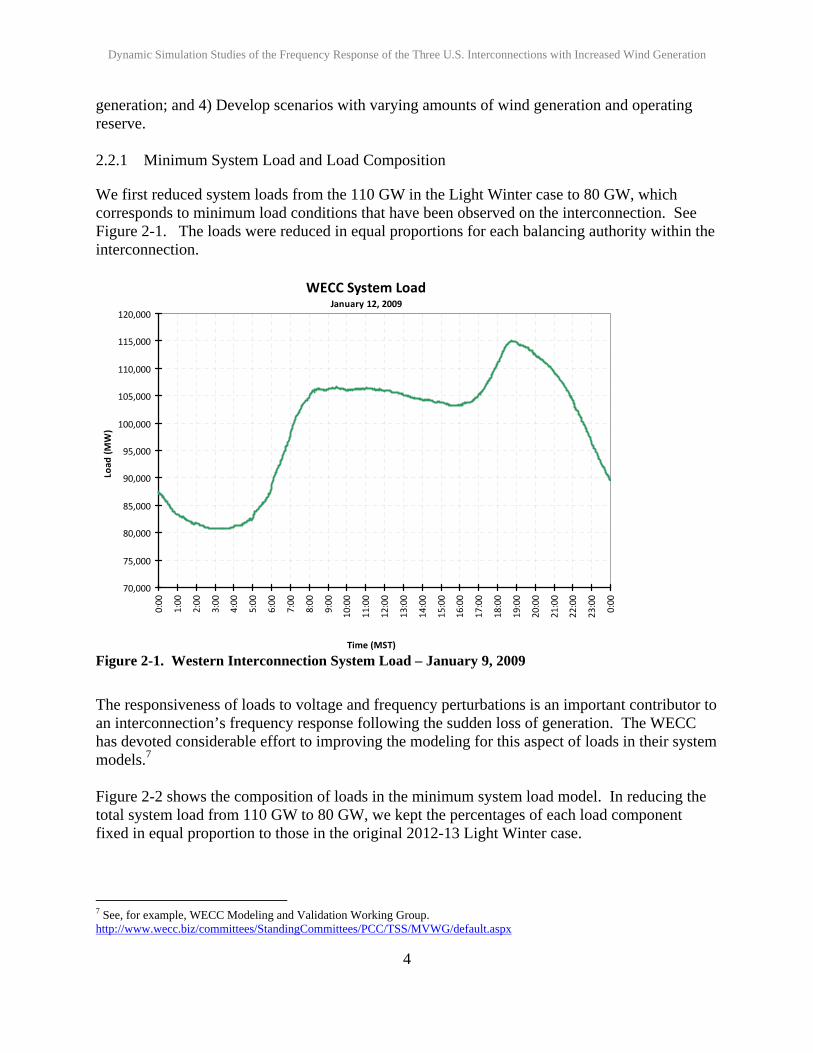
We first reduced system loads from the 110 GW in the Light Winter case to 80 GW, which corresponds to minimum load conditions that have been observed on the interconnection. See Figure 2-1. The loads were reduced in equal proportions for each balancing authority within the interconnection.
WECC System LoadJanuary 12, 2009
70,000
75,000
80,000
85,000
90,000
95,000
100,000
105,000
110,000
115,000
120,000
0:00
1:00
2:00
3:00
4:00
5:00
6:00
7:00
8:00
9:00
10:00
11:00
12:00
13:00
14:00
15:00
16:00
17:00
18:00
19:00
20:00
21:00
22:00
23:00
0:00
Time (MST)
Load
(MW)
Figure 2-1. Western Interconnection System Load – January 9, 2009
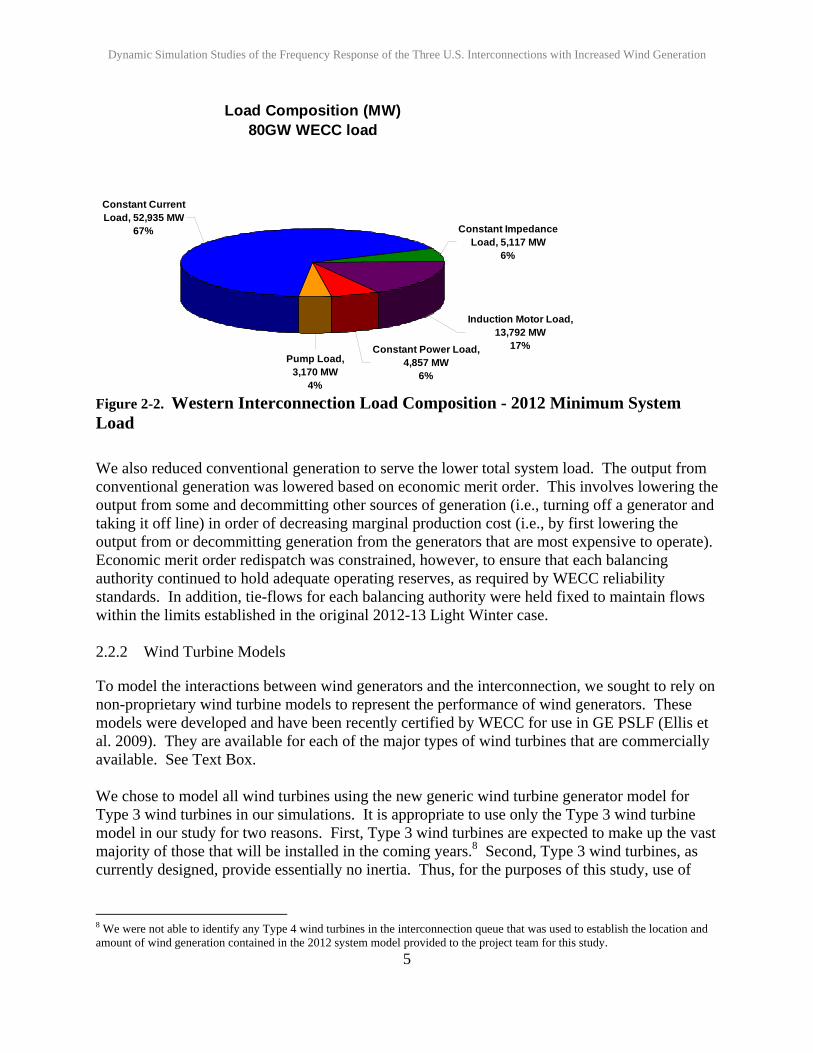
The responsiveness of loads to voltage and frequency perturbations is an important contributor to an interconnection’s frequency response following the sudden loss of generation. The WECC has devoted considerable effort to improving the modeling for this aspect of loads in their system models.7 Figure 2-2 shows the composition of loads in the minimum system load model. In reducing the total system load from 110 GW to 80 GW, we kept the percentages of each load component fixed in equal proportion to those in the original 2012-13 Light Winter case.
7 See, for example, WECC Modeling and Validation Working Group. http://www.wecc.biz/committees/StandingCommittees/PCC/TSS/MVWG/default.aspx
Dynamic Simulation Studies of the Frequency Response of the Three U.S. Interconnections with Increased Wind Generation
5
Load Composition (MW)80GW WECC load
Constant Impedance Load, 5,117 MW
6%
Induction Motor Load, 13,792 MW
17%Constant Power Load, 4,857 MW
6%
Pump Load, 3,170 MW
4%
Constant Current Load, 52,935 MW
67%
Figure 2-2. Western Interconnection Load Composition - 2012 Minimum System Load
We also reduced conventional generation to serve the lower total system load. The output from conventional generation was lowered based on economic merit order. This involves lowering the output from some and decommitting other sources of generation (i.e., turning off a generator and taking it off line) in order of decreasing marginal production cost (i.e., by first lowering the output from or decommitting generation from the generators that are most expensive to operate). Economic merit order redispatch was constrained, however, to ensure that each balancing authority continued to hold adequate operating reserves, as required by WECC reliability standards. In addition, tie-flows for each balancing authority were held fixed to maintain flows within the limits established in the original 2012-13 Light Winter case. 2.2.2 Wind Turbine Models
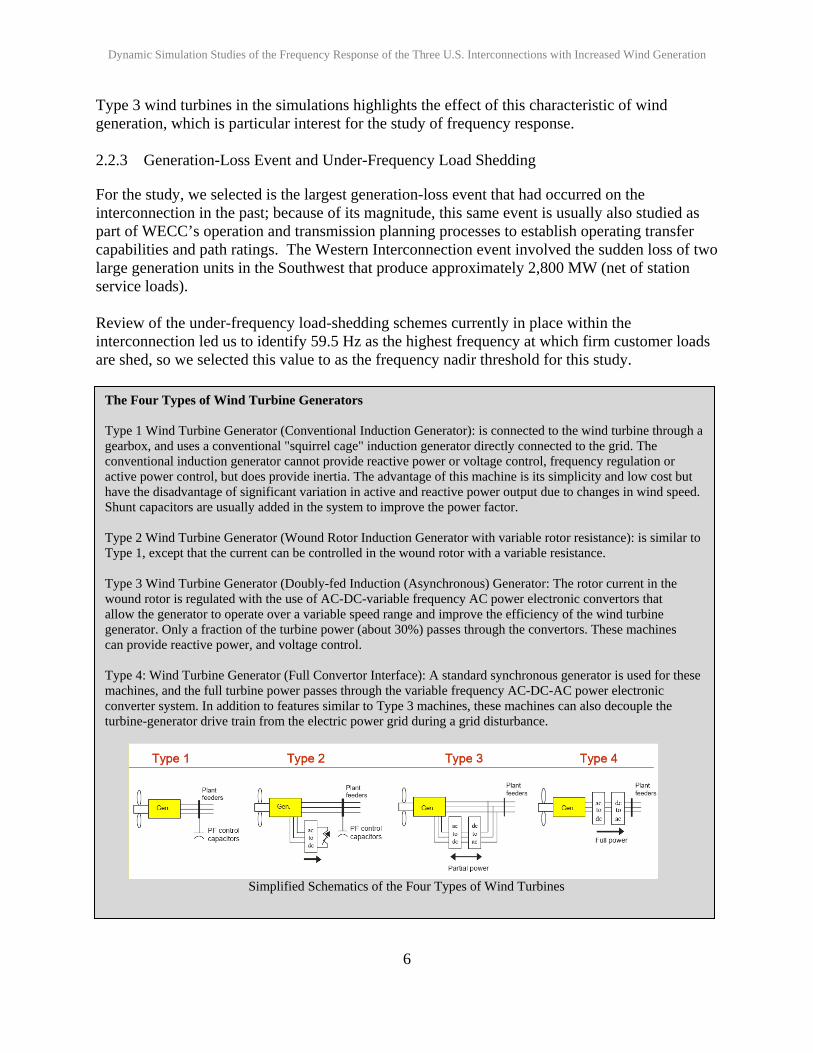
To model the interactions between wind generators and the interconnection, we sought to rely on non-proprietary wind turbine models to represent the performance of wind generators. These models were developed and have been recently certified by WECC for use in GE PSLF (Ellis et al. 2009). They are available for each of the major types of wind turbines that are commercially available. See Text Box. We chose to model all wind turbines using the new generic wind turbine generator model for Type 3 wind turbines in our simulations. It is appropriate to use only the Type 3 wind turbine model in our study for two reasons. First, Type 3 wind turbines are expected to make up the vast majority of those that will be installed in the coming years.8 Second, Type 3 wind turbines, as currently designed, provide essentially no inertia. Thus, for the purposes of this study, use of
8 We were not able to identify any Type 4 wind turbines in the interconnection queue that was used to establish the location and amount of wind generation contained in the 2012 system model provided to the project team for this study.
Dynamic Simulation Studies of the Frequency Response of the Three U.S. Interconnections with Increased Wind Generation
6
Type 3 wind turbines in the simulations highlights the effect of this characteristic of wind generation, which is particular interest for the study of frequency response. 2.2.3 Generation-Loss Event and Under-Frequency Load Shedding
For the study, we selected is the largest generation-loss event that had occurred on the interconnection in the past; because of its magnitude, this same event is usually also studied as part of WECC’s operation and transmission planning processes to establish operating transfer capabilities and path ratings. The Western Interconnection event involved the sudden loss of two large generation units in the Southwest that produce approximately 2,800 MW (net of station service loads). Review of the under-frequency load-shedding schemes currently in place within the interconnection led us to identify 59.5 Hz as the highest frequency at which firm customer loads are shed, so we selected this value to as the frequency nadir threshold for this study.
The Four Types of Wind Turbine Generators Type 1 Wind Turbine Generator (Conventional Induction Generator): is connected to the wind turbine through a gearbox, and uses a conventional "squirrel cage" induction generator directly connected to the grid. The conventional induction generator cannot provide reactive power or voltage control, frequency regulation or active power control, but does provide inertia. The advantage of this machine is its simplicity and low cost but have the disadvantage of significant variation in active and reactive power output due to changes in wind speed. Shunt capacitors are usually added in the system to improve the power factor. Type 2 Wind Turbine Generator (Wound Rotor Induction Generator with variable rotor resistance): is similar to Type 1, except that the current can be controlled in the wound rotor with a variable resistance. Type 3 Wind Turbine Generator (Doubly-fed Induction (Asynchronous) Generator: The rotor current in the wound rotor is regulated with the use of AC-DC-variable frequency AC power electronic convertors that allow the generator to operate over a variable speed range and improve the efficiency of the wind turbine generator. Only a fraction of the turbine power (about 30%) passes through the convertors. These machines can provide reactive power, and voltage control. Type 4: Wind Turbine Generator (Full Convertor Interface): A standard synchronous generator is used for these machines, and the full turbine power passes through the variable frequency AC-DC-AC power electronic converter system. In addition to features similar to Type 3 machines, these machines can also decouple the turbine-generator drive train from the electric power grid during a grid disturbance.
Simplified Schematics of the Four Types of Wind Turbines
Dynamic Simulation Studies of the Frequency Response of the Three U.S. Interconnections with Increased Wind Generation
7
WECC’s under-frequency load-shedding procedures have evolved over the years and are documented in the WECC’s Coordinated Off-Nominal Frequency Load Shedding and Restoration Plan (WECC 1997). The loads that are shed include pumped storage (when the facility is drawing power to pump), large pumps associated with water conveyance, and interruptible loads and selected firm loads. 2.2.4 Wind Generation and Operating Reserve Scenarios
The wind generation scenarios were developed by adjusting the amount of wind generation produced at the locations that are already represented in the 2012-13 Light Winter case. As mentioned, this case contains 9 GW of wind generation capacity located at sites primarily in the western-most states of the interconnection. We examined three wind generation scenarios: 1 GW, 4 GW, and 9 GW. The 1GW and 4 GW wind generation scenarios were modeled by adjusting the output at each wind generation location downward in equal proportion from the original 9 GW. As the amount of wind generation is decreased, generation from non-wind sources is redispatched upward (to meet load) following the same economic-merit-order procedure described previously. The upward dispatch was conducted separately for each balancing authority area. The objective, as above, was to ensure essentially no change in the amount of power transferred among the balancing authorities within the interconnection (and thereby to respect the limits on transmission flows represented in the original 2012-13 Light Winter system model). As a result, there is no change in dispatch within the balancing authorities that do not contain wind generation. We examined two approaches for managing system operating reserves during minimum system load conditions. The two approaches result in different quantities of primary frequency control reserves. At one extreme, we modified typical WECC operating practices (that are also followed in other interconnections), by minimizing the amount of generation that is decommitted at night. Many generating units are not shut down and then restarted on a daily basis for economic reasons. Instead, they are kept running and are on line at night but are dispatched at very low levels of output. This practice assures that they are available to ramp up the following day to meet mid-day loads. We call these cases “High Reserves.” In the High Reserves cases, approximately 22 GW of generation capacity is kept on line in excess of 80 GW of the generation capacity required to meet load. At the other extreme, we examined the effect of holding operating reserves based on a close interpretation of current WECC standards regarding the minimum operating reserves that must carried by balancing authorities within the interconnection. WECC’s operating reserve standards require that balancing authorities generally hold synchronized generation capacity on line equal to approximately 4.5 percent of load at all times (WECC 2008). Implementing this standard in the simulation study involved decommitting some generation units and increasing the output from other generation units (from the units in the High Reserves case). As before, we followed a procedure based on economic merit order, and this procedure was implemented separately for
Dynamic Simulation Studies of the Frequency Response of the Three U.S. Interconnections with Increased Wind Generation
8
each balancing authority to hold tie-flows among balancing authorities constant. We call these cases “Low Reserves.” In the Low Reserves cases, approximately 6 GW of generation capacity is kept on line in excess of 80 GW of the generation capacity required to meet load. Six GW represents more reserve generation capacity than would result from multiplying 80 GW times 4.5 percent, which is only 4 GW. The difference is a result of our efforts to follow subtleties in WECC’s standard exactly as they are written in the standard. WECC’s standard is expressed in terms of the percentages that vary based on the type of generation used to provide operating reserves. In some cases, when these percentages cannot be met, the standard requires establishing reserves based on a second consideration: the single largest contingency. Systematically applying these criteria at minimum system load levels leads to slightly more reserve generation capacity than would be implied by multiplying a simple percentage by the minimum system load of 80 GW because in many cases the single largest contingency is the prevailing criterion.9 2.3 Presentation of Simulation Results
Figure 2-3 presents simulation results for the three levels of wind generation (1 GW, 4 GW, and 9 GW) for the High Reserves case on the Western Interconnection. Each case shows the evolution of system frequency over the first 19 seconds following the sudden loss of 2,800 MW of generation from two large generating plants in the southwestern portion of the interconnection. The first point to note is that the frequency nadir remains well above the under-frequency load-shedding set point for all three levels of wind generation. The second point to note is that the initial rate of frequency decline is virtually identical for all three levels of wind generation. The third point to note is that the frequency nadirs, though nearly identical, are very slightly and progressively lower as the level of wind generation increases.
9 The exact procedure was implemented as follows: The goal of the generation adjustments was to achieve approximately 4.5 percent of spinning reserves, which consists of one half of 5 percent hydro and 7 percent thermal generation plus a small percentage for regulation. As generation is decommitted following economic merit order for each balancing authority, some balancing authorities switch from using this criterion (one half of 5 percent hydro and 7 percent thermal) to using a secondary criterion based on the single largest contingency. In addition, some units remain committed within a balancing authority, so it can meet or exceed the Minimum Operating Reserve Standard. These factors lead to a WECC-wide level of reserves that is slightly more than 4.5 percent.

Dynamic Simulation Studies of the Frequency Response of the Three U.S. Interconnections with Increased Wind Generation
9
System Frequency Response at N. Cal Bus
59.50
59.55
59.60
59.65
59.70
59.75
59.80
59.85
59.90
59.95
60.00
60.05
0 1 2 3 4 5 6 7 8 9 10 11 12 13 14 15 16 17 18 19 20
Time (Seconds)
Fre
qu
enc
y (H
z)
High Reserves, 1 GW Wind
High Reserves, 4 GW Wind
High Reserves, 9 GW Wind
Figure 2-3. Simulated Western Interconnection System Frequency Behavior Over the First 19 Seconds Following the Sudden Loss of the 2,800 MW of Generation for the High Reserves Case
Figure 2-4 presents simulation results for the three levels of wind generation (1 GW, 4 GW, and 9 GW) for the Low Reserves case. The format of presentation is identical to that in Figure 2-3.
59.50
59.55
59.60
59.65
59.70
59.75
59.80
59.85
59.90
59.95
60.00
60.05
0 1 2 3 4 5 6 7 8 9 10 11 12 13 14 15 16 17 18 19 20
Time (Seconds)
Fre
qu
en
cy
(H
z)
Low Reserves, 1 GW Wind
Low Reserves, 4 GW Wind
Low Reserves, 9 GW Wind
Figure 2-4. Simulated Western Interconnection System Frequency Behavior Over the First 19 Seconds Following the Sudden Loss of the 2,800 MW Generation for the Low Reserves Cases
Dynamic Simulation Studies of the Frequency Response of the Three U.S. Interconnections with Increased Wind Generation
10
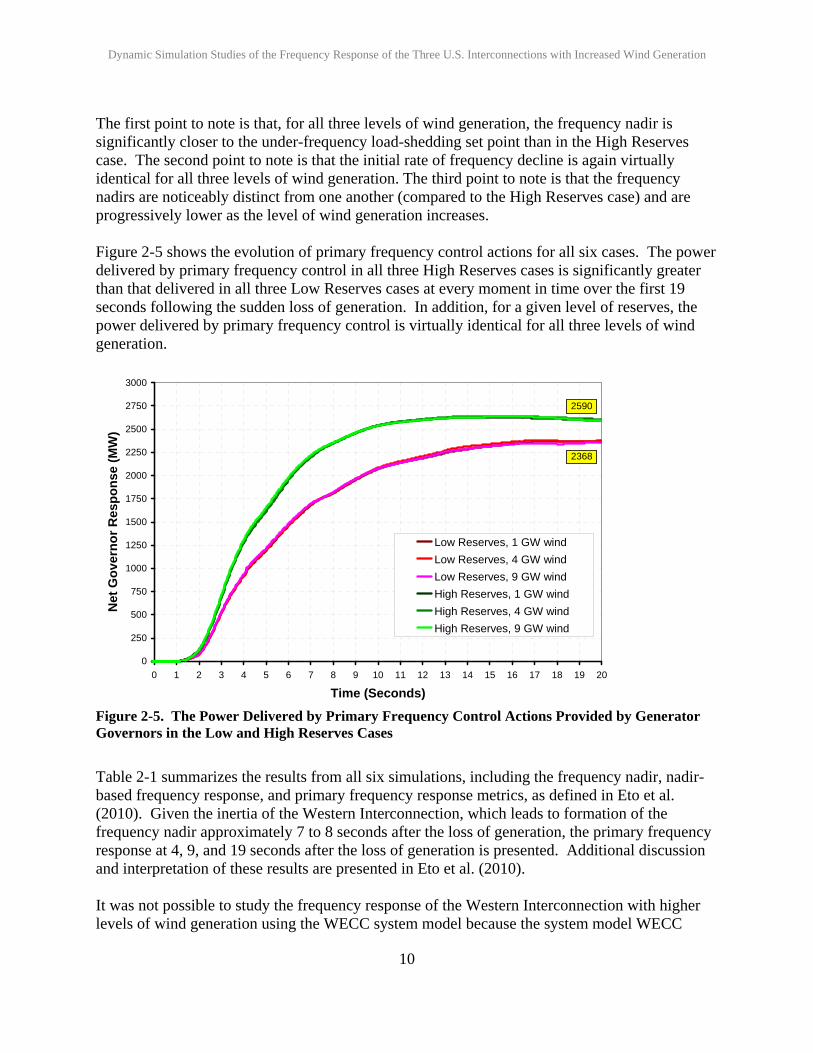
The first point to note is that, for all three levels of wind generation, the frequency nadir is significantly closer to the under-frequency load-shedding set point than in the High Reserves case. The second point to note is that the initial rate of frequency decline is again virtually identical for all three levels of wind generation. The third point to note is that the frequency nadirs are noticeably distinct from one another (compared to the High Reserves case) and are progressively lower as the level of wind generation increases. Figure 2-5 shows the evolution of primary frequency control actions for all six cases. The power delivered by primary frequency control in all three High Reserves cases is significantly greater than that delivered in all three Low Reserves cases at every moment in time over the first 19 seconds following the sudden loss of generation. In addition, for a given level of reserves, the power delivered by primary frequency control is virtually identical for all three levels of wind generation.
0
250
500
750
1000
1250
1500
1750
2000
2250
2500
2750
3000
0 1 2 3 4 5 6 7 8 9 10 11 12 13 14 15 16 17 18 19 20
Time (Seconds)
Net
Go
vern
or
Res
po
nse
(M
W)
Low Reserves, 1 GW wind
Low Reserves, 4 GW wind
Low Reserves, 9 GW wind
High Reserves, 1 GW wind
High Reserves, 4 GW wind
High Reserves, 9 GW wind
2590
2368
Figure 2-5. The Power Delivered by Primary Frequency Control Actions Provided by Generator Governors in the Low and High Reserves Cases
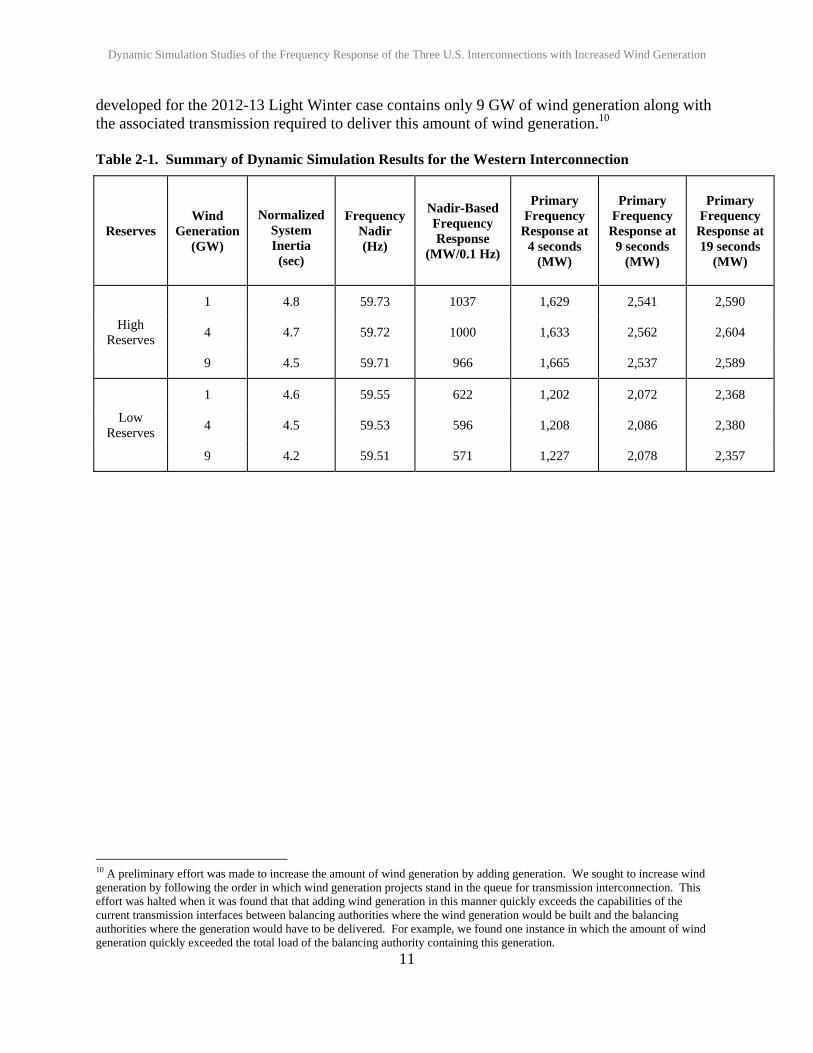
Table 2-1 summarizes the results from all six simulations, including the frequency nadir, nadir-based frequency response, and primary frequency response metrics, as defined in Eto et al. (2010). Given the inertia of the Western Interconnection, which leads to formation of the frequency nadir approximately 7 to 8 seconds after the loss of generation, the primary frequency response at 4, 9, and 19 seconds after the loss of generation is presented. Additional discussion and interpretation of these results are presented in Eto et al. (2010). It was not possible to study the frequency response of the Western Interconnection with higher levels of wind generation using the WECC system model because the system model WECC
Dynamic Simulation Studies of the Frequency Response of the Three U.S. Interconnections with Increased Wind Generation
11
developed for the 2012-13 Light Winter case contains only 9 GW of wind generation along with the associated transmission required to deliver this amount of wind generation.10 Table 2-1. Summary of Dynamic Simulation Results for the Western Interconnection
Reserves Wind
Generation (GW)
Normalized System Inertia
(sec)
Frequency Nadir (Hz)
Nadir-Based Frequency Response
(MW/0.1 Hz)
Primary Frequency
Response at 4 seconds
(MW)
Primary Frequency
Response at 9 seconds
(MW)
Primary Frequency
Response at 19 seconds
(MW)
High Reserves
1 4.8 59.73 1037 1,629 2,541 2,590
4 4.7 59.72 1000 1,633 2,562 2,604
9 4.5 59.71 966 1,665 2,537 2,589
Low Reserves
1 4.6 59.55 622 1,202 2,072 2,368
4 4.5 59.53 596 1,208 2,086 2,380
9 4.2 59.51 571 1,227 2,078 2,357
10 A preliminary effort was made to increase the amount of wind generation by adding generation. We sought to increase wind generation by following the order in which wind generation projects stand in the queue for transmission interconnection. This effort was halted when it was found that that adding wind generation in this manner quickly exceeds the capabilities of the current transmission interfaces between balancing authorities where the wind generation would be built and the balancing authorities where the generation would have to be delivered. For example, we found one instance in which the amount of wind generation quickly exceeded the total load of the balancing authority containing this generation.

Dynamic Simulation Studies of the Frequency Response of the Three U.S. Interconnections with Increased Wind Generation
13
3. Frequency Response Study of Wind Generation in the Texas Interconnection
The Electricity Reliability Council of Texas (ERCOT) is the independent system operator for the Texas Interconnection, which contains 40,000 miles of transmission lines and more than 550 generation units.11 Currently, the Texas Interconnection provides electricity to 22 million Texas customers, representing 85 percent of the state's electrical load and 75 percent of Texas’ land area. The interconnection is asynchronous with the Western and Eastern Interconnections; thus, it is an independent interconnection. 3.1 ERCOT 2012 System Model and the Dynamic Simulation Tool
For our simulation studies of frequency behavior of the Texas Interconnection following the sudden loss of generation with different amounts of wind generation and operating reserves, we obtained a system model developed by ERCOT and used the principal dynamic simulation tool used by planners in ERCOT. The system model we obtained is known as the ERCOT 2012 Summer Off-peak Base Case, which was developed by ERCOT for the study titled “Analysis of Transmission Alternatives for Competitive Renewable Energy Zones in Texas.”12 The model contains 735 generators totaling 116 GW of installed generating capacity. Wind generation accounts for 14.4 GW of this generating capacity. For the 2012 Summer Off-peak Base Case, 316 generators are dispatched to serve 33 GW of load, plus 1.1 GW in losses. Like their counterparts in the Western Interconnection, Texas Interconnection planners have extensively calibrated their system models to ensure accuracy (ERCOT 2005). It is important recognize that the 2012 Summer Off-peak Base Case assumes completion of the transmission projects that have been planned for Competitive Renewable Energy Zones ERCOT 2006). If these projects are not completed by 2012, it would not be possible to accommodate all 14.4 GW of wind generation that is represented in the 2012 Summer Off-peak Base Case. We used the Siemens-PTI’s PSS/E simulation tool to conduct power flow and dynamic simulation studies with the Texas Interconnection system model. ERCOT system planners routinely use this tool for reliability studies of the Texas Interconnection. We used version 30.3.2 of the tool. 3.2 Preparation of the Texas Interconnection System Model
Preparing the Texas Interconnection system model for our study involved the following four steps: 1) Reduce system load from 34 GW in the light-load system model developed by ERCOT to 26 GW, which represents the minimum load of the interconnection; 2) Specify the generator models to use in simulating the dynamic performance of new wind turbines; 3) Identify the
11 http://www.ercot.com/about/ 12 http://www.ercot.com/news/presentations/2007/index
Dynamic Simulation Studies of the Frequency Response of the Three U.S. Interconnections with Increased Wind Generation
14
generation-loss event and the highest under-frequency load-shedding set point, which establishes the lowest acceptable frequency nadir following the sudden loss of generation; and 4) Develop scenarios with varying amounts of wind generation and operating reserves. 3.2.1 Minimum System Load and Load Composition
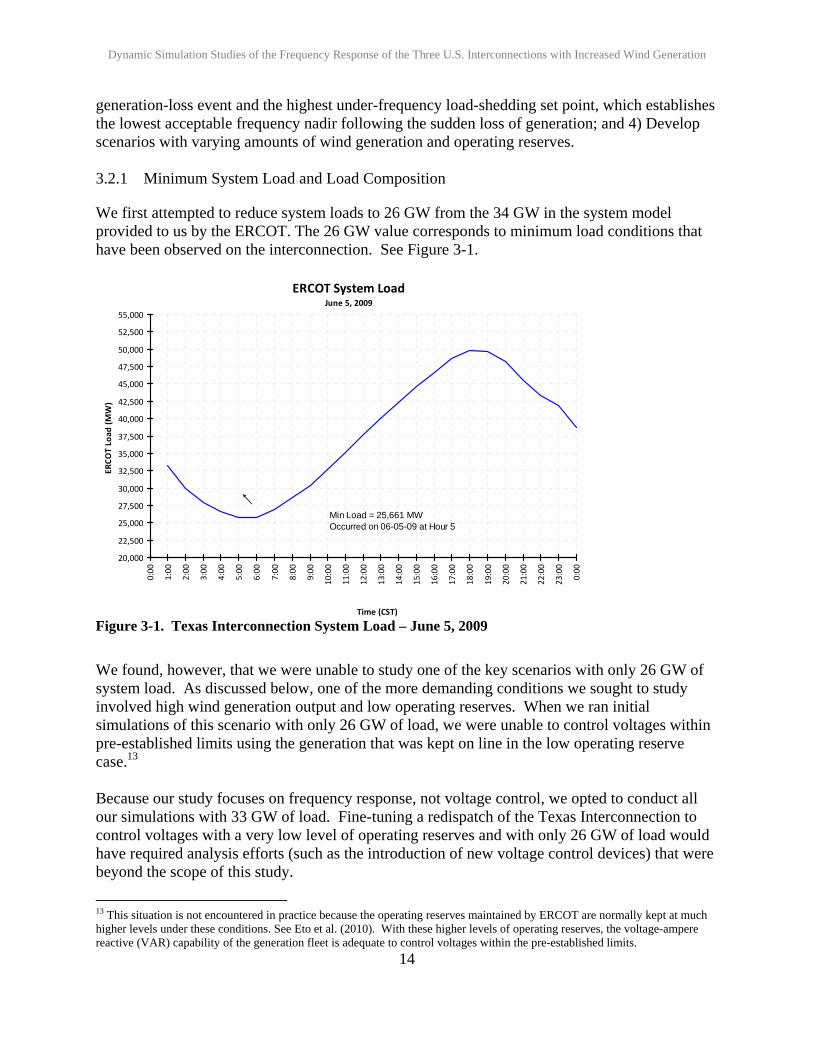
We first attempted to reduce system loads to 26 GW from the 34 GW in the system model provided to us by the ERCOT. The 26 GW value corresponds to minimum load conditions that have been observed on the interconnection. See Figure 3-1.
ERCOT System Load June 5, 2009
20,000
22,500
25,000
27,500
30,000
32,500
35,000
37,500
40,000
42,500
45,000
47,500
50,000
52,500
55,000
0:00
1:00
2:00
3:00
4:00
5:00
6:00
7:00
8:00
9:00
10:00
11:00
12:00
13:00
14:00
15:00
16:00
17:00
18:00
19:00
20:00
21:00
22:00
23:00
0:00
Time (CST)
ERCOT Load
(MW)
Min Load = 25,661 MWOccurred on 06-05-09 at Hour 5
Figure 3-1. Texas Interconnection System Load – June 5, 2009
We found, however, that we were unable to study one of the key scenarios with only 26 GW of system load. As discussed below, one of the more demanding conditions we sought to study involved high wind generation output and low operating reserves. When we ran initial simulations of this scenario with only 26 GW of load, we were unable to control voltages within pre-established limits using the generation that was kept on line in the low operating reserve case.13 Because our study focuses on frequency response, not voltage control, we opted to conduct all our simulations with 33 GW of load. Fine-tuning a redispatch of the Texas Interconnection to control voltages with a very low level of operating reserves and with only 26 GW of load would have required analysis efforts (such as the introduction of new voltage control devices) that were beyond the scope of this study.
13 This situation is not encountered in practice because the operating reserves maintained by ERCOT are normally kept at much higher levels under these conditions. See Eto et al. (2010). With these higher levels of operating reserves, the voltage-ampere reactive (VAR) capability of the generation fleet is adequate to control voltages within the pre-established limits.
Dynamic Simulation Studies of the Frequency Response of the Three U.S. Interconnections with Increased Wind Generation
15
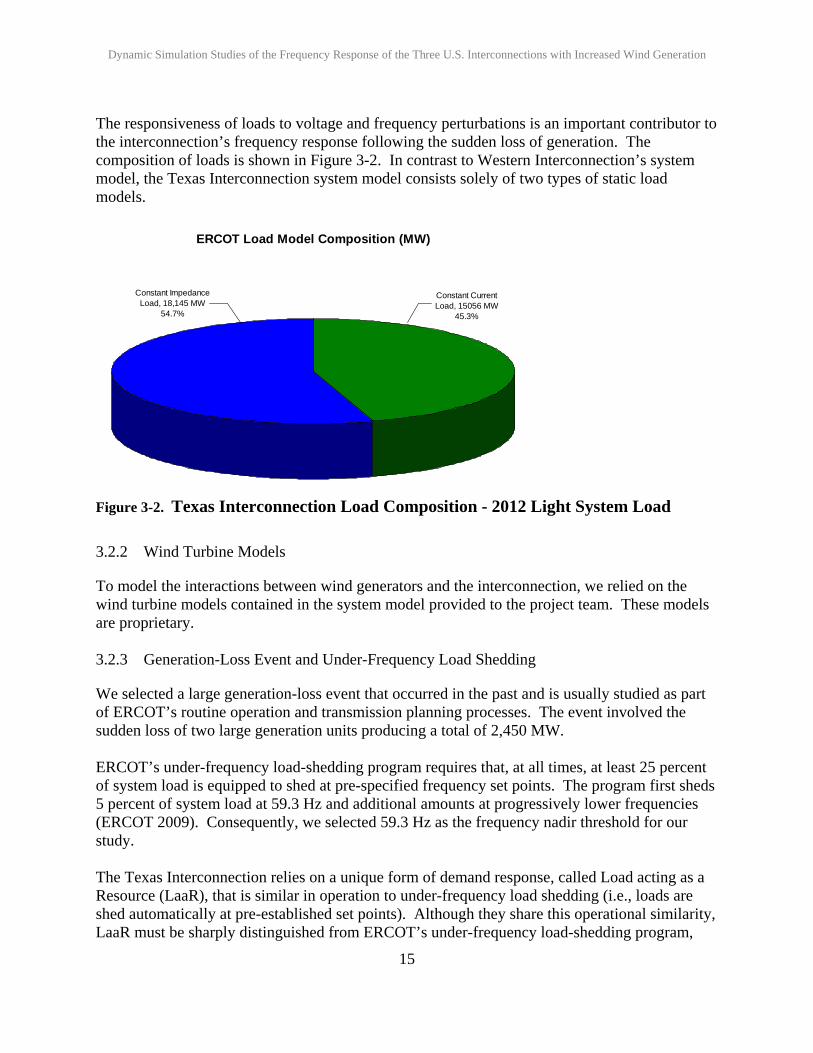
The responsiveness of loads to voltage and frequency perturbations is an important contributor to the interconnection’s frequency response following the sudden loss of generation. The composition of loads is shown in Figure 3-2. In contrast to Western Interconnection’s system model, the Texas Interconnection system model consists solely of two types of static load models.
ERCOT Load Model Composition (MW)
Constant Impedance Load, 18,145 MW
54.7%
Constant Current Load, 15056 MW
45.3%
Figure 3-2. Texas Interconnection Load Composition - 2012 Light System Load
3.2.2 Wind Turbine Models
To model the interactions between wind generators and the interconnection, we relied on the wind turbine models contained in the system model provided to the project team. These models are proprietary. 3.2.3 Generation-Loss Event and Under-Frequency Load Shedding
We selected a large generation-loss event that occurred in the past and is usually studied as part of ERCOT’s routine operation and transmission planning processes. The event involved the sudden loss of two large generation units producing a total of 2,450 MW. ERCOT’s under-frequency load-shedding program requires that, at all times, at least 25 percent of system load is equipped to shed at pre-specified frequency set points. The program first sheds 5 percent of system load at 59.3 Hz and additional amounts at progressively lower frequencies (ERCOT 2009). Consequently, we selected 59.3 Hz as the frequency nadir threshold for our study. The Texas Interconnection relies on a unique form of demand response, called Load acting as a Resource (LaaR), that is similar in operation to under-frequency load shedding (i.e., loads are shed automatically at pre-established set points). Although they share this operational similarity, LaaR must be sharply distinguished from ERCOT’s under-frequency load-shedding program,
Dynamic Simulation Studies of the Frequency Response of the Three U.S. Interconnections with Increased Wind Generation
16
which uses lower set points. The LaaR program is discussed in detail below when we describe the composition of operating reserves. 3.2.4 Wind Generation and Operating Reserve Scenarios
Wind generation scenarios were developed by adjusting the amount of wind generation produced at the locations that are already represented in the 2012 Summer Off-peak Base Case. As mentioned, this system model contains 14.4 GW of wind generation capacity located at sites primarily in the western half of the state. We examined three wind generation scenarios: 0 GW, 7.2 GW, and 14.4 GW. The 7.2 GW wind generation scenarios were modeled by adjusting the output at each wind generation location downward in equal proportion from the original 14.4 GW. As the amount of wind generation increased, generation from non-wind sources was re-dispatched downward. We did not follow a strict economic merit order procedure for the redispatch, as we did for the Western Interconnection. To focus on the role of primary frequency control provided by generator governors, we decommitted and redispatched generators based both on economic merit order and on the speed of their governors. We sought both to keep the generators with the fastest governor response on line and to dispatch these generators below their maximum output. As in our study of the Western Interconnection, we examined two approaches for managing system operating reserves during load system load conditions. The two approaches directly affect the amount of primary frequency control reserves. At one extreme, we examined a policy that mimics current operating practices, in which, at times of light load, operating reserves are kept on line in excess of the amounts required by the Texas Interconnection’s standards for responsive reserves.14 This case is called High Reserves to distinguish it from the Low Reserves case. For the Low Reserves case, we examined a close, but not exact, interpretation of current ERCOT standards regarding the minimum amount of responsive reserve that must kept on line by the interconnection at all times. ERCOT’s responsive reserve standards require that synchronized generation capacity (and frequency-responsive demand) equal to 2,300 MW must be held at all times (ERCOT 2009). The interconnection permits up to 1,150 MW of this requirement to be supplied by customers who are compensated to allow their load to be curtailed automatically at predetermined frequency set points. This is the LaaR program mentioned previously. The frequency set point for the LaaR program is 59.7 Hz. As noted, this set point is considerably higher than those of the interconnection’s under-frequency load-shedding program. The customers and generators that provide responsive reserves to the interconnection are selected through a competitive market process, and both are paid the same amount. The interconnection routinely acquires the maximum amount of responsive reserves permitted by its standards through the LaaR program.
14 “Responsive reserves” is the term used that the Texas Interconnection uses to refer to the class of contingency reserves that is called “spinning reserves” in Eto et al. (2010).
Dynamic Simulation Studies of the Frequency Response of the Three U.S. Interconnections with Increased Wind Generation
17
For the High Reserves cases, we mimicked a typical operating practice within the Texas Interconnection (and other interconnections), which minimizes the amount of generation that is decommitted at night. As noted previously for the Western Interconnection, many generating units are not shut down and restarted on a daily basis for economic reasons. In the High Reserves cases for the Texas Interconnection, more than 8 GW of generation capacity is kept on line. For the Low Reserves cases, we decommitted some generation units (i.e., took them off line) and increased the output from other generation units. As discussed above, we did not follow a strict economic merit order procedure; we also sought to decommit generators with slower governor response and dispatch generators with faster governor response below their maximum output. In the Low Reserves cases, 3 GW of generation capacity is kept on line (in addition to 1,150 MW of LaaR) in excess of the 33 GW of generation capacity that is required to meet load. 3.3 Presentation of Simulation Results
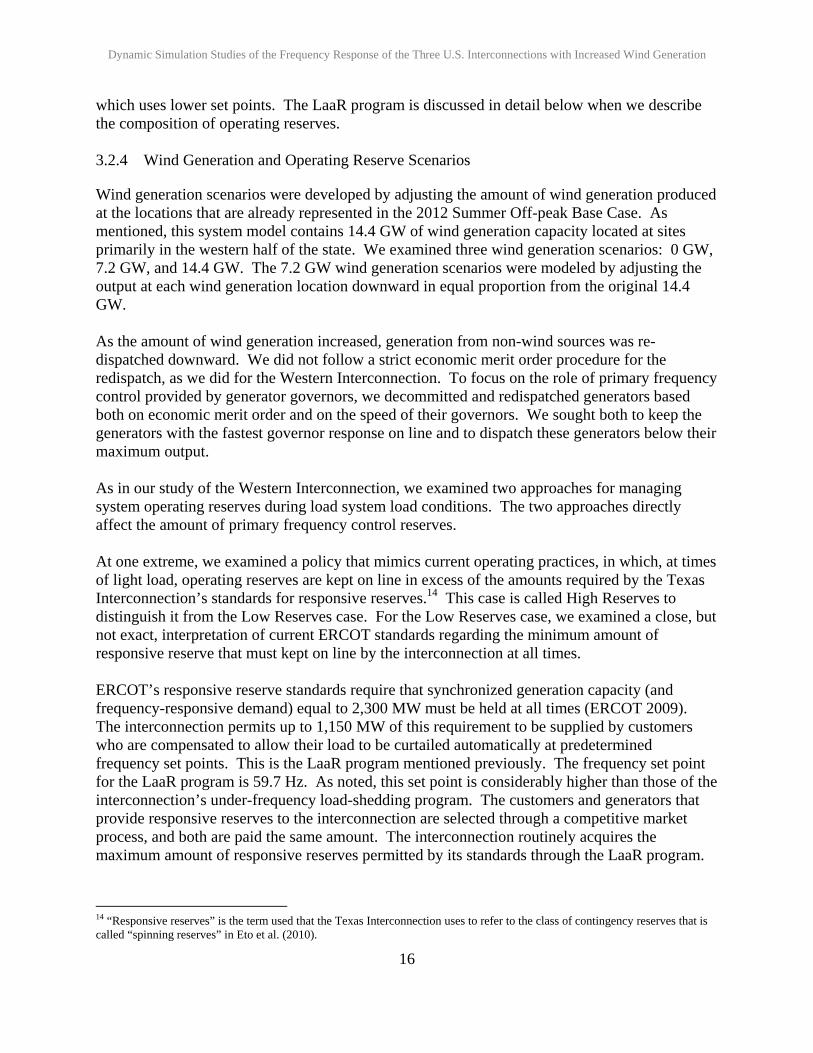
Figure 3-3 presents the simulation results for the three levels of wind generation (0 GW, 7.2 GW, and 14.4 GW) for both the High and Low Reserves case.
59.60
59.65
59.70
59.75
59.80
59.85
59.90
59.95
60.00
60.05
0 1 2 3 4 5 6 7 8 9 10 11 12 13 14 15 16 17 18 19 20
Time (Seconds)
Fre
qu
ency
(H
z)
Low Reserves, 0 GW wind generationLow Reserves, 7 GW wind generationLow Reserves, 14 GW wind generationHigh Reserves, 0 GW wind generationHigh Reserves, 7 GW wind generationHigh Reserves, 14 GW wind generation
Figure 3-3. Simulated Texas Interconnection System Frequency Behavior Over the First 19 Seconds Following the Sudden Loss of the 2,450 MW of Generation for the High and Low Reserves Cases
For all three levels of wind generation, under both the High and Low Reserves cases, frequency is arrested well above the under-frequency load-shed threshold (59.3 Hz). As discussed in Eto et al. (2010), frequency declines at a much more rapid rate in the Texas Interconnection than it does in the other two interconnections because the amount of generation lost is larger in proportion to the size of the interconnection. Consequently, in contrast to the
Dynamic Simulation Studies of the Frequency Response of the Three U.S. Interconnections with Increased Wind Generation
18
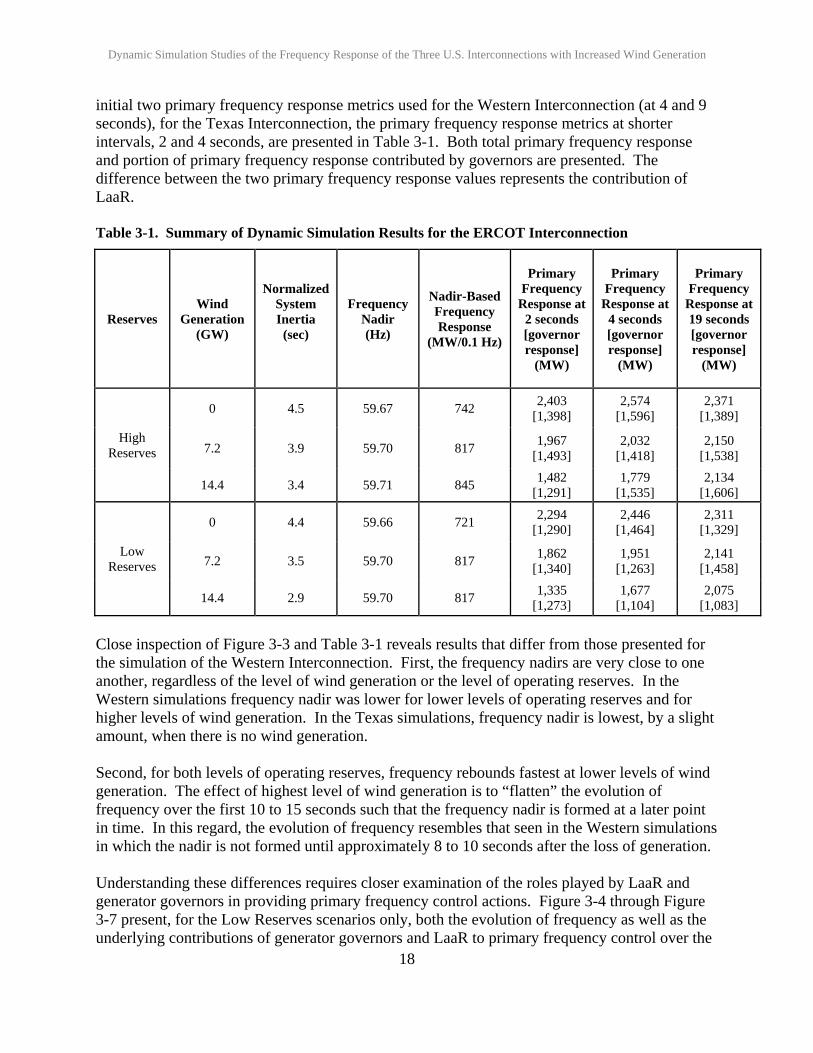
initial two primary frequency response metrics used for the Western Interconnection (at 4 and 9 seconds), for the Texas Interconnection, the primary frequency response metrics at shorter intervals, 2 and 4 seconds, are presented in Table 3-1. Both total primary frequency response and portion of primary frequency response contributed by governors are presented. The difference between the two primary frequency response values represents the contribution of LaaR. Table 3-1. Summary of Dynamic Simulation Results for the ERCOT Interconnection
Reserves Wind
Generation (GW)
Normalized System Inertia
(sec)
Frequency Nadir (Hz)
Nadir-Based Frequency Response
(MW/0.1 Hz)
Primary Frequency
Response at 2 seconds [governor response]
(MW)
Primary Frequency
Response at 4 seconds [governor response]
(MW)
Primary Frequency
Response at 19 seconds [governor response]
(MW)
High Reserves
0 4.5 59.67 742 2,403
[1,398] 2,574
[1,596] 2,371
[1,389]
7.2 3.9 59.70 817 1,967
[1,493] 2,032
[1,418] 2,150
[1,538]
14.4 3.4 59.71 845 1,482
[1,291] 1,779
[1,535] 2,134
[1,606]
Low Reserves
0 4.4 59.66 721 2,294
[1,290] 2,446
[1,464] 2,311
[1,329]
7.2 3.5 59.70 817 1,862
[1,340] 1,951
[1,263] 2,141
[1,458]
14.4 2.9 59.70 817 1,335
[1,273] 1,677
[1,104] 2,075
[1,083]
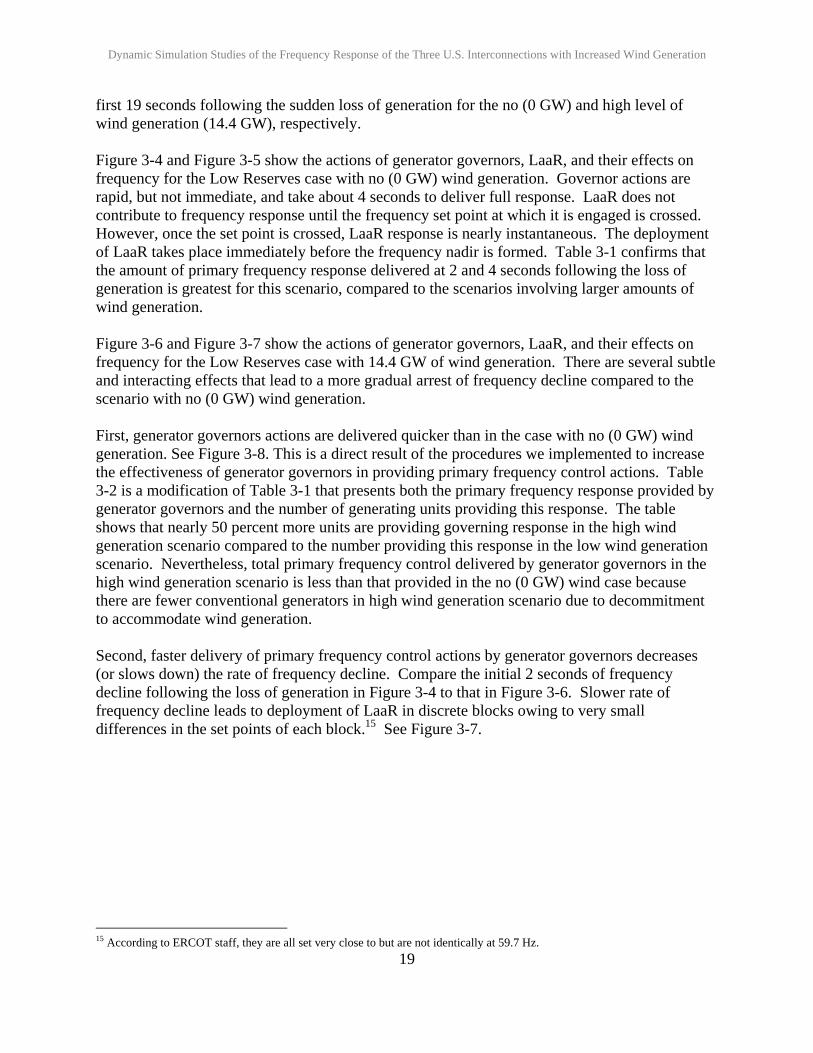
Close inspection of Figure 3-3 and Table 3-1 reveals results that differ from those presented for the simulation of the Western Interconnection. First, the frequency nadirs are very close to one another, regardless of the level of wind generation or the level of operating reserves. In the Western simulations frequency nadir was lower for lower levels of operating reserves and for higher levels of wind generation. In the Texas simulations, frequency nadir is lowest, by a slight amount, when there is no wind generation. Second, for both levels of operating reserves, frequency rebounds fastest at lower levels of wind generation. The effect of highest level of wind generation is to “flatten” the evolution of frequency over the first 10 to 15 seconds such that the frequency nadir is formed at a later point in time. In this regard, the evolution of frequency resembles that seen in the Western simulations in which the nadir is not formed until approximately 8 to 10 seconds after the loss of generation. Understanding these differences requires closer examination of the roles played by LaaR and generator governors in providing primary frequency control actions. Figure 3-4 through Figure 3-7 present, for the Low Reserves scenarios only, both the evolution of frequency as well as the underlying contributions of generator governors and LaaR to primary frequency control over the
Dynamic Simulation Studies of the Frequency Response of the Three U.S. Interconnections with Increased Wind Generation
19
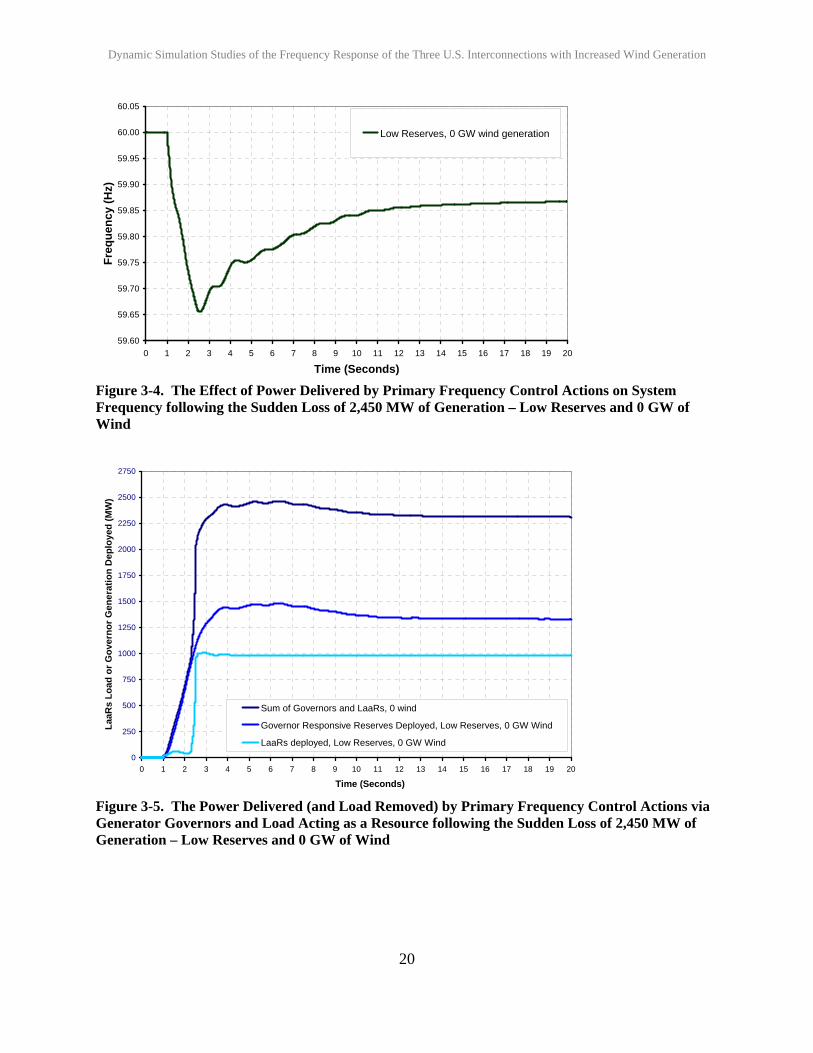
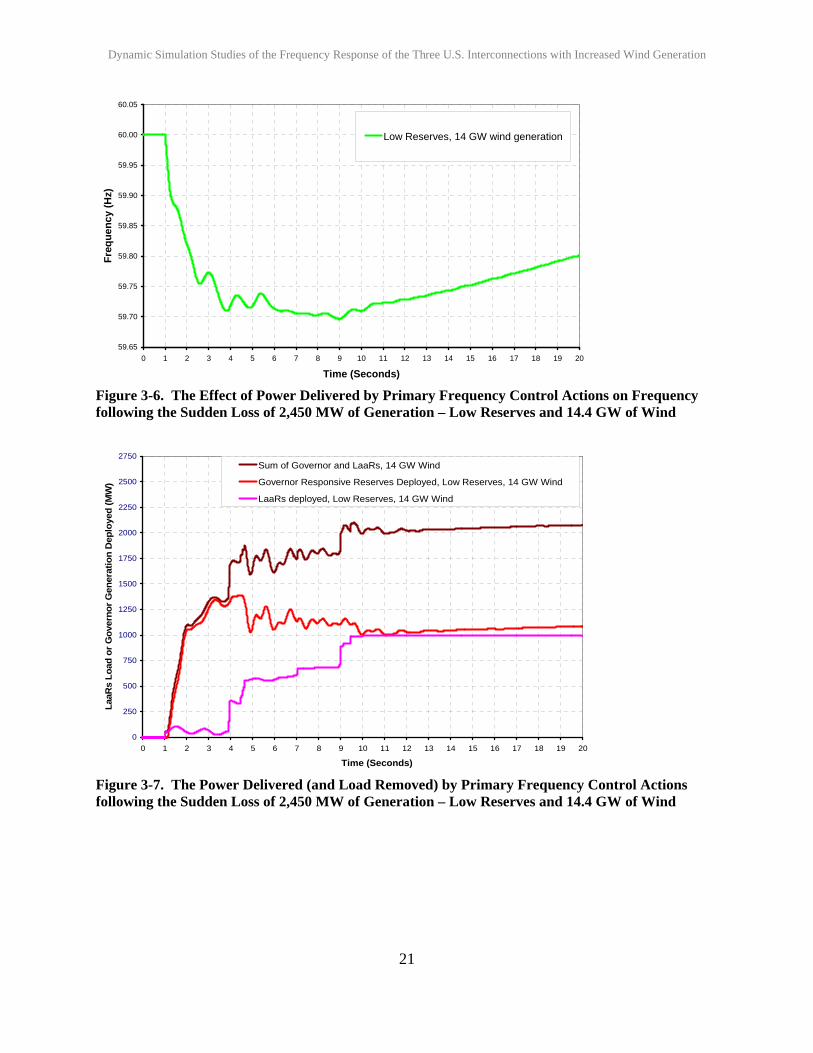
first 19 seconds following the sudden loss of generation for the no (0 GW) and high level of wind generation (14.4 GW), respectively. Figure 3-4 and Figure 3-5 show the actions of generator governors, LaaR, and their effects on frequency for the Low Reserves case with no (0 GW) wind generation. Governor actions are rapid, but not immediate, and take about 4 seconds to deliver full response. LaaR does not contribute to frequency response until the frequency set point at which it is engaged is crossed. However, once the set point is crossed, LaaR response is nearly instantaneous. The deployment of LaaR takes place immediately before the frequency nadir is formed. Table 3-1 confirms that the amount of primary frequency response delivered at 2 and 4 seconds following the loss of generation is greatest for this scenario, compared to the scenarios involving larger amounts of wind generation. Figure 3-6 and Figure 3-7 show the actions of generator governors, LaaR, and their effects on frequency for the Low Reserves case with 14.4 GW of wind generation. There are several subtle and interacting effects that lead to a more gradual arrest of frequency decline compared to the scenario with no (0 GW) wind generation. First, generator governors actions are delivered quicker than in the case with no (0 GW) wind generation. See Figure 3-8. This is a direct result of the procedures we implemented to increase the effectiveness of generator governors in providing primary frequency control actions. Table 3-2 is a modification of Table 3-1 that presents both the primary frequency response provided by generator governors and the number of generating units providing this response. The table shows that nearly 50 percent more units are providing governing response in the high wind generation scenario compared to the number providing this response in the low wind generation scenario. Nevertheless, total primary frequency control delivered by generator governors in the high wind generation scenario is less than that provided in the no (0 GW) wind case because there are fewer conventional generators in high wind generation scenario due to decommitment to accommodate wind generation. Second, faster delivery of primary frequency control actions by generator governors decreases (or slows down) the rate of frequency decline. Compare the initial 2 seconds of frequency decline following the loss of generation in Figure 3-4 to that in Figure 3-6. Slower rate of frequency decline leads to deployment of LaaR in discrete blocks owing to very small differences in the set points of each block.15 See Figure 3-7.
15 According to ERCOT staff, they are all set very close to but are not identically at 59.7 Hz.
Dynamic Simulation Studies of the Frequency Response of the Three U.S. Interconnections with Increased Wind Generation
20
59.60
59.65
59.70
59.75
59.80
59.85
59.90
59.95
60.00
60.05
0 1 2 3 4 5 6 7 8 9 10 11 12 13 14 15 16 17 18 19 20
Time (Seconds)
Fre
qu
ency
(H
z)
Low Reserves, 0 GW wind generation
Figure 3-4. The Effect of Power Delivered by Primary Frequency Control Actions on System Frequency following the Sudden Loss of 2,450 MW of Generation – Low Reserves and 0 GW of Wind
0
250
500
750
1000
1250
1500
1750
2000
2250
2500
2750
0 1 2 3 4 5 6 7 8 9 10 11 12 13 14 15 16 17 18 19 20
Time (Seconds)
Laa
Rs
Lo
ad o
r G
ove
rno
r G
ener
atio
n D
eplo
yed
(M
W)
Sum of Governors and LaaRs, 0 wind
Governor Responsive Reserves Deployed, Low Reserves, 0 GW Wind
LaaRs deployed, Low Reserves, 0 GW Wind
Figure 3-5. The Power Delivered (and Load Removed) by Primary Frequency Control Actions via Generator Governors and Load Acting as a Resource following the Sudden Loss of 2,450 MW of Generation – Low Reserves and 0 GW of Wind
Dynamic Simulation Studies of the Frequency Response of the Three U.S. Interconnections with Increased Wind Generation
21
59.65
59.70
59.75
59.80
59.85
59.90
59.95
60.00
60.05
0 1 2 3 4 5 6 7 8 9 10 11 12 13 14 15 16 17 18 19 20
Time (Seconds)
Fre
qu
ency
(H
z)
Low Reserves, 14 GW wind generation
Figure 3-6. The Effect of Power Delivered by Primary Frequency Control Actions on Frequency following the Sudden Loss of 2,450 MW of Generation – Low Reserves and 14.4 GW of Wind
0
250
500
750
1000
1250
1500
1750
2000
2250
2500
2750
0 1 2 3 4 5 6 7 8 9 10 11 12 13 14 15 16 17 18 19 20
Time (Seconds)
Laa
Rs
Lo
ad o
r G
ove
rno
r G
ener
atio
n D
eplo
yed
(M
W)
Sum of Governor and LaaRs, 14 GW Wind
Governor Responsive Reserves Deployed, Low Reserves, 14 GW Wind
LaaRs deployed, Low Reserves, 14 GW Wind
Figure 3-7. The Power Delivered (and Load Removed) by Primary Frequency Control Actions following the Sudden Loss of 2,450 MW of Generation – Low Reserves and 14.4 GW of Wind
Dynamic Simulation Studies of the Frequency Response of the Three U.S. Interconnections with Increased Wind Generation
22
0
250
500
750
1000
1250
1500
1750
2000
2250
2500
2750
0 1 2 3 4 5 6 7 8 9 10 11 12 13 14 15 16 17 18 19 20
Time (Seconds)
Go
ve
rno
r G
en
era
tio
n D
ep
loy
ed
(M
W)
Governor Responsive Reserves Deployed, Low Reserves, 0 Wind
Governor Responsive Reserves Deployed, Low Reserves, 14 GW Wind
Figure 3-8. Comparison of Generator Governor Performance in the Low Reserve Scenario with No (0 GW) and High (14.4 GW) Wind Generation for the Texas Interconnection
Table 3-2. Generator Governor Performance in the Low Reserve Scenarios for the Texas Interconnection
Reserves Wind
Generation (GW)
Primary Frequency
Response at 2 seconds [governor response]
(MW)
Number of Generating
Units providing Primary
Response at 2 seconds
Primary Frequency
Response at 4 seconds
[governor response]
(MW)
Number of Generating
Units providing Primary
Response at 4 seconds
Low Reserves
0 2,294
[1,290] 122
2,446 [1,464]
123
14.4 1,335
[1,273] 187
1,677 [1,104]
186
Dynamic Simulation Studies of the Frequency Response of the Three U.S. Interconnections with Increased Wind Generation
23
4. Frequency Response Study of Wind Generation in the Eastern Interconnection
The Eastern Interconnection covers approximately 3.5 million square miles and includes the provinces of Saskatchewan, Manitoba, Ontario and the Maritimes in Canada, and all or portions of the contiguous 39 U.S. states east of the Western Interconnection. Six regional entities are responsible coordinating and promoting bulk electric system reliability in the Eastern Interconnection: the Florida Reliability Coordinating Council, the Midwest Reliability Organization, the Northeast Power Coordinating Council, Inc., the ReliabilityFirst Corporation, the SERC Reliability Corporation, and the Southwest Power Pool, Inc.16 4.1 Eastern Interconnection System Models and the Dynamic Simulation Tool
To study the Eastern Interconnection’s frequency behavior following the sudden loss of generation with different amounts of wind generation and operating reserves, we obtained a system model developed by the Eastern Interconnection Reliability Assessment Group (ERAG) Multiregional Modeling Working Group (MMWG),17 and we used the principal dynamic simulation tool employed by interconnection planners. ERAG’s purpose is to augment the reliability of the bulk-power system in the Eastern Interconnection through periodic reviews of generation and transmission expansion programs and forecasted system conditions. The system model we obtained is known as the 2009 Light-Load case from the 2008 ERAG-MMWG series. The model contains generators totaling 445 GW of total installed generating capacity. For the 2009 Light-Load case, 3,156 generators are dispatched to serve 309 GW of load, plus 6 GW in losses. Wind generation accounts for 8 GW of this generating capacity although less than this total amount is dispatched in the 2009 Light-Load case. The amount of wind generation in the ERAG 2009 Light-Load system model is capable of supplying approximately 1 percent of expected electricity requirements of the interconnection in 2012. Therefore, as discussed in the introduction, it is not possible to use this system model to study the frequency response effects of significant increases in the amount of wind generation in the interconnection. We used version 30.3.2 of Siemens-PTI’s PSSE simulation tool to conduct power flow and dynamic simulation studies with the ERAG-MMWG system model (Siemens 2009). System planners within in the interconnection routinely use this tool for reliability studies. 4.2 Preparation of the ERAG-MMWG System Model
Preparing the ERAG-MMWG system model for use in our study involved the following steps: 1) Review the composition of load; 2) Identify the generation-loss event and the highest under-frequency load-shedding set point, which establishes the lowest acceptable frequency nadir
16 http://www.nerc.com/page.php?cid=1|9|119 17 http://www.erag.info/
Dynamic Simulation Studies of the Frequency Response of the Three U.S. Interconnections with Increased Wind Generation
24
following the loss of generation; 3) Conduct initial simulations to assess the additional work required to modify the system model to study minimum load conditions with higher levels of wind generation. As we note below, the results of the initial simulations led us to conclude that it would not be prudent to undertake these modifications. 4.2.1 Load Composition
In the 2009 Light-Load case, more than 90 percent of the load model is constant current for real power and constant impedance for reactive power. 4.2.2 Generation-Loss Event and Under-Frequency Load Shedding
The generation-loss event we selected is one that occurred recently. In part because it took place in a recent year, it is not studied routinely as part of operation and transmission planning processes in East. However, because of its size and the number of reliability regions affected, it has been the subject of considerable analysis by the industry, including but not limited to the frequency response of the interconnection. The event involved a complex series of line and generator outages in which a total of approximately 4,500 MW of generation was lost in less than 10 seconds. Because of the size and organization of the Eastern Interconnection, it contains multiple under-frequency load-shedding programs.18 Based on a review of information filed with FERC describing the operation of these programs, we selected 59.8 Hz as the frequency nadir threshold for our study. 4.2.3 Initial Simulation of the Eastern Interconnection Following the Sudden Loss of 4,500
MW of Generation
In an effort to assess the work that might be required to modify the ERAG-MMWG system model to study larger amounts of wind generation, we conducted an initial simulation study of the generation-loss event described above using this system model. Following review of these results by LBNL, we did not conduct additional simulations of the Eastern Interconnection. LBNL’s analysis of the initial simulation result is discussed in Eto et al. (2010).
18 See NERC (2007) and NERC (2008). Note that, at the time these documents were filed, the Florida Reliability Coordinating Council has revised its under-frequency load-shedding set point from 59.82 Hz to 59.7 Hz.
Dynamic Simulation Studies of the Frequency Response of the Three U.S. Interconnections with Increased Wind Generation
25
References
1. Ellis, A., Y. Kazachkov, E. Muljadi, J. Sanchez-Gasca, N. Miller, R. Zavadil, P. Pourkeik. 2009. “North America Dynamic Wind Generator Modeling Update, Based on work performed by the WECC Wind Generator Modeling Group and the IEEE Dynamic Performance of Wind Power Generation Working Group.” IEC TF88 WG27. Roskilde, Denmark. October. http://www.wecc.biz/committees/StandingCommittees/PCC/TSS/MVWG/REMTF/Wind%20Documents/IEC%20TF88-WG27-Oct%202009%20Wind%20Modeling%20Update.pdf
2. ERCOT. 2005. August 19, 2004 Forney Plant Trip Event Simulation. ERCOT Dynamics Working Group December, 1. http://www.ercot.com/content/meetings/ros/keydocs/2005/1208/8A.DWG_Event_Simulation_Report.doc
3. ERCOT. 2006. “Analysis of Transmission Alternatives for Competitive Renewable Energy Zones in Texas.” December. http://www.ercot.com/news/presentations/2006/ATTCH_A_CREZ_Analysis_Report.pdf
4. ERCOT. 2009. “ERCOT Operating Guides”. November 1. http://www.ercot.com/content/mktrules/guides/operating/2009/11/November_1,_2009_Operating_Guides.pdf
5. Eto, J., J. Undrill, P. Mackin, R. Daschmans, B. Williams, B. Haney, R. Hunt, J. Ellis, H. Illian, C. Martinez, M. O’Malley, K. Coughlin, K. Hamachi-LaCommare. 2010. Use of Frequency Response Metrics to Assess the Planning and Operating Requirements for Reliable Integration of Variable Renewable Generation. LBNL-4142E. Berkeley, CA: Lawrence Berkeley National Laboratory. May.
6. North American Electric Reliability Corporation (NERC). 2007. Compliance Filing of the North American Reliability Corporation in Response to Paragraph 145 of Order 693-A. FERC Docket No. RM06-16-. November, 13.
7. North American Electric Reliability Corporation (NERC). 2008. Response to FERC Supplemental Request for Information on the Status of Underfrequency Load Shedding. FERC Docket No. RM06-16-000. February 1. https://www.frcc.com/handbook/Shared%20Documents/PRC%20%20Protection%20and%20Control/FRCC%20Automatic%20UFLS%20Procedure%2005%2007%2009.pdf
8. Pereira, L., J. Undrill, D. Kosterev, D. Davies, and S. Patterson. “A New Thermal Governor Modeling Approach in the WECC.” IEEE Transactions on Power Systems, vol. 18. no. 2. pp. 819-829. May 2003.

Dynamic Simulation Studies of the Frequency Response of the Three U.S. Interconnections with Increased Wind Generation
26
9. Siemens Power Technologies International. 2009. http://www.energy.siemens.com/hq/en/services/power-transmission-distribution/power-technologies-international/
10. Undrill, J.M. 2010. Power and Frequency Control as it Relates to Wind-Powered Generation. LBNL-4143E. Berkeley: Lawrence Berkeley National Laboratory.
11. WECC. 2008. WECC Standard BAL-002-WECC-1. http://www.nerc.com/files/BAL-002-WECC-1_Final.pdf
12. WECC. 1997. WECC Coordinated Off-Nominal Frequency Load Shedding and Restoration Requirements. http://www.wecc.biz/library/WECC%20Documents/Miscellaneous%20Operating%20and%20Planning%20Policies%20and%20Procedures/Off%20Nominal%20Frequency.pdf
13. WECC. 2009. Reliability Standards and Due Process. http://www.wecc.biz/Standards/Pages/default.aspx