dynamic swelling and conductivity of ion-containing block
TRANSCRIPT

The Pennsylvania State University
The Graduate School
Department of Materials Science and Engineering
DYNAMIC SWELLING AND CONDUCTIVITY OF
ION-CONTAINING BLOCK COPOLYMER THIN FILMS
A Thesis in
Materials Science and Engineering
by
Stephanie Ann Petrina
© 2010 Stephanie Ann Petrina
Submitted in Partial Fulfillment of the Requirements
for the Degree of
Master of Science
August 2010

ii
The thesis of Stephanie Ann Petrina was reviewed and approved* by the following:
Michael A. Hickner Assistant Professor of Materials Science and Engineering Thesis Advisor
Nikolas J. Podraza Research Assistant Professor of Electrical Engineering
Ralph H. Colby Professor of Materials Science and Engineering
Joan M. Redwing Associate Head for Graduate Studies
*Signatures are on file in the Graduate School.

iii
ABSTRACT
Ion-containing polymers have been extensively studied in an attempt to increase
the efficiency of ion transport in fuel cells. Block copolymers with an ionic phase and a
hydrophobic phase represent one promising approach to improved fuel cell materials.
Despite abundant research on bulk membranes composed of ion-containing block
copolymers, little attention has been given to swelling and conductivity in thin films
(~10-500 nm) of these materials.
Thin ion-containing polymer films play a significant role in fuel cell operation
and performance by facilitating proton conduction between the catalyst layer and proton
exchange membrane (PEM). By lowering the interfacial resistance between the catalyst
and PEM in a fuel cell, these films become a critical component in accessing the
maximum amount of reactive catalyst surface area. Typically, thin ion-containing
polymer films are treated as having the same properties as measured for bulk membranes.
However, in thin films, substrate and air interfaces affect material properties. The high
ratio of surface area to volume in films less than 100 nm in thickness results in a large
percentage of interfacial polymer with unique morphological, swelling, and conductivity
characteristics compared to what is observed for bulk films.
When a PEM is exposed to increased water activity, or more commonly, relative
humidity, additional water is absorbed into the film. The morphological structure and
polymer chain dynamics of the film may vary with thickness, which affects the rate of
water absorption, the total amount of water absorbed, and therefore, the conductivity of
the films. To understand thin film conduction, the following points were investigated:
the morphological differences between bulk and thin (< 100 nm) film polymers; the

iv
effect of film thickness and morphology on water uptake and dynamic swelling; and the
interactions between the ion-containing polymers and the substrate.
The microscopic structure before swelling, the change in thickness during
swelling, and ion conductivity of thin films of ion-containing block copolymers were
examined. The initial morphology of the films in ambient conditions was established by
atomic force microscopy (AFM). Spectroscopic ellipsometry was used to measure the
change in thickness and film composition in real time to characterize the dynamic water
uptake. Ion conductivity was measured using AC impedance. The aim of this research is
to understand the swelling behavior of thin ion-containing block copolymer films and to
determine the fundamental water sorption phenomena and morphological features that
may influence the conductivity of these thin films.

v
TABLE OF CONTENTS
LIST OF FIGURES .....................................................................................................vii
LIST OF TABLES.......................................................................................................xiii
ACKNOWLEDGEMENTS.........................................................................................xiv
Chapter 1. ION CONDUCTIVE POLYMERS ..........................................................1
1.1. Introduction...................................................................................................1 1.2. Significance of This Work............................................................................3
Chapter 2. LITERATURE REVIEW..........................................................................6
2.1. Introduction...................................................................................................6 2.2. Block Copolymers ........................................................................................6
2.2.1. Flory-Huggins Theory .........................................................................8 2.2.2. Application of Block Copolymer Theory to Ion-Containing Block
Copolymers ............................................................................................11 2.3. Thin Film Block Copolymers .......................................................................11
2.3.1. Small Molecule Diffusion in Thin Polymer Films .............................14 2.3.2. Thin Film Diffusion and Relaxation...................................................22
2.4. Thin Films of Ion-containing Polymers: Morphology and Conductivity....25 2.5. Ellipsometry..................................................................................................28 2.6. Summary .......................................................................................................34
Chapter 3. EXPERIMENTAL PROCEDURES FOR SAMPLE PREPARATION AND CHARACTERIZATION ............................................................................39
3.1. Introduction...................................................................................................39 3.2. Film Fabrication.............................................................................................39
3.2.1. Substrate Treatments ..........................................................................40 3.2.2. Fabrication of Thin Films...................................................................42 3.2.3. Fabrication of Bulk Films...................................................................43
3.3. Electrode Fabrication....................................................................................43 3.3.1. Mask Fabrication .................................................................................44 3.3.2. Photolithography ................................................................................44
3.4. Conductivity .................................................................................................46 3.2.1. Bulk Film Conductivity......................................................................47 3.2.2. Thin Film Conductivity ......................................................................47
3.5. Spectroscopic Ellipsometry ...........................................................................49 3.5.1. Analyzing Spectroscopic Ellipsometry Data......................................50 3.5.2. Environmental Chamber for Ellipsometry .........................................50
3.6. Atomic Force Microscopy .............................................................................51 3.7. Properties and Synthesis of Poly(styrene)-b-poly(methyl methacrylate) ......52

vi
Chapter 4. THIN FILM MORPHOLOGY OF IONIC BLOCK COPOLYMERS.....55
4.1. Introduction...................................................................................................55 4.1.1. Correlation between Morphology and Conductivity..........................56 4.1.2. Atomic Force Microscopy ..................................................................58
4.2. Effects of Film Processing.............................................................................59 4.2.1. Effect of Substrate Treatments ...........................................................64
4.3. Conclusions...................................................................................................66 4.4. Future Work..................................................................................................67
Chapter 5. SWELLING OF THIN ION-CONTAINING BLOCK COPOLYMER FILMS...................................................................................................................68
5.1. Introduction...................................................................................................68 5.2. Thin Film Swelling .......................................................................................70
5.2.1. Description of the Swelling Process....................................................72 5.2.2. Thickness Change at Equilibrium ......................................................74 5.2.3. Initial Swelling Rate ...........................................................................78 5.2.4. Total Thickness Change at Equilibrium as a Function of Relative
Humidity.................................................................................................80 5.3. Conclusions ..................................................................................................84
Chapter 6. CONDUCTIVITY OF ION-CONTAINING BLOCK COPOLYMER FILMS...................................................................................................................87
6.1. Introduction...................................................................................................87 6.2. Conductivity of Spin Cast Thin Films ..........................................................89 6.3. Conductivity of Drop Cast Thin Films .........................................................91 6.4. Conclusions and Future Work ......................................................................94
Chapter 7. CONCLUSIONS AND FUTURE WORK ...............................................95
7.1. Summary and Conclusions ...........................................................................95 7.2. Future Directions ..........................................................................................96

vii
LIST OF FIGURES
Figure 1-1. Simplified schematic of a hydrogen powered fuel cell. Hydrogen (H2) fuel is reduced by the catalyst layer (H2 2H+ + 2e-). The electrons are used in an external circuit and the proton exchange membrane conducts the protons from anode to cathode. At the cathode, the protons and electrons are used to reduce oxygen to water.......................................................................3
Figure 2-1. Mean-field phase diagram for diblock copolymer melts. The ordered phases are labeled as L (lamellar), G (gyroid), C (cylindrical), S (spherical), and Scp (close-packed spherical). The dot marks a mean-field critical point, and the dashed curves denote extrapolated phase boundaries, which could not be calculated due to numerical limitations ...........................................................10
Figure 2-2. Three dimensional structures of ordered block copolymer phases including S (spherical), C (cylindrical), G (gyroid), and L (lamellar) .................10
Figure 2-3. Diblock copolymer thin film morphologies. (a) Schematic representation of volume symmetric diblock with A (light) and B (dark) type segments. (b) Diagram of BC film system in cross section indicating the bottom (1) and top (2) surfaces, with surface interaction energies S1 and S2, respectively. (c) Summary of diblock thin film morphologies as film thickness decreases from L0. These calculated cross sections indicate the density of B-type segments, i.e., Black = 100% B, white =100% A. These structures are referred to in the text with the abbreviations included under each diagram.........................................................................................................13
Figure 2-4. The two types of diffusion are shown (a) Fickian diffusion and (b) anomalous Case II diffusion .................................................................................15
Figure 2-5. Water diffusion coefficients into thin films as a function of poly(4-ammonium styrenesulfonic acid) film thickness as determined by () Fickian and () two-stage absorption model ........................................................17
Figure 2-6. Percentage increase in film thickness induced by a 16-h exposure to an 80% RH environment vs. thickness of the same film measured under dry, evacuated conditions. Films prepared with a silane coupling agent () and without a silane coupling agent (). All measurements at 23ºC .........................18

viii
Figure 2-7. Influence of poly(vinyl pyrrolidone) (PVP) film thickness on moisture absorption as measured by reflectivity. The water volume fraction absorbed in the films from saturated vapor is dependent for the thin films upon the substrate, either () SiOx or () HMDS treated silicon. The dashed line is a guide to show that the absorption in PVP on the silicon oxide substrate is independent of film thickness ............................................................19
Figure 2-8. Equilibrium water absorption in different thickness poly(4-ammonium styrenesulfonic acid) films as determined by (a) XR and (b) QCM measurements .......................................................................................................20
Figure 2-9. Effective water diffusion coefficients in PVP films. The diffusivity decreases by three orders of magnitude as the film thickness decreases from 155 to 5.6 nm. There is no discernable effect of the substrate, () SiOx or () HMDS, on the diffusivity .....................................................................................21
Figure 2-10. Discrete distributions of relaxation times for () 23 and () 520 nm thick films at 98ºC (5º above Tg). Curves are drawn to guide the eye ................24
Figure 2-11. Maxiumum temperature position of the α relaxation peak Tα at 38 Hz relaxation time at 322 K, and dielectric strength at 322 K as a function of film thickness........................................................................................................26
Figure 2-12. AFM topography images (1 μm x1 μm) of Nafion® LS films in air: 10 layers deposited on a silicon oxide substrate (a) before and (b) after loading in 5 x 10⁻⁴ M FA+ and (c) 5 x 10⁻⁴ M Ru(bpy)3
2+ ....................................27
Figure 2-13. Atomic force micrograph of (a) 135 nm thick ITO film (tapping mode) and (b, c) 7 nm thick Nafion film on ITO (tapping mode). (c) is a color coded version of (b) which shows uncoated ITO in red..............................28
Figure 2-14. Reflection of light off of a surface showing angle of incidence, reflection and transmission. Refractive index of air, n0, and material, n1 ...........29
Figure 2-15. Orthogonal waves combined to demonstrate elliptical polarization of light .......................................................................................................................29
Figure 2-16. Typical ellipsometry configuration, where linearly polarized light is reflected from the sample surface and the polarization change is measured to determine the sample response .............................................................................31
Figure 2-17. Schematic diagram of the sample cell for ellipsometric measurements .......................................................................................................33
Figure 2-18. Ellipsometric angles Ψ and Δ as a function of wavelength for a series of humidities for P(MTGA-r-AA)..............................................................34

ix
Figure 3-1. In situ swelling of 8.75 nm thick (when dry) APTMS film on silicon as it is exposed to increasing humidity, measured by spectroscopic ellipsometry. Thickness change, lt, (nm) is shown in real time, t, in seconds and as a function of relative humidity, RH (%), labeled on the graph .................41
Figure 3-2. Schematic of the electrode design for thin film conductivity measurements. The substrate is a prime silicon wafer with a 90 nm thick thermal oxide coating ...........................................................................................45
Figure 3-3. Side view schematic of the method for maintaining the humid environment around thin film sPS-PMMA samples while measuring AC impedance on electrode substrates........................................................................48
Figure 3-4. Top view schematic of the method for maintaining the humid environment around thin film sPS-PMMA samples while measuring AC impedance on electrode substrates. For clarity, this image does not include the tube that feeds humidity into the plastic dome ...............................................48
Figure 3-5. Environmental cell created to maintain a consistent humid environment for swelling samples characterized with spectroscopic ellipsometry ..........................................................................................................51
Figure 3-6. Sulfonation of PS-b-PMMA using acetyl sulfate.....................................53
Figure 4-1. (a) Illustration depicting the morphological change with increasing ion content. At low ion contents, a periodic lamellar morphology exists, where the microdomains are predominantly oriented perpendicular to the direction of transport. At higher ion contents, and degrees of sulfonation up to 82% a nonperiodic cocontinuous morphology exists providing less resistance for transport. (b) The normalized proton conductivity σ/Φ as a function of the sulfonation degree for the three series: 20 kg mol-1 (circle), 52.5 kg mol-1 (square), and 78 kg mol-1 (triangle). Φ refers to the volume fraction of the PS + sPS + water domains ............................................................57
Figure 4-2. A schematic of the increase in proton conductivity as morphology becomes more ordered in sPS-PMMA systems....................................................58
Figure 4-3. AFM (a) height and (b) phase morphology of drop cast 203-165 kg mol-1 sPS-PMMA film on a bare wafer with native oxide surface. Slowly drying the film from solution allowed for a more periodic morphology with sPS cylinders aligning perpendicular to the surface in a PMMA matrix .............60
Figure 4-4. AFM (a) height and (b) phase morphology of a 49 nm thick film created by spin casting at 1000 rpm onto a bare wafer. AFM (a) height and (b) phase morphology of a 23 nm thick film created by spin casting at 3000 rpm onto a bare wafer. Both films were cast from 1% w/w 203-165 kg mol-1
sPS-PMMA solution in DMF ...............................................................................61

x
Figure 4-5. AFM (a) height and (b) phase morphology of a 380 nm thick film created by spin casting at 1000 rpm onto a bare wafer. AFM (a) height and (b) phase morphology of a 184 nm thick film created by spin casting at 3000 rpm onto a bare wafer. Both films were created from 5% w/w 203-165 kg mol-1 sPS-PMMA solution in DMF......................................................................62
Figure 4-6. AFM (a) height and (b) phase morphology of a 400 nm thick film, created by spin casting at 1000 rpm onto a bare wafer. AFM (a) height and (b) phase morphology of a 200 nm thick film created by spin casting at 3000 rpm onto a bare wafer. Both films were created from 1% w/w 115-165 kg mol-1 PS-PMMA solution in toluene cast onto a polystyrene brush layer............63
Figure 4-7. AFM height and phase images show the differences in morphology for thin polymer films (22-29 nm thick) on a) bare silicon wafers b) APTMS coated silicon wafer and c) HMDS coated silicon wafer. Films were prepared by spin coating a 1% w/w solution of 203-165 kg mol-1 sPS-PMMA on the substrate at 3000 rpm............................................................................................65
Figure 5-1. Thickness change, lt, of a 350 nm thick (at ambient) sPS-b-PMMA film as it is exposed to increasing humidity, measured by spectroscopic ellipsometry ..........................................................................................................71
Figure 5-2. Swelling of l0 =21.7 nm thick film on HMDS () showing dynamic degree of swelling, α’, as humidity is increased from 25% RH to 50% RH. The grey line shows the lowest mean square error model fit of α’. The model on the left, calculated using Equation 5-1, does not accurately describe the initial rate of uptake or the secondary swelling towards equilibrium, proving that this type of swelling is not a first order diffusion process. The model on the right shows the stretched exponential that is a much better fit to the data, as calculated using Equation 5-3 ..........................................................................74
Figure 5-3. The degree of swelling, ln, normalized by the equilibrated thickness at 25 % RH of the thinnest sulfonated poly(styrene)-poly(methyl methacrylate) films l0 = 21.7 nm on HMDS (), l0 =28.8 nm on APTMS (), l0 = 23.5 nm on bare silicon () as humidity is increased from 25 % RH to 50 % RH...........76
Figure 5-4. The degree of swelling, ln, normalized by the equilibrated thickness at 50 % RH of the thinnest sulfonated poly(styrene)-poly(methyl methacrylate) films l0 = 22.4 nm on HMDS (), l0 = 29.7 nm on APTMS (), l0 = 24.5 nm on bare silicon () as humidity is increased from 50 % RH to 75 % RH...........76
Figure 5-5. The degree of swelling, ln, normalized by the equilibrated thickness at 25 % RH of the thickest sulfonated poly(styrene)-b-poly(methyl methacrylate) films l0 = 326.9 on HMDS () l0 = 347.6 nm on bare silicon (), and l0 = 383.3 nm on APTMS () as humidity is increased from 25 % RH to 50 % RH.....................................................................................................77

xi
Figure 5-6. The degree of swelling, ln, normalized by the equilibrated thickness at 50 % RH of the thickest sulfonated poly(styrene)-b-poly(methyl methacrylate) films l0 = 341.8 nm on HMDS (), l0 = 361.2 nm on bare silicon (), and l0 = 396.6 nm on APTMS (), as humidity is increased from 50 % RH to 75 % RH ...........................................................................................78
Figure 5-7. a) The degree of swelling, ln, normalized by the equilibrated thickness at 50 % RH of the thinnest sulfonated polystyrene-polymethyl methacrylate films l0 =21.7 nm on HMDS (), l0 = 23.5 nm on bare silicon (), l0 = 28.8 nm on APTMS (), as humidity is increased from 25 % RH to 50 % RH. b) The degree of swelling, ln, normalized by the equilibrated thickness at 50 % RH of the thinnest sulfonated poly(styrene)-poly(methyl methacrylate) films l0 = 22.4 nm on HMDS (), l0 = 24.5 nm on bare silicon (), l0 = 29.7 nm on APTMS (), as humidity is increased from 50 % RH to 75 % RH. The slopes are in units of s-1 ........................................................................................79
Figure 5-8. a) The degree of swelling, ln, normalized by the equilibrated thickness at 25 % RH of the thickest sulfonated poly(styrene)-poly(methyl methacrylate) films l0 = 326.9 on HMDS (), l0 = 383.3 nm on APTMS (), l0 = 347.6 nm on bare silicon () as humidity is increased from 25 % RH to 50 % RH. b) The degree of swelling, ln, normalized by the equilibrated thickness at 50 % RH of the thickest sulfonated poly(styrene)-poly(methyl methacrylate) films l0 = 341.8 nm on HMDS (), l0 = 396.6 nm on APTMS (), l0 = 361.2 nm on bare silicon () as humidity is increased from 50 % RH to 75 % RH.....................................................................................................80
Figure 5-9. Degree of swelling (%) of sulfonated poly(styrene)-b-poly(methyl methacrylate) films of four thicknesses, 22.8 nm (), 43.0 nm (), 184.5 nm (), 323.0 nm (), on a hydrophobic HMDS-coated silicon wafer for relative humidities from 0 to 90 % RH..............................................................................81
Figure 5-10. Degree of swelling (%) as a function of relative humidity for sulfonated poly(styrene)-poly(methyl methacrylate) films of four thicknesses on an APTMS-coated silicon wafer. Thicknesses were 28.9 nm (), 49.0 nm (), 184.0 nm, (), 380.0 nm (). There was a clear trend between film thickness on APTMS and the degree of swelling: the thickest film swelled the most while the thinnest film on APTMS swelled the least...................................82
Figure 5-11. Degree of swelling (%) of ultra thin films sulfonated poly(styrene)-poly(methyl methacrylate) on three different substrate treatments on silicon wafers. Films are 22.8 nm thick on HMDS (), 23.2 nm thick on bare silicon () and 28.9 nm thick on APTMS (). The thin film on HMDS had the largest degree of swelling as humidity was increased from 0 to 90 % RH. At 90 % RH, the film on HMDS, bare silicon, and APMTS swelled 29 %, 26 %, 20 % of their original thickness, respectively .................................................83

xii
Figure 5-12. Degree of swelling (%) of thick sulfonated poly(styrene)-poly(methyl methacrylate) films on three different substrate treatments on silicon wafers. Films are 323.0 nm thick on HMDS (), 343.0 nm thick on bare silicon () and 380.0 nm thick on APTMS (). Thick films all showed similar degrees of swelling as humidity was increased from 0 to 90 % RH. At 90 % RH, the film on HMDS, bare silicon, and APMTS swelled 24 %, 26 %, 26 % of their original thickness, respectively .................................................83
Figure 6-1. Dependence of the conductivity of recast Nafion® thin film on film thickness. Samples were measured at 85 ºC and a relative humidity of 85 % () or 60 % (). Solid data points () represent bulk membranes (Nafion® 112, 115, and 117) ................................................................................................89
Figure 6-2. Conductivity, σ, as a function of film thickness for spin cast sulfonated poly(styrene)-b-poly(methyl methacrylate) films from 86 nm to 2.5 μm thick measured at 90% RH and 25 °C. Samples include molecular weights in kg mol-1 and degrees of sulfonation of 403-263, DS 74 % (), 203-165, DS 100 % (), 186-106, DS 93 % (), 170-128, DS 100 % (), 120-90, DS 100 % (), 80-52,,DS 100 % ()...................................................90
Figure 6-3. Conductivity, σ, as a function of relative humidity for bulk films (~50 μm in thickness) for a variety of sulfonated poly(styrene)-b-poly(methyl methacrylate) molecular weights. Molecular weight has little effect on conductivity, with films over a large range of molecular weight showing similar conductivities up to 90% RH. Samples include molecular weights in kg mol-1 and degrees of sulfonation of 403-263, DS 74 % (), 203-165, DS 100 % (), 186-106, DS 93 % (), 170-128, DS 100 % (), 120-90, DS 100 % (), 80-52, DS 100 % () ..............................................................................92
Figure 6-4. Conductivity, σ, as a function of thickness for drop cast and bulk films. Conductivities were measured at 90 % RH and 25 °C. The solid circle surrounds bulk films created in molds. The dotted circle indicates films that were drop cast. Samples include molecular weights in kg mol-1 and degrees of sulfonation of 403-263, DS 74 % (), 203-165, DS 100 % (), 186-106, DS 93 % (), 170-128, DS 100 % (), 120-90, DS 100 % (), 80-52, DS 100 % () ............................................................................................................93

xiii
LIST OF TABLES
Table 3-1. Approximate film thicknesses based on processing conditions for spin cast thin films created from 1 or 5 w/w % solutions at spin speeds of 1000 or 3000 rpm...............................................................................................................42
Table 3-2. Flow rates for humidity measurements .....................................................49
Table 3-3. Solubility parameters and molecular properties of materials used in this study including N,N-dimethylformamide (DMF), poly(styrene) (PS), sulfonated poly(styrene) (sPS), poly(methyl methacrylate) (PMMA) and water .....................................................................................................................53
Table 3-4. Original molecular weights and calculated molecular weights after sulfonation of poly(styrene) (PS), sulfonated poly(styrene) (sPS), and poly(methyl methacrylate) (PMMA)....................................................................54
Table 5-1. Fabrication details for the 12 films investigated in ellipsometric swelling experiments. Films were created at 4 thicknesses (in columns, 2 spin casting speeds, 2 solution concentrations) and on three different substrate treatments (across rows) ........................................................................71
Table 5-2. Values of calculated swelling rates, k, and exponential decay, β, for the thinnest and thickest sPS-b-PMMA films on native oxide silicon, HMDS, and APTMS-coated silicon for the 50 and 75 % relative humidity increments ...73

xiv
ACKNOWLEDGEMENTS
It seems appropriate to begin this document by thanking the people who have
supported me in my personal and professional journey to this point. I would like to
recognize and thank my advisor, Michael Hickner, for his patience and encouraging
attitude. Amazingly, you always have time for students and I appreciate that you treat
people as valuable assets. Your insatiable appetite for science is admirable and I envy it.
Thanks are due to Nik Podraza for introducing me to the whole new world of
ellipsometry. You were immensely helpful in getting the ellipsometry aspect of this
project off the ground and I hope we can conquer the (spectroscopic ellipsometry) world
with future discoveries about thin film polymer dynamics. Thanks to the members of
Hickner group for all the conversations, guidance, and diversions. Romesh, I’m grateful
you were always willing to have a chat and/or a beer with me.
Most importantly, I thank my family and friends who have been my constant
advocates and supporters. I was incredibly lucky to grow into adulthood with a group of
friends at Virginia Tech that helped me make it through tedious engineering classes, a
tragedy, and some immensely good times. Kristin, thanks for being goofy and smart and
resetting my balance: I am lucky we could continue from VT to Penn State together. My
friend, partner, and love, Josh, I look forward to a lifetime of adventures with you.
Thanks to my sister, Renée, for setting the bar high for me. Most of all, I am indebted to
my parents, Glenn and Gloria, for making me join swim team, do crafts after school,
attend Workcamp and the Governor’s School, and setting me up for a life of prosperity.
You taught me to be an individual and a good person. I owe all my successes to you.

1
Chapter 1
Ion Conductive Polymers
1.1. Introduction
Using energy from renewable sources like hydrogen, the most abundant element
on Earth, is a promising way to decrease dependence on fossil fuels. Energy conversion
using hydrogen fuel cells emits water as a byproduct, as opposed to nitrogen, carbon, and
sulfur emissions from internal combustion engines. Fuel cells that use hydrogen or other
renewable fuels have the potential to become a common energy conversion technology
for electronics and vehicles, but their performance must be improved and their cost
reduced before widespread commercialization can be realized.
Proton exchange membranes (PEMs) are usually composed of sulfonated
polymers, with Dupont’s Nafion®, a poly(perfluorosulfonic acid) random copolymer,
being the industry standard. Ion-containing polymers have been extensively studied in an
attempt to increase the efficiency of ion transport in fuel cells. Fuel cells convert the
chemical energy of hydrogen into electrical energy by splitting hydrogen into protons and
electrons (H2 2H+ + 2e-). Figure 1-1 shows the basic function and components of a
hydrogen fuel cell. The electrons are used in an external circuit and the proton exchange
membrane conducts the protons from anode to cathode. At the cathode, the protons and
electrons reduce oxygen from air into water. Water readily absorbs into the membrane to
facilitate the proton conduction process. As the material swells, the hydrogen bonding
dynamics of the absorbed water increase, more water-water interactions result, and the
membrane’s microscopic structure changes, all of which promote high conductivity.

2
Many new PEMs are based on ion-containing polymers with block copolymer
motifs. Although bulk membranes composed of ion-containing block copolymers have
been extensively researched, little attention has been given to thin film swelling and
conductivity of the analogous materials. Omitting research on thin films in these systems
is a serious deficiency in the field as ion-containing polymer films lower the interfacial
barrier between the catalyst and PEM in a fuel cell, and their performance is critical to
accessing all of the catalyst surface area. A layer of ionomer approximately 10 nm thick
coats the catalytic particles in the cathode catalyst layer in a PEM fuel cell (PEMFC).
Proper ionomer coating of catalytic particles in the catalyst layer of a PEMFC sustains
the electrochemical reactions and proton transport that is vital to the functionality of a
fuel cell.1 Since the ionomer must be humidified to be proton conductive, it is essential
to understand the behavior of water in a thin film proton conductive polymer.
Typically, these thin ionomer films are treated as having the same properties as
measured for bulk membranes. However, in thin films, the substrate and air interfaces
affect film behavior. The high ratio of surface area to volume in films less than 100 nm
in thickness results in a large percentage of interfacial polymer that may have different
properties than what is observed for bulk films.

3
1.2. Significance of This Work
In other works, polyelectrolye thin film (5 nm thick) swelling has been attributed
to diffusion of water into the film.3, 4 Due to the very short diffusion lengths of ultra thin
films, calculated diffusion coefficients were five orders of magnitude lower than what is
generally seen in bulk films of similar materials.5 Such results are unreasonably low for
water diffusivity within ion-containing polymer films, necessitating a new method to
describe the dynamic interaction between water and polymer in thin polyelectrolyte films.
The goal of this research is determine the fundamental water sorption phenomena and
Figure 1-1. Simplified schematic of a hydrogen powered fuel cell. Hydrogen (H2) fuel is reduced by the catalyst layer (H2 2H+ + 2e-). The electrons are used in an external circuit and the proton exchange membrane conducts the protons from anode to cathode. At the cathode, the protons and electrons are used to reduce oxygen to water.2
Oxygen
A
Heat (85°C)
Hydrogen Fuel
Proton Exchange Membrane Anode Cathode
Electricity
Water H2

4
morphological features that may influence the conductivity of thin ion-containing
polymer films.
Ionic conductivity is an inherent material property that is influenced by the water
activity in ion-containing polymers. When a PEM is exposed to an increased relative
humidity, additional water is absorbed into the film.1 Certain block copolymer
morphologies allow for more expansion of the hydrophilic (ion conductive) phase, and
thus increased water absorption, when the material is humidified. Therefore, as thin films
adopt different morphologies, their conductivity is likely impacted. Establishing a
definitive correlation between phase-separated order and conductivity would be an ideal
way to guide the design of new PEMs.
The morphological structure and chain dynamics of the film affect the rate of
water absorption and the total amount of water absorbed. These properties vary with
thickness, so the conductivity of the films are likely influenced by film thickness. To
better understand the relationship between water uptake and conductivity, the following
points were investigated: the morphological structure differences between bulk and thin
(<100 nm) film polymers; the effect of film thickness and morphology on water uptake
and dynamic swelling; and the interactions between the ion-containing polymers and the
substrate.
The microscopic structure before swelling, the change in thickness during
swelling, and ion conductivity of thin films of ion-containing block copolymers were
examined. The initial morphology of the films under ambient conditions was established
by atomic force microscopy (AFM). Ellipsometry was used to measure the change in
thickness and film composition in real time to characterize the dynamic water uptake.

5
Ion conductivity was measured using AC impedance. This study will elucidate the
fundamental water uptake and morphological characteristics of thin films and will
compare their properties to their bulk analogs.
References
1. Eikerling, M., Water management in cathode catalyst layers of PEM fuel cells - A structure-based model. Journal of the Electrochemical Society 2006, 153, (3), E58-E70. 2. Ballard How Fuel Cells Work. http://www.ballard.com/About_Ballard/Resources/How_Fuel_Cells_Work.htm 3. Vogt, B. D.; Soles, C. L.; Lee, H. J.; Lin, E. K.; Wu, W. L., Moisture absorption and absorption kinetics in polyelectrolyte films: Influence of film thickness. Langmuir 2004, 20, (4), 1453-1458. 4. Vogt, B. D.; Soles, C. L.; Lee, H.-J.; Lin, E. K.; Wu, W.L., Moisture absorption into ultrathin hydrophilic polymer films on different substrate surfaces. Polymer 2005, 46, (5), 1635-1642. 5. Mangiagli, P. M.; Ewing, C. S.; Xu, K.; Wang, Q.; Hickner, M. A., Dynamic Water Uptake of Flexible Ion-Containing Polymer Networks. Fuel Cells 2009, 9, (4), 432-438.

6
Chapter 2
Literature Review
2.1. Introduction
This literature review will begin by discussing the nature of block copolymer
phase separation. These concepts will then be extended to the thin film regime with a
review of block copolymer thin film literature. Thin film background will include
information on the anomalous morphologies observed in the ultrathin film regime (< 100
nm) as well as kinetics of thin film diffusion, relaxation, and swelling. Since
spectroscopic ellipsometry was used to study thin film sorption and swelling, a general
review of ellipsometry is included, along with a review of research that uses ellipsometry
to characterize swelling. Atomic force microscopy is discussed as it applies to
morphological studies on ion-containing block copolymer thin films. Finally, a key piece
of literature data is discussed concerning the conductivity data of thin Nafion films,
which motivated the present work.
2.2. Block Copolymers
Diblock copolymers are composed of two chemically distinct polymer chains
covalently bonded to each other. The miscibility of the polymers is based on the
Helmholtz free energy of mixing. The polymer chains in the diblock, referred to as “A”
and “B” blocks, have a positive free energy of mixing, ΔGm > 0. To lower the free
energy of mixing, the system will tend to minimize the interfacial area between the A and

7
B blocks via phase separation. The repulsion between the two polymers manifests itself
as segregation into A and B rich phases having a range of three-dimensional
morphologies. The separation of the two components is called microphase separation,
usually with dimensions on the order of less than 100 nm: there is no macroscopic phase
separation (with dimensions of microns) because the two polymer units are covalently
bonded together. The three dimensional morphological structure depends mainly on the
degree of compatibility of A and B, and the molecular weight and volume fraction of
each block.1-6 Because these block copolymers naturally form repeating domains on the
nanoscale, they can be used in lithography to create very small and well organized
patterns on a substrate.7-10 Traditional block copolymer behavioral laws do not
necessarily extend to ionic block copolymer systems, but as there are no theoretical
alternatives to describe the phase behavior of ion-containing block copolymers with
strong ionic and/or dipolar interactions, traditional block copolymer principles are used to
make predictions about ion-containing block copolymer behavior.
Diblock copolymers are formed via a variety of synthetic procedures. Most
commonly, living polymerization is used to precisely control the molecular weight of
each block and to provide relatively low polydispersity. In living polymerization, the
only active species is at the chain end, so monomer B only adds to the end of a chain of
polymer A. When monomer A is fully polymerized, the addition of monomer B prompts
further growth from the living end of polymer A and polymerization of the B block
ensues. The initiation of the reaction is much faster than the monomer propagation,
giving simultaneous growth of all chains. The initiator concentration determines the

8
concentration of growing chains during the reaction, therefore controlling molecular
weight.11
2.2.1. Flory-Huggins Theory
What Maurice Huggins described as the statistics of “long chain molecules” in the
early 1940’s laid the groundwork for the modern understanding of block copolymer
thermodynamics. Paul Flory12 and Maurice Huggins13 simultaneously established the
thermodynamic principles of polymer-solution miscibility. To minimize the Helmholtz
free energy of mixing, a binary block copolymer will tend to minimize the interfacial area
between the A and B blocks. Microphase separation reduces the number of A-B contacts
which simultaneously lowers entropy. Qualitatively speaking, the thermodynamic
properties are determined by the chemical compatibility of the two polymers and the
number of contacts between them. Quantitatively, this translates into entropy (potential
number of contacts between the polymers) and enthalpy (energy difference between A
and B, multiplied by the number of interactions). Equation 2-1 shows the basic
relationship for Helmholtz free energy of mixing, ΔGm, with the Flory-Huggins equation
shown in 2-2.
(2-1) mmm STHG Δ−Δ=Δ
(2-2) [ ]ABBABBAAm NNNRTG χφφφ ++=Δ lnln
In diblock copolymers, the parameters that affect phase behavior are: i) the degree
of polymerization, N, (where N=NA+NB); ii) the composition of the copolymer, f = NA/N,

9
and iii) the Flory-Huggins parameter, χ. The χ parameter represents the free energy cost
per mole of monomer contacts between differing monomer units.6 χ is based on the
difference between the solubility parameters of the two materials, δA and δB, the molar
volume of a monomer unit, Vo, the gas constant, R, and temperature, T, as seen in
Equation 2-3:14
(2-3)
The product of χ and the degree of polymerization (or number of monomers in a
block), N, dictates the degree to which the A and B blocks segregate. Along with volume
fraction of each block, f, these parameters are the most important indicators of phase
behavior in the molten state.15, 16 The mean field phase diagram in Figure 2-1 17
demonstrates the resulting phase equilibria. The schematic shows that as the
compositional fraction of block A increases, different equilibrium structures are
observed. The phase morphologies that correspond to the letters L (lamellar), G (gyroid),
C (cylindrical), S (spherical), and Scp (close-packed spherical) in Figure 2-1 are
illustrated in Figure 2-2.
RTV BAo
2)( δδχ
−=

10
The mean field approximation assumes that the interaction one molecule
experiences is an average of all the possible configurations of the system. This theory
can be used to calculate the change in enthalpy and entropy to determine the free energy
of a system at a particular temperature. 2, 15, 20
Figure 2-1. Mean-field phase diagram for diblock copolymer melts. The ordered phases arelabeled as L (lamellar), G (gyroid), C (cylindrical), S (spherical), and Scp (close-packed spherical). The dot marks a mean-field critical point, and the dashed curves denote extrapolatedphase boundaries, which could not be calculated due to numerical limitations.18
S C G L G’ C’ S’
Figure 2-2. Three dimensional structures of ordered block copolymer phases including S(spherical), C (cylindrical), G (gyroid), and L (lamellar).19

11
The thickness of the molecular structures, also known as the domain spacing,
scales with molecular weight.2, 21, 22 Equation 2-4 exemplifies how the domain spacing,
D, is related to the characteristic monomer length, a, the degree of polymerization, N and
the Flory Huggins interaction, χ:2
(2-4) 61
32
χaND ∝
Simply put, longer polymer chains will create thicker lamellae (or other periodic
structures).
2.2.2. Application of Block Copolymer Theory to Ion-Containing Block Copolymers
Theoretical solubility parameters (δ) for ionic constituents used in block
copolymers, namely sulfonated polystyrene, have been experimentally determined.23
Experimentally derived δ values for ionic moieties are estimates because the Coulombic
interactions among ionic groups are not accounted for in the χ calculation24, 25 (Equation
2-3). The χ value for interaction between fully sulfonated polystyrene and polymethyl
methacrylate is 10.28, which, in itself, already falls in the strong segregation regime.
2.3. Thin Film Block Copolymers
Morphology in thin film block copolymers is greatly influenced by interfacial
surface energies and the symmetry of those energies. The focus of this section is on
substrate-supported thin films with an open air surface, where the system has asymmetric
surface energies. When the thickness of the film is less than the domain spacing of the
polymer (t < Lo), surface energetics dominate the entropic contributions in thin films.
Attraction of one component of the block copolymer to the surface will lead to a

12
concentrated A- or B-rich phase at the surface. Concentrations of each block will be
found at either surface based on their affinity for that interface. The substrate will induce
chain confinement of the polymer, while the air interface allows for conformational
expansion and lowered surface tension.26
It has been established that in bulk form diblocks naturally phase separate to form
structures that reduce the interaction between the chemically different polymers, forming
an energetically favorable morphology. In thin-film block copolymers, the phase
separated morphology is more ordered because of the structural support of the substrate.
Thin films have a high surface area to volume ratio, so a large portion of the polymer is
in contact with either a substrate or air interface. These interfaces affect polymer
mobility and confinement and the interfaces also affect how block copolymers adopt
various morphologies in thin films. Figure 2-3 26 shows a schematic of the distribution of
A and B rich blocks as the thickness of the film decreases from the characteristic domain
size, Lo.

13
As the thickness of a block copolymer film decreases from Lo, the phase separated
A and B domains form unique structures based on the symmetry of domains at a given
thickness. The blocks will still separate into A- and B-rich phases based on preferential
wetting: the polymer will segregate to the surface that has the most compatible surface
energy (depicted as S1 and S2 in Figure 2-3) to minimize the entropic expense.26-29
When a block preferentially wets either surface, as seen in the half-lamella
structure in Figure 2-3, the film is anti-symmetric at equilibrium. The intermediate
structures in anti-symmetric films are stable only when the thickness is some increment
of the lamellar spacing, where t = (n + ½)Lo for n = 1, 2, 3, 4. For symmetric films like
the full lamellar form at t = Lo, the films are stable at increments of t = nLo.26 The
Figure 2-3. Diblock copolymer thin film morphologies. (a) Schematic representation of volume symmetric diblock with A (light) and B (dark) type segments. (b) Diagram of BC film system in cross section indicating the bottom (1) and top (2) surfaces, with surface interaction energies S1 and S2, respectively. (c) Summary of diblock thin film morphologies as film thickness decreasesfrom L0. These calculated cross sections indicate the density of B-type segments, i.e., Black = 100% B, white =100% A. These structures are referred to in the text with the abbreviationsincluded under each diagram. 26
FL: symmetric surface-parallel full lamella
AFL: anti-symmetric surface-parallel lamella
AHY: anti-symmetric hybrid structure
HL: half-lamella
HY: symmetric hybrid structure
PL: surface-perpendicular lamellae

14
symmetry of surface energies plays a major role in the morphology of thin film block
copolymers. For most applications, films are not sandwiched between identical surfaces
and the most common thin film system is substrate supported on one face, creating
asymmetric surface energies and asymmetric structures.26, 29
When dealing with thin films, it is important to consider the effects of the
substrate and air interface on film behavior, especially morphology, chain mobility, and
thermodynamics.30 When polymer chains selectively deposit on the substrate,
conformational entropy and surface tension are reduced. Not only is the mobility and
natural reptation of the polymer hindered at this solid interface, but the substrate can also
have an attractive, repulsive, or neutral interaction with the polymer. This concentration
of material at the substrate creates a greater amount of free volume at the free surface,31
affecting the glass transition temperature (Tg),1, 32-35 relaxation time,1, 31, 34, 36-39 small
molecule diffusivity,28, 31, 36-45 physical aging,46 and swelling characteristics.30, 39, 43, 47-49
The high surface area to volume ratio of thin films creates a large percentage of this
unique interfacial polymer.
2.3.1. Small Molecule Diffusion in Thin Polymer Films
Figure 2-4 50 depicts the two types of diffusion in polymers. The most common
case for softer polymers is Fickian diffusion, where the solvent molecules penetrate the
free surface based on a concentration gradient.39, 44, 50, 51 In Case II diffusion, most of the
polymer maintains its glassy state, with a layer of swollen gel-like material only at the
free surface in contact with the diffusing medium, as depicted in Figure 2-4b. Case II
diffusion is usually dependent on temperature and film thickness. In thin films,

15
relaxation at the glassy to gel polymer interface is the main determinant of diffusion
character. The resistance to diffusion in the swollen fraction of the polymer increases as
that interface propagates into the material. The diffusion resistance is negligible in thin
films due to the short diffusion lengths encountered.50 A material can follow Fickian,
Case II diffusion, or, often, some combination of the two.40, 41, 50, 52, 53
If a solvent does not solvate the polymer, it will only swell the polymer. A good
solvent, with a similar solubility parameter as the polymer matrix, will swell the polymer
and also induce chain relaxation and disentanglement at the free surface.6, 50, 54
Corresponding dissolution and swelling equations for each case can be found in Papanu,
et. al.,50 but those details are beyond the scope of this review.
As the film thickness approaches the radius of gyration (Rg) of the polymer,
confinement effects are observed at the substrate interface, but even for films at
thicknesses less than Rg, Gaussian chain statistics still apply.43 Chain confinement
hinders both the diffusivity of chains and small molecules such as water. The calculated
Figure 2-4. The two types of diffusion are shown (a) Fickian diffusion and (b) anomalous Case II diffusion. 50

16
diffusivity of water decreased by orders of magnitude in relation to film thickness based
on Fickian diffusion coefficients in Equation 2-5 30, 40, 43
(2-5)
where Mt is the mass uptake of water at time t, M∞ is the mass uptake of water at
equilibrium, t is time, d is film thickness, and D is diffusion coefficient. Eq. 2-5 is a
simplified relationship for short diffusion times, and is used to calculate the mass uptake
of water from the initial linear portion of a solvent uptake curve only. It does not
describe diffusion when the mass uptake plateaus and the material equilibrates with its
environment. Due to the very short diffusion lengths of ultra thin films, the calculated
diffusivity values are decidedly low. Based on calculations from Equation 2-5, ultra thin
films (<100 nm) exhibit diffusion coefficients on the order of 10-13 cm sec-1, as seen in
Figure 2-5. These values are five orders of magnitude less than diffusivity in bulk ionic
polymer films,55 which is not feasible for water diffusivity within ionic polymer films,
necessitating a new method to describe the dynamic interaction between water and
polymer in thin polyelectrolyte films. In reality, the relationship between diffusion and
film thickness is not accurately described with one simple diffusion model. Chain
relaxation due to plasticization from increased solvent content counterbalances the
diminished diffusion rate which often necessitates a two part diffusion model of small
molecules in polymer films.30, 56, 57
The effects of chain relaxation on diffusion have been described in bulk polymer
films 30 as well as thin films. Relaxation is especially significant in the study of solvent
πDt
dMM t 2
=∞

17
sorption in thin polymer films because of the confinement at the substrate interface. To
determine the significance of the polymer-substrate interaction, Tan, et. al. 58 used X-ray
reflectivity techniques to compare moisture absorption in hygroscopic polyimide on two
types of substrates: native oxide on Si wafers and wafers coated with a silane coupling
agent. For films of identical thickness, the silane coupling agent, γ-
aminopropyltrimethoxysilane (APTMS), reduced the total amount of water absorption,
leading to the conclusion that a hydrophilic substrate, the SiOx, creates a more humidified
layer at the substrate interface. Subsequently, their ultrathin films (7-100 nm) were
considered to have a bilayer structure including an interfacial and bulk region.58 Their
observation implies that the polymer, which experiences chain confinement due to the
substrate interface, is plasticized by the accumulation of more moisture at the substrate
interface.
Figure 2-5. Water diffusion coefficients into thin films as a function of poly(4-ammonium styrenesulfonic acid) film thickness as determined by () Fickian and () two-stage absorption models. 43

18
Tan, et. al. also found that, when exposed to 80% relative humidity (RH) for 16
hours, thinner films had a higher thickness increase relative to their dry thicknesses
100*(tRH-tdry)/tdry, as seen in Figure 2-6. This effect held true for both bare and APTMS
coated substrates, but a physical explanation for this anomaly was not explored in the
paper. For a polymer which absorbs only up to 5 wt % water, it was surprising to find
this effect. In studies of more hydrophilic polymers, there is no change in water
absorption for a range of film thicknesses of 3-200 nm (30-2000 Å).43
Vogt, et al. 30 performed a similar study with a different polymer, measuring
water uptake of various thickness poly(vinyl pyrrolidone) (PVP) films on hydrophilic and
hydrophobic substrates. They, too, observed reductions in the absorption of water for the
films less than 100 nm thick on hydrophobic substrates. Using x-ray reflectivity and
Figure 2-6. Percentage increase in film thickness induced by a 16-h exposure to an 80% RH environment vs. thickness of the same film measured under dry, evacuated conditions. Filmsprepared with a silane coupling agent () and without a silane coupling agent (). All measurements at 23ºC. 58

19
quartz crystal microbalance (QCM), the gravimetric uptake of water was observed in
PVP films 3-200 nm thick, on native oxide on silicon as well as silicon wafers coated
with hydrophobic hexamethyldisilazane (HMDS). The volume fraction of water at
equilibrium swelling in saturated vapor for the thickest film (150 nm) on HMDS was
identical to that of films on silicon’s native oxide, as seen in Figure 2-7. Despite the
thickness effect of the hydrophobic substrate treatment on the uptake of water, films on
hydrophilic SiOx absorbed the same volume fraction of water (0.47) for thicknesses
varying from 3 to 150 nm. Similar results were observed for a thin polyelectrolyte film
of poly(4-ammonium styrenesulfonic acid) in Figure 2-8.43 Both QCM and X-ray
reflectivity showed a similar water uptake for thicknesses ranging from 2 to 120 nm on
silicon (oxide) substrates.
Figure 2-7. Influence of poly(vinyl pyrrolidone) (PVP) film thickness on moisture absorption asmeasured by reflectivity. The water volume fraction absorbed in the films from saturated vapor isdependent for the thin films upon the substrate, either () SiOx or () HMDS treated silicon. The dashed line is a guide to show that the absorption in PVP on the silicon oxide substrate isindependent of film thickness.30

20
The interfacial concentration of water was also affected by relative humidity. The
absorption isotherm for PVP films on HMDS samples showed a discontinuity in the
volume fraction of water absorbed after 40% relative humidity due to plasticization of the
polymer, which corresponds to the transition from a glassy to rubbery state.35, 53, 59 At
this point, the polymer is relaxing as it swells and is plasticized with water. Figure 2-9
shows calculated diffusion coefficients of small molecules (using Eq. 2-5).
Figure 2-8. Equilibrium water absorption in different thickness poly(4-ammonium styrenesulfonic acid) films as determined by () XR and () QCM measurements. 43

21
Equation 2-5 describes diffusivity based on the slope of the mass uptake (Mt/M∞) versus
time1/2/thickness during initial diffusion into the film. This analysis does not represent
the additional absorption of water due to polymer relaxation or the behavior of the
polymer once it is plasticized.
Even in films as thin as 5 nm, there is little difference in diffusivity for films on
HMDS versus SiOx substrates. Small molecule diffusion in other thin film systems have
shown no dependence on polymer-substrate affinity in 50 nm thick films.42 The complex
interactions involved in these systems between the polymers and the surface still lend
much contention as to how the heterogeneity of thin films contributes to their absorption
properties.51, 60
Figure 2-9. Effective water diffusion coefficients in PVP films. The diffusivity decreases bythree orders of magnitude as the film thickness decreases from 155 to 5.6 nm. There is nodiscernable effect of the substrate, () SiOx or () HMDS, on the diffusivity. 30

22
2.3.2. Thin Film Diffusion and Relaxation
During solvent sorption into a polymer, two processes occur simultaneously: the
solvent diffuses into the free volume of the polymer, and the polymer chains relax as they
are plasticized by the solvent. The plasticization process subsequently allows further
solvent absorption. This relationship between diffusion and polymer relaxation can be
described by the Berens-Hopfenberg model.61, 62 The model distributes the total solvent
mass (Mt) absorbed by the polymer between mass attributed to Fickian diffusion (Mt,F)
and extra mass acquired during relaxation (Mt,R) in Equation 2-6:
(2-6) Mt = Mt,F + Mt,R
The first order rate equation derived from this relationship exemplifies the
underlying connection between diffusion and relaxation: relaxation leads to more
diffusion until the mass uptake of water reaches equilibrium at M∞,R. This equation can
be rearranged to solve for the relaxation rate constant, kR through Equations 2-7, 2-8, and
2-9 61-63:
(2-7) )( ,,,
RtRRRt MMk
dtdM
−= ∞
(2-8) dtkMM
dMR
RtR
Rt ⋅=−∞ )( ,,
,
(2-9) )exp(,, ctkMM RRtR +−=−∞
Now it is possible to solve for the ultimate mass uptake due to relaxation can via
Equation 2-10 61-63:
(2-10) [ ])exp(1,, tkMM RRRt −−= ∞

23
Another consideration of ultrathin film dynamics that is coupled with diffusion is
the relaxation profile of ultrathin films. Thin films of poly(isobutyl methacrylate) and
poly(2-vinyl pyridine), both of which have a relatively strong interactions with native
silicon oxide, showed no difference in diffusion for films as thin as 50 nm, indicating that
polymer-substrate interaction effects extend less than 40 nm into the bulk of the film.31
The substrate effects extend to half of one lamellar period of the film.
In ultrathin films, Tg decreases because the high density of chains at substrate
surface reduces surface tension and conformational entropy.28, 64 This substrate-chain
interaction would create more free volume at the free surface, in turn lowering the glass
transition temperature and number of chain entanglements and increasing chain mobility
and diffusivity.6, 32, 64 The value that represents the penetration of surface effects is Rg.
Interfacial effects are usually felt no more than two times the radius of gyration of the
polymer. 31
It has been established that the unique structures of thin and ultrathin films affect
the polymer dynamics, and, naturally, that includes polymer self-diffusion and relaxation.
The anomalous relaxation of thin films is inherently linked to the change in Tg, and both
have been extensively studied.1, 28, 32-34, 37, 46, 51, 60, 65, 66 In bulk melts, the glass transition
temperature is often characterized using rheological techniques, which are not
appropriate for thin film characterization. Techniques to measure the Tg of thin films
include ellipsometry,46, 47, 49 x-ray reflectivity,2, 43, 48, 58, 60 optical birefringence,65 neutron
scattering,43, 60 second harmonic generation,31, 33, 34, 65 and optical waveguide
spectroscopy.31

24
As previously established, the polymer chains in thin films experience different
levels of molecular motion and confinement based on their location relative to either
interface. Chains with significant free volume (as at the free surface) will relax much
faster than chains experiencing confinement (at the substrate surface). Subsequently,
thin film polymers will experience a larger distribution of relaxation times as compared
to bulk films.1, 31, 33, 34, 37, 51, 66 This broadening is especially evident on the shorter
relaxation time scales which has implications for small molecule diffusion, and,
consequently, swelling. Figure 2-1031 shows measured distributions of relaxation times
for 23 and 520 nm thick polymer films using SHG. Relaxation times less than 10
seconds show a significantly broader distribution. Figure 2-1066 is another example of
thickness dependent relaxation for poly(vinyl acetate) (PVAc) as characterized by
broadband dielectric spectroscopy. Relaxation times become more varied as film
thickness decreases because of the gradient in the density of polymer chains in thin films.
Figure 2-10. Discrete distributions of relaxation times for () 23 and () 520 nm thick films at 98ºC (5º above Tg). Curves are drawn to guide the eye. 31

25
Since interfacial effects have a great influence on thin film behavior, studying
film relaxation and small molecule diffusion as a function of film thickness will aid in
understanding thin film ion conductivity.
2.4. Thin Films of Ion-containing Polymers: Morphology and Conductivity
Thin film ion conductivity is an unexplored field with deep potential: little
attention has been given to the area of thin film (< 100 nm) ion-containing block
copolymer swelling and conductivity. At the interface between the catalyst and PEM
layers in a fuel cell membrane electrode assembly, thin ionic polymer films strike a
balance that facilitates conductivity and gas diffusion, both of which are required for high
performance fuel cell electrodes.67, 68 The study of thin ionic polymer films unites two
developed but not fully understood fields: properties unique to thin film polymers and
fundamental mechanisms of ion conductivity. Morphology and conductivity are
interconnected in ion-containing block copolymers because the structural arrangement of
ionic groups controls ionic movement.69
Thin film ionic block copolymers have been studied more in recent years for their
applications as electrochemical sensors and catalysts,63, 70-75 to increase ion-exchange
selectivity,70, 76, 77 and as conductive coatings to reduce Schottky barriers between
materials with different resistivities.67, 68 Despite this wide range of studies, the
underlying morphological influence on conductivity in thin films of ion containing
polymers has not been fully described. Bertoncello, et al., who have extensively studied
thin films of layered amphiphiles (Langmuir-Schaefer films) including Nafion® for
sensing applications,71-75 have also investigated thin film morphologies, yet their work

26
mostly compares the morphological and voltammetric effects of cation loading. The
research did not examine the fundamental effects that film thickness has on morphology
of bulk and thin film forms of ion conducting polymer species. Figure 2-1171 shows
morphologies obtained via AFM. The thickness of these films was in the range of 13-17
nm and they were deposited on an oxidized silicon surface. Figure 2-11a shows a largely
uniform surface with only several void spaces. As ionic compounds (ferrocene derivative
ferrocenyltrimethylammonium cation, FA+ (Figure 2-11b), or tris(2,2’-
bipyridyl)ruthenium(II), Ru(bpy)32+
(Figure 2-11c))71 are added to the solution a
morphology more typical of bulk Nafion® forms,78 exhibiting ion cluster-like formations.
Dilute solutions of Nafion® were spin coated onto flat substrates at thicknesses of
5 to 20 nm. AFM was used to characterize Nafion® morphology on indium tin oxide
(ITO) substrates. Figure 2-12a shows a 135 nm thick layer of ITO on a glass surface (Z
range 10.6 nm), and Figure 2-12b shows a 7 nm thick layer of spin cast Nafion® on ITO.
The bumpy ITO surface affects the morphology of the Nafion® polymer, but Figure 2-
Figure 2-11. AFM topography images (1 μm x1 μm) of Nafion® LS films in air: 10 layers deposited on a silicon oxide substrate (a) before and (b) after loading in 5 x 10⁻⁴ M FA+ and (c) 5 x 10⁻⁴ M Ru(bpy)3
2+.71

27
12b shows that the film has smoothed over and evenly coated the rough surface. The
AFM height image shows a co-continuous “island” morphology of phase separated
sulfonated domains (Z range 7.5 nm). Figure 2-12c shows the electronic nature of Figure
2-12b, with the uncovered ITO appearing in red and Nafion® as yellow-green.
Figure 2-11 shows that even for the same material at similar thicknesses, a range
of morphologies still exist. The wide array of observed morphologies can be attributed to
differing substrate roughness, surface energy, and processing conditions yet initial studies
show that there is still a vast range of forms that these thin films may assume. These
different morphologies, no doubt, will lead to differences in ion conductivity.
Yasuda, et al.67 provided the initial report on thin film ion conductivity via
impedance spectroscopy, which is discussed further in Chapter 6. They found that the
film conductivity decreased as the thickness of the film on silicon decreased. As
conductivity is an intrinsic material property, it is not anticipated to change for films with
varying thickness, but Yasuda, et al. found a logarithmic relationship that extended from
10 nm to 100 μm between the conductivity of thin film recast Nafion®. It is unknown
what interfacial effects could be taking place over such large of a range of thicknesses.
Figure 2-12. Atomic force micrograph of (a) 135 nm thick ITO film (tapping mode) and (b, c) 7nm thick Nafion film on ITO (tapping mode). (c) is a color coded version of (b) which showsuncoated ITO in red.73
(a) (b) (c)

28
One possibility is that thin films absorb less water, thus lowering conductivity, providing
the basis for this investigation. But in literature, thin films have been shown to expand by
more of their original thickness than thicker films, as seen in Figure 2-6. The relationship
between thin film swelling and conductivity is explored in Chapters 5 and 6.
2.5. Ellipsometry
Ellipsometry is a technique that uses reflection and polarization of light to
determine optical properties of thin film materials. More specifically, it involves the
refraction (and ultimately, reflection) of light as it passes through the interfaces that exist
between layers of a material, as seen in Figure 2-13. Ellipsometry can be measured using
either a single wavelength of light or a spectrum of light, as in spectroscopic
ellipsometry. Spectroscopic ellipsometry gives more information about a material than
single wavelength ellipsometry as it interacts with a wide range of photon energies.
Figure 2-1379 shows the angle of incidence of light Φi, reflected angle Φr, transmitted
angle Φt, and the refractive index of air n0, and the refractive index of the first layer of a
material, n1.
Figure 2-13. Reflection of light off of a surface showing angle of incidence, reflection and transmission. Refractive index of air, n0, and material, n1.

29
Ellipsometry measures the polarization of light as it passes through layers of a
material with different refractive indices. Fresnel reflection coefficients rs and rp are
measurements of reflected light as it oscillates perpendicular (s) and parallel (p) to the
plane of incidence, and are orthogonal to each other. The schematic in Figure 2-14
shows how the p and s components of a wave (wave 1 and 2, respectively, in the figure)
combine to form an ellipse (from which the name ellipsometry is derived) while Figure 2-
15 shows the polarization of the s and p planes as light is reflected off of a planar surface.
The fundamental ellipsometry relationship is given in Equation 2-13 by the ratio
of the reflection coefficients, which relates the amplitude and phase of a light wave:
Figure 2-14. Orthogonal waves combined to demonstrate elliptical polarization of light.79
Figure 2-15. Typical ellipsometry configuration, where linearly polarized light is reflected fromthe sample surface and the polarization change is measured to determine the sample response.79

30
tan(ψ) represents the wave amplitude ratio upon reflection and Δ represents the phase
shift of light upon reflection. Because an ellipsometer measures these components
relative to each other, it is an extremely accurate tool.49, 79-83
(2-11)
The refractive index is composed of both real and imaginary components, where N = (n +
ik), ε = (ε1+ iε2), and ε = N2. The imaginary (i-based) component of refractive index
includes an extinction coefficient, k, which is related to the depth of light penetration (i.e.
if the material is fully transparent or a perfect vacuum, k = 0). The penetration depth is
given by Equation 2-12. The complex dielectric function is determined by the complex
refractive index via Equations 2-13.
(2-12)
(2-13) ε= N2 ε
1= n2 – k2 ε
2= 2nk
These parameters can all derive essential information about the optoelectrical properties
of individual layers of a material, making ellipsometry a powerful characterization tool
for characterizing thickness, complex refractive index, and complex dielectric function.
Ellipsometry is a commonly used for real time dynamic measurements of a
material as it is exposed to a changing environment. The dual rotating compensator
multichannel ellipsometer, the type used in this study, was first introduced in 2004.84
The experimental setup of an ellipsometer allows for a measurement to be made through
ΔΨ== i
s
p err
)tan(ρ
kDp π
λ4
=

31
non-polarizing windows, so a material can be placed in a controlled environment cell and
optoelectronic properties can be measured in real time as the conditions inside the sample
cell change. An example schematic of a controlled environment cell is given in Figure 2-
16.85 The angle of incidence of light is optimized so as not to polarize the light before it
reflects off the sample surface.
The ability to do in-situ measurements with high temporal resolution makes
ellipsometry an excellent tool for measuring thickness changes during material deposition
80, 82, 86 and swelling.47, 49, 58, 80, 81, 85, 87, 88 In the same way that water uptake was derived
via gravimetric measurements in Equation 2-5,40, 52 water uptake can also be estimated by
thickness increase during swelling via in situ dynamic ellipsometry.63 As the film
increases in volume, ft, due to the change in thickness, dt, multiplied by area, A, during
swelling, and volume and mass are related via density, then a relationship between mass,
M, and thickness, d, can be assumed via a proportionality constant, C as in Equations 2-
15 and 2-16.
(2-15) tt dAf ⋅=
(2-16) dCM ⋅=
Figure 2-16. Schematic diagram of the sample cell for ellipsometric measurements. 85

32
The proportionality constant C then relates the mass uptake at times t, Mt, and at
equilibrium, M∞, to the diffusion at time 0, t, and equilibrium via:
(2-17) )( 0ddCM tt −=
(2-18) )( 0ddCM −= ∞∞
The same way the gravimetric uptake of water can be calculated by the ratio of diffusion
coefficients, volumetric water uptake can be derived by determining the change in
refractive index. Volumetric water uptake can be calculated by matching the refractive
index of the swollen film to a mixed refractive index of water and the dry polymer.63
(2-19) 0
0
dddd
MM tt
−−
≈∞∞
(2-20) 0nn
nnMM tt
−−
≈∞
∞
∞
The refractive index of the swollen polymer can be used to directly calculate the volume
fraction of water in the film using the Bruggemann mixing equation.89
(2-21) 22
22
/22
22
22 polwater
polwatervv
pol
pol
nnnn
nnnn
+
−=
+
−φ
Where n is the dry refractive index, nwater is the refractive index of water, npol is the
refractive index of the dry polymer, and φv/v is the volume fraction of water in the
polymer. The value for the refractive index of the swollen material is determined by
ellipsometric measurements and the equation can be solved for the volume fraction of
water in the polymer.85
Figure 2-17 shows the phase (Ψ) and amplitude (Δ) shifts for
poly(methoxytriethylene glycol acrylate) (P(MTGAr-AA)) at relative humidities from 0

33
to 95%. As the polymer film absorbs water, the peak in the phase and amplitude shift to
longer wavelengths, and therefore lower photon energies (eV). This shift means that
light interacts more with the polymer as the material becomes denser with added water.
Figure 2-18 shows the increase in thickness and decrease in refractive index as relative
humidity is increased. As the relative humidity increases, the polymer swells and a larger
portion of the material is composed of water. Subsequently, the thickness increases and
the refractive index decreases because the refractive index of water is less than that of the
polymer, nwater = 1.333 < npol = 1.512.
Figure 2-17. Ellipsometric angles Ψ and Δ as a function of wavelength for a series of humiditiesfor P(MTGA-r-AA).85

34
2.6. Summary
This chapter summarized the important features of block copolymers and the
behavioral differences between thin and bulk films. Thin film behavior includes the
importance of polymer-substrate interactions, diffusion, relaxation, and swelling.
References
1. Agra, D. M. G.; Schwab, A. D.; Kim, J. H.; Kumar, S.; Dhinojwala, A., Relaxation dynamics of rubbed polystyrene thin films. Europhysics Letters 2000, 51, (6), 655-660. 2. Bates, F. S.; Fredrickson, G. H., Block Copolymer Thermodynamics - Theory and Experiment. Annual Review of Physical Chemistry 1990, 41, 525-557. 3. Noshay, A., Block copolymers : overview and critical survey Academic Press: 1977; p 516. 4. Painter, P. C., Essentials of Polymer Science and Engineering. DEStech Publications, Inc.: 2008; p 525. 5. Painter, P. C., Fundamentals of polymer science : an introductory text 2nd ed.; 1997; p 478. 6. Rubinstein, M.; Colby, R., Polymer Physics. Oxford University Press: Oxford, 2003; p 433. 7. Edwards, E. W.; Montague, M. F.; Solak, H. H.; Hawker, C. J.; Nealey, P. F., Precise control over molecular dimensions of block-copolymer domains using the interfacial energy of chemically nanopatterned substrates. Advanced Materials 2004, 16, (15), 1315-+. 8. Stoykovich, M. P.; Nealey, P. F., Block copolymers and conventional lithography. Materials Today 2006, 9, (9), 20-29.
Figure 2-18. Ellipsometric thickness and index of refraction of P(MTGA-r-AA) as a function of humidity. The dashed line is the refractive index estimation determined from measured thicknessvalues.85

35
9. Wang, Q.; Nath, S. K.; Graham, M. D.; Nealey, P. F.; de Pablo, J. J., Symmetric diblock copolymer thin films confined between homogeneous and patterned surfaces: Simulations and theory. Journal of Chemical Physics 2000, 112, (22), 9996-10010. 10. Yang, X. M.; Peters, R. D.; Nealey, P. F.; Solak, H. H.; Cerrina, F., Guided self-assembly of symmetric diblock copolymer films on chemically nanopatterned substrates. Macromolecules 2000, 33, (26), 9575-9582. 11. Wang, Q., MatSE 575: Functional Polymeric Materials. In Penn State University: 2007. 12. Flory, P. J., Thermodynamics of High Polymer Solutions. The Journal of Chemical Physics 1941, 9, (8), 660. 13. Huggins, M. L., Solutions of Long Chain Compounds. The Journal of Chemical Physics 1941, 9, (5), 440. 14. Maynard, H. D.; Lyu, S. P.; Fredrickson, G. H.; Wudl, F.; Chmelka, B. F., Syntheses of nanophase-segregated poly(vinyl acetate)-poly(dimethylsiloxane) and poly(vinyl acetate)-poly(styrene) graft copolymers. Polymer 2001, 42, (18), 7567-7574. 15. Leibler, L., Theory of Microphase Separation in Block Copolymers. Macromolecules 1980, 13, (6), 1602-1617. 16. Matsen, M. W.; Schick, M., Stable and Unstable Phases of a Diblock Copolymer Melt. Physical Review Letters 1994, 72, (16), 2660-2663. 17. Bates, F. S.; Maurer, W.; Lodge, T. P.; Schulz, M. F.; Matsen, M. W.; Almdal, K.; Mortensen, K., Isotropic Lifshitz Behavior in Block Copolymer-Homopolymer Blends. Physical Review Letters 1995, 75, (24), 4429-4432. 18. Matsen, M. W.; Bates, F. S., Block copolymer microstructures in the intermediate-segregation regime. Journal of Chemical Physics 1997, 106, (6), 2436-2448. 19. Wiesner http://people.ccmr.cornell.edu/~uli/pages/research.htm. 20. Bates, F. S., Polymer-Polymer Phase-Behavior. Science 1991, 251, (4996), 898-905. 21. Hashimoto, T.; Tanaka, H.; Hasegawa, H., UNIFORMITY OF MICRODOMAIN SIZE OF BLOCK POLYMERS AS COMPARED WITH UNIFORMITY OF THEIR MOLECULAR-WEIGHTS. Macromolecules 1985, 18, (10), 1864-1868. 22. Douzinas, K. C.; Cohen, R. E.; Halasa, A. F., EVALUATION OF DOMAIN SPACING SCALING LAWS FOR SEMICRYSTALLINE DIBLOCK COPOLYMERS. Macromolecules 1991, 24, (15), 4457-4459. 23. Lu, X. Y.; Weiss, R. A., Development of miscible blends of Bisphenol A polycarbonate and lightly sulfonated polystyrene ionomers from intrapolymer repulsive interactions. Macromolecules 1996, 29, (4), 1216-1221. 24. Zhou, N. C.; Xu, C.; Burghardt, W. R.; Composto, R. J.; Winey, K. I., Phase behavior of polystyrene and poly (styrene-ran-styrene sulfonate) blends. Macromolecules 2006, 39, (6), 2373-2379. 25. Park, M. J.; Balsara, N. P., Phase behavior of symmetric sulfonated block copolymers. Macromolecules 2008, 41, (10), 3678-3687. 26. Fasolka, M. J.; Mayes, A. M., Block copolymer thin films: Physics and applications. Annual Review of Materials Research 2001, 31, 323-355. 27. Mayes, A. M.; Russell, T. P.; Bassereau, P.; Baker, S. M.; Smith, G. S., Evolution of Order in Thin Block-Copolymer Films. Macromolecules 1994, 27, (3), 749-755. 28. Frank, B.; Gast, A. P.; Russell, T. P.; Brown, H. R.; Hawker, C. J., Polymer mobility in thin films. Macromolecules 1996, 29, (20), 6531-6534. 29. Fasolka, M. J.; Banerjee, P.; Mayes, A. M.; Pickett, G.; Balazs, A. C., Morphology of ultrathin supported diblock copolymer films: Theory and experiment. Macromolecules 2000, 33, (15), 5702-5712. 30. Vogt, B. D.; Soles, C. L.; Lee, H.-J.; Lin, E. K.; Wu, W.-l., Moisture absorption into ultrathin hydrophilic polymer films on different substrate surfaces. Polymer 2005, 46, (5), 1635-1642.

36
31. Hall, D. B. Experimental studies of relaxation phenomena and diffusion in thin and ultrathin polymer films. Ph.D. Thesis. . Ph.D. Dissertation, Northwestern University 1999. 32. de Gennes, P. G., Glass transitions in thin polymer films. European Physical Journal E 2000, 2, (3), 201-203. 33. Hall, D. B.; Hooker, J. C.; Torkelson, J. M., Ultrathin polymer films near the glass transition: Effect on the distribution of alpha-relaxation times as measured by second harmonic generation. Macromolecules 1997, 30, (3), 667-669. 34. Mundra, M. K.; Ellison, C. J.; Rittigstein, P.; Torkelson, J. M., Fluorescence studies of confinement in polymer films and nanocomposites: Glass transition temperature, plasticizer effects, and sensitivity to stress relaxation and local polarity. European Physical Journal-Special Topics 2007, 141, 143-151. 35. Buera, M. D.; Levi, G.; Karel, M., Glass-Transition in Poly(vinyl pyrrolidone): Effect of Molecular-Weight and Dilutents. Biotechnology Progress 1992, 8, (2), 144-148. 36. Fujita, H.; Kishimoto, A., Diffusion-Controlled Stress Relaxation in Polymers. 2. Stress Relaxation in Swollen Polymers. Journal of Polymer Science 1958, 28, (118), 547-567. 37. Hall, D. B.; Miller, R. D.; Torkelson, J. M., Molecular probe techniques for studying diffusion and relaxation in thin and ultrathin polymer films. Journal of Polymer Science Part B: Polymer Physics 1997, 35, (17), 2795-2802. 38. Kishimoto, A.; Fujita, H., Diffusion-Controlled Stress-Relaxation in Polymers, I. Kolloid Zeitschrift 1956, 1, (150), 11. 39. Kishimoto, A.; Hiroshi, F., Diffusion-controlled stress relaxation in polymers. III. Stress relaxation in a swelling polymer. Journal of Polymer Science 1958, 28, (118), 569-585. 40. Burnett, D. J.; Garcia, A. R.; Thielmann, F., Measuring moisture sorption and diffusion kinetics on proton exchange membranes using a gravimetric vapor sorption apparatus. Journal of Power Sources 2006, 160, (1), 426-430. 41. Edwards, D. A., Non-Fickian diffusion in thin polymer films. Journal of Polymer Science Part B-Polymer Physics 1996, 34, (5), 981-997. 42. Hall, D. B.; Torkelson, J. M., Small molecule probe diffusion in thin and ultrathin supported polymer films. Macromolecules 1998, 31, (25), 8817-8825. 43. Vogt, B. D.; Soles, C. L.; Lee, H. J.; Lin, E. K.; Wu, W. L., Moisture absorption and absorption kinetics in polyelectrolyte films: Influence of film thickness. Langmuir 2004, 20, (4), 1453-1458. 44. Vrentas, J. S.; Duda, J. L., Molecular-Diffusion in Polymer-Solutions. Aiche Journal 1979, 25, (1), 1-24. 45. Vrentas, J. S.; Jarzebski, C. M.; Duda, J. L., Deborah Number for Diffusion in Polymer-Solvent Systems. Aiche Journal 1975, 21, (5), 894-901. 46. Baker, E. A.; Rittigstein, P.; Torkelson, J. M.; Roth, C. B., Streamlined Ellipsometry Procedure for Characterizing Physical Aging Rates of Thin Polymer Films. Journal of Polymer Science Part B-Polymer Physics 2009, 47, (24), 2509-2519. 47. Papanu, J. S.; Hess, D. W.; Bell, A. T.; Soane, D. S., In-Situ Ellipsometry to Monitor Swelling and Dissolution of Thin Polymer Films. Journal of the Electrochemical Society 1989, 136, (4), 1195-1200. 48. Singh, A.; Mukherjee, M., Swelling dynamics of ultrathin polymer films. Macromolecules 2003, 36, (23), 8728-8731. 49. Sirard, S. M.; Green, P. F.; Johnston, K. P., Spectroscopic ellipsometry investigation of the swelling of poly(dimethylsiloxane) thin films with high pressure carbon dioxide. Journal of Physical Chemistry B 2001, 105, (4), 766-772. 50. Papanu, J. S.; Soane, D. S.; Bell, A. T.; Hess, D. W., Transport Models for Swelling and Dissolution of Thin Polymer-Films. Journal of Applied Polymer Science 1989, 38, (5), 859-885. 51. Jones, R. A. L., The dynamics of thin polymer films. Current Opinion in Colloid & Interface Science 1999, 4, (2), 153-158.

37
52. Sun, Y. M., Sorption/desorption properties of water vapour in poly(2-hydroxyethyl methacrylate) .2. Two-stage sorption models. Polymer 1996, 37, (17), 3921-3928. 53. Crowley, K. J.; Zografi, G., Water vapor absorption into amorphous hydrophobic drug/poly(vinylpyrrolidone) dispersions. Journal of Pharmaceutical Sciences 2002, 91, (10), 2150-2165. 54. Hansen, C. M., Hansen solubility parameters : a user's handbook CRC Press: Boca Raton, 2007; p 519. 55. Mangiagli, P. M.; Ewing, C. S.; Xu, K.; Wang, Q.; Hickner, M. A., Dynamic Water Uptake of Flexible Ion-Containing Polymer Networks. Fuel Cells 2009, 9, (4), 432-438. 56. Neogi, P., Anomalous Diffusion of Vapors through Solid Polymers. 2. Anomalous Sorption. Aiche Journal 1983, 29, (5), 833-839. 57. Sanopoulou, M.; Petropoulos, J. H., Systematic analysis and model interpretation of micromolecular non-Fickian sorption kinetics in polymer films. Macromolecules 2001, 34, (5), 1400-1410. 58. Tan, N. C. B.; Wu, W. L.; Wallace, W. E.; Davis, G. T., Interface effects on moisture absorption in ultrathin polyimide films. Journal of Polymer Science Part B-Polymer Physics 1998, 36, (1), 155-162. 59. Webber, S. E., Solvents and self-organization of polymers Kluwer: 1996; p 509. 60. Soles, C. L.; Douglas, J. F.; Wu, W. L.; Peng, H. G.; Gidley, D. W., Comparative specular X-ray reflectivity, positron annihilation lifetime spectroscopy, and incoherent neutron scattering measurements of the dynamics in thin polycarbonate films. Macromolecules 2004, 37, (8), 2890-2900. 61. Berens, A. R., Diffusion and Relaxation in Glassy Polymer Powders: 1. Fickian Diffusion of Vinyl-Chloride in Polyvinyl Chloride. Polymer 1977, 18, (7), 697-704. 62. Berens, A. R.; Hopfenberg, H. B., Diffusion and Relaxation in Glassy Polymer Powders. 2. Separation of Diffusion and Relaxation Parameters. Polymer 1978, 19, (5), 489-496. 63. Pantelic, N. Mass Transport Properties in Thin Ion–Exchange Polymer Films and Related Phenomena. Ph.D. Thesis. University of Cincinnati, 2007. 64. Brown, H. R.; Russell, T. P., Entanglements at polymer surfaces and interfaces. Macromolecules 1996, 29, (2), 798-800. 65. Schwab, A. D.; Agra, D. M. G.; Kim, J. H.; Kumar, S.; Dhinojwala, A., Surface dynamics in rubbed polymer thin films probed with optical birefringence measurements. Macromolecules 2000, 33, (13), 4903-4909. 66. Serghei, A.; Tress, M.; Kremer, F., Confinement effects on the relaxation time distribution of the dynamic glass transition in ultrathin polymer films. Macromolecules 2006, 39, (26), 9385-9387. 67. Siroma, Z.; Ioroi, T.; Fujiwara, N.; Yasuda, K., Proton conductivity along interface in thin cast film of Nafion (R). Electrochemistry Communications 2002, 4, (2), 143-145. 68. Siroma, Z.; Kakitsubo, R.; Fujiwara, N.; Ioroi, T.; Yamazaki, S. I.; Yasuda, K., Depression of proton conductivity in recast Nafion (R) film measured on flat substrate. Journal of Power Sources 2009, 189, (2), 994-998. 69. Rubatat, L.; Li, C. X.; Dietsch, H.; Nykanen, A.; Ruokolainen, J.; Mezzenga, R., Structure-Properties Relationship in Proton Conductive Sulfonated Polystyrene-Polymethyl Methacrylate Block Copolymers (sPS-PMMA). Macromolecules 2008, 41, (21), 8130-8137. 70. Kaval, N.; Seliskar, C. J.; Heineman, W. R., Spectroelectrochemical sensing based on multimode selectivity simultaneously achievable in a single device. 16. Sensing by fluorescence. Analytical Chemistry 2003, 75, (22), 6334-6340. 71. Bertoncello, P.; Ciani, I.; Li, F.; Unwin, P. R., Measurement of apparent diffusion coefficients within ultrathin Nafion Langmuir-Schaefer films: Comparison of a novel scanning electrochemical microscopy approach with cyclic voltammetry. Langmuir 2006, 22, (25), 10380-10388.

38
72. Bertoncello, P.; Ciani, I.; Marenduzzo, D.; Unwin, P. R., Kinetics of solute partitioning into ultrathin Nafion films on electrode surfaces: Theory and experimental measurement. Journal of Physical Chemistry C 2007, 111, (1), 294-302. 73. Bertoncello, P.; Peruffo, M.; Li, F.; Unwin, P. R., Functional electrochemically-active ultra-thin Nafion films. Colloids and Surfaces a-Physicochemical and Engineering Aspects 2008, 321, (1-3), 222-226. 74. Bertoncello, P.; Ugo, P., Preparation and voltammetric characterization of electrodes coated with Langmuir-Schaefer ultrathin films of Nafion (R). Journal of the Brazilian Chemical Society 2003, 14, (4), 517-522. 75. Bertoncello, P.; Wilson, N. R.; Unwin, P. R., One-step formation of ultra-thin chemically functionalized redox-active Langmuir-Schaefer Nafion films. Soft Matter 2007, 3, (10), 1300-1307. 76. Szentirmay, M. N.; Martin, C. R., Ion-exchange selectivity of Nafion films on electrode surfaces. Analytical Chemistry 1984, 56, (11), 1898-1902. 77. Rocha, L. S.; Pinheiro, J. P.; Carapuca, H. M., Ion-exchange voltammetry with nafion/poly(sodium 4-styrenesulfonate) mixed coatings on mercury film electrodes: Characterization studies and application to the determination of trace metals. Langmuir 2006, 22, (19), 8241-8247. 78. Hickner, M. A.; Fujimoto, C. H.; Cornelius, C. J., Transport in sulfonated poly(phenylene)s: Proton conductivity, permeability, and the state of water. Polymer 2006, 47, (11), 4238-4244. 79. Co., J. W. Ellipsometry Tutorial: Light and Materials. 80. Azzam, R.; Bashara, N., Ellipsometry and Polarized Light. North-Holland Publishing Company: New York, NY, 1977; Vol. 1, p 529. 81. Scharf, T., Polarized Light in Liquid Crystals and Polymers. John Wiley & Sons, Inc: Hoboken, NJ, 2007; p 400. 82. H. G. Tompkins, W. A. M., Spectroscopic Ellipsometry and Reflectometry. John Wiley & Sons Inc: 1999. 83. Tompkins, H. G., A Users's Guide to Ellipsometry. Academic Press Inc: London, 1993. 84. Chen, C.; An, I.; Ferreira, G. M.; Podraza, N. J.; Zapien, J. A.; Collins, R. W., Multichannel Mueller matrix ellipsometer based on the dual rotating compensator principle. Thin Solid Films 2004, 455, 14-23. 85. Chen, W. L.; Shull, K. R.; Papatheodorou, T.; Styrkas, D. A.; Keddie, J. L., Equilibrium swelling of hydrophilic polyacrylates in humid environments. Macromolecules 1999, 32, (1), 136-144. 86. Barbero, C.; Kotz, R., Nanoscale Dimensional Changes and Optical Properties of Polyaniline Measured by in-situ Spectroscopic Ellipsometry. Journal of the Electrochemical Society 1994, 141, (4), 859-865. 87. Gilchrist, V. A.; Lu, J. R.; Keddie, J. L.; Staples, E.; Garrett, P., Adsorption of penta(ethylene glycol) monododecyl ether at the solid poly(methyl methacrylate)-water interface: A spectroscopic ellipsometry study. Langmuir 2000, 16, (2), 740-748. 88. Li, Y.; Park, E. J.; Lim, K. T. L.; Johnston, K. P.; Green, P. F., Role of interfacial interactions on the anomalous swelling of polymer thin films in supercritical carbon dioxide. Journal of Polymer Science Part B-Polymer Physics 2007, 45, (11), 1313-1324. 89. Born, M.; Wolf, E., Principles of Optics. University Press: Cambridge, 1997.

39
Chapter 3
Experimental Procedures for Sample Preparation and Characterization
3.1. Introduction
In this chapter, explicit details of sample preparation and characterization are
given. Sample preparation procedures include the sulfonation of poly(styrene)-b-
poly(methyl methacrylate) (sPS- b-PMMA), bulk and thin film casting, substrate
treatment preparation, as well as fabrication of electrodes for thin film conductivity
measurements. Details about the design and fabrication of electrodes are explained,
including photolithography, mask design, and metal evaporation. Characterization
procedures include techniques for measuring morphology with atomic force microscopy
(AFM), conductivity with AC impedance (for thin and bulk films), and swelling with
spectroscopic ellipsometry. Since conductivity and swelling were measured as a function
of relative humidity, custom environmental chambers with flow-through humidity control
were created to work in conjunction with each piece of equipment to maintain a
consistent humid sample environment while not interfering with the measurement.
3.2. Film Fabrication
The way that sulfonated poly(styrene)-b-poly(methyl methacrylate) films are cast
influences block copolymer morphology and conductivity. Three types of films were
fabricated for conductivity measurements: bulk films (50 to 100 μm thick), films drop
cast onto silicon substrates (1 to 10 μm thick), and thin films spin cast onto silicon

40
substrates (20 to 400 nm thick). Spectroscopic ellipsometry is sensitive to surface
roughness and film thickness on the angstrom scale, so the films used for ellipsometry
measurements were spin cast to achieve uniform thickness. Morphology was
investigated as a function of film thickness for both spin cast and drop cast films. The
surface roughness of free-standing bulk films was too large to accommodate the z range
of the AFM, so bulk film morphology could not be characterized. Substrate supported
films for ellipsometry and AFM measurements were cast onto treated substrate to
characterize the how the polymer-substrate interaction influences morphology and
swelling. Chapters 4, 5, and 6 elaborate on the relationship between film processing
conditions and morphology, swelling, and conductivity, respectively.
3.2.1. Substrate Treatments
AFM and ellipsometry samples were created on three types of silicon substrates:
native oxide covered silicon, hexamethyldisilazane (HMDS)-coated silicon, and 3-
aminopropyltri-methoxysilane (APTMS)-coated silicon. Silicon substrates were cleaned
with piranha solution (7:3 H2SO4 to 30% H2O2 heated to 100°C) then rinsed three times
with Millipore (18.5 MΩ, pH 6.0) water and dried with compressed air. To create a
hydrophobic substrate, HMDS was spin cast at 3000 rpm onto cleaned wafers and baked
at 100 ºC for 1 minute. Hydrophilic substrates were created by spin casting 0.5 v/v %
APTMS in 95:5 w:w ethanol to water solution at 3000 rpm onto cleaned silicon wafers.
Native oxide silicon wafers as well as wafers coated with HMDS and APTMS
substrate treatments were examined with spectroscopic ellipsometry to determine how the
treatments themselves might contribute to the optical properties and thickness change of

41
the films. To examine any contribution to swelling from the substrate treatments, wafers
were prepared with the three treatments (APTMS, HMDS, and bare silicon with a native
oxide) and exposed to 0 to 90 % relative humidity using the same procedure for the
testing of the polymers films. It was found that the APTMS treatment swells as it
absorbs water. Neither the hydrophobic HMDS treatment nor the bare wafer showed any
appreciable change in thickness when exposed to humid environments. The APTMS
layer was found to swell 31 % percent of its original thickness at 90 % RH as seen in
Figure 3-1. During modeling of ellipmetry data, it was confirmed that there is no
difference in the refractive index of the polymer and the substrate treatments (HMDS,
APTMS or bare wafers).
0 1000 2000 3000 40008.5
9.0
9.5
10.0
10.5
11.0
11.5
l t (nm
)
t (s)
Figure 3-1. In situ swelling of 8.75 nm thick (when dry) APTMS film on silicon as it is exposed to increasing humidity, measured by spectroscopic ellipsometry. Thickness change, lt, (nm) is shown in real time, t, in seconds and as a function of relative humidity, RH (%), labeled on the graph.
ambi
ent
50 % 75 % 90 % 0 % 25 %

42
The slightly visible APTMS layer is much thicker than the HMDS layer, which is
not visible to the naked eye. The APTMS layer can be as thick as 8.75 nm in the dry
state, implying that it is not a monolayer of silane, but instead a multilayer build-up of
APTMS molecules created during rapid spin coating. While the HMDS treatment creates
nearly a monolayer less than 1 nm thick, the APTMS film contributes significant bulk to
ultra thin polymer films.
3.2.2. Thin Film Fabrication
Films less than 1 μm thick are fragile and must be supported by substrates. These
thin films were created via spin coating. In this process, polymer solution was dropped
onto a static silicon wafer, which was then spun at several thousand rotations per minute,
spreading the solution over the surface and rapidly evaporating the solvent. This
technique created films with very uniform thickness, which was vital for accurate
ellipsometry, and thus swelling, measurements. Spin coating of thin polymer films was
performed using a Headway Research model R485 spin coater at room temperature.
Solutions of 1 and 5 w/w % sPS-b-PMMA in N,N-dimethylformamide (DMF) were
stirred for at least 24 h before being filtered through a 0.45 μm PTFE® filter and casted
into molds. Film thickness was varied via spin speed (1000-3000 rpm) and solution
concentration, as shown in Table 3-1.
Table 3-1. Approximate film thicknesses based on processing conditions for dried spin cast thin films created from 1 or 5 w/w % solutions at spin speeds of 1000 or 3000 rpm.
Spin speed 1 w/w % solution 5 w/w % solution
1000 rpm 45 nm 350 nm
3000 rpm 25 nm 190 nm

43
3.2.3. Fabrication of Bulk Films
Bulk films were made by casting concentrated polymer solutions (~5 w/w %) into
Teflon® molds. The amount of polymer needed to create a bulk film was calculated by
the multiplying the area of the mold (1 in × 1 in) by the desired thickness (50 μm). This
volume was divided by the density of the polymer to find the desired sample mass. The
calculated mass of polymer was added to DMF and stirred for at least 24 h before
filtering. Solutions were filtered through a 0.45 μm PTFE® filter and cast into molds.
Teflon molds containing polymer solution were placed on level casting trays in chemical
fume hoods and covered with a glass plate to evaporate the solvent slowly. DMF
evaporated over a minimum of 10 days. Once the films appeared to be fully dry, the
molds were dried under vacuum for 24 h at 50ºC to remove all residual solvent. Films
extracted from the Teflon® molds were sectioned into pieces to test the conductivity of
bulk films using an in-plane method.1
3.3. Electrode Fabrication
Thin film conductivity measurements were performed by casting a polymer film
onto a substrate patterned with platinum or gold electrodes. A schematic of the electrode
layout can be seen in Figure 3-2. Custom designed electrodes were fabricated on prime,
3 inch silicon wafers with a 90 nm thick thermal oxide coating. The pattern was created
using traditional photolithography and the metal was evaporated onto the patterned
wafers with a Semicore evaporator. To promote adhesion to the substrate, a 5 nm thick
layer of titanium was applied as a base, followed by a 45 nm thick layer of platinum or
gold. The wafer-supported electrodes have four probes spaced 220 μm apart. The
electrodes are 20 μm wide and 11mm long and the probe pads were 3 mm x 3mm.

44
3.3.1. Mask Fabrication
Electrodes were fabricated by depositing metal onto a silicon wafer patterned with
photoresist. These wafers were created in the NNIN Nanofabrication Laboratory at the
Materials Research Institute at Penn State. A lithographic mask pattern designed using
L-edit software was etched onto a 4 in × 4 in quartz plate using a Heidelberg DWL66
Laser Writer. The laser writer removes the chrome from the areas of the pattern where
photoresist was exposed to UV light, developed and removed, and metal was eventually
be deposited. The pattern was designed for use with 3 inch diameter silicon wafers and
positive photoresist.
3.3.2. Photolighography
Photolithography utilizes a photosensitive polymer to create features with
characteristic dimensions on the order of microns. This type of process is especially
popular in semiconductor manufacturing for the ease of repeatability and low material
cost. Ultraviolet light shines through a lithographic mask onto a wafer covered in the
photosensitive polymer, called photoresist. As positive photoresist is exposed to light,
the light induces chain scission, degrading the chains. These fragmented chains in the
unmasked areas dissolve in the developer solution, exposing the bare substrate in the
same pattern as the mask. To create electrodes, the wafers are then coated with metal
after removal of the exposed resist. The sharpness of feature corners and edges can be
optimized by varying: exposure time, photoresist thickness, gap between the mask and
substrate (alignment gap), and development time. The minimum feature size in this

45
custom pattern is 20 μm. The schematic in Figure 3-2 shows the basic layout of one of
the four point electrode probe arrays.
Figure 3-2. Schematic of the electrode design for thin film conductivity measurements. The substrate is a prime silicon wafer with a 90 nm thick thermal oxide coating. Drawing is not to scale.
Sharp feature edges were attained using the following procedure:
Application of resist: • Thermally coated wafers were baked at 95°C, coated with hexamethyldisilazane
(HMDS) at 3000 rpm, and post baked at 95°C for 1 minute • 3 mL SPR 3012 photoresist (Shippley) was spin cast statically at 3000 rpm
UV Exposure in Karl Suss MA-6 Contact Aligner: • Hard contact of mask to wafer • Alignment gap of 20 μm • 8 second exposure
Photoresist Development: • Wafers were placed in CD-26 (0.26 N tetramethyl ammonium hydroxide) for 1
minute to develop the UV-exposed photoresist Metal Deposition in Semicore Electron-beam Evaporator:
• 5 nm thick layer of Titanium deposited to bond Pt to SiOx substrate • 45 nm thick layer of Platinum deposited to create electrode
Removal of photoresist: • Photoresist was removed by rising and sonicating wafers in acetone
Distance across electrodes: 9 mm
Contact pad
Probes or “fingers” width of feature: 20 μm
Distance between electrodes: 220 μm

46
After testing the resistivity of the 90 nm coated SiO2 on Si wafer, it was found to
have immeasurably high resistance in DC conductivity measurements, but there was
some response during AC impedance tests. It was discovered that the HMDS layer is not
fully removed with acetone, so in the future, electrode wafers will be cleaned with
oxygen plasma after stripping the photoresist. All procedures not included in this
summary are standard operating procedure for the equipment used. Machine
specifications and capabilities can be found at
http://www.mri.psu.edu/facilities/NNIN/Facilities.asp. More information on procedures
can be found by contacting the staff member who oversees each piece of equipment.
3.4. Conductivity
The conductivity of the samples was measured by AC impedance with a Solartron
1260A Impedance Gain/Phase analyzer over a frequency range of 100,000 to 10 Hz with
a drive signal of 100 mV. The DC resistive component of the impedance was determined
by fitting the impedance response with an ideal resistor or RC equivalent circuit model.
Equation 3-1 shows how the resistance of a sample is used to compute the conductivity.
(3-1) AR ⋅
=lσ
where σ is the proton conductivity, l is the path length between electrodes, A is the cross
sectional area of the film available for proton transport, and R is the measured resistance.
The cross sectional area, A, was calculated by multiplying the thickness of the dry film,
l0, by the width of the film in contact with the electrodes.
To characterize conductivity as a function of relative humidity in sPS-b-PMMA
films, conductivity was measured while the films were exposed to relative humidities of

47
20, 35, 50, 75, and 90%. Humidity was controlled with different techniques for bulk and
thin films. An Espec environmental chamber was used to regulate humidity in bulk
films, while a flow-though humidity system was used to equilibrate the thin films.
3.4.1. Bulk Film Conductivity
Conductivity of bulk and thin films were measured with two different techniques.
As previously mentioned, conductivity of bulk, free-standing films (>50 μm thick) was
measured using a Solatron 1260A Impedance/Gain Phase Analyzer and humidity was
controlled using an Espec environmental chamber. Conductivity was measured as a
function of relative humidity while the films were exposed to relative humidities of 20,
35, 50, 75, and 90 %. At each level of humidity, the films were allowed to equilibrate for
90 minutes to ensure uniform hydration. Electrical contact was made by clamping films
into a parallel plate cell as described in literature.1
3.4.2. Thin Film Conductivity
Thin film conductivity measurements must be performed using a Karl Suss PM5
probe station. Since the probe station cannot be contained within an environmental
chamber, the chamber had to be created around the sample. For films cast on top of
electrodes, a plastic dome was placed over the sample to contain the humidity and allow
for the probe tips to make contact with the electrodes on the sample surface, as seen in
the side view (Figure 3-3) and top view (Figure 3-4) schematics. These electrodes are the
same ones as pictured in Figure 3-2. For experiments using flow tube humidity

48
generators, humidity was controlled by manually adjusting the ratio of dry air and
humidified air as shown in in Table 3-2.
Figure 3-3. Side view schematic of the method for maintaining the humid environment aroundthin film sPS-PMMA samples while measuring AC impedance on electrode substrates.
Figure 3-4. Top view schematic of the method for maintaining the humid environment around thin film sPS-PMMA samples while measuring AC impedance on electrode substrates. For clarity, this image does not include the tube that feeds humidity into the plastic dome.
Air flow Glass pipette
Plastic dome
Sample substrate
Sample substrate
Electrode contact pad
Probe tip
Plastic dome
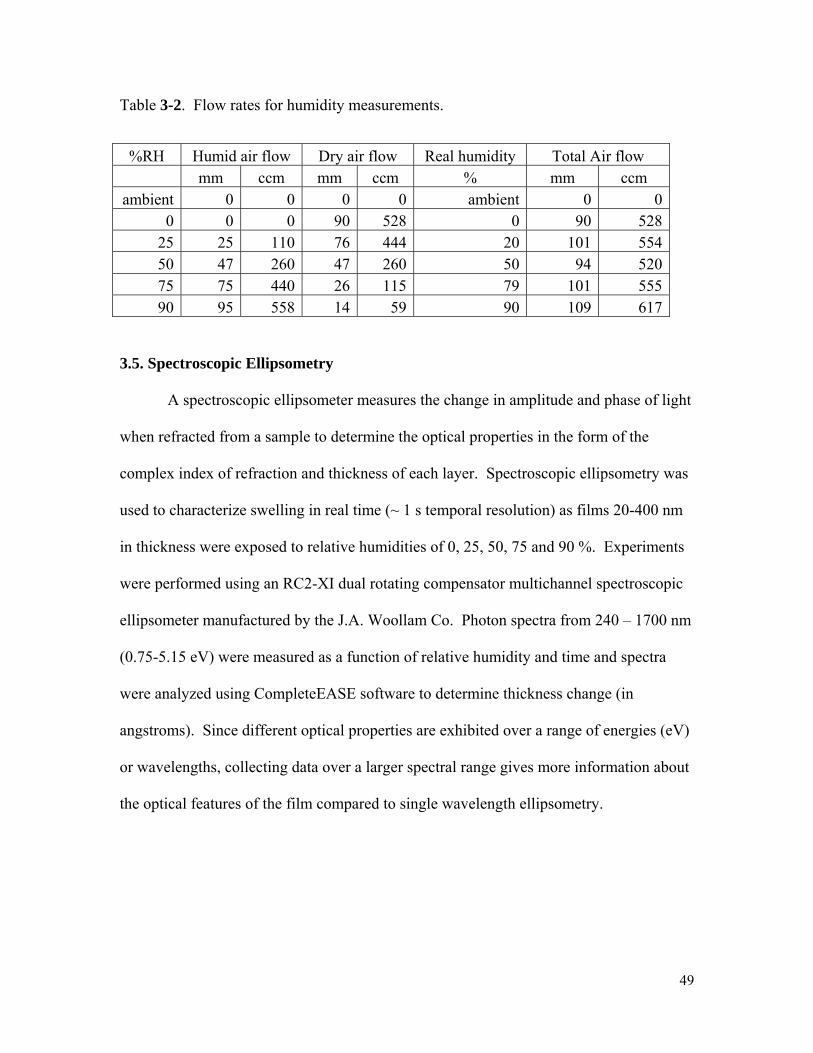
49
Table 3-2. Flow rates for humidity measurements.
3.5. Spectroscopic Ellipsometry
A spectroscopic ellipsometer measures the change in amplitude and phase of light
when refracted from a sample to determine the optical properties in the form of the
complex index of refraction and thickness of each layer. Spectroscopic ellipsometry was
used to characterize swelling in real time (~ 1 s temporal resolution) as films 20-400 nm
in thickness were exposed to relative humidities of 0, 25, 50, 75 and 90 %. Experiments
were performed using an RC2-XI dual rotating compensator multichannel spectroscopic
ellipsometer manufactured by the J.A. Woollam Co. Photon spectra from 240 – 1700 nm
(0.75-5.15 eV) were measured as a function of relative humidity and time and spectra
were analyzed using CompleteEASE software to determine thickness change (in
angstroms). Since different optical properties are exhibited over a range of energies (eV)
or wavelengths, collecting data over a larger spectral range gives more information about
the optical features of the film compared to single wavelength ellipsometry.
%RH Humid air flow Dry air flow Real humidity Total Air flow mm ccm mm ccm % mm ccm ambient 0 0 0 0 ambient 0 0
0 0 0 90 528 0 90 52825 25 110 76 444 20 101 55450 47 260 47 260 50 94 52075 75 440 26 115 79 101 55590 95 558 14 59 90 109 617

50
3.5.1. Analyzing Spectroscopic Ellipsometry Data
After the ellipsometry spectra are collected as a function of photon energy (eV)
they must be analyzed using a model to derive the optical properties and thickness of the
material. The model must be created so that it reasonably represents the physical
properties of the material. It is then fit to the experimental data by changing the
refractive index and thickness of the model components and minimizing the unweighted
error function.3 The basic starting optical property parameterization was a Lorentz
oscillator model.4
To determine if the treatments were optically different from the polymer film, and
should therefore be modeled as a different layer, the film thickness was modeled and
compared using three and four layer models. The four layer model of a polymer film on
APTMS included bulk silicon, the native oxide on silicon, and two distinct material
layers, one of which included the optical values for the dry substrate layer. It was found
that APTMS and HMDS cannot be detected separately from the polymer layer.
Therefore, the model has three layers considered: bulk silicon, the native oxide on silicon,
and the bulk film thickness. During data modeling, surface roughness was often found to
be negligible, so for consistency, it was fixed at zero and thus absent from the analysis.
3.5.2. Environmental Chamber for Ellipsometry
To measure thin film swelling in situ in real time, an environmental cell was used
to expose the sample to a consistent humidity while transmitting light from the
ellipsometer. Figure 3-5 shows a schematic of the environmental cell used in
ellipsometry measurements. The frame was made with basic acrylic sheeting, and non-
polarizing quartz windows were added in to transmit a maximum amount of light.

51
Seventy degrees was the optimum angle for sensitivity of films on crystal silicon since
the Brewster angle is 70º for crystalline silicon. The red arrows indicate the incident light
of the ellipsometer and an identical angle of light reflected off the sample that is collected
by the detector. The humidity in the chamber was isotropic and non-absorbing across the
spectral range.
3.6. Atomic Force Microscopy
Atomic force microscopy (AFM) was used to determine the morphology of sPS-
b-PMMA films. Atomic force microscopy was performed on a Veeco™ Digital
Instruments Dimension 3100 Atomic Force Microscope in tapping mode. AFM tips were
purchased from Nanosensors, with a spring constant of k = 40 and radius < 7 nm. All
Figure 3-5. Environmental cell created to maintain a consistent humid environment for swelling samples characterized with spectroscopic ellipsometry.
70° Low strain quartz
windows
Sample
Acrylic frame
Humidity flow tube and inlet
Incident light Reflected light

52
AFM height and phase images included in this study were 3 μm × 3μm. AFM images
show that surface treatment has a great influence on the structure of these thin films (25
nm). Lighter domains in the AFM phase images correspond to the softer sulfonated
poly(styrene) phase.
3.7. Properties and Synthesis of Sulfonated Poly(styrene)-b-poly(methyl
methacrylate)
Sulfonation of PS-b-PMMA was conducted using acetyl sulfate in 1,2-
dichloroethane (Figure 3-6), following a reference procedure.5 Acetyl sulfate solution (1
M solution, 50 mL) was generated via the sequential addition of sulfuric acid (2.67 mL,
0.05 mol) and acetic anhydride (5.96 mL, 0.063 mol) in 1,2-dichloroethane (41.37 mL) at
0 °C. A 2 molar excess of acetyl sulfate compared to polystyrene repeat unit was added
to the reaction mixture and the reaction proceeded for 24 h at 50 °C. The resulting
reaction mixture was precipitated in hexanes and washed with water. The separated
sulfonated PS-b-PMMA was dried in a reduced pressure for 48 h at 50 °C. The starting
material, poly(styrene)-b-poly(methyl methacrylate), was purchased from Polymer
Source, Inc. Sulfonation of PS-b-PMMA was performed by Tomonori Saito. 1H NMR
was used to determine the degree of sulfonation and corresponding IEC of sulfonated PS-
b-PMMA. The degree of sulfonation was calculated using the shift of aromatic protons
next to sulfonic acid in 1H NMR resonance from 6.8 – 7.2 ppm to 7.2 – 7.6 ppm. The
sPS-b-PMMA in this study has a molecular weight of 203-165 kg mol-1, polydispersity
index of 1.20, degree of sulfonation of 100%, and ion exchange capacity of 3.0 mmol g-1,
as shown in Table 3-4, unless otherwise noted.

53
Figure 3-6. Sulfonation of PS-b-PMMA using acetyl sulfate. The solubility parameter for sulfonated polystyrene was derived in literature6
while others were taken from Hansen’s solubility parameter text.7 The molar volume for
sulfonated polystyrene was calculated by the group contribution method.5 A theoretical
density was calculated by dividing molar mass by molar volume.
Table 3-3. Solubility parameters and molecular properties of materials used in this study including N,N-dimethylformamide (DMF), poly(styrene) (PS), sulfonated poly(styrene) (sPS), poly(methyl methacrylate) (PMMA) and water.
Molecular weights given by Polymer Source, Inc. for the original poly(styrene)-b-
poly(methyl methacrylate) were then used to calculate molecular weight of sulfonated
poly(styrene)-b-poly(methyl methacrylate) based on the molar mass of sulfonated
poly(styrene), the fractional degree of sulfonation, φ, the degree of polymerization, N,
and the molar mass, m, using Equation 3-2.
(3-2) PSsPSsPS NmNmMW )1( φφ −+=
δ (J/cm3)0.5
δ (cal/cm3) 0.5
Molar mass (g mol-1)
Density (g cm-3)
Molar volume (mol cm-3)
DMF 24.86 12.15 73.09 0.944 77.43 PS 18.61 9.10 104.15 1.05 99.19
sPS 33.96 16.60 184.21 1.43 129.10 PMMA 18.27 8.93 100.12 1.17 85.57
Water 47.9 23.40 18.02 1.00 18.02

54
Values for sulfonated and unsulfonated PS-PMMA molecular weights are
included in Table 3-4, along with the polydispersities of the original PS-PMMA and IECs
measured by NMR.
Table 3-4. Original molecular weights and calculated molecular weights after sulfonation of poly(styrene) (PS), sulfonated poly(styrene) (sPS), and poly(methyl methacrylate) (PMMA).
References
1. Einsla, B. R.; Kim, Y. S.; Hickner, M. A.; Hong, Y.-T.; Hill, M. L.; Pivovar, B. S.; McGrath, J. E., Sulfonated naphthalene dianhydride based polyimide copolymers for proton-exchange-membrane fuel cells: II. Membrane properties and fuel cell performance. Journal of Membrane Science 2005, 255, (1-2), 141-148. 2. Rubatat, L.; Li, C. X.; Dietsch, H.; Nykanen, A.; Ruokolainen, J.; Mezzenga, R., Structure-Properties Relationship in Proton Conductive Sulfonated Polystyrene-Polymethyl Methacrylate Block Copolymers (sPS-PMMA). Macromolecules 2008, 41, (21), 8130-8137. 3. Cong, Y.; An, I.; Vedam, K.; Collins, R. W., Optical Characterization of a 4-Medium Thin-Film Structure by Real-Time Spectroscopic Ellipsometry- Amorphous-Carbon on Tantalum. Applied Optics 1991, 30, (19), 2692-2703. 4. Collins, R. W.; Ferlauto, A. S., Handbook of Ellipsometry. William Andrew Publishing: Norwich, NY, 2005; p 870. 5. Saito, T.; Mather, B. D.; Costanzo, P. J.; Beyer, F. L.; Long, T. E., Macromolecules 2008, (41), 3503-3512. 6. Lu, X. Y.; Weiss, R. A., Development of miscible blends of Bisphenol A polycarbonate and lightly sulfonated polystyrene ionomers from intrapolymer repulsive interactions. Macromolecules 1996, 29, (4), 1216-1221. 7. Hansen, C. M., Hansen solubility parameters: a user's handbook CRC Press: Boca Raton, 2007; p 519.
Samples MWPS (kg mol-1)
MWsPS (kg mol-1)
MWPMMA (kg mol-1)
PDI (MW/MN) DS %
IECNMR (mmol g-1)
TS1-20A 235 403 263 1.18 74 2.8 TS1-20B 105 186 106 1.13 100 3.4 TS1-20C 52 80 52 1.09 93 3.3 TS1-65A 68 120 90 1.25 100 3.1 TS1-65B 96 170 128 1.06 100 3.1 TS1-65C 115 203 165 1.20 100 3.0

55
Chapter 4
Thin Film Morphology of Ionic Block Copolymers
4.1. Introduction
It was reviewed in Chapter 2 that diblock copolymers naturally phase separate to
form structures that reduce the interaction between the chemically different polymers,
forming an energetically favorable morphology. The addition of the ionic component in
ionic block copolymers creates very strong phase separation due to the large difference in
the polymethyl methacrylate (PMMA) and sulfonated polystyrene (sPS) solubility
parameters.1 Furthermore, thin film block copolymers have a high surface area to
volume ratio, so a large portion of the polymer is in contact with a substrate or air
interface, affecting wetting, chain mobility, and confinement. This chapter investigates
how film morphology is affected by film thickness, processing, and the underlying
substrate treatment in substrate-supported films 20 nm to 5 μm in thickness.
The arrangement of ionic aggregates within block copolymer domains can
determine the structure-property relationships in ionic block copolymers. Clustering the
ions on a particular location of the polymer chain, as in a block, may lead to improved
connectivity of the ionic domains and thus is an important area of research in the proton
exchange membrane field. Atomic force microscopy (AFM) was used to visually
characterize the continuity of domain structures. AFM data then was compared with
ionic conductivity and water uptake to infer how processing, thickness, surface treatment,
molecular block length, morphology, and conductivity correlate with one another. The

56
following morphological investigations will lead to conclusions in subsequent chapters
about how morphology influences swelling characteristics and the ion conductivity of
thin ionic block copolymer films.
4.1.1. Correlation between Morphology and Conductivity
The inherent connection between morphology and conductivity in ionic block
copolymers is somewhat disputed in literature. Studies draw conflicting conclusions
about the trend between the degree of sulfonation and the phase separated morphology.
It is generally true that the higher the ionic content of a material, the higher the
conductivity, but Elabd, et al.2 found a decrease in order as the level of sulfonation
increased, while Rubatat, et al.3 report findings to the contrary. Elabd illustrates in Figure
4-1a the correlation between ion content and phase geometry. As ion content increases in
sulfonated poly (styrene-b-isobutylene-b-styrene) triblock copolymer, phases transform
from periodic, lamellar structures to continuous, interconnected domains lacking
organization. Rubatat found that as the degree of sulfonation was increased (up to 37%)
in sPS-PMMA there was an increase in the order of polymer phases. Figure 4-1b shows
phases transitioning from disordered to cylindrical to hexagonal closed packed as the
degree of sulfonation increases from 10 to 18 to 33%, respectively.3 This increase in
sulfonation also corresponds to an increase in the conductivity (normalized by volume
fraction of water + PS+ sPS) by several orders of magnitude.

57
Establishing a definitive correlation between phase-separated order and
conductivity would be an ideal way to guide the design of new PEM membranes.
Rubatat speculates as to how conductivity and phase morphology might directly
correspond with the schematic in Figure 4-2.3 Proton conductivity increases as phases
transition from complete miscibility to a lamellar structure. Figure 4-1b shows that for
similar levels of sulfonation (15 and 17%, respectively) the lamellar morphology exhibits
a significantly higher normalized conductivity than the cylindrical sPS morphology. In
the hexagonal morphology, the perforating PMMA cylinders restrict the expansion of the
domains, and the d spacing does not change when hydrated. In the lamellar morphology,
the ion conductive sPS phase has more freedom to swell and the d-spacing increases by
25% when the film is fully hydrated.3 In the work reported here, morphologies of thin
Figure 4-1. (a) Illustration depicting the morphological change with increasing ion content. Atlow ion contents, a periodic lamellar morphology exists, where the microdomains arepredominantly oriented perpendicular to the direction of transport. At higher ion contents, anddegrees of sulfonation up to 82% a nonperiodic cocontinuous morphology exists providing lessresistance for transport. (b) The normalized proton conductivity σ/Φ as a function of the sulfonation degree for the three series: 20 kg mol-1 (circle), 52.5 kg mol-1 (square), and 78 kg mol-
1 (triangle). Φ refers to the volume fraction of the PS + sPS + water domains. 2
(a)
(b)

58
film sPS-PMMA were investigated with atomic force microscopy to determine how the
structure influences swelling characteristics of thin ionic block copolymer films.
4.1.2. Atomic Force Microscopy
Atomic force microscopy (AFM) revolutionized the characterization of surface
morphologies in the mid 1980’s. Until that point, there was no comparable method to
investigate surface morphology other than via visual characterization with scanning and
transmission electron microscopy. The electron beams used in these techniques often
prove fatal to soft polymeric materials, destroying the sample before it can be properly
imaged. AFM has several unique and important assets: it is a non destructive technique,
it boasts truly atomic resolution, and the technique requires no special sample
preparation. One disadvantage of AFM is that only the top surface of the material can be
probed. Thus, the images can be influenced by surface energies and careful interpretation
is needed as AFM gives no indication of the cross sectional morphology of a film.
In this study, morphology is investigated as a function of film thickness, film
processing, and substrate wettability in AFM tapping mode. The sulfonated PS-PMMA
block copolymers showed distinct separation for films thinner than the characteristic
Figure 4-2. A schematic of the increase in proton conductivity as morphology becomes moreordered in sPS-PMMA systems.3

59
domain size. Morphologies of films that were slowly dried created more organized
structures than spin cast films, and films created at various thicknesses and spin casting
speeds exhibited similar morphologies. Film thickness had little effect on films that were
processed in the same way, e.g. drop versus spin casting. The surface treatment had the
greatest influence on morphology. Ultra thin (~ 25 nm) films cast onto HMDS-coated,
APTMS-coated, and bare silicon substrates exhibited distinctly different morphologies,
which lead to different swelling characteristics, as will be discussed in Chapter 5.
4.2. Effects of Film Processing
Film morphology was greatly affected by processing. The films in this study
were prepared in two ways: via spin casting or drop casting. Solvent based solutions
were used to drop cast thin films (1-10 μm) onto a silicon wafer or bulk films (~50 μm)
into a Teflon® mold. Morphologies of bulk films could not be characterized because the
surface roughness of the freestanding films was out of the Z range capabilities of the
AFM. Drop cast films were allowed to dry slowly for up to a week. Spin cast films were
created by dropping solution onto a substrate rotating at 1000 to 3000 rpm. More details
about film fabrication can be found the experimental section in Chapter 3. In the AFM
images, ambient conditions lend some moisture to the film, so the sPS block absorbs
some water from the air and exhibits itself as the softer domain. The lighter domains in
the height and phase images correspond to a raised profile and softer phase, respectively,
of the sulfonated polystyrene.
The slow drying process allowed the highly sulfonated polystyrene block to fully
organize in the film without forming smaller, percolated domains as was observed with
spin casting. Figure 4-3 shows that slowly drying the 5 μm film from solution formed

60
regular periodic structures with what appears to be sPS cylinders aligning perpendicular
to the surface in the PMMA matrix.
Figure 4-4 shows little difference between the morphologies observed for a 1%
solution spin cast at 1000 versus 3000 rpm. The film cast at 1000 rpm seems to have
slightly less defined domain edges, which may be due to higher shear forces at higher
rpm speeds. Since the 1000 rpm film is cast at a slower speed, less solution is cast off of
the wafer, leaving behind a thicker film. The film cast from 1% solution at 1000 rpm is
49 nm thick while the same concentration of solution cast at 3000 rpm results in a 23 nm
thick film. In Figure 4-5, a 5% solution is cast at 1000 and 3000 rpm resulting in films
184 nm thick and 380 nm thick, respectively. These thicker films show better phase
separation than the 1% solution cast films, while the 380 nm thick film seems to show a
greater difference in height between the sulfonated polystyrene and PMMA phases.
Films cast from the same concentration of solution resemble each other more closely than
films cast at the same spin speed but different concentrations. When films are created
600nm
26.05 nm
0.00 Å
600nm
27.85 Deg
3.30 Deg
Figure 4-3. AFM (a) height and (b) phase morphology of drop cast 203-165 kg mol-1 sPS-b-PMMA film on a wafer with native oxide surface. Slowly drying the film from solution allowedfor a more periodic morphology with sPS cylinders aligning perpendicular to the surface in aPMMA matrix.
(a) (b)

61
using spin casting it seems that solution concentration and viscosity (i.e. thickness) have
a greater influence on morphology than casting speed.
600nm
16.60 nm
0.00 Å
600nm
6.86 Deg
-10.39 Deg
600nm
10.75 nm
0.00 Å
600nm
20.44 Deg
-32.14 Deg
Figure 4-4. AFM (a) height and (b) phase morphology of a 49 nm thick film created by spincasting at 1000 rpm onto a bare wafer. AFM (a) height and (b) phase morphology of a 23 nmthick film created by spin casting at 3000 rpm onto a bare wafer. Both films were cast from 1%w/w 203-165 kg mol-1 sPS-PMMA solution in DMF.
(a) (b)
(c) (d)

62
To determine how ionic groups affect the morphology during spin cast
processing, unsulfonated poly(styrene)-b-poly(methyl methacrylate) (PS-b-PMMA) was
spin cast under the same conditions as sPS-b-PMMA from a 1% solution in toluene. The
film was prepared on a neutral polystyrene brush according to literature procedures4 and
Figure 4-6 shows the resulting AFM micrographs. In the case of non-ionic block
copolymers, the faster spin speed (thinner film) shows wider domains and more defined
phase separation. The greater shear of the higher spin speed induced phase ordering in
the non-ionic block copolymer system. Phase mixing is evidenced by the blurry phase
600nm
24.02 nm
0.00 Å
600nm
9.49 Deg
-22.60 Deg
600nm
18.82 nm
0.00 Å
600nm
6.63 Deg
-15.14 Deg
Figure 4-5. AFM (a) height and (b) phase morphology of a 380 nm thick film created by spincasting at 1000 rpm onto a bare wafer. AFM (c) height and (d) phase morphology of a 184 nmthick film created by spin casting at 3000 rpm onto a bare wafer. Both films were created from 5% w/w 203-165 kg mol-1 sPS-PMMA solution in DMF.
(a) (b)
(c) (d)

63
borders. Since the solubility parameters for PS and PMMA are closer than that of sPS
and PMMA, there is weaker phase segregation. Figure 4-6 images c and d are similar to
the corresponding sPS-b-PMMA film processed at the same spin speed from the same
concentration of solution. Although these films were created using the same procedure,
toluene has a lower boiling point than DMF, so the solvent evaporates faster in the PS-b-
PMMA film casting. The differences in solvent evaporation rates and film drying could
explain the similarities: although ionic groups cause kinetic trapping of domains, DMF
evaporates slower than toluene, allowing for the sPS-PMMA polymer time to arrange.
600nm
10.57 nm
0.00 Å
600nm
7.64 Deg
-12.33 Deg
600nm
14.49 nm
0.00 Å
600nm
13.75 Deg
-15.42 Deg
Figure 4-6. AFM (a) height and (b) phase morphology of a 400 nm thick film, created by spin casting at 1000 rpm onto a bare wafer. AFM (a) height and (b) phase morphology of a 200 nmthick film created by spin casting at 3000 rpm onto a bare wafer.
(a) (b)
(c) (d)

64
4.2.1. Effect of Substrate Treatments
In ultrathin block copolymer films, the properties of the substrate greatly
influence the film morphology. As discussed in Chapter 2, surface energy has a large
affect on the structure of a thin film, so each block will be attracted to the surface it is
most compatible with. This configuration lowers the interfacial free energy of the film: a
strong driving force in materials with such a high surface area to volume ratio. If one of
the blocks has an affinity for the substrate surface, the morphology will tend to align
parallel to the surface with the more compatible polymer block wetting the substrate. A
neutral substrate will induce a morphology perpendicular to the surface because both wet
the surface equally. These concepts were exemplified in the ultra thin (22-29 nm thick)
films as shown in Figure 4-7.
In Figure 4-7c, hydrophobic, glassy PMMA was driven to share more surface area
with the hydrophobic HMDS-coated substrate. A PMMA-rich layer was created at the
substrate interface and drove the sulfonated polystyrene to the free surface. The phase
image in 4-7c shows that the surface is largely covered with the softer sPS phase. At the
free surface the sPS-PMMA film on the bare substrate in Figure 4-7a showed an equal
mix of both sulfonated polystyrene and polymethyl methacrylate, implying that it
attracted both blocks equally, creating long, continuous domain structures. The APTMS
surface coating (Figure 4-7b) created small percolated sPS phases intermixed with the
PMMA matrix.

65
AFM height image AFM phase image a) 23 nm thick film on bare wafer
600nm
17.45 nm
0.00 Å
600nm
26.91 Deg
-23.37 Deg
b) 29 nm thick film
on APTMS coated wafer
600nm
34.66 nm
0.00 Å
600nm
15.53 Deg
-13.44 Deg
c) 22 nm thick film on HMDS
coated wafer
600nm
14.19 nm
0.00 Å
600nm
16.61 Deg
-23.28 Deg
Figure 4-7. AFM height and phase images show the differences in morphology for thin polymer films (22-29 nm thick) on a) bare silicon wafers b) APTMS coated silicon wafer and c) HMDS coated silicon wafer. Films were prepared by spin coating a 1% w/w solution of 203-165 kg mol-
1 sPS-PMMA on the substrate at 3000 rpm.

66
As discussed in later chapters, domain size and continuity had a significant effect
on how much these films would swell. The strongly hydrophobic HMDS-coated
substrate induced the most phase separation because the interfacial area between sPS and
PMMA in Figure 4-7 is minimized. Since a largely unrestricted hygroscopic phase was
created at the free surface, the polymer on the hydrophobic substrate swelled the most in
ellipsometry measurements. Similarly, the thin polymer film on the bare wafer exhibited
almost as much swelling because it had larger and more continuous phase separated
domains. Swelling in the popcorn-like structure formed on the APTMS-coated wafer
was restricted because sPS was confined to small domains surrounded by the structural
PMMA block.
4.3. Conclusions
The conflicting accounts in literature of how order affects conductivity
demonstrates that the relationship between conductivity and morphology is still not
completely understood in ionic block copolymer films. To draw conclusions about the
relationship between morphology, swelling, and conductivity, the morphology of thin
sulfonated poly(styrene)-b-poly(methyl methacrylate) films was analyzed using atomic
force microscopy. Film morphology was studied as a function of processing conditions,
thickness, solution concentration, and substrate treatment. It was established that
substrate treatment has the largest effect on film morphology, which will be shown in
subsequent chapters to influence swelling behavior and conductivity in thin films.

67
4.4. Future work
Because through-plane membrane conductivity is most important in a fuel cell, it
is important to also understand the cross sectional morphology of these films. Since
AFM can only be used to characterize surfaces, new characterization techniques must be
sought out to determine how sPS-PMMA phase separates from the top to the bottom of
the film. Focused ion beam milling was used to excise a cross section in substrate-
supported thin films, but subsequent field emission scanning electron microscopy was not
capable of imaging the cross section. At the necessary resolution to image nanometer
scale domains, the ion beam would burn away the material and showed no sign of distinct
phase separation. In the future, cross sectional morphology will be imaged using
transmission electron microscopy.
References
1. Lu, X. Y.; Weiss, R. A., Development of miscible blends of Bisphenol A polycarbonate and lightly sulfonated polystyrene ionomers from intrapolymer repulsive interactions. Macromolecules 1996, 29, (4), 1216-1221. 2. Elabd, Y. A.; Napadensky, E.; Walker, C. W.; Winey, K. I., Transport properties of sulfonated poly (styrene-b-isobutylene-b-styrene) triblock copolymers at high ion-exchange capacities. Macromolecules 2006, 39, (1), 399-407. 3. Rubatat, L.; Li, C. X.; Dietsch, H.; Nykanen, A.; Ruokolainen, J.; Mezzenga, R., Structure-Properties Relationship in Proton Conductive Sulfonated Polystyrene-Polymethyl Methacrylate Block Copolymers (sPS-PMMA). Macromolecules 2008, 41, (21), 8130-8137. 4. Bosworth, J. K.; Paik, M. Y.; Ruiz, R.; Schwartz, E. L.; Huang, J. Q.; Ko, A. W.; Smilgies, D. M.; Black, C. T.; Ober, C. K., Control of self-assembly of lithographically patternable block copolymer films. Acs Nano 2008, 2, (7), 1396-1402.

68
Chapter 5
Swelling of Thin Ion-Containing Block Copolymer Films
5.1. Introduction
Chapter 4 established how film morphology is affected by film thickness,
processing conditions, and substrate treatment. Morphology of the hydrophilic and
hydrophobic domains is an important factor in determining the material’s uptake and
swelling by water as well as ionic conductivity of ion-containing block copolymer thin
films. For the same degree of sulfonation, conductivity has been shown to increase by an
order of magnitude for morphologies that favor water uptake.1 Water uptake can be
characterized volumetrically (by change in thickness via swelling) or gravimetrically (by
change in mass). In this chapter, spectroscopic ellipsometry was used to investigate
volumetric water uptake as a function of film thickness, substrate wettability, and
morphology. A series of 12 films were studied (shown in Table 5-1) to systematically
quantify how the sample characteristics mentioned previously influence thin film
swelling behavior. Films were spin cast onto substrates with various surface treatments
and exposed to increasing humidity. Time-resolved spectroscopic ellipsometry was used
to measure the optical properties, in the form of the complex index of refraction and
thickness change, of ionic block copolymer films in response to changes in the sample
environment relative humidity. Ellipsometry proved to be an insightful and innovative
tool to characterize in situ transitions in optical properties and thickness as the
composition of the films changed with water absorption.

69
Sulfonated poly(styrene)-b-poly(methyl methacrylate) is hygroscopic, so a sPS-
PMMA film readily absorbs water as it is exposed to humidity. It has been established
that the polymer component with the most compatible surface energy will segregate to
the surface, influencing the morphology, and thus the swelling characteristics of the film.
Film thickness may affect swelling because the concentration of polymer chains varies
from the substrate to free surface more in thin films. As such, substrate treatment is a
factor in film swelling because, as presented in Chapter 4, substrate wettability influences
film morphology. It was found that thin proton exchange membrane films on
hydrophobic substrates swelled the fastest and to the greatest extent. This behavior was
an unexpected result because while hydrophobic substrates allow block copolymer thin
films to swell more, as discussed in Chapter 2, they cause homopolymer thin films to
swell less.2, 3 The large difference in water uptake for thin films of various thickness and
substrate treatment showed that thin films were much more sensitive to substrate
treatments, indicating a strong correlation between film morphology and swelling in thin
films. Thick films (>320 nm thick) displayed similar equilibrium swelling profiles
regardless of the underlying substrate, implying that substrate treatment effects permeate
a finite distance into the polymer films.
Spectroscopic ellipsometry was used to characterize swelling in real time as
polymer films 20-400 nm in thickness were exposed to relative humidity from 0 to 90%
at room temperature and a flow rate of 550 cm3 min-1. Ellipsometry measurements were
performed over a spectral wavelength range of 240-1700 nm (0.75 to 5.15 eV). Results
were used to understand contributions of polymer-substrate interaction and film thickness

70
to the swelling behavior in thin films of sulfonated poly(styrene)-b-poly(methyl
methacrylate).
Spectroscopic ellipsometry detects changes in both the amplitude and polarization
state of light reflected from a layered material and is used to determine the complex
refractive index and thickness of each layer. Ellipsometry is commonly used to measure
material properties in-situ in real time because the experimental setup of an ellipsometer
allows a sample to be characterized in non-contact fashion in an environmental cell.4 A
sample chamber with non-polarizing windows was created to transmit the maximum
amount of light while offering an environment with a controllable humidity. Details
about the experimental set up for this series of experiments can be found in Chapter 3,
while more information about spectroscopic ellipsometry background can be found in
Chapter 2.
5.2. Thin Film Swelling
As a PEM film absorbs water, its composition changes, altering the film
thickness, refractive index, and dielectric properties. Figure 5-1 shows the thickness
change in real time of a film as it is exposed to ambient, 0, 25, 50, 75, and 90 % relative
humidity, (RH %), as delineated by the vertical dashed lines above the data. The
thickness at time t, lt, decreases as the film is exposed to dry (0% RH) air, and
subsequently expands as the relative humidity in the sample cell was increased. Figure 5-
1 shows that at higher relative humidities the film expanded more per step. Data in
Figures 5-2 through 5-12 is taken from the curve in Figure 5-1, as indicated by the dotted
and solid lines and arrows. The solid black lines and arrows indicate how the thickness

71
change was characterized at 50 and 75 % RH, as plotted in Figure 5-2 and 5-6. The grey
line indicates the slope of water uptake for 50 and 75 % RH, which is included in Figures
5-7 and 5-8. The dotted lines and arrows indicate the percent swelling from dry film
thickness for every RH, which is plotted again in Figures 5-9 through 5-12.
Figure 5-1. Thickness change, lt, of a 350 nm thick (at ambient) sPS-b-PMMA film as it is exposed to increasing humidity, measured by spectroscopic ellipsometry. The humidity levels listed at the top were incremented as indicated by the circular dotted drop lines. Data taken from the curve is indicated by the dotted square lines, solid lines and arrows. The grey line indicates the slope of water uptake for 50 and 75 % RH, the solid black lines and arrows indicate the thickness change for 50 and 75 % RH, and the dotted lines and arrows indicate the percent swelling from dry film thickness for every RH.
Table 5-1. Fabrication details for the 12 films investigated in ellipsometric swelling experiments. Films were created at 4 thicknesses (in columns, 2 spin casting speeds, 2 solution concentrations) and on three different substrate treatments (across rows).
1% solution, 3000 rpm
1% solution, 1000 rpm
5% solution, 3000 rpm
5% solution, 1000 rpm
Native oxide 23.2 nm 41.4 nm 180.0 nm 343.0 nm
APTMS 28.9 nm 49.0 nm 184.0 nm 380.0 nm HMDS 22.8 nm 43.0 nm 184.5 nm 323.0 nm
0 600 1200 1800 2400 3000 3600 4200 4800
350
375
400
425
450
l t (nm
)
t (s)
0 % RH
ambi
ent 25 %
RH 50 % RH
75 % RH
90 % RH

72
5.2.1. Description of the Swelling Process
Swelling curves could not be fit to a first order diffusion equation, indicating that
the swelling was not due to diffusion alone. As the polymer is plasticized by water,
chains relax, allowing for more water to be absorbed, thus increasing the thickness of the
film. In an attempt to calculate a rate constant for the rate of swelling, data was modeled
using the following diffusion-based water uptake equation. 5
⎥⎦
⎤⎢⎣
⎡⎟⎟⎠
⎞⎜⎜⎝
⎛−−=
∞∞ tk
`exp1`` 1
ααα
where α’∞ is the equilibrium degree of swelling, k1 is the rate constant of swelling, t is
time and the degree of swelling, α’, has be defined as follows:
(5-2) t
t
lll 0−
=′α
where lt is thickness at time t and l0 is the original thickness. Figure 5-2 shows in-situ
swelling data along with a curve described by equation 5-1 that was fit to the data with
lowest mean square error. The diffusion equation is obviously a poor fit for the water
uptake data, with some films taking over 20 min to fully equilibrate. A method for fitting
dielectric relaxation using the Kohlrausch-Watts-Williams (KWW) or stretched
exponential equation was used to fit the data more closely.6
(5-3)
The stretched exponential represents dynamic relaxation by using a rate constant,
k, to determine deviation from an exponential function and allows for data comparison.
(5-1)
⎥⎥⎦
⎤
⎢⎢⎣
⎡
⎟⎟
⎠
⎞
⎜⎜
⎝
⎛⎟⎟⎠
⎞⎜⎜⎝
⎛−−=
∞∞
β
ααα tk
'exp1''

73
Table 5-2 shows the calculated swelling rates, k, and degree of decay, as given by how
much β is than 1, where 0 < β < 1.
Although the diffusion coefficient of water sorption into ultra thin films has been
calculated using a Fickian model,2, 7 swelling in this study cannot be described by Fickian
diffusion alone. Simple diffusion would only account for the immediate absorption of
water into the thin film. As discussed in Chapter 2, polymer chains will selectively
deposit on the substrate to reduce surface tension. This concentration of material at the
substrate creates a greater amount of free volume at the free surface,8 affecting relaxation
time,8-14 small molecule diffusivity,7, 8, 10-13, 15-20 and swelling characteristics.2, 7, 13, 21-23
Therefore, the dynamics of these films are dominated by relaxation of the polymer, rather
than diffusion of water. Other quantitative models for the relaxation behavior are being
explored.
Table 5-2. Values of calculated swelling rates, k, and exponential decay, β, for the thinnest and thickest sPS-b-PMMA films on native oxide silicon, HMDS-, and APTMS-coated silicon for the 50 and 75 % relative humidity increments.
The rates of swelling, k, are the most descriptive for which films absorbed water
the fastest, with the thinnest film on HMDS swelling the fastest. The films all show
50% RH
75% RH
50% RH
75% RH
Thickness (nm) Substrate K k β Β 23 Bare 0.061 0.087 0.543 0.553 23 HMDS 0.210 0.240 0.523 0.541 29 APTMS 0.101 0.167 0.648 0.631
343 Bare 0.090 0.141 0.542 0.577 323 HMDS 0.158 0.114 0.557 0.543 380 APTMS 0.093 0.122 0.560 0.540

74
similar amounts of exponential decay, β, and there is no trend in β. Figure 5-2 shows the
comparison of the fit of Equations 5-1 and 5-3 for when the swelling is incremented from
25 to 50 % RH for the ultrathin film on HMDS, which is the fastest swelling sample.
Similar results are represented by the slopes shown in Figures 5-7 and 5-8.
0 120 240 360 480 6000.00
0.02
0.04
0.06
0.08
0.10
0.12
α '
t (s)
Figure 5-2. Swelling of l0 =21.7 nm thick film on HMDS () showing dynamic degree of swelling, α’, as humidity is increased from 25% RH to 50% RH. The grey line shows the lowest mean square error model fit of α’. The model on the left, calculated using Equation 5-1, does not accurately describe the initial rate of uptake or the secondary swelling towards equilibrium, proving that this type of swelling is not a first order diffusion process. The model on the right shows the stretched exponential that is a much better fit to the data, as calculated using Equation 5-3.
5.2.2. Thickness Change at Equilibrium
It has been found that thin polymer films on hydrophobic substrate treatments
swelled less in comparison to thicker films (150 nm), while films 3 to 100 nm in
thickness on hydrophilic substrates absorbed the same volume fraction of water.2 This
effect is attributed to the polymer-substrate interactions. The native oxide on the bare
silicon wafer induces hydrogen bonding between the polymer and the substrate. On
hydrophobic HMDS substrate treatments, the polymer is not attracted to the substrate,
and the polymer is less confined at the substrate interface, resulting in a higher overall
0 120 240 360 480 6000.00
0.02
0.04
0.06
0.08
0.10
0.12
α '
t (s)

75
degree of swelling for ultra thin polymer films. As explained in Chapter 4, it was found
that a hydrophobic substrate attracted the hydrophobic block to the substrate interface,
allowing hydrophilic polymer to spread over the free surface. Subsequently, the ultrathin
block copolymer films on hydrophobic substrates swelled the most because the
hydrophilic polymer was able to expand without restriction. Figure 5-3 shows the
swelling of the thinnest (~25 nm) sPS-PMMA films on HMDS, APTMS, and bare
substrates. To compare the swelling rate and total equilibrium swelling for a range of
sample thicknesses, data was normalized to its original thickness using Equation 5-4.
Normalized thickness, ln, was given as the ratio of thickness at time t, lt, to original
thickness, l0∞, (equilibrium swelling at previous humidity level). Data in Figures 5-3
through 5-8 are based on this normalized thickness, ln.
(5-4) ∞
=0ll
l tn
The ln scale shows how much the film has swelled since the equilibrium thickness
at the last humidity step, so in Figure 5-3, thin films on HMDS and APTMS coated
substrates swell 3.8 % when the humidity is incremented from 25 % RH to 50 %. The
film on bare silicon swelled 2.7 % during the same humidity increment. For the 50 %
RH step in Figure 5-3, the thinnest films on HMDS and APTMS had the largest
equilibrium degree of swelling. In Figure 5-4, the thinnest film on HMDS swelled 11.6
% during the 50 % RH to 75 % RH increment while the film on native oxide silicon
swelled 8.2 % and on APTMS swelled 7.4 % during the RH change. The greater
swelling changes on HMDS surfaces can be attributed to the largely unrestricted
sulfonated phase blanketing air surface of the film as seen in Figure 4-7c.

76
0 120 240 360 480 600 7201.00
1.01
1.02
1.03
1.04
l n
t (s)
Figure 5-3. The degree of swelling, ln, normalized by the equilibrated thickness at 25 % RH of the thinnest sulfonated poly(styrene)-poly(methyl methacrylate) films l0 = 21.7 nm on HMDS (), l0 =28.8 nm on APTMS (), l0 = 23.5 nm on bare silicon () as humidity is increased from 25 % RH to 50 % RH.
0 120 240 360 480 600 720 840 960 10801.00
1.02
1.04
1.06
1.08
1.10
1.12 l n
t (s)
Figure 5-4. The degree of swelling, ln, normalized by the equilibrated thickness at 50 % RH of the thinnest sulfonated poly(styrene)-poly(methyl methacrylate) films l0 = 22.4 nm on HMDS (), l0 = 29.7 nm on APTMS (), l0 = 24.5 nm on bare silicon () as humidity is increased from 50 % RH to 75 % RH.

77
Figure 5-3 and 5-4 also show that the films on HMDS and APTMS reached
equilibrium before the film on bare silicon. This difference in swelling rate could have
been due to chain confinement from hydrogen bonding with SiOx on the surface of the
silicon. A comparison of Figure 5-3 and 5-5 shows that despite thickness, films on
hydrophobic substrate treatments reached their final thickness after relative humidity
increments the fastest. This behavior implies that polymer-substrate interactions have
more of an effect on initial and long term swelling rate on ultra thin films. Figures 5-5
and 5-6 show that thick films swell nearly the same amount, regardless of substrate
treatment, for both at the 25-50 % RH and 50-75 % RH steps.
0 120 240 360 480 600 7201.00
1.01
1.02
1.03
1.04
l n
t (s)
Figure 5-5. The degree of swelling, ln, normalized by the equilibrated thickness at 25 % RH of the thickest sulfonated poly(styrene)-b-poly(methyl methacrylate) films l0 = 326.9 on HMDS () l0 = 347.6 nm on bare silicon (), and l0 = 383.3 nm on APTMS () as humidity is increased from 25 % RH to 50 % RH.

78
0 120 240 360 480 600 720 840 9601.00
1.02
1.04
1.06
1.08
1.10
l n
t (s)
Figure 5-6. The degree of swelling, ln, normalized by the equilibrated thickness at 50 % RH of the thickest sulfonated poly(styrene)-b-poly(methyl methacrylate) films l0 = 341.8 nm on HMDS (), l0 = 361.2 nm on bare silicon (), and l0 = 396.6 nm on APTMS (), as humidity is increased from 50 % RH to 75 % RH. 5.2.3. Initial Swelling Rate
Since the simple swelling model (Equation 5-1) did not fit the data well, the slope
of the initial linear portion of the experimental data in Figures 5-3 through 5-6 was used
to compare the initial rates of swelling for various samples. Initial slopes were compared
for the 25 to 50 % RH step as well as the 50 to 75 % RH step, for the thinnest (~25 nm)
and thickest films (~350 nm) of the series on three types of substrate treatments, as seen
in Figures 5-7 and 5-8. It was found that in the thinnest films, regardless of substrate
treatment, the rate of water uptake is about twice as fast when humidity is increased from
25 to 50 % RH as compared to the 50 to 75 % RH step. This trend is observed when
PEMs reach a point of hydration where the sulfonated groups are mostly solvated and
have less of an attraction for water, therefore the swelling rate is lower as the humidity is

79
increased.24 Films on hydrophobic HMDS absorbed water twice as fast as films on other
substrates.
10 20 30 40 50 60 70 80 90 100
1.00
1.01
1.02
1.03
1.04
1.05
1.06
1.07
l n
t (s)10 20 30 40 50 60 70
1.000
1.005
1.010
1.015
1.020
1.025
1.030
l n
t (s) Figure 5-7. a) The degree of swelling, ln, normalized by the equilibrated thickness at 50 % RH of the thinnest sulfonated polystyrene-polymethyl methacrylate films l0 =21.7 nm on HMDS (), l0 = 23.5 nm on bare silicon (), l0 = 28.8 nm on APTMS (), as humidity is increased from 25 % RH to 50 % RH. b) The degree of swelling, ln, normalized by the equilibrated thickness at 50 % RH of the thinnest sulfonated poly(styrene)-poly(methyl methacrylate) films l0 = 22.4 nm on HMDS (), l0 = 24.5 nm on bare silicon (), l0 = 29.7 nm on APTMS (), as humidity is increased from 50 % RH to 75 % RH. The slopes are in units of s-1.
Figure 5-8 shows that for thick films, there is a 50 % increase in rate of water
uptake from the 50 % RH step to the 75 %RH step for the thickest films on APTMS and
the bare wafer, but the rate of water uptake for the films on HMDS did not change. Thick
films did not absorb water as quickly as thin films in the 50 % RH step. These results
support the theory that the confinement of chains at the substrate-polymer interface in
thin films creates more free volume at the surface, allowing for faster polymer relaxation,
water sorption, and thickness change.
slope 0.00121 0.00062 0.00058
slope 0.00223 0.00109 0.00103

80
20 30 40 50 60 70 80 901.00
1.01
1.02
1.03
1.04
1.05
1.06
l n
t (s)20 30 40 50 60 70
1.000
1.005
1.010
1.015
1.020
1.025
l n
t (s) Figure 5-8. a) The degree of swelling, ln, normalized by the equilibrated thickness at 25 % RH of the thickest sulfonated poly(styrene)-poly(methyl methacrylate) films l0 = 326.9 on HMDS (), l0 = 383.3 nm on APTMS (), l0 = 347.6 nm on bare silicon () as humidity is increased from 25 % RH to 50 % RH. b) The degree of swelling, ln, normalized by the equilibrated thickness at 50 % RH of the thickest sulfonated poly(styrene)-poly(methyl methacrylate) films l0 = 341.8 nm on HMDS (), l0 = 396.6 nm on APTMS (), l0 = 361.2 nm on bare silicon () as humidity is increased from 50 % RH to 75 % RH. 5.2.4. Total Thickness Change at Equilibrium as a Function of Relative Humidity
The overall degree of thickness change at equilibrium, based on substrate
treatment and film thickness, was examined. Swelling, S (%), was calculated as the
thickness of the equilibrated film at a given humidity, lt∞, divided by the dry film
thickness, l0, as shown in Equation 5-5.
(5-5) 0l
lS t∞=
It was observed that the thickest films (~350 nm) swelled to approximately 25 %
of their original thickness regardless of substrate treatment. On the other hand, the
swelling of films with initial thicknesses on the order of 25 nm, , were very sensitive to
surface treatment, and the thinnest film on a hydrophobic HMDS surface swelled the
most. The connection between morphology and swelling can be rationalized by the
morphological data in Figure 4-7, where the hydrophobic HMDS substrate treatment
slope 0.00152 0.00129 0.00087
slope 0.00103 0.00087 0.00085

81
caused the hydrophobic PMMA block to wet the substrate. This surface wetting induced
by the substrate treatment increased the concentration of sulfonated polystyrene at the
free surface, so film swelling was less inhibited by the glassy PMMA block.
For swelling as a function of film thickness on a particular substrate, the thinnest
film on HMDS substrate swelled the most, while the thinnest film on APTMS swelled the
least, with films on bare silicon between the two. Figure 5-9 shows that the thinnest film
swelled the most on HMDS, while Figure 5-10 shows that the thicker the film on
APTMS, the more it swelled. These opposite trends in thin films verify the influence that
surface coating and film morphology has on swelling in ionic block copolymer films.
0 20 40 60 80 100
0
5
10
15
20
25
30
S (%
)
RH (%)
Figure 5-9. Degree of swelling (%) at equilibrium of sulfonated poly(styrene)-b-poly(methyl methacrylate) films of four thicknesses, 22.8 nm (), 43.0 nm (), 184.5 nm (), 323.0 nm (), on a hydrophobic HMDS-coated silicon wafer for relative humidities from 0 to 90 % RH.

82
0 20 40 60 80 100
0
5
10
15
20
25
30
S (%
)
RH (%)
Figure 5-10. Degree of swelling (%) at equilibrium as a function of relative humidity for sulfonated poly(styrene)-poly(methyl methacrylate) films of four thicknesses on an APTMS-coated silicon wafer. Thicknesses were 28.9 nm (), 49.0 nm (), 184.0 nm, (), 380.0 nm (). There was a clear trend between film thickness on APTMS and the degree of swelling: the thickest film swelled the most while the thinnest film on APTMS swelled the least.
Figures 5-11 and 5-12 exemplify the significance of substrate treatment in
swelling for a range of film thicknesses. For films approximately 25 nm thick (Figure 5-
11), substrate treatment greatly affected how much the film swelled from 0 to 90% RH,
while films 350 nm thick showed similar overall swelling regardless of substrate (Figure
5-12). This data confirms that polymer-substrate interactions dictate film properties for
thin films with a high ratio of surface area to volume. Figure 5-12 depicts that the
interfacial properties have little effect on swelling behavior in thick films.

83
0 20 40 60 80 100
0
5
10
15
20
25
30
S (%
)
RH (%)
Figure 5-11. Degree of swelling (%) at equilibrium of ultra thin films sulfonated poly(styrene)-poly(methyl methacrylate) on three different substrate treatments on silicon wafers. Films are 22.8 nm thick on HMDS (), 23.2 nm thick on bare silicon () and 28.9 nm thick on APTMS (). The thin film on HMDS had the largest degree of swelling as humidity was increased from 0 to 90 % RH. At 90 % RH, the film on HMDS, bare silicon, and APMTS swelled 29 %, 26 %, 20 % of their original thickness, respectively.
0 20 40 60 80 100
0
5
10
15
20
25
30
S (%
)
RH (%)
Figure 5-12. Degree of swelling (%) at equilibrium of thick sulfonated poly(styrene)-poly(methyl methacrylate) films on three different substrate treatments on silicon wafers. Films are 323.0 nm thick on HMDS (), 343.0 nm thick on bare silicon () and 380.0 nm thick on APTMS (). Thick films all showed similar degrees of swelling as humidity was increased from 0 to 90 % RH. At 90 % RH, the film on HMDS, bare silicon, and APMTS swelled 24 %, 26 %, 26 % of their original thickness, respectively.

84
5.3. Conclusions
Spectroscopic ellipsometry was used for characterizing the dynamic change in
thickness while sulfonated poly(styrene)-b-poly(methyl methacrylate) films swelled in a
humidity-controlled cell. Thickness change and swelling characteristics were compared
for films over a series of thicknesses and substrate treatments. For ultra thin films 23-29
nm thick when dry, substrate treatment greatly affected how much the film swelled from
0 to 90 % RH, while films 350 nm in thickness showed similar overall swelling
regardless of substrate treatment.
Substrate treatment affected both the initial swelling rate as well as the overall
time it took for the film the reach an equilibrium thickness at a given relative humidity.
The thinnest films on HMDS swelled the fastest and to the greatest extent, supporting the
model that less confinement of chains at the substrate-polymer interface in thin films
allows for faster polymer relaxation and water uptake. In ultra thin films, the rate of
water uptake is twice as fast at when humidity is incremented from 25 % RH to 50 %
RH, compared to the change from 50 to 75 % RH, because the sulfonate groups are more
solvated and have less of a driving force for hydration at higher humidities.
It was surprising that thin films on hydrophobic substrates swelled to the greatest
extent because, while hydrophobic substrates allow ionic block copolymer thin films to
swell more, in other reports, they cause homopolymer thin films to swell less.2 Attempts
to fit dynamic swelling data to a basic water sorption model were unsuccessful, proving
that absorption is not due to diffusion alone. Since swelling in thin films cannot be
described as a first order process, this implies that film expansion is due to both diffusion
of water and simultaneous polymer relaxation, the description of which is an area of

85
future work. The large difference in the swelling extent for thin films with different
surface treatments indicates a strong correlation between thin film morphology and
swelling. These results confirm that polymer-substrate interactions dictate ion-containing
block copolymer film properties for thin films with a high ratio of surface area to volume.
In the future, swelling of ionic block copolymer films with organized or patterned
geometric structures would be an essential addition to this work.
References
1. Rubatat, L.; Li, C. X.; Dietsch, H.; Nykanen, A.; Ruokolainen, J.; Mezzenga, R., Structure-Properties Relationship in Proton Conductive Sulfonated Polystyrene-Polymethyl Methacrylate Block Copolymers (sPS-PMMA). Macromolecules 2008, 41, (21), 8130-8137. 2. Vogt, B. D.; Soles, C. L.; Lee, H.-J.; Lin, E. K.; Wu, W.-l., Moisture absorption into ultrathin hydrophilic polymer films on different substrate surfaces. Polymer 2005, 46, (5), 1635-1642. 3. Tan, N. C. B.; Wu, W. L.; Wallace, W. E.; Davis, G. T., Interface effects on moisture absorption in ultrathin polyimide films. Journal of Polymer Science Part B-Polymer Physics 1998, 36, (1), 155-162. 4. Li, Y.; Park, E. J.; Lim, K. T. L.; Johnston, K. P.; Green, P. F., Role of interfacial interactions on the anomalous swelling of polymer thin films in supercritical carbon dioxide. Journal of Polymer Science Part B-Polymer Physics 2007, 45, (11), 1313-1324. 5. Mencer, H. J.; Gomzi, Z., SWELLING KINETICS OF POLYMER-SOLVENT SYSTEMS. European Polymer Journal 1994, 30, (1), 33-36. 6. Williams, G.; Watts, D. C., Non-Symmetrical Dielectric Relaxation Behaviour Arising from a Simple Empirical Decay Function. Transactions of the Faraday Society 1970, 66, (565P), 80-&. 7. Vogt, B. D.; Soles, C. L.; Lee, H. J.; Lin, E. K.; Wu, W. L., Moisture absorption and absorption kinetics in polyelectrolyte films: Influence of film thickness. Langmuir 2004, 20, (4), 1453-1458. 8. Hall, D. B. Experimental studies of relaxation phenomena and diffusion in thin and ultrathin polymer films. Ph.D. Thesis. . Ph.D. Dissertation, Northwestern University 1999. 9. Agra, D. M. G.; Schwab, A. D.; Kim, J. H.; Kumar, S.; Dhinojwala, A., Relaxation dynamics of rubbed polystyrene thin films. Europhysics Letters 2000, 51, (6), 655-660. 10. Fujita, H.; Kishimoto, A., DIFFUSION-CONTROLLED STRESS RELAXATION IN POLYMERS .2. STRESS RELAXATION IN SWOLLEN POLYMERS. Journal of Polymer Science 1958, 28, (118), 547-567. 11. Hall, D. B.; Miller, R. D.; Torkelson, J. M., Molecular probe techniques for studying diffusion and relaxation in thin and ultrathin polymer films. Journal of Polymer Science Part B: Polymer Physics 1997, 35, (17), 2795-2802. 12. Kishimoto, A.; Fujita, H., Diffusion-Controlled Stress-Relaxation in Polymers, I. Kolloid Zeitschrift 1956, 1, (150), 11. 13. Kishimoto, A.; Hiroshi, F., Diffusion-controlled stress relaxation in polymers. III. Stress relaxation in a swelling polymer. Journal of Polymer Science 1958, 28, (118), 569-585. 14. Mundra, M. K.; Ellison, C. J.; Rittigstein, P.; Torkelson, J. M., Fluorescence studies of confinement in polymer films and nanocomposites: Glass transition temperature, plasticizer

86
effects, and sensitivity to stress relaxation and local polarity. European Physical Journal-Special Topics 2007, 141, 143-151. 15. Burnett, D. J.; Garcia, A. R.; Thielmann, F., Measuring moisture sorption and diffusion kinetics on proton exchange membranes using a gravimetric vapor sorption apparatus. Journal of Power Sources 2006, 160, (1), 426-430. 16. Edwards, D. A., Non-Fickian diffusion in thin polymer films. Journal of Polymer Science Part B-Polymer Physics 1996, 34, (5), 981-997. 17. Frank, B.; Gast, A. P.; Russell, T. P.; Brown, H. R.; Hawker, C. J., Polymer mobility in thin films. Macromolecules 1996, 29, (20), 6531-6534. 18. Hall, D. B.; Torkelson, J. M., Small molecule probe diffusion in thin and ultrathin supported polymer films. Macromolecules 1998, 31, (25), 8817-8825. 19. Vrentas, J. S.; Duda, J. L., Molecular-Diffusion in Polymer-Solutions. Aiche Journal 1979, 25, (1), 1-24. 20. Vrentas, J. S.; Jarzebski, C. M.; Duda, J. L., Deborah Number for Diffusion in Polymer-Solvent Systems. Aiche Journal 1975, 21, (5), 894-901. 21. Papanu, J. S.; Hess, D. W.; Bell, A. T.; Soane, D. S., In-Situ Ellipsometry to Monitor Swelling and Dissolution of Thin Polymer Films. Journal of the Electrochemical Society 1989, 136, (4), 1195-1200. 22. Singh, A.; Mukherjee, M., Swelling dynamics of ultrathin polymer films. Macromolecules 2003, 36, (23), 8728-8731. 23. Sirard, S. M.; Green, P. F.; Johnston, K. P., Spectroscopic ellipsometry investigation of the swelling of poly(dimethylsiloxane) thin films with high pressure carbon dioxide. Journal of Physical Chemistry B 2001, 105, (4), 766-772. 24. Mangiagli, P. M.; Ewing, C. S.; Xu, K.; Wang, Q.; Hickner, M. A., Dynamic Water Uptake of Flexible Ion-Containing Polymer Networks. Fuel Cells 2009, 9, (4), 432-438.

87
Chapter 6
Conductivity of Ion-Containing Block Copolymer Films
6.1. Introduction
Proton conductivity is the single most important feature of a proton exchange
membrane (PEM). Although bulk PEMs have been widely studied, little attention has
been given to thin film ionic block copolymer swelling and conductivity. Thin ionic
polymer films play a significant role in fuel cell operation: the catalyst layer is coated
with ionomer to lower the resistance during proton transfer between the catalyst layer and
the proton exchange membrane. Proper coating with a thin layer of ionomer (estimated
to be 5-50 nm thick)1 is essential to accessing reaction sites at all of the platinum surface
area within the catalyst layer. Overall fuel cell efficiency can be improved when thin
film proton conductivity in the catalyst layer is increased.2
Typically, it has been assumed that thin ionomer films possess the same properties,
e.g. water uptake and conductivity, as bulk membranes. However, in thin ionomer films,
the substrate and air interfaces affect film morphology and water uptake, as demonstrated
in previous chapters. The high ratio of surface area to volume in films less than 100 nm
in thickness results in a large percentage of interfacial polymer that may have different
properties than what is observed for bulk films. It has been established that there is an
inherent connection between the morphology of an ion-containing polymer, how much it
swells with water, and its proton conductivity.3 In this chapter, conductivity is
investigated as function of thickness and film processing. Thin films were created by

88
drop casting and spin casting onto silicon, as well as by casting into molds to form bulk
films. One limitation of the present work is that, due to experimental constraints, the
conductivity of a thin film on a substrate treated with HMDS or APTMS, as described
above for morphology and water uptake, cannot be measured. Since electrodes are
attached to the substrate, substrate coatings would cover the electrodes and the resistance
of the substrate treatment may affect the conductivity results obtained. Due to this
limitation, thin film conductivity was only measured on a bare Si substrate with an
insulating oxide layer of 90 nm so that the conductivity of silicon did not skew the
measurement.
Yasuda, et al.4, 5 provided the initial report on thin film ion conductivity via
impedance spectroscopy. They found that the film conductivity of spin cast Nafion
samples decreased as the thickness of the film on silicon decreased. As conductivity is an
intrinsic material property, it is not anticipated to change for films with varying thickness.
Equation 6-1 shows how the resistance of a sample is used to compute the conductivity
(6-1) AR ⋅
=lσ
where σ is the proton conductivity, l is the path length between electrodes, A is the cross
sectional area of the film available for proton transport, and R is the measured resistance.
Yasuda, et al.4 reported that conductivity decreased as a logarithmic factor of thickness,
over a scale of bulk (500 μm) to ultra thin (5 nm) films. Thinner films were found to
have higher activation energies for ionic conductivity, indicating that some inherent
structural changes with thickness influence their conductive nature. It was suggested that
thin films absorb less water, thus lowering conductivity. In addition to water uptake
changes with film thickness, morphological effects, could have an influence on the

89
measured conductivity. However, neither water uptake nor morphology was investigated
in Yasuda’s work.
In this study, proton conductivity was measured for sPS-b-PMMA films 80 nm to 60
μm thick. Since morphology is greatly influenced by film processing, conductivity
showed a dependence on how films were cast. Drop cast films had higher conductivities
due to the longer casting times which afforded better organization of the ionic domains.
6.2. Conductivity of Spin Cast Thin Films
Since processing conditions have a strong influence on resulting polymer
morphology, it is important to investigate how various film processing techniques affect
conductivity. Thin film morphologies are influenced by solution concentration, spin
Figure 6-1. Dependence of the conductivity of recast Nafion® thin film on film thickness. Samples were measured at 85 ºC and a relative humidity of 85 % () or 60 % (). Solid data points () represent bulk membranes (Nafion® 112, 115, and 117).4

90
speed, and thickness, so creating films via spin casting can create a range of
morphologies, and thus different conductivity for the same material. Films 86 nm to 2.5
μm thick were fabricated by spin casting sulfonated poly(styrene)-b-poly(methyl
methacrylate) from 1 and 5 % w/w solutions in dimethylformamide (DMF) at spin speeds
of 500 to 4000 rpm. Figure 6-2 shows that the measured proton conductivity initially
decreases as the thickness of the film increases, but the thickest film has a greater
conductivity than the other samples. The higher degree of interfacial area per volume
could contribute to this range of conductivity as a function of thickness.
100 10000.000
0.005
0.010
0.015
0.020
0.025
0.030
σ (S
cm
-1)
lt (nm)
Figure 6-2. Conductivity, σ, as a function of film thickness, lt, for spin cast sulfonated poly(styrene)-b-poly(methyl methacrylate) films from 86 nm to 2.5 μm thick measured at 90%RH and 25°C. Samples include molecular weights in kg mol-1 and degrees of sulfonation of 403-263, DS 74 % (), 203-165, DS 100 % (), 186-106, DS 93 % (), 170-128, DS 100 % (), 120-90, DS 100 % (), 80-52, DS 100 % ().

91
While the films less than 500 nm in thickness dried within a minute of spin
casting, at least 5 min were required for the 2.5 μm thick film to dry, which could have
allowed more time for ionic domain organization. The thicker film subsequently showed
higher conductivity, displaying characteristics more like a drop cast film.
Decreasing conductivity with increasing thickness in this study was unexpected
given Yasuda’s initial data. However, there are reports of the conductivity of electrolyte-
filled track-etched membranes increasing with decreasing pore radius.6 Physical
mechanisms for the conductivity increase with decreasing pore radius have not been
provided, but there could be advantageous proton transport on the surface or at the
interface of thin electrolyte layers. If protons are transported more easily at interfaces,
films of various thicknesses would have similar resistances but different conductivities
based on thickness (see Equation 3-1). The previous results on different pore size
membranes and the results for the spin cast films with thicknesses less than 500 nm in
Fig. 6-2 would tend to support one another, but further study of the mechanism of proton
transport in the presence of large interfacial areas is required.
6.3. Conductivity of Drop Cast Thin Films Drop cast films showed dependence of conductivity on film thickness. Since drop
cast films are slowly dried over a period of at least 24 hours, the polymer domains have
more time to kinetically arrange into a phase separated morphology. By allowing the
polymer more time to phase separate, the morphology of the film, and therefore the
conductivity, is less susceptible to processing effects. Figure 6-3 shows the trend
between decreasing conductivity with decreasing film thickness, lt, for samples created

92
by drop casting 1 and 5% w/w solutions of sulfonated poly(styrene)-b-poly(methyl
methacrylate) in DMF.
Bulk film conductivity was measured for a series of sulfonate poly(styrene)-b-
poly(methyl methacrylate) cast into Teflon ® molds. Films cast from 5 w/w % solution
(DMF) were slowly dried for more than 10 days. Conductivities were measured as a
function of relative humidity, as shown in Figure 6-3. The outlier of the series with the
lowest conductivity at 90 % RH also has the lowest degree of sulfonation. While it has
the most sulfonate groups because it is the highest molecular weight, those groups are
less concentrated because the polymer has a degree of sulfonation of only 74 %. Figure
6-3 shows that molecular weight has little effect on conductivity, with films over a large
range of sPS-b-PMMA molecular weights showing similar conductivities up to 90% RH.
20 40 60 80 100
0.000
0.005
0.010
0.015
0.020
0.025
σ (S
cm
-1)
RH (%)
Figure 6-3. Conductivity, σ, as a function of relative humidity for bulk films (~50 μm inthickness) for a variety of sulfonated poly(styrene)-b-poly(methyl methacrylate) molecular weights. Samples include molecular weights in kg mol-1 and degrees of sulfonation of 403-263, DS 74 % (), 203-165, DS 100 % (), 186-106, DS 93 % (), 170-128, DS 100 % (), 120-90, DS 100 % (), 80-52, DS 100 % ().

93
The conductivities of sPS-b-PMMA films created by drop casting and bulk film
casting are shown in Figure 6-4. Drop cast films are indicated by the dotted circle while
bulk films are indicated by the solid circle. Films drop cast onto silicon wafers dried over
a period of at least 8 hours while bulk films dried over at least 10 days. Details of film
fabrication can be found in Chapter 3. Bulk and drop cast films show that conductivity
decreases logarithmically with thickness, similar to Yasuda’s findings.4 Since thicker
films are made by slowly drying sPS-b-PMMA from solution, these films allowed for the
films to reach a more favorable kinetic arrangement. Conductivity subsequently shows a
clearer trend with thickness for slowly dried films than for spin cast films.
1000 10000 1000000.000
0.005
0.010
0.015
0.020
0.025
0.030
σ (S
cm
-1)
lt (nm)
Figure 6-4. Conductivity, σ, as a function of thickness, lt, for drop cast and bulk films. Conductivities were measured at 90 % RH and 25 °C. The solid circle surrounds bulk films created in molds. The dotted circle indicates films that were drop cast. Samples include molecular weights in kg mol-1 and degrees of sulfonation of 403-263, DS 74 % (), 203-165, DS 100 % (), 186-106, DS 93 % (), 170-128, DS 100 % (), 120-90, DS 100 % (), 80-52, DS 100 % ().

94
6.4. Conclusions and Future Work
Film processing methods had an effect on the measured conductivity of ionic
block copolymer samples. Films that were slowly dried from drop cast solutions showed
a trend between conductivity and film thickness, while films that were spin cast did not.
Creating a reliable method for repeatable conductivity measurements of thin films is an
important future step. Although similar research has measured conductivity by sputtering
gold electrodes onto glass slides,3 we found this method to be far less consistent from
sample to sample. The method of electrode creation using photolithography is the best
option, although, more development is required to make this a robust, repeatable, and
routine measurement. In the future, a larger array of samples must be characterized to
ensure that these trends are accurate.
References
1. Eikerling, M., Water management in cathode catalyst layers of PEM fuel cells - A structure-based model. Journal of the Electrochemical Society 2006, 153, (3), E58-E70. 2. Liu, Y. X.; Murphy, M. W.; Baker, D. R.; Gu, W. B.; Ji, C. C.; Jorne, J.; Gasteiger, H. A., Proton Conduction and Oxygen Reduction Kinetics in PEM Fuel Cell Cathodes: Effects of Ionomer-to-Carbon Ratio and Relative Humidity. Journal of the Electrochemical Society 2009, 156, (8), B970-B980. 3. Rubatat, L.; Li, C. X.; Dietsch, H.; Nykanen, A.; Ruokolainen, J.; Mezzenga, R., Structure-Properties Relationship in Proton Conductive Sulfonated Polystyrene-Polymethyl Methacrylate Block Copolymers (sPS-PMMA). Macromolecules 2008, 41, (21), 8130-8137. 4. Siroma, Z.; Kakitsubo, R.; Fujiwara, N.; Ioroi, T.; Yamazaki, S. I.; Yasuda, K., Depression of proton conductivity in recast Nafion (R) film measured on flat substrate. Journal of Power Sources 2009, 189, (2), 994-998. 5. Siroma, Z.; Ioroi, T.; Fujiwara, N.; Yasuda, K., Proton conductivity along interface in thin cast film of Nafion (R). Electrochemistry Communications 2002, 4, (2), 143-145. 6. Chen, H.; Palmese, G. R.; Elabd, Y. A., Membranes with oriented polyelectrolyte nanodomains. Chemistry of Materials 2006, 18, (20), 4875-4881.

95
Chapter 7
Conclusions and Future Work
7.1. Summary and Conclusions
Morphology, swelling, and conductivity of thin ion-containing block copolymer
films were investigated and to determine the fundamental water sorption phenomena and
morphological features that may influence the conductivity of thin films. Film
morphology was studied as a function of processing conditions, thickness, and substrate
treatment. Spectroscopic ellipsometry was used to characterize the dynamic change in
thickness and optical properties while sPS-b-PMMA films swelled in a humidity-
controlled cell. It was established that substrate treatment has the largest effect on film
morphology, which greatly influences swelling behavior in thin films. Substrate
treatment affected both the initial swelling rate as well as the overall time it took for the
film the reach an equilibrium thickness at a given relative humidity. The large difference
in the swelling extent for thin films (~ 25 nm) with different surface treatments indicates
a strong correlation between thin film morphology and swelling. These results confirm
that polymer-substrate interactions dictate ion-containing block copolymer film
properties for thin films with a high ratio of surface area to volume.
Film processing methods had an effect on the conductivity of ionic block
copolymer samples. Films that were slowly dried from drop cast solutions showed a
trend between conductivity and film thickness, while films that were spin cast did not.

96
Dynamic swelling data was fit to a stretched exponential model, proving that absorption
is due to both diffusion of water and simultaneous polymer relaxation.
7.2. Future Directions
While this research has answered important questions for a controlled set of
materials, it has elicited even more. In terms of future data modeling, since water
sorption in thin sPS-b-PMMA films has been shown to be the result of more than simple
diffusion, an equation to appropriately describe polymer relaxation during swelling must
be established. In terms of future sample preparations, swelling of ionic block copolymer
films with organized or patterned geometric structures would also be an essential addition
to this work.
Since spectroscopic ellipsometry (SE) was the most successful aspect of
characterizing dynamic changes in data, a central part of this study, future
characterization will include more specialized uses of SE. Mueller matrix ellipsometry
can be used to evaluate anisotropic optical changes by deriving optical properties in a
particular direction. When combined with infrared light, SE would give information
about the optical changes during swelling as well as molecular vibrational modes.
Tracking changes in the characteristic bonding of water would give valuable information
about how water interacts with itself and with the polymer as equilibrium water content
varies. The behavior of water within a hydrated ion conductive polymer film is still not
completely understood.
Since spectroscopic ellipsometry only gives information about the volumetric
water uptake, assumptions must be made about how the mass of the film changes when

97
water is absorbed. If the mass and volume change could be measured simultaneously, the
time lag between water sorption and polymer expansion could be determined and the real
density of the film could be calculated instead of assumed. In the future, a quartz crystal
microbalance (QCM) will be installed on the spectroscopic ellipsometer to
simultaneously measure gravimetric and volumetric water uptake. The polymer film
would have to be coated on a quartz crystal substrate that is compatible with the QCM
and the relative humidity chamber would have to be built around the QCM holder.
Ideally, a quartz crystal microbalance with dissipation (QCM-D) would give even more
information by determining film thickness, mass, density, and viscoelastic properties by
measuring both the dissipation and resonance frequency of the crystal after oscillations
are stopped. QCM-Ds allow for monitoring of both structural and mass changes of a thin
film, which would be a powerful tool when combined with spectroscopic ellipsometry.
A more reproducible and reliable method for conductivity measurements of thin
films needs to be developed. A larger array of samples must be characterized to ensure
that conductivity trends are accurate. Direct current conductivity of proton transfer in
humidified membranes should be measured and compared to AC impedance results in
order to better understand mechanisms of proton conduction in ion conductive thin films.
Conductivity will be measured on materials with more rubbery blocks than PMMA to
establish how the structural block affects overall swelling and conductivity in ionic block
copolymer thin films. For such an interesting and unexplored set of materials, there is
much more work to do to understand how water activity contributes to the dynamic
behavior of thin ion-containing polymer films.