dynamic testing of shock absorbers under non … testing of shock absorbers under non-sinusoidal...
TRANSCRIPT

373
Dynamic testing of shock absorbers undernon-sinusoidal conditions
D Kowalski1, M D Rao1*, J Blough2 and S Gruenberg21Michigan Technological University, Houghton, Michigan, USA2Keweenaw Research Center, Michigan Technological University, Michigan, USA
Abstract: This paper deals with the dynamic characterization of an automotive shock absorber, thecontinuation of an earlier work [1 ]. The objective of this ongoing research is to develop a testingand analysis methodology for obtaining dynamic properties of automotive shock absorbers for usein CAE-NVH low-to-mid-frequency chassis models. Stepped sine sweep excitation is currently usedin industry to obtain shock absorber parameters along with their frequency and amplitude depen-dence. Sine-on-sine testing, which involves excitation using two diVerent sine waves, has been donein this study to understand the eVects of the presence of multiple sine waves on the estimated dynamicproperties. In an eVort to obtain all frequency dependent parameters simultaneously, diVerent typesof broadband random excitation have also been studied. Results are compared with stepped sinesweep tests. Additionally, actual road data measured on diVerent road pro� les have been used asinput excitation to obtain the shock absorber parameters for broad frequency bands under realisticamplitude and frequency conditions. These results are compared with both simulated randomexcitation and stepped sine sweep test results.
Keywords: shock absorbers, dynamic properties, damping, sine-on-sine excitation, struts
NOTATION the most non-linear and complex elements to model.Parametric and non-parametric models exist for model-ling shock absorbers. A non-parametric model based ona accelerationa restoring force surface mapping has been developedC damping parameter[2–4 ]. The model considers the force to be a function off frequency (cycles/s)displacement and velocity. Although this model is moreF output forceapplicable to a single frequency excitation, it serves as aFRF frequency response functionuseful tool for identifying the non-linearities in theK stiVness parametersystem.K* magnitude of complex stiVness (also called
A comprehensive physical model was developed bydynamic stiVness)Lang [5 ] and later condensed and validated byv velocityMorman [6 ]. Lang’s model has more than 80x displacementparameters, is computationally complex and is not
¼ phase angle between input displacement and suitable for comprehensive vehicle simulation studies.output force (rad) Morman’s model has been shown to be useful for
ö frequency (rad/s) studying the eVects of design changes for a particularshock absorber. Reybrouck [7 ] has developed a physi-cal model, which has 14 parameters, valid for frequen-
1 INTRODUCTION cies of up to 20 Hz, and hence has limited appeal forthe analysis of shock absorbers for high-frequencyNVH applications. The current industry standardThe shock absorber is one of the most important
elements in a vehicle suspension system. It is also one of method of characterizing the dynamic properties ofshock absorbers for computer simulation models
The MS was received on 24 July 2001 and was accepted after revision involves testing at discrete frequencies, displacementsfor publication on 16 January 2002.
and preloads using a hydraulic test machine. The* Corresponding author: Michigan Technological University, 1400Townsend Drive, Houghton, MI 49931, USA. stiVness, K, and damping coeYcient, C, are extracted
D07901 © IMechE 2002 Proc Instn Mech Engrs Vol 216 Part D: J Automobile Engineering

374 D KOWALSKI, M D RAO, J BLOUGH AND S GRUENBERG
by � tting a linear model of the form F (ö)= pure sine excitations. Therefore, component RPCIII(cRPC ) software was used to excite the test specimenKx(ö)+Cv(ö) to the measured input displacement, x,
velocity v, and output force, F. The excitation tech- with user-de� ned excitation. The cRPC has the abilityto generate pure sine waves, multiple sine waves, shapednique is a pure sine excitation at the desired frequency
and amplitude. These harmonic excitations are then random excitations or any arbitrary time domainexcitation.swept through all desired frequencies and amplitudes.
The goal of this study was to determine if the currentexcitation and analysis techniques are applicable when
2.1 Analysismore than one frequency is present in the input exci-tation. The � rst task included standardizing the test pro-
TestWare-SX creates a frequency response functioncedure. This is done because shock absorber parameters
(FRF) between the output force and the input displace-vary with temperature and nominal length. Sine-on-sine
ment. The magnitude of the FRF is the dynamictesting and diVerent types of broadband random exci-
stiVness, K*, and the phase of the FRF is related to thetations have been utilized. Results are compared with
damping coeYcient, C. The stiVness parameter, K, is thestepped sine sweep tests. Additionally, actual road data
real part of the FRF, K=K* cos(¼), and the dampinghave been used as input excitation to obtain the shock
coeYcient is the imaginary part of the FRF divided byabsorber parameters under realistic amplitude and fre-
the frequency ö, C=(K*/ö) sin(¼). This analysis pro-quency conditions. Details of these are presented in the
cedure can be extended to all frequencies by realizingfollowing sections.
that K* and ¼ are simply the magnitude and phase ofthe FRF between the output force and input displace-ment. The stiVness term in a typical pressurized shock2 TEST PROCEDUREabsorber refers to the stiVness of the gas/air in the tubeas well as the stiVness of the seals and gaskets.
All of the testing for this project was done using theMTS 831 elastomer characterization machine locatedat the Keweenaw Research Center of Michigan 2.2 Pure sine sweep testsTechnological University. A picture of a shock absorber
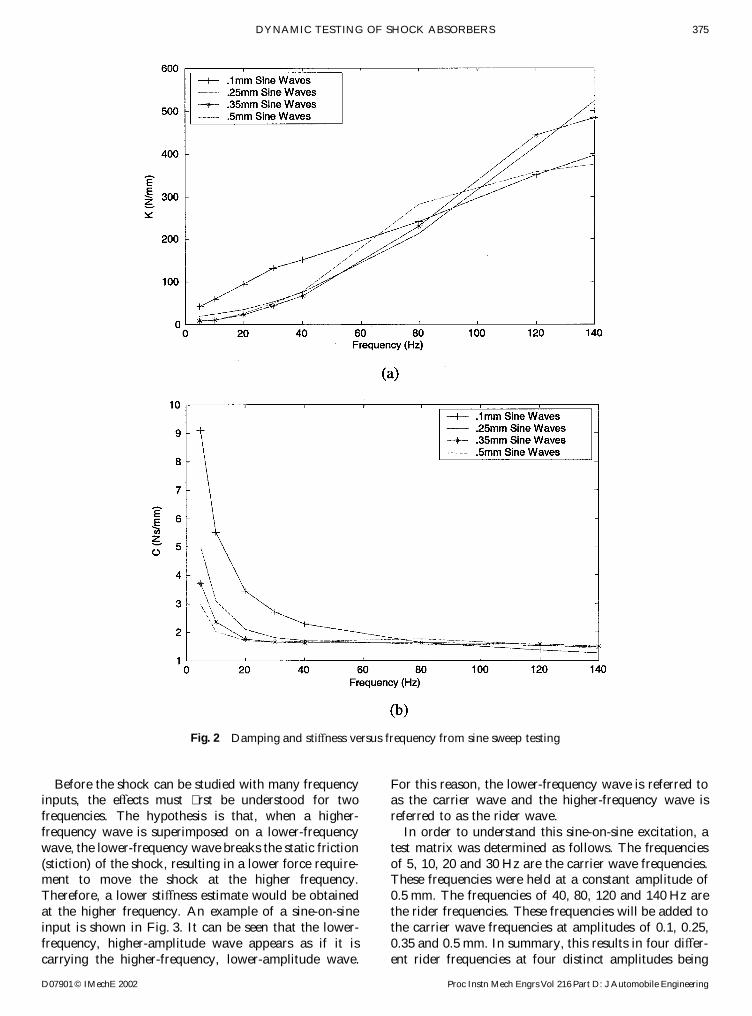
In order to understand the eVects of multiple sine wavesin the test � xture is shown in Fig. 1. The hardware usedon K and C, a baseline for the shock absorber parametersto control the MTS 831 was TestStar II. In conjunctionwas � rst established. The baseline consisted of testingwith TestStar II, TestWare-SX software was used towith pure sine waves with zero-to-peak amplitudes oforganize a test matrix and also to monitor and record0.1, 0.25, 0.35 and 0.5 mm. The frequencies chosen forthe desired parameters throughout the test.the pure sine waves were 5, 10, 20, 30, 40, 80, 120 andTestWare-SX, however, is only capable of producing140 Hz. The maximum frequency of the anti-alias � lteron the cRPC boards was 160 Hz; therefore, the upperfrequency limit was below this to eliminate possible alias-ing eVects. The force transducer established the lowerfrequency limit on the MTS 831, which was determinedto be approximately 4 Hz. The results of the baselinetesting are shown in Fig. 2. It can be seen clearly thatstiVness increases as a function of frequency. However,no clear trend is evident for stiVness as a function ofdisplacement amplitude. It is also seen that the dampingestimates decrease signi� cantly as a function of fre-quency and amplitude for frequencies below 80 Hz.Above 80 Hz, the damping does not appear to changewith an increase in frequency.
3 SINE-ON-SINE EXCITATION
Having established the baseline, this study was focusedon how the stiVness and damping parameters changewhen two frequencies are present simultaneously.The motivation for this inquiry is that, in practice,shock absorbers experience multiple frequencies
Fig. 1 MTS 831 machine with shock absorber installed simultaneously.
D07901 © IMechE 2002Proc Instn Mech Engrs Vol 216 Part D: J Automobile Engineering
375DYNAMIC TESTING OF SHOCK ABSORBERS
Fig. 2 Damping and stiVness versus frequency from sine sweep testing
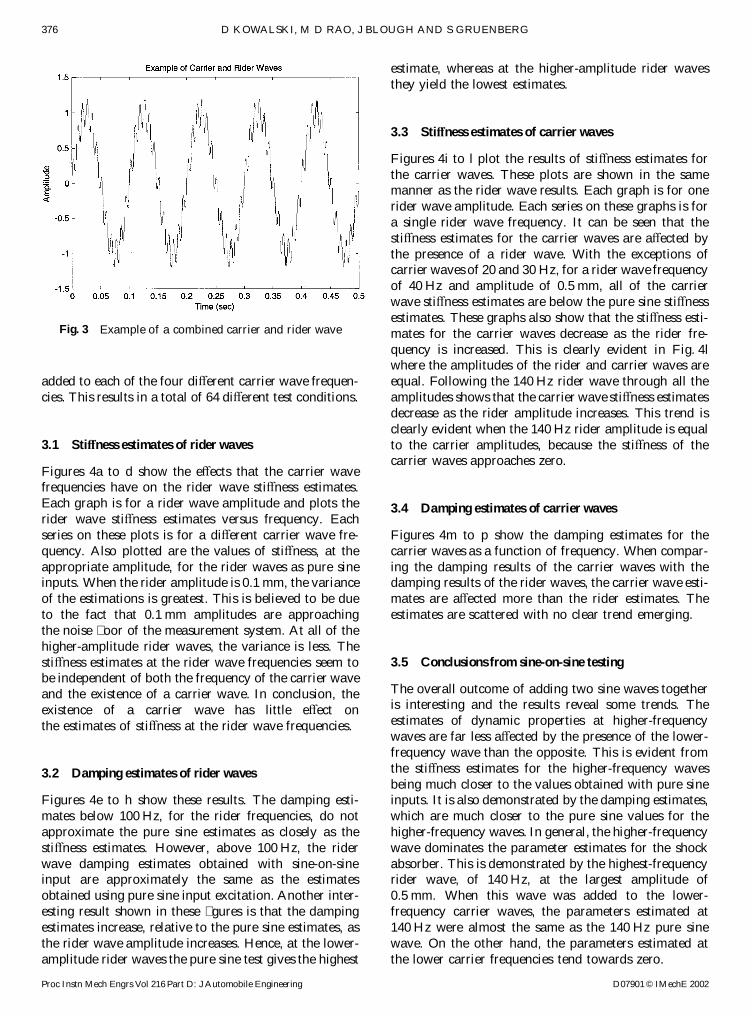
Before the shock can be studied with many frequency For this reason, the lower-frequency wave is referred toas the carrier wave and the higher-frequency wave isinputs, the eVects must � rst be understood for two
frequencies. The hypothesis is that, when a higher- referred to as the rider wave.In order to understand this sine-on-sine excitation, afrequency wave is superimposed on a lower-frequency
wave, the lower-frequency wave breaks the static friction test matrix was determined as follows. The frequenciesof 5, 10, 20 and 30 Hz are the carrier wave frequencies.(stiction) of the shock, resulting in a lower force require-
ment to move the shock at the higher frequency. These frequencies were held at a constant amplitude of0.5 mm. The frequencies of 40, 80, 120 and 140 Hz areTherefore, a lower stiVness estimate would be obtained
at the higher frequency. An example of a sine-on-sine the rider frequencies. These frequencies will be added tothe carrier wave frequencies at amplitudes of 0.1, 0.25,input is shown in Fig. 3. It can be seen that the lower-
frequency, higher-amplitude wave appears as if it is 0.35 and 0.5 mm. In summary, this results in four diVer-ent rider frequencies at four distinct amplitudes beingcarrying the higher-frequency, lower-amplitude wave.
D07901 © IMechE 2002 Proc Instn Mech Engrs Vol 216 Part D: J Automobile Engineering
376 D KOWALSKI, M D RAO, J BLOUGH AND S GRUENBERG
estimate, whereas at the higher-amplitude rider wavesthey yield the lowest estimates.
3.3 StiVness estimates of carrier waves
Figures 4i to l plot the results of stiVness estimates forthe carrier waves. These plots are shown in the samemanner as the rider wave results. Each graph is for onerider wave amplitude. Each series on these graphs is fora single rider wave frequency. It can be seen that thestiVness estimates for the carrier waves are aVected bythe presence of a rider wave. With the exceptions ofcarrier waves of 20 and 30 Hz, for a rider wave frequencyof 40 Hz and amplitude of 0.5 mm, all of the carrierwave stiVness estimates are below the pure sine stiVnessestimates. These graphs also show that the stiVness esti-
Fig. 3 Example of a combined carrier and rider wave mates for the carrier waves decrease as the rider fre-quency is increased. This is clearly evident in Fig. 4lwhere the amplitudes of the rider and carrier waves areequal. Following the 140 Hz rider wave through all theadded to each of the four diVerent carrier wave frequen-
cies. This results in a total of 64 diVerent test conditions. amplitudes shows that the carrier wave stiVness estimatesdecrease as the rider amplitude increases. This trend isclearly evident when the 140 Hz rider amplitude is equalto the carrier amplitudes, because the stiVness of the3.1 StiVness estimates of rider wavescarrier waves approaches zero.
Figures 4a to d show the eVects that the carrier wavefrequencies have on the rider wave stiVness estimates.Each graph is for a rider wave amplitude and plots the 3.4 Damping estimates of carrier wavesrider wave stiVness estimates versus frequency. Eachseries on these plots is for a diVerent carrier wave fre- Figures 4m to p show the damping estimates for the
carrier waves as a function of frequency. When compar-quency. Also plotted are the values of stiVness, at theappropriate amplitude, for the rider waves as pure sine ing the damping results of the carrier waves with the
damping results of the rider waves, the carrier wave esti-inputs. When the rider amplitude is 0.1 mm, the varianceof the estimations is greatest. This is believed to be due mates are aVected more than the rider estimates. The
estimates are scattered with no clear trend emerging.to the fact that 0.1 mm amplitudes are approachingthe noise � oor of the measurement system. At all of thehigher-amplitude rider waves, the variance is less. ThestiVness estimates at the rider wave frequencies seem to 3.5 Conclusions from sine-on-sine testingbe independent of both the frequency of the carrier wave
The overall outcome of adding two sine waves togetherand the existence of a carrier wave. In conclusion, theis interesting and the results reveal some trends. Theexistence of a carrier wave has little eVect onestimates of dynamic properties at higher-frequencythe estimates of stiVness at the rider wave frequencies.waves are far less aVected by the presence of the lower-frequency wave than the opposite. This is evident fromthe stiVness estimates for the higher-frequency waves3.2 Damping estimates of rider wavesbeing much closer to the values obtained with pure sineinputs. It is also demonstrated by the damping estimates,Figures 4e to h show these results. The damping esti-
mates below 100 Hz, for the rider frequencies, do not which are much closer to the pure sine values for thehigher-frequency waves. In general, the higher-frequencyapproximate the pure sine estimates as closely as the
stiVness estimates. However, above 100 Hz, the rider wave dominates the parameter estimates for the shockabsorber. This is demonstrated by the highest-frequencywave damping estimates obtained with sine-on-sine
input are approximately the same as the estimates rider wave, of 140 Hz, at the largest amplitude of0.5 mm. When this wave was added to the lower-obtained using pure sine input excitation. Another inter-
esting result shown in these � gures is that the damping frequency carrier waves, the parameters estimated at140 Hz were almost the same as the 140 Hz pure sineestimates increase, relative to the pure sine estimates, as
the rider wave amplitude increases. Hence, at the lower- wave. On the other hand, the parameters estimated atthe lower carrier frequencies tend towards zero.amplitude rider waves the pure sine test gives the highest
D07901 © IMechE 2002Proc Instn Mech Engrs Vol 216 Part D: J Automobile Engineering

377DYNAMIC TESTING OF SHOCK ABSORBERS
Fig. 4 (continued over.)
D07901 © IMechE 2002 Proc Instn Mech Engrs Vol 216 Part D: J Automobile Engineering

378 D KOWALSKI, M D RAO, J BLOUGH AND S GRUENBERG
Fig. 4 EVects of carrier wave frequency on (a to d) rider wave stiVness and (e to h) rider wave damping,and eVects of amplitude of rider wave on (i to l ) carrier wave stiVness and (m to p) carrier wavedamping
D07901 © IMechE 2002Proc Instn Mech Engrs Vol 216 Part D: J Automobile Engineering

379DYNAMIC TESTING OF SHOCK ABSORBERS
4 MULTIPLE-FREQUENCY INPUT EXCITATION tations are about the same throughout the entirefrequency range. This observation holds true for thestiVness estimates as well. Just as with the damping esti-Having examined the sine-on-sine input excitation, themates, the stiVness variations from 1/ f 2 weighting arenext step was to determine the eVects when all the fre-higher than the other two, while the 1/ f 0 and 1/ f 1quencies of interest are present in the input excitation.weighted results are very close to one another. TheIt was decided to use random signals with the same over-results of stiVness for 1/ f 0 seem to mirror the pure sineall amplitudes as the previous sine waves. For this study,values above 70 Hz and below 20 Hz. Between 20 andthe peak-to-peak values of the random excitation was70 Hz, the estimates are higher than the pure sine esti-1 mm. This value was chosen because results of this canmates. One noticeable result shown in the stiVnessbe compared with previous tests with pure sines having
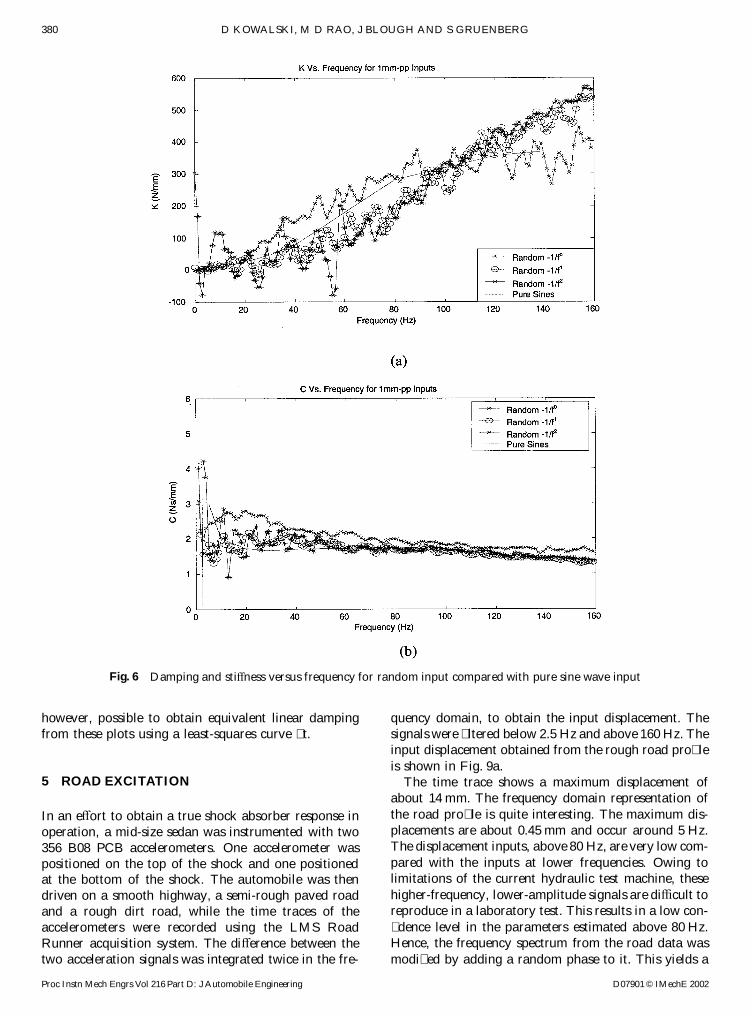
the same peak-to-peak values. Also, it yielded the best graphs is that the estimates resulting from 1/ f 0 and 1/ f 1,signal-to-noise ratio among the available sine input below 60 Hz, fall below zero which needs someamplitudes. Random input signals were generated in explanation.three diVerent ways for this study. The � rst random It was found that the phase below 60 Hz rises abovesignal generated has a constant amplitude for all fre- 90°. This results in the stiVness estimates in these areasquencies. The second type of random signal generated being negative. In other words, K=K* cos(¼), and theweights the amplitudes at 1/ f 1. The � nal type of random cosine function changes sign at 90°. It was hypothesizedsignal weights the amplitudes at 1/ f 2. It is important to that the phase jumps were caused by the shock absorberremember that the peak-to-peak values of all three of being overdriven by the amount of energy input at thethese random signals is kept at 1 mm. This does mean, higher frequencies. This was speculated because thehowever, that the amplitude at a given frequency amplitude for random 1/ f 0 weighting is the same at allchanges from drive � le to drive � le. The power spectral frequencies. It is known that this is not the case whendensities of the input displacement and the output force the shock absorber is in operation. In order to test thisof these three signals can be seen in Fig. 5. The analysis hypothesis, the random input excitation of 1/ f 0 was � l-to obtain stiVness and damping is done spectral line by tered to contain only frequencies below 60 Hz. Thespectral line. The results of stiVness and damping esti- shock absorber was then excited using this lower-mates are shown in Fig. 6. Examining the damping esti- frequency band limited random signal. As shown inmate � rst, it is noticed that above 60 Hz the damping Fig. 7, it was found that the phase angle between inputestimates resulting from the input signals of 1/ f 0 and displacement and output force of this abbreviated1/ f 1 fall very close to the pure sine estimates. The esti- random signal does not contain any jumps in phase likemates from 1/ f 2 in the same region are higher than the the earlier broader frequency excitation.pure sine estimates. Below 60 Hz, none of the random As shown in Fig. 7, the stiVness estimates becomesignals shows a good agreement with the pure sine more realistic for the abbreviated 1/ f 0 random signal asvalues. One other thing noted is the fact that the damp- expected. The stiVness estimates from this � ltered inputing estimates from 1/ f 0and 1/ f 1 weighted random exci- signal fall close to the pure sine estimates. However,
when examining the damping estimates in Fig. 7, thesame observation does not hold true. The damping esti-mates obtained from the random signal, below 60 Hz,do not have the same estimates as obtained from thepure sine waves. The estimates from the abbreviatedrandom signal have higher damping estimates than thepure sine estimates.
In summary, if the shock absorber is being driven bynarrow-band random excitation, the estimations forboth stiVness and damping agree somewhat with puresine wave test data. However, there is no reason toassume that the pure sine excitation yields the best esti-mations because, in practice, shock absorbers experiencebroadband frequency inputs and their dynamic proper-ties are generally non-linear. The classic force–velocityplots for this shock absorber for single-sine, sine-on-sineand random input excitations are shown in Figs 8a to c.The slope of the force–velocity plot is related to classicalviscous damping. Although the shock absorber behav-iour appears to be linear for a single-sine excitation, itFig. 5 Power spectral densities of input displacement and
output force for random input signals is non-linear for the other two cases presented. It is,
D07901 © IMechE 2002 Proc Instn Mech Engrs Vol 216 Part D: J Automobile Engineering
380 D KOWALSKI, M D RAO, J BLOUGH AND S GRUENBERG
Fig. 6 Damping and stiVness versus frequency for random input compared with pure sine wave input
however, possible to obtain equivalent linear damping quency domain, to obtain the input displacement. Thefrom these plots using a least-squares curve � t. signals were � ltered below 2.5 Hz and above 160 Hz. The
input displacement obtained from the rough road pro� leis shown in Fig. 9a.
5 ROAD EXCITATION The time trace shows a maximum displacement ofabout 14 mm. The frequency domain representation ofthe road pro� le is quite interesting. The maximum dis-In an eVort to obtain a true shock absorber response inplacements are about 0.45 mm and occur around 5 Hz.operation, a mid-size sedan was instrumented with twoThe displacement inputs, above 80 Hz, are very low com-356 B08 PCB accelerometers. One accelerometer waspared with the inputs at lower frequencies. Owing topositioned on the top of the shock and one positionedlimitations of the current hydraulic test machine, theseat the bottom of the shock. The automobile was thenhigher-frequency, lower-amplitude signals are diYcult todriven on a smooth highway, a semi-rough paved roadreproduce in a laboratory test. This results in a low con-and a rough dirt road, while the time traces of the� dence level in the parameters estimated above 80 Hz.accelerometers were recorded using the LMS RoadHence, the frequency spectrum from the road data wasRunner acquisition system. The diVerence between the
two acceleration signals was integrated twice in the fre- modi� ed by adding a random phase to it. This yields a
D07901 © IMechE 2002Proc Instn Mech Engrs Vol 216 Part D: J Automobile Engineering

381DYNAMIC TESTING OF SHOCK ABSORBERS
Fig. 7 Comparison of damping and stiVness estimates for pure sine and random input
‘shaped’ random signal with the same frequency spec- road stiVness estimations are well below the pure sineestimations from other road pro� les. This is believed totrum as the original road data. This is illustrated in
Fig. 9b, where it is seen that the frequency spectrum is be a result of poor reproduction of the small displace-ments seen on the smooth road in the laboratory.the same as for both the actual road response and the
randomized road response. The time signal, however, is Therefore, this series should be disregarded since thedata are approaching the noise � oor of the measurementa random signal with the same spectral content as the
measured road data. system. The two other road pro� les are very close to oneanother and are believed to be meaningful. The dampingFigure 10 shows the estimated parameter results from
the shaped road frequency random excitation after curve estimates using the shaped road spectrum fall almost ontop of the estimated damping from pure sine excitation.� tting the results. It is seen that the stiVness and damping
estimate are close to those of pure sine waves. In the The stiVness and damping curves are much more realisticfor an automotive shock absorber using this method ascase of stiVness, the estimates are slightly lower than
those obtained with pure sine excitation. The smooth opposed to the pure road response excitation.
D07901 © IMechE 2002 Proc Instn Mech Engrs Vol 216 Part D: J Automobile Engineering

382 D KOWALSKI, M D RAO, J BLOUGH AND S GRUENBERG
Fig. 8 Force versus velocity plots of the shock absorber for diVerent inputs
6 CONCLUSIONS It has been shown that all the estimated parameterscan be found at once when using a shaped randomsignal. The best type of shaped random is one that hasThe results of this study have proven a number of things.the same frequency spectrum to that experienced by theFirstly, it is shown that, when two sine waves are addedshock absorber in practice. When using this type oftogether and used to actuate a shock absorber, the par-shaped random signal, the parameters estimated areameters estimated at each frequency are dependent onclose to the pure sine parameter estimations. The use ofone another. The dependence is a function of the fre-this type of realistic excitation has two advantages:quency separation and relative amplitudes of the two
waves. In the case where one frequency is higher than 1. The actual test takes far less time than the steppedthe other, the higher frequency maintains its parameters sine sweep.whereas the lower-frequency parameter estimations are 2. Owing to the short test time, the eVects of tempera-very low. However, when random excitation in a narrow ture on the estimated stiVness and damping are mini-band was used, the parameters estimated were close to mized since the temperature of the shock absorber
does not change signi� cantly during the test.the estimations using pure sine waves.
D07901 © IMechE 2002Proc Instn Mech Engrs Vol 216 Part D: J Automobile Engineering

383DYNAMIC TESTING OF SHOCK ABSORBERS
Fig. 9 Actual road response and randomized road response in time and frequency axes
Finally, it will be useful to study the in� uence of ACKNOWLEDGEMENTSdiVerent input excitation using a ‘physical’ model of ashock absorber. This would allow a designer to con- This work was made possible through a University
Research Program grant from Ford Motor Company.duct parametric studies to evaluate the eVects ofdesign parameters on the dynamic performance of the The authors would like to thank Dr David GriYths of
Ford Motor Company for his sponsorship and support.shock absorber.
D07901 © IMechE 2002 Proc Instn Mech Engrs Vol 216 Part D: J Automobile Engineering

384 D KOWALSKI, M D RAO, J BLOUGH AND S GRUENBERG
Fig. 10 Damping and stiVness versus frequency from shaped random input
4 Duym, S., Schoukens, J. and Guillaume, P. A local restoringREFERENCESforce surface method. In Proceedings of 13th InternationalModal Analysis Conference, Nashville, Tennessee, 1995,1 Rao, M. D., Gruenberg, S. and Torab, H. Measurement ofpp. 1392–1399.
dynamic properties of automotive shock absorbers for 5 Lang, H. H. A study of the characteristics of automotiveNVH. In Proceedings of SAE 1999 Noise and Vibrations dampers at high stroke frequencies. PhD thesis, UniversityConference, Traverse City, 1999, pp. 1433–1438. of Michigan, 1977.
2 CaVerty, S., Worden, K. and Tomlinson, G. Characterization 6 Morman, K. A model for the analysis and simulation ofof automotive shock absorbers using random excitation. hydraulic shock absorber performance. Part I: theoreticalProc. Instn Mech. Engrs, Part D, Journal of Automobile development (SR-83-043); Part II: parameter identi� cationEngineering, 1995, 209. and model validation studies (SR-86-61), Ford Motor
3 Belingardi, G. and Campanile, P. Improvement of the shock Company Research StaV Reports.absorber dynamic simulation by the restoring force surface 7 Reybrouck, K. A non-linear parametric model of anmapping method. In Proceedings of 15th International automotive shock absorber. SAE paper 940869, VehicleSeminar on Modal Analysis and Structural Dynamics, Suspension and System Advancements, SP-1031, 1994,
pp. 79–86.Leuven, Belgium, 1990, pp. 441–454.
D07901 © IMechE 2002Proc Instn Mech Engrs Vol 216 Part D: J Automobile Engineering