dynamic white lighting systems: from warm dimming (d2w) …
TRANSCRIPT

www.rti.orgRTI International is a registered trademark and a trade name of Research Triangle Institute.
Dynamic White Lighting Systems:
From Warm Dimming (D2W) to Tunable White
1
Lynn Davis
Warm Dimming/Dim to Warm
6500 K4000 K
2700 K
Tunable White

Value Proposition for Dynamic White Lighting (DWL)
▪ Provides greater flexibility to the lighting
system including the ability to change the
color and dimming levels to match the
needed conditions and ambiance.
▪ DWL can be achieved with excellent
luminous efficacy (> 100 LPW) and CRI.
▪ DWL can provide a variety of physiological
benefits including mood setting, circadian
alignment, etc.
▪ Initial cost are at a premium compared to
single CCT products, but price differential
has been steadily dropping.
2
vs.
Fixed CCT = 5450 K
6500 K 3500 K 2700 K

1,800 K2,000 K
2,500 K
3,000 K
3,500 K
4,000 K
5,000 K
6,000 K
7,000 K
8,000 K0.45
0.46
0.47
0.48
0.49
0.50
0.51
0.52
0.53
0.54
0.55
0.19 0.20 0.21 0.22 0.23 0.24 0.25 0.26 0.27 0.28 0.29 0.30 0.31 0.32 0.33
v'
u'
Warm Dimming or Dim to Warm (D2W) System
▪ Two LED primaries – “warmer” color white & “cooler” color white.
▪ System technology that can be incorporated in lamps and larger.
▪ Emulates the warming of incandescent lamp color when dimmed.
3

1,800 K2,000 K
2,500 K
3,000 K
3,500 K
4,000 K
5,000 K
6,000 K
7,000 K
8,000 K0.45
0.46
0.47
0.48
0.49
0.50
0.51
0.52
0.53
0.54
0.55
0.19 0.20 0.21 0.22 0.23 0.24 0.25 0.26 0.27 0.28 0.29 0.30 0.31 0.32 0.33
v'
u'
Warm Dimming or Dim to Warm (D2W) Lamps & Luminaires▪ Usually only one LED primary is operating at lowest dimming level.
▪ Total CCT change is often up to ~ 1,200 K, but can be larger.
▪ In D2W products, shifting of CCT is controlled by changing the dimming
level, so control is not totally independent for the LED primaries.
4

1,800 K2,000 K
2,500 K
3,000 K
3,500 K
4,000 K
5,000 K
6,000 K
7,000 K
8,000 K0.45
0.46
0.47
0.48
0.49
0.50
0.51
0.52
0.53
0.54
0.55
0.19 0.20 0.21 0.22 0.23 0.24 0.25 0.26 0.27 0.28 0.29 0.30 0.31 0.32 0.33
v'
u'
Warm Dimming or Dim to Warm (D2W) Lamps & Luminaires▪ Usually only one LED primary is operating at lowest dimming level.
▪ Total CCT change is often up to ~ 1,200 K, but can be larger.
▪ In D2W products, shifting of CCT is controlled by changing the dimming
level, so control is not totally independent for the LED primaries.
5
CCT tuning is not necessary linear
with a change in dimming level

1,800 K2,000 K
2,500 K
3,000 K
3,500 K
4,000 K
5,000 K
6,000 K
7,000 K
8,000 K0.45
0.46
0.47
0.48
0.49
0.50
0.51
0.52
0.53
0.54
0.55
0.19 0.20 0.21 0.22 0.23 0.24 0.25 0.26 0.27 0.28 0.29 0.30 0.31 0.32 0.33
v'
u'
Tunable White Systems
▪ Two white LED primaries set the tuning range – 2,700 K to 6,500 is common.
▪ Separate control channels for each LED primary adds complexity but improves
efficiency and tuning linearity.
▪ LED drive waveform can change significantly as CCT and dimming level
changes.
6
Section of tunable
white LED module

Electronic Driver Comparison
7
Dim-to-Warm Tunable White
• Simple driver circuitry that can be
implemented in the base of a lamp.
• Single control signal set by dimming level
determines current through the LEDs.
• % Flicker can change significantly, but
flicker frequency changes little (~120 Hz).
• Complex circuit that is implemented in a
luminaire. Some examples in lamps.
• Separate control signals from the second
control IC determines the current to each
LED primary.
• All flicker characteristics will change
significantly depending on CCT and
dimming settings. Maintains compliance
with IEEE 1789.
Researching the Reliability of Dynamic White Lighting
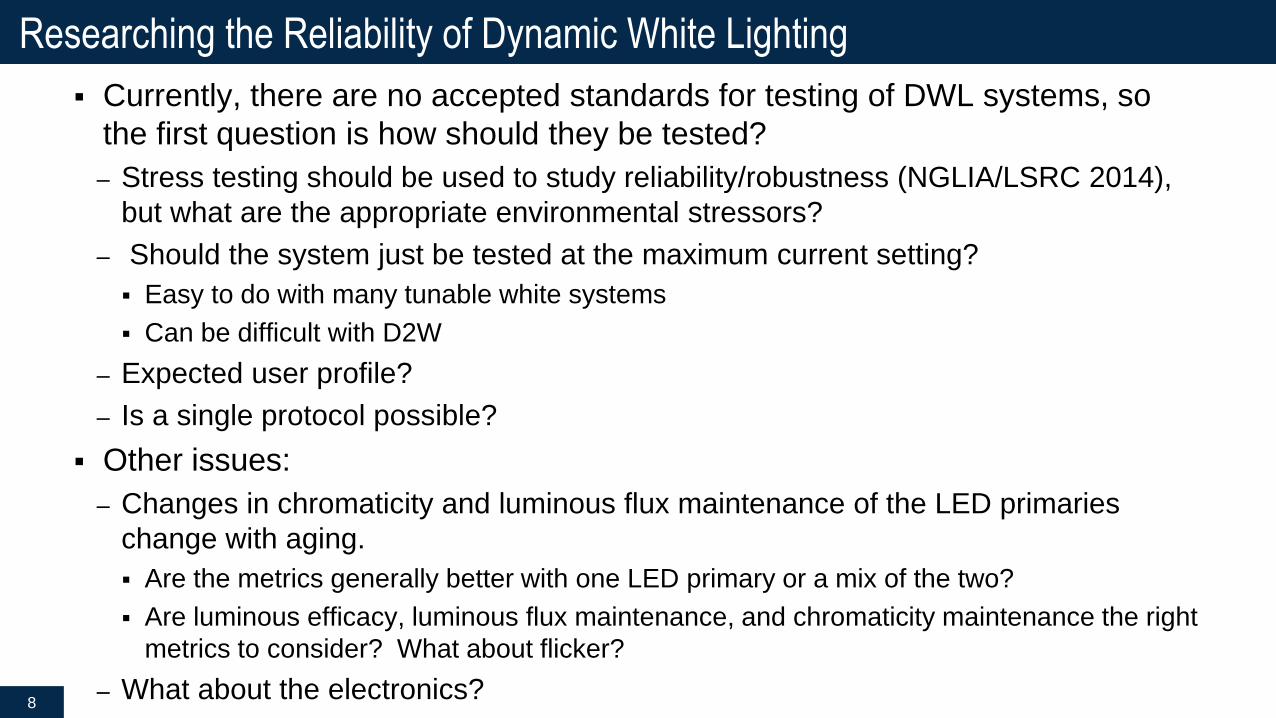
▪ Currently, there are no accepted standards for testing of DWL systems, so
the first question is how should they be tested?
– Stress testing should be used to study reliability/robustness (NGLIA/LSRC 2014),
but what are the appropriate environmental stressors?
– Should the system just be tested at the maximum current setting?
▪ Easy to do with many tunable white systems
▪ Can be difficult with D2W
– Expected user profile?
– Is a single protocol possible?
▪ Other issues:
– Changes in chromaticity and luminous flux maintenance of the LED primaries
change with aging.
▪ Are the metrics generally better with one LED primary or a mix of the two?
▪ Are luminous efficacy, luminous flux maintenance, and chromaticity maintenance the right
metrics to consider? What about flicker?
– What about the electronics?8

Chromaticity Shifts Modes (CSMs) in LEDs
CIE 1976 Color Space
• CSMs provide insights into the
mechanism responsible for
chromaticity shift.
• CSMs are package dependent.
• LED package materials can play a
significant role in CSM behavior.
Shifts are illustrative and not shown to scale
CSM Terminal Shift Direction
CSM-1 Blue
CSM-2 Green
CSM-3 Yellow
CSM-4 Yellow then Blue
CSM-5 Red
Refences: CALiPER 20.5 and LSRC paper on
LED Luminaire Reliability: Impact of Color Shift.
0.00
0.10
0.20
0.30
0.40
0.50
0.60
0.70
0.00 0.10 0.20 0.30 0.40 0.50 0.60 0.70
v'
u'
Blue Emitter
Yellow Emitter
Red Shift
Yellow Shift

Test Methods – LED Modules
▪ Driver and tunable LED modules
separately.
▪ For tunable LED modules
– Different LED modules tested at one of 4
currents (low, mid-1, mid-2, high) and 2
different ambient temp. (75°C and 95°C).
▪ Both primaries energized at same current setting.
– Test conducted for 20,000 hours.
– Power cycling test at one-hour on and one-
hour off.
▪ Evaluation
– Calibrated integrated sphere @ 25°C.
– Evaluation of solder joints through component
shear and acoustical microscopy.10

Test Methods & Evaluation – LED Drivers
▪ Methods
– LED drivers tested at 100% power output in a
temperature & humidity (7575) ambient soak.
▪ LED modules used as loads in driver testing and
CCT was set to 3500 K.
▪ Provides roughly equal high frequency output dc
signals to LED primaries.
– Power cycling testing.
▪ Evaluation
– Driver electrical properties (voltage, current,
Power Factor, waveform, THD) evaluated at
five dimming levels between 100% and 1%.
– Flicker properties of LED loads at five different
dimming levels between 100% and 1%.
– All evaluations conducted at 25°C ambient.
11
0
2000
4000
6000
8000
10000
12000
14000
16000
18000
0.0 1.0 2.0 3.0 4.0 5.0
Illu
min
ance
(lu
x)
Time (mS)
50% Dimming Setting
2700K 3500K 6500 K
Flicker %: 99%
Flicker Frequency: 1,465 Hz

Chromaticity Shift in Tunable White LED Modules
▪ Luminous flux maintenance remained
high (> 90%) for most test conditions
after 20,000 hours.
– DUTs fell within a range bounded by the
low and high stress conditions.
– Highest stress condition (95˚C, 1500 mA)
produced even faster decline in LM.
▪ Luminous flux maintenance was
correlated with test conditions with only
a minor dependence on CCT.
▪ Bivariate linear models can be built to
describe the effect.
– Temperature and current as the
parameters of the model.12
0.75
0.80
0.85
0.90
0.95
1.00
1.05
0 5000 10000 15000 20000
Lum
ino
us
Flu
x M
ain
ten
ance
Time (hours)
Low Stress
75˚C, 350 mA
High Stress
95˚C, 1,000 mA
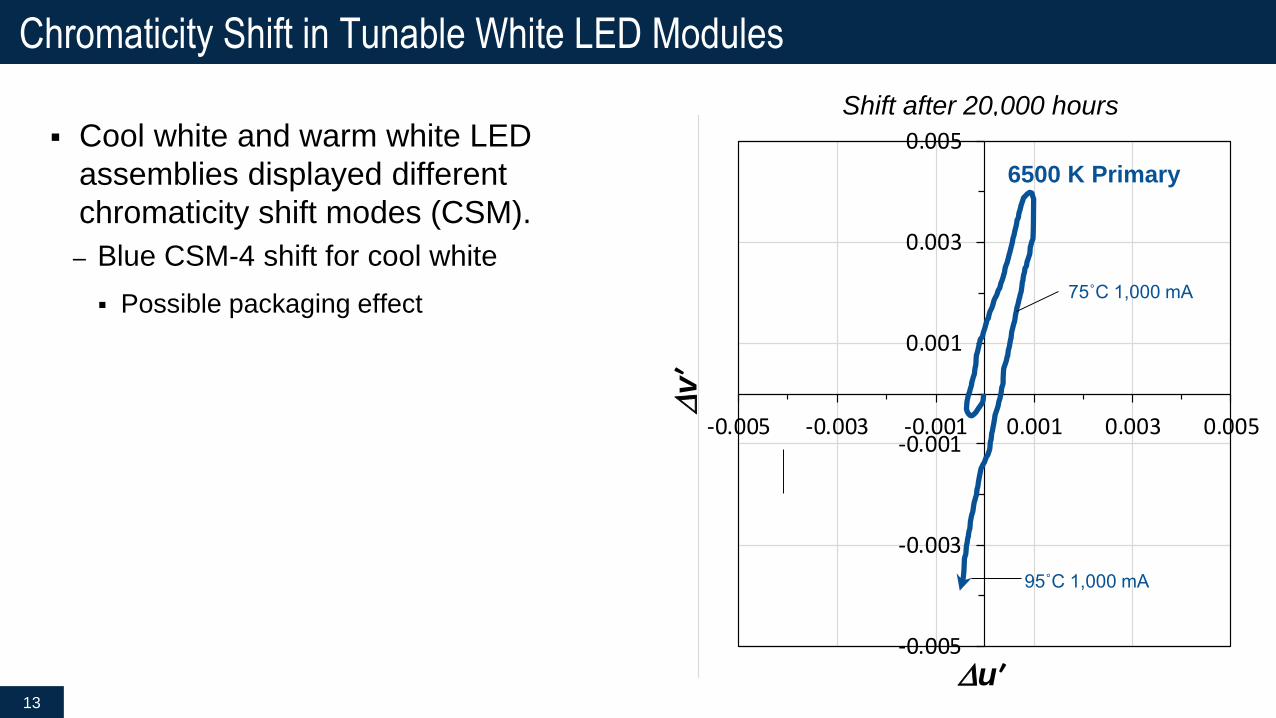
Chromaticity Shift in Tunable White LED Modules
▪ Cool white and warm white LED
assemblies displayed different
chromaticity shift modes (CSM).
– Blue CSM-4 shift for cool white
▪ Possible packaging effect
13
Shift after 20,000 hours
Dvʹ
-0.005
-0.003
-0.001
0.001
0.003
0.005
-0.005 -0.003 -0.001 0.001 0.003 0.005
95˚C 1,000 mA
75˚C 1,000 mA
6500 K Primary
Duʹ

Chromaticity Shift in Tunable White LED Modules
▪ Cool white and warm white LED
assemblies displayed different
chromaticity shift modes (CSM).
– Blue CSM-4 shift for cool white
▪ Possible packaging effect
– Green CSM-2 shift for warm white
▪ Tied to the red phosphor
▪ Each LED primary follows as similar
chromaticity shift trajectory, but …
▪ Progression of DUTs along these
trajectories depends on time, temperature,
and current.
14
Shift after 20,000 hours
Dvʹ
-0.005
-0.003
-0.001
0.001
0.003
0.005
-0.005 -0.003 -0.001 0.001 0.003 0.005
95˚C 1,000 mA
95˚C 1,000 mA
75˚C 1,000 mA
75˚C 1,000 mA
6500 K Primary
2750 K Primary
Duʹ

TWL Source - Physical Inspection After 19,000 hours
▪ Indication of resin cracking and silicone deformation on cool-white LEDs
points to a possible packaging effect.
▪ Warm-white LEDs appear to be less affected by conditions – possibly due to
greater phosphor conversion?
▪ Effect may impact chromaticity and/or lumen maintenance.
hairline
cracks
95˚C & 1000 mAControl

D2W Systems
16

Initial Benchmarks for D2W Systems –Example 1
17
25% 50% 100%
Lumens 95.2 lm 503.6 lm 784.3 lm
Power 1.7 W 5.4 W 8.0 W
Luminous Efficacy 53.9 lm/W 94.1 lm/W 98.2 lm/W
Flicker 4.76% 4.25% 1.13%
uʹ 0.2948 0.2709 0.2623
vʹ 0.5365 0.5286 0.5261
CCT 2132 K 2528 K 2707 K
Centroid l 606 nm 590 nm 586 nm
25% 50% 100%
Flicker 1.13% 4.24% 4.76%
Flicker Index 0.003 0.011 0.012
Flicker Frequency 120.0 Hz 119.9 Hz 119.8 Hz
Power 1.7 W 5.4 W 8.0 W
Power Factor 0.45 0.70 0.78
Plateau Temp 27.2°C 40.1°C 47.4°C
Time to 95% Tmax 32 min. 28 min. 28min.

Test Methods for D2W Systems▪ Methods
– Most D2W systems are small enough to be
testing in their entirety.
– Testing must be done at different dimming.
– Our test are done at 4 levels: off, low, medium,
and high.
– A variety of ambient environments were used in
the testing.
▪ Room temperature and 45°C
▪ Temperature-humidity @ 6590
– Heating and cooling profile determined switching
times and varied between different products.
▪ Evaluation
– Photometry @ 2 different dimming levels
– Flicker testing
– Electrical testing18

D2W Findings to Date (≤ 2,000 hours)
▪ Overall Trends
– Luminous flux intensity
generally remains high.
Usually > 95%.
– Chromaticity generally shifts
in the green direction (CSM-
2). Magnitude of the shift
depends on product and test
environment. Ranges from <
2 SDCM to ~ 6 SDCM.
▪ Flicker measurements
suggests greater electrical
changes than tunable white
drivers.
19
-0.006
-0.004
-0.002
0
0.002
0.004
0.006
-0.006 -0.004 -0.002 0 0.002 0.004 0.006
Δv'
Δu'25˚C 45˚C 65˚C, 90% RH
75
80
85
90
95
100
105
0 1000 2000 3000 4000
Lum
ino
us
Flu
x M
ain
ten
an
ce (
%)
Time (Hr)
25˚C 45˚C 65˚C, 90% RH

Summary
▪ Dynamic white lighting systems are composed of two white LED primaries at
different CCT values. These systems are gaining in popularity as a way to
add flexibility to a space and provide attributes of human-light interactions.
▪ D2W systems mimic the behavior of incandescent lighting – device becomes
redder as dimming level is lowered.
▪ TWL systems provide greater control over the tuning range and device
energy efficiency.
▪ Dynamic white lighting systems can be challenging to test due to the myriad
of possible settings. There is a need for acceptable standard test methods for
dynamic white lighting systems.
– Testing burden also needs to be considered.
20

Acknowledgement and Disclaimer
▪ Work of my colleagues at RTI, especially Kelley Rountree, Karmann Mills,
Michelle McCombs, Jean Kim, and Roger Pope.
▪ This material is based upon work supported by the U.S. Department of
Energy, Office of Energy Efficiency and Renewable Energy (EERE), under
Award Number DE-FE0025912.
▪ This report was prepared as an account of work sponsored by an agency of the United States
Government. Neither the United States Government nor any agency thereof, nor any of their
employees, makes any warranty, express or implied, or assumes any legal liability or
responsibility for the accuracy, completeness, or usefulness of any information, apparatus,
product, or process disclosed, or represents that its use would not infringe privately owned
rights. Reference herein to any specific commercial product, process, or service by trade
name, trademark, manufacturer, or otherwise does not necessarily constitute or imply its
endorsement, recommendation, or favoring by the United States Government or any agency
thereof. The views and opinions of authors expressed herein do not necessarily state or
reflect those of the United States Government or any agency thereof.21