dynamics and vibrations ii uncertainties in aircraft … 445.6 the classic flutter testcase. nasa...
TRANSCRIPT
Uncertainties in AircraftFlutter Prediction
School of Mechanical and Aerospace EngineeringOklahoma State University
Dynamics and Vibrations II
Charles R. O'NeillAndrew S. Arena Jr.
Presented by
Oklahoma City, OK28 February 2004
Aeroelastic Prediction Comparisons
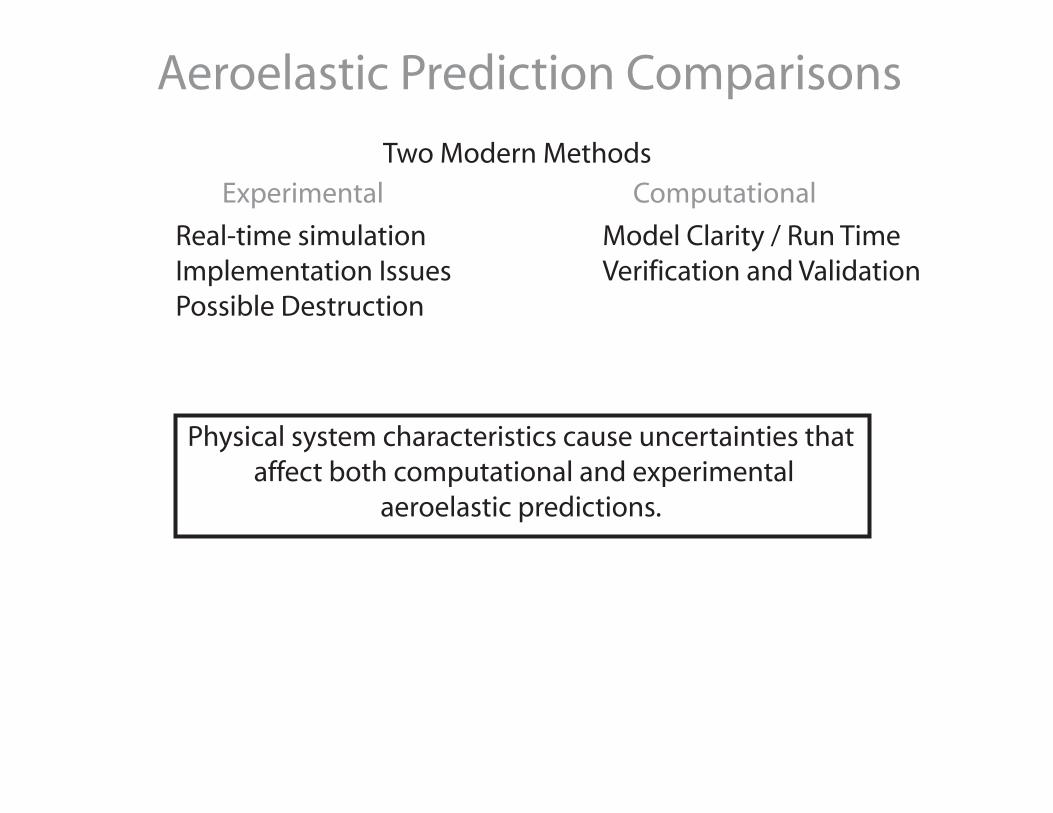
Experimental Computational
Two Modern Methods
Real-time simulationImplementation IssuesPossible Destruction
Model Clarity / Run TimeVerification and Validation
Physical system characteristics cause uncertainties that affect both computational and experimental
aeroelastic predictions.
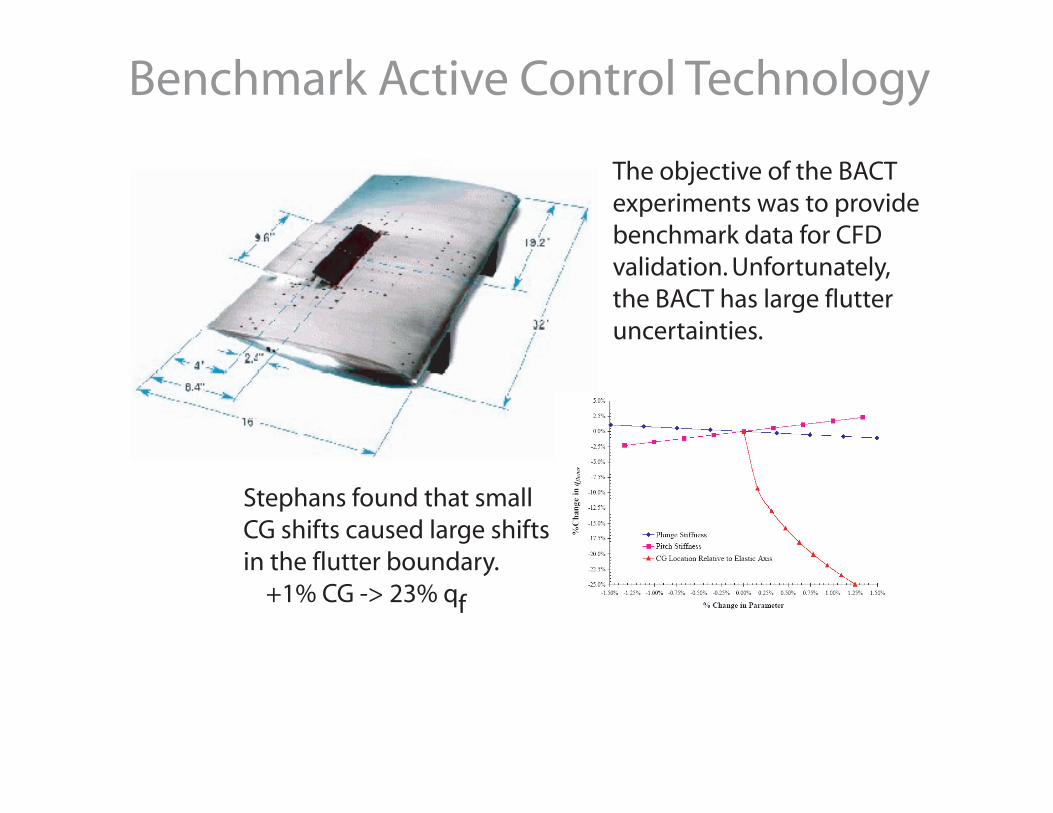
The objective of the BACTexperiments was to providebenchmark data for CFDvalidation. Unfortunately,the BACT has large flutter uncertainties.
Benchmark Active Control Technology
Stephans found that small CG shifts caused large shiftsin the flutter boundary. +1% CG -> 23% qf
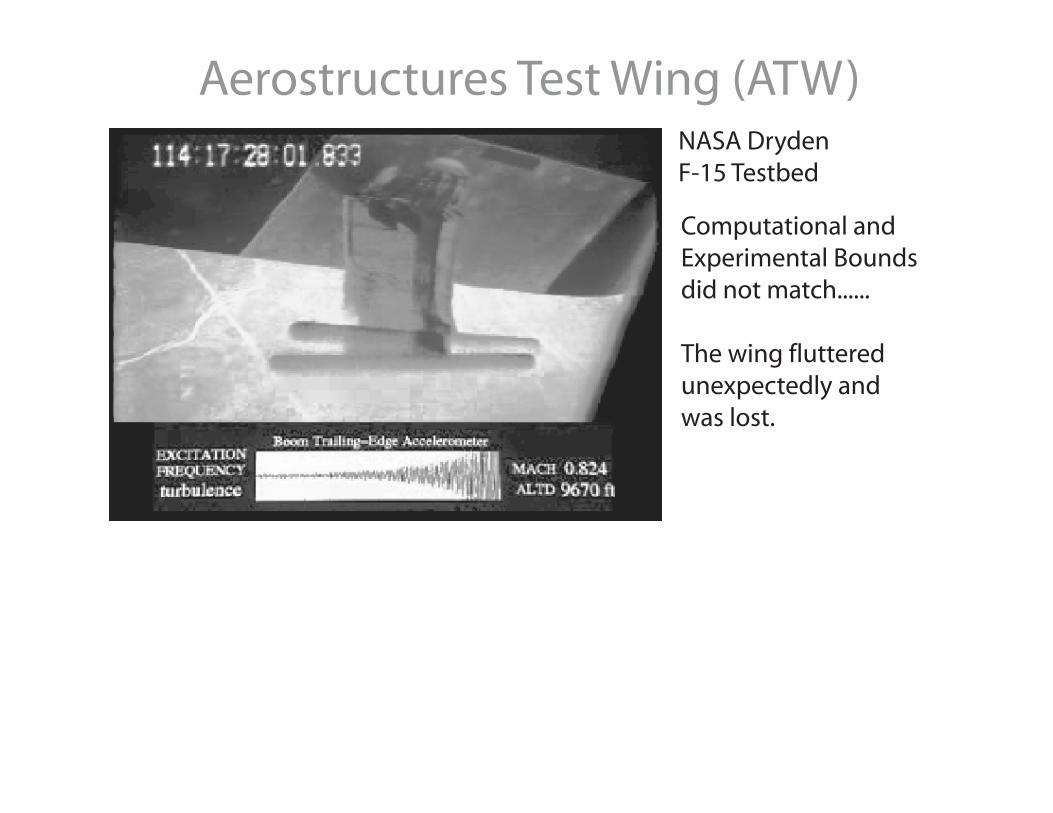
Aerostructures Test Wing (ATW)NASA Dryden F-15 Testbed
Computational and Experimental Boundsdid not match......
The wing flutteredunexpectedly andwas lost.
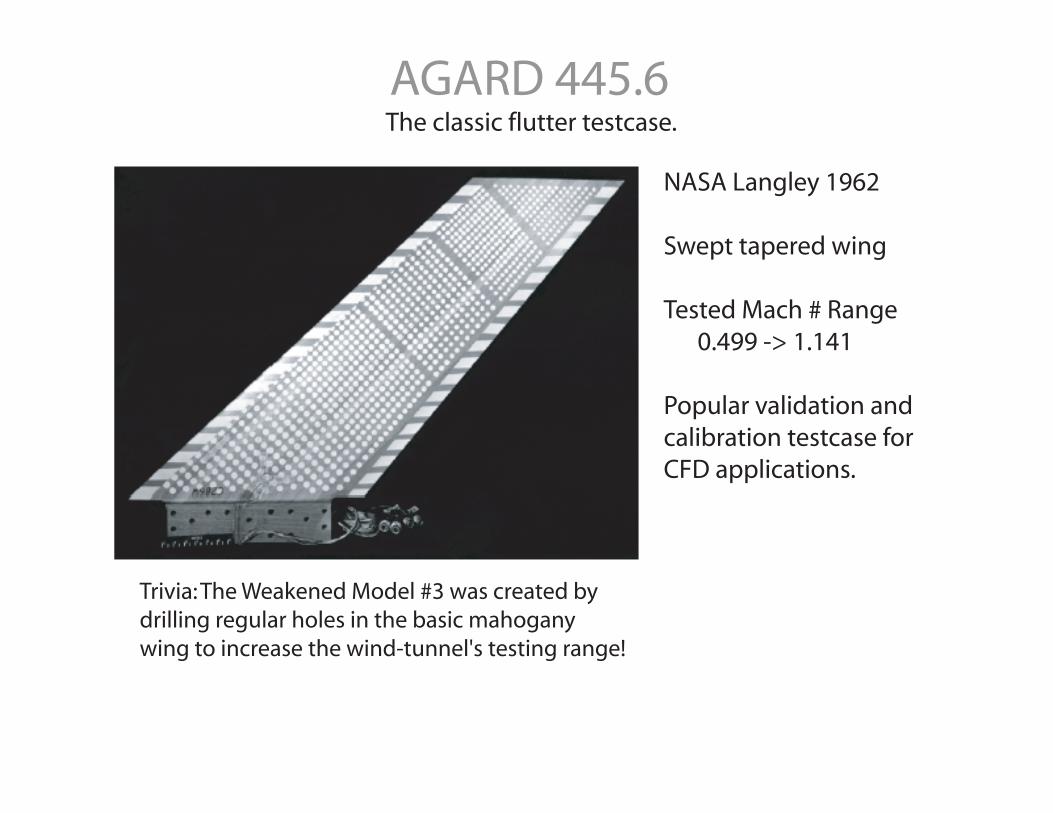
AGARD 445.6The classic flutter testcase.
NASA Langley 1962
Swept tapered wing
Tested Mach # Range 0.499 -> 1.141
Popular validation andcalibration testcase forCFD applications.
Trivia: The Weakened Model #3 was created bydrilling regular holes in the basic mahoganywing to increase the wind-tunnel's testing range!

Computational Model: AGARD 445.6 Aeroelastic Wing
Two Mode Structural Model
First Bending Mode9.6 Hertz
First Torsional Mode38.2 Hertz
Root
Tip
V
The AGARD 445.6 testcase presentsan aeroelastic system typical of highperformance aircraft.

Structural Uncertainties
Damping Ratio
Stiffness
4%2%0%
+10%Nominal
-10%
0.4 0.6 0.8 1 1.2
0.5
1
1.5
2
0.4 0.6 0.8 1 1.2
0.5
1
1.5
2
Mach Number
Dyn
am
ic P
ress
ure
[p
si]
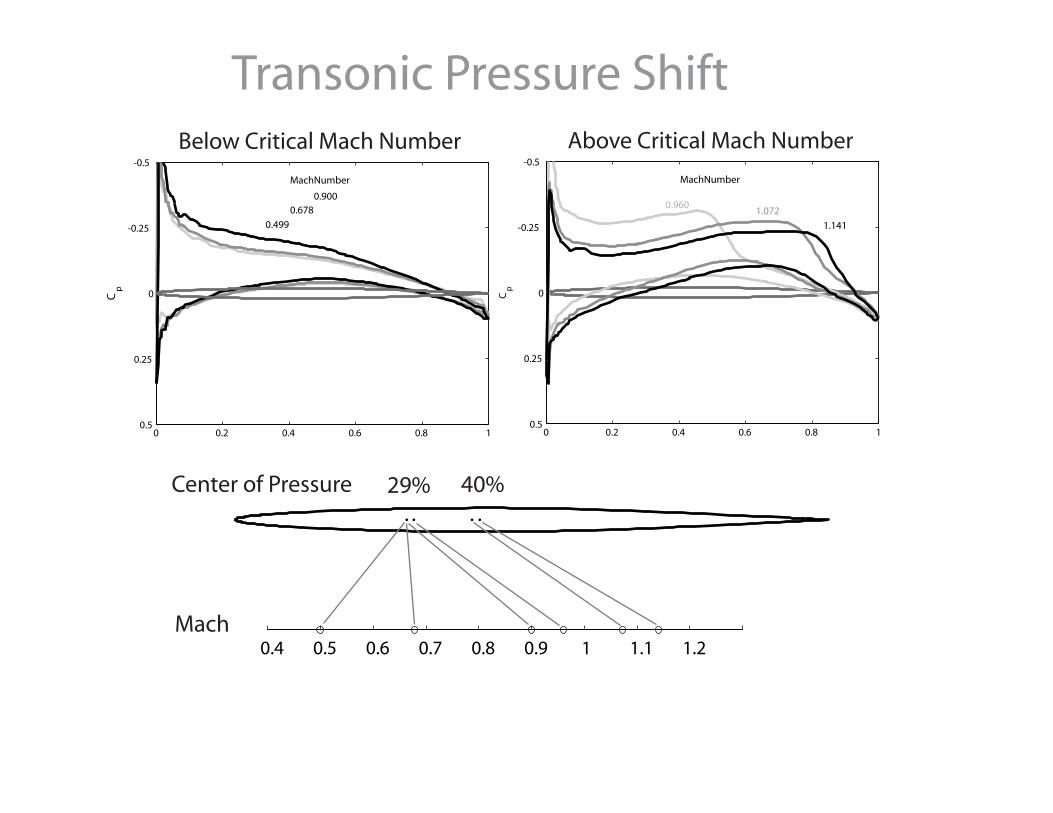
Transonic Pressure Shift
0 0.2 0.4 0.6 0.8 1
-0.5
-0.25
0
0.25
0.5
Cp
0.499
0.678 0.900
Mach Number
0 0.2 0.4 0.6 0.8 1
-0.5
-0.25
0
0.25
0.5
Cp
0.9601.072
1.141
Mach Number
0.4 0.5 0.6 0.7 0.8 0.9 1 1.1 1.2Mach
Center of Pressure 29% 40%
Below Critical Mach Number Above Critical Mach Number
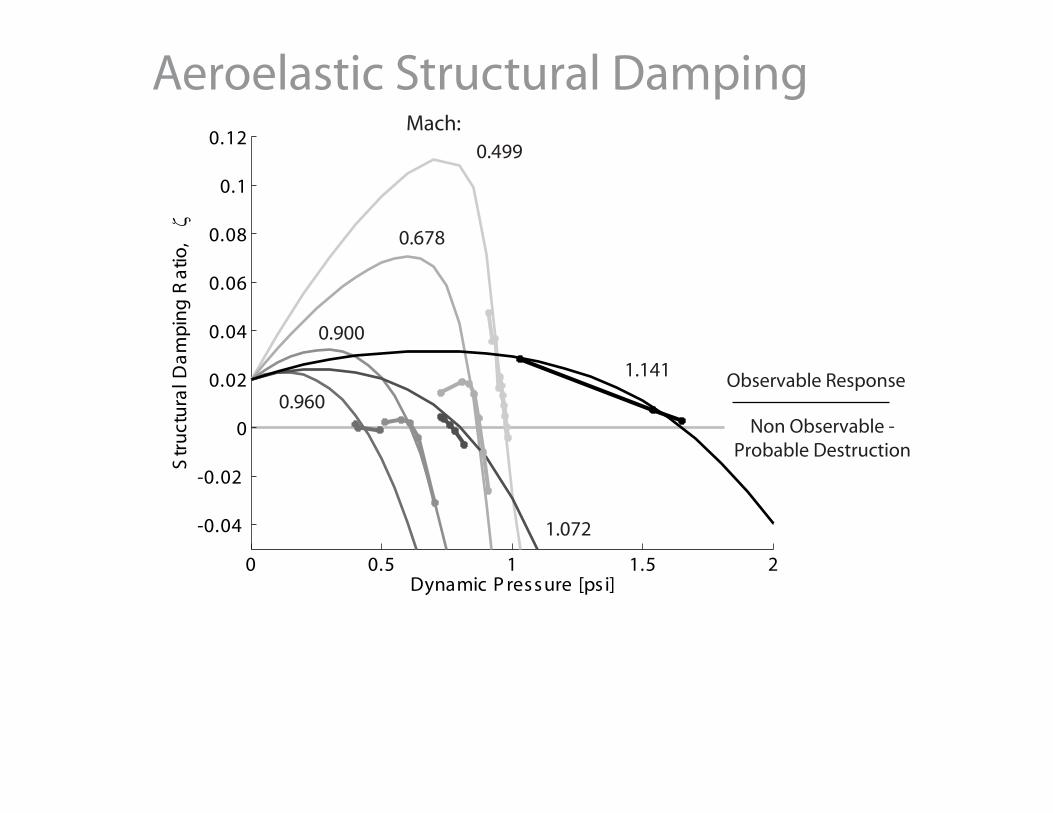
Aeroelastic Structural DampingMach:
0.499
0.678
0.900
0.960
1.072
1.141
0 0.5 1 1.5 2
-0.04
-0.02
0
0.02
0.04
0.06
0.08
0.1
0.12
Dynamic P ressure [ps i]
Str
uct
ura
l Da
mp
ing
Ra
tio,
ζ
Non Observable -Probable Destruction
Observable Response
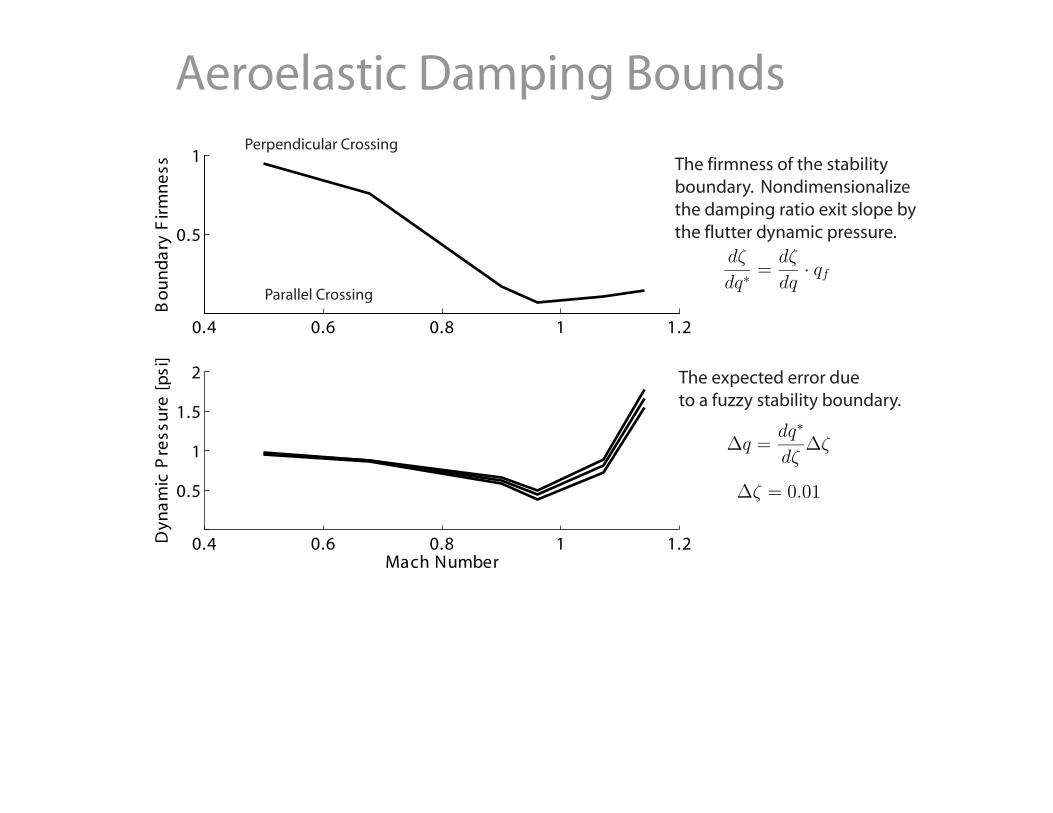
Aeroelastic Damping Bounds
0.4 0.6 0.8 1 1.2
0.5
1
1.5
2
Mach Number
Dyn
am
ic P
ress
ure
[p
si]
0.4 0.6 0.8 1 1.2
0.5
1B
ou
nd
ary
Fir
mn
ess
∆q =dq∗
dζ∆ζ
The expected error dueto a fuzzy stability boundary.
dζ
dq∗=dζ
dq· qf
The firmness of the stabilityboundary. Nondimensionalizethe damping ratio exit slope bythe flutter dynamic pressure.
∆ζ = 0.01
Perpendicular Crossing
Parallel Crossing
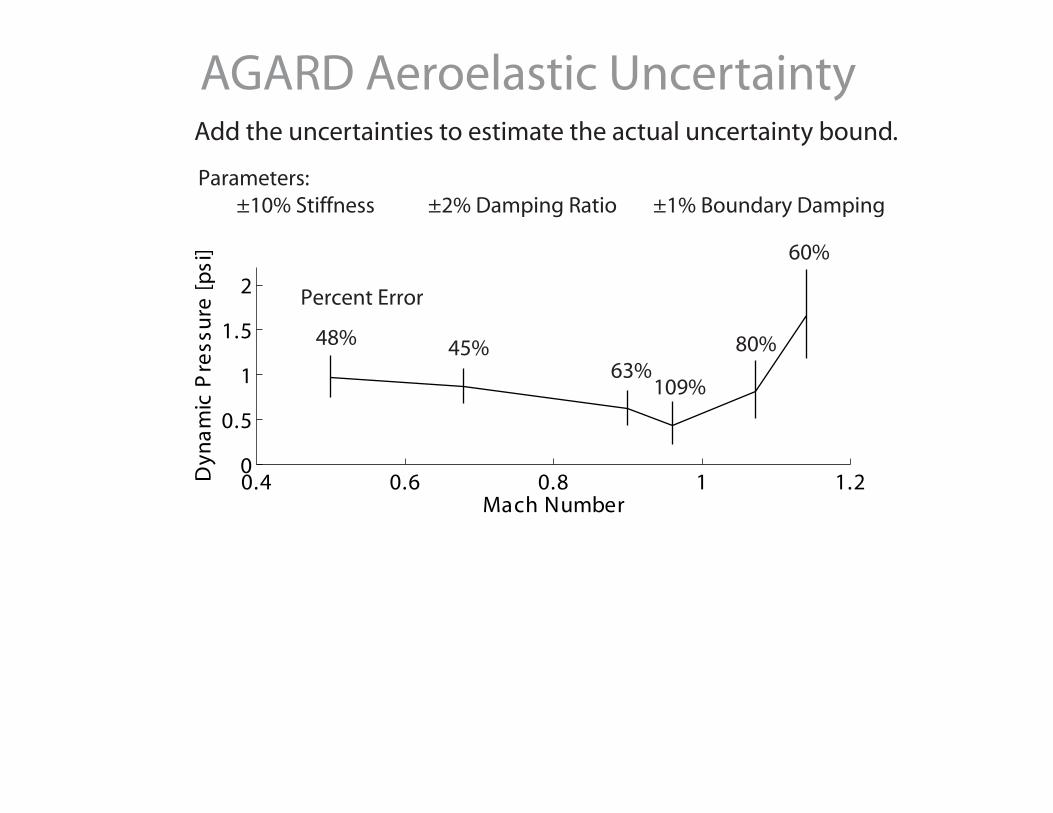
AGARD Aeroelastic UncertaintyAdd the uncertainties to estimate the actual uncertainty bound.
0.4 0.6 0.8 1 1.20
0.5
1
1.5
2
Mach Number
Dyn
am
ic P
ress
ure
[p
si]
48% 45%63%
109%
80%
60%
Percent Error
Parameters: ±10% Stiffness ±2% Damping Ratio ±1% Boundary Damping
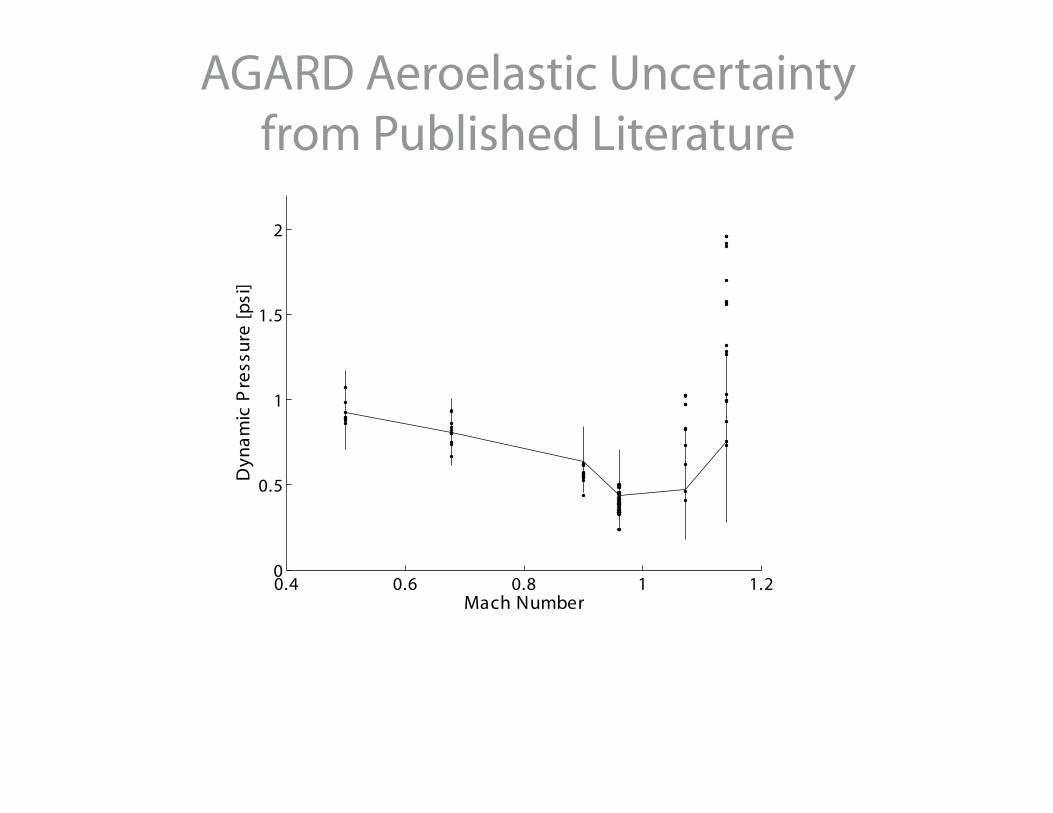
AGARD Aeroelastic Uncertaintyfrom Published Literature
0.4 0.6 0.8 1 1.20
0.5
1
1.5
2
Mach Number
Dyn
am
ic P
ress
ure
[p
si]
ConclusionsUncertainties affect all testcases.
Uncertainties can vary over an experimental range.
Coupling experimental and computational aeroelastic analysis provides for improved understanding of the dominant system physics.
Uncertainty analysis for published aeroelastic experiments is not prevalent.
Perfect comparisons between experimental and computational predictions might not be realistic.