dynamics of droplet generation from corneal tear film
TRANSCRIPT

Dynamics of Droplet Generation from CornealTear Film during Non-contact Eye Procedure inthe Context of COVID-19Durbar Roya, Sophia Ma, Abdur Rasheeda, Prasenjit Kabib, Abhijit Sinha Royc, Rohit Shettyd, and Saptarshi Basua,1
aDepartment of Mechanical Engineering, Indian Institute of Science, Bengaluru, 560012, India; bInterdisciplinary Centre for Energy Research, Indian Institute of Science,Bengaluru, 560012, India; cImaging, Biomechanics and Mathematical Modelling Solutions lab, Narayana Nethralaya Foundation, Bangalore, India; dNarayana Nethralaya EyeHospital, Bangalore, India
Non-invasive medical diagnostics demonstrate a propensity fordroplet generation and should be studied to devise risk mitigationstrategies against the spread of the SARS-CoV-2 virus. We inves-tigate the air-puff tonometry, which uses a short-timed air-puff toapplanate the human eye in a bid to detect the early onset of glau-coma by measuring the intraocular pressure. The air-puff consistsof a vortex trailed by a high-speed jet. High-speed imaging of theeye during a typical tonometry measurement reveals a sequence ofevents starting with the interaction between the tear layer and theair puff leading to an initial sheet ejection. It is immediately followedby the trailing jet applanating the central corneal section, causingcapillary waves to form and interact with the highly 3D transient ex-panding sheet. Such interaction with the capillary waves and the sur-rounding airfield due to the trailing jet causes the expanding sheet toundergo bag breakup, finger formation by Rayleigh Taylor instabilityand further break up into subsequent droplets by Rayleigh Plateau in-stability, which eventually splashes onto nearby objects, potentiallyforming fomites or aerosols which can lead to infections. The com-plex spatiotemporal phenomenon is carefully documented by rigor-ous experiments and corroborated using comprehensive theoreticalanalysis.
SARS-CoV-2 | COVID-19 | Tonometry | Human Eye | Fluid Dynamics| Droplets
Covid-19 is the current global health pandemic. Mostlythe virus SARS-CoV-2 proliferates through droplets of
saliva and discharge of the nose. It happens through cough-ing, talking, breathing and sneezing of a COVID-infectedperson. Many studies related to coughs and sneezing in boththe clinical/medical community and the scientific/engineeringcommunity like the works of Scharfman et al. , Bourouibaet al., to name a few (1, 2) studied the mechanisms involved.Scharfman et al., for the first time, showed that the breakupof droplets happens outside the respiratory tracts in violentexhalation processes. They further showed various kinds ofdroplet breakup mechanisms like sheet breakup, bag breakup,and ligament breakup during such processes. Bourouiba et al.also studied the fluid dynamics of violent expiratory events likecoughing and sneezing using high-speed scattering imagingtechniques. They discovered that the flow is highly turbulentand multiphase. Further, a theoretical analysis of pathogenbearing droplets interacting with the turbulent momentumpuff was conducted. The effect of respiratory droplets on thespread of Covid-19 was modelled by Chaudhari et al (3). Thevirus transmission can be minimized by adequately under-standing and studying the various causes of droplet generationfrom an infected individual and finding solutions to protect ev-eryone from such droplets. This work deals with a non-evasive
medical procedure called non-contact tonometry. Tonometryis a technique used by ophthalmologists to measure intraocu-lar pressure that gives a good idea of whether any patient issuffering from glaucoma or not. Further intraocular pressurealso helps to diagnose various other eye-related conditionsthat may be helpful to the specialist(4). The first most ac-curate IOP measuring device was the Maklakoff applanationtonometer(5). These early tonometers were the contact typetonometer. Medical practitioners and researchers modifiedand developed the tonometer through several generations in-creasing the reliability and accuracy of the device. The newbreed of tonometers like McKay-Marg tonometer, Tono-Pen,pneumatonometer, and air puff tonometer to name a few havegained popularity among medical practitioners (6). This workuses an air-puff type tonometer, which is a non-contact type.Many studies have been conducted on the working principleand the development of non-contact tonometers. Ophthalmol-ogists have conducted many clinical studies about IOP, itsvariation with time, its effect on different eye-related medicalconditions like glaucoma, corneal stiffness, and thickness, tomention a few. Some work related to the corneal deflection inresponse to an air puff tonometry has also been studied usingexperimental and computational techniques(7). The compli-cated structure of the human eye makes theoretical modelingquite challenging(8). Scientists have conducted preliminaryclinical studies decades ago and showed that droplets maybegenerated during non-contact tonometry(9). Some clinicalstudies shows that the SARS-CoV-2 virus can be present inhuman tears like the work of Sadhu et al.(10). Such aerosols,may lead to the transmission of the virus undetected. Theliterature on the fluid mechanics of tonometry is quite sparse.The spatiotemporal scales involved are quite small, and henceresolving the phenomena is quite challenging. The air puffemanating of a non contact tonometer is essentially a vortexring. There have been some studies on vortex ring impacton thin liquid films (11), but the resulting fluid mechanicsdue to vortex ring interaction with a human eye tear filmhas never been probed in detail. Previously we have carriedout some preliminary studies related to non-contact tonom-etry (12). This work provides some rigorous comprehensiveinsights into non-contact tonometry using experimental andtheoretical investigations performed on real human subjects.High-speed imaging and visualizations were carried out todecipher the underlying fluid dynamics in sufficient details fordry and watery eye conditions. Fig. 1 provides an overview ofthe entire time series of events during non-contact tonometry.Different phases have been identified on the basis of the orderof events (according to temporal history.) The phenomenonstarts with an air puff (a leading vortex with a trailing jet)
1
arX
iv:2
011.
0122
8v2
[ph
ysic
s.m
ed-p
h] 1
0 N
ov 2
020
Air puff ejection and traveling (A)
Corneal deflection (C)
Capillary waves (D)
Initial sheet expansionand no capillary waves (B)
Sheet Expansion (E)
Droplets Ejection(F)
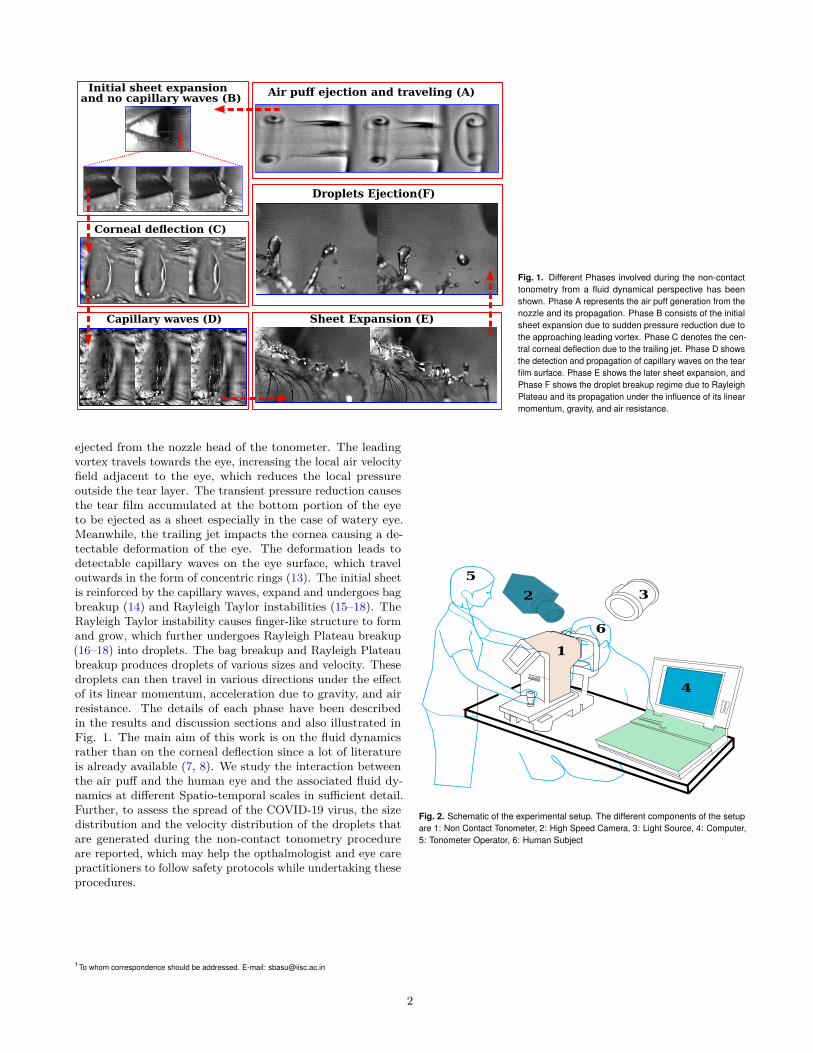
Fig. 1. Different Phases involved during the non-contacttonometry from a fluid dynamical perspective has beenshown. Phase A represents the air puff generation from thenozzle and its propagation. Phase B consists of the initialsheet expansion due to sudden pressure reduction due tothe approaching leading vortex. Phase C denotes the cen-tral corneal deflection due to the trailing jet. Phase D showsthe detection and propagation of capillary waves on the tearfilm surface. Phase E shows the later sheet expansion, andPhase F shows the droplet breakup regime due to RayleighPlateau and its propagation under the influence of its linearmomentum, gravity, and air resistance.
ejected from the nozzle head of the tonometer. The leadingvortex travels towards the eye, increasing the local air velocityfield adjacent to the eye, which reduces the local pressureoutside the tear layer. The transient pressure reduction causesthe tear film accumulated at the bottom portion of the eyeto be ejected as a sheet especially in the case of watery eye.Meanwhile, the trailing jet impacts the cornea causing a de-tectable deformation of the eye. The deformation leads todetectable capillary waves on the eye surface, which traveloutwards in the form of concentric rings (13). The initial sheetis reinforced by the capillary waves, expand and undergoes bagbreakup (14) and Rayleigh Taylor instabilities (15–18). TheRayleigh Taylor instability causes finger-like structure to formand grow, which further undergoes Rayleigh Plateau breakup(16–18) into droplets. The bag breakup and Rayleigh Plateaubreakup produces droplets of various sizes and velocity. Thesedroplets can then travel in various directions under the effectof its linear momentum, acceleration due to gravity, and airresistance. The details of each phase have been describedin the results and discussion sections and also illustrated inFig. 1. The main aim of this work is on the fluid dynamicsrather than on the corneal deflection since a lot of literatureis already available (7, 8). We study the interaction betweenthe air puff and the human eye and the associated fluid dy-namics at different Spatio-temporal scales in sufficient detail.Further, to assess the spread of the COVID-19 virus, the sizedistribution and the velocity distribution of the droplets thatare generated during the non-contact tonometry procedureare reported, which may help the opthalmologist and eye carepractitioners to follow safety protocols while undertaking theseprocedures.
1To whom correspondence should be addressed. E-mail: [email protected]
1
3
6
5
2
4
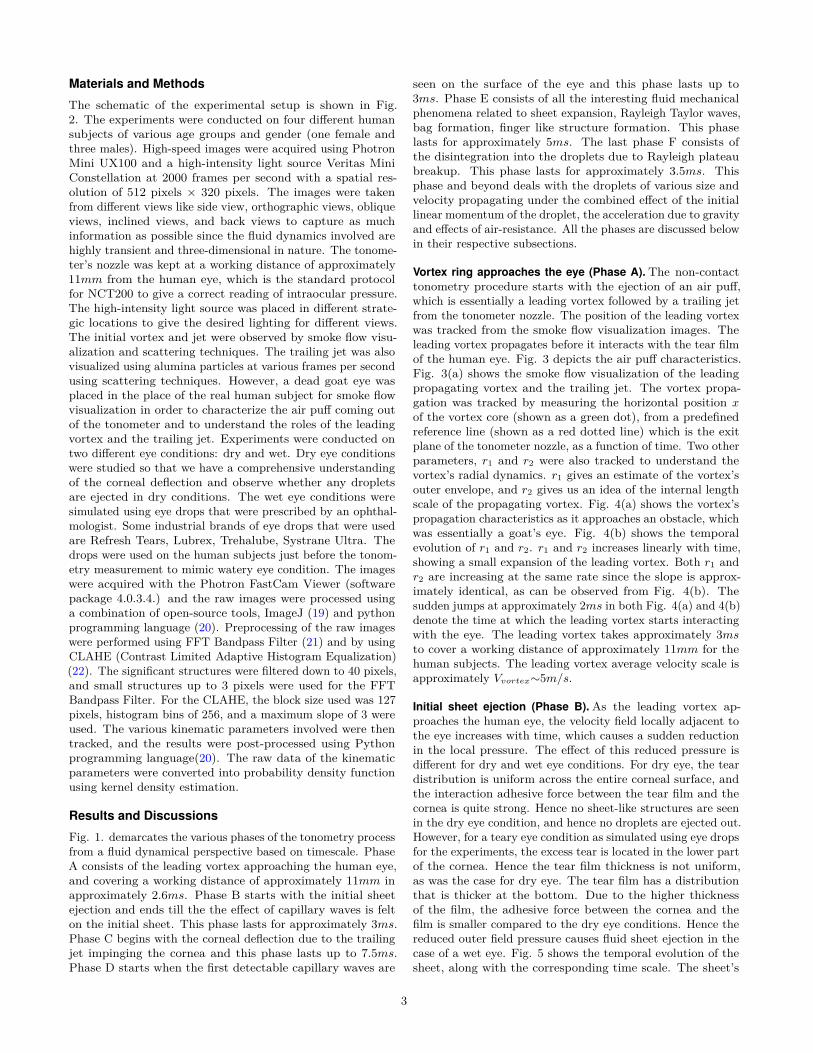
Fig. 2. Schematic of the experimental setup. The different components of the setupare 1: Non Contact Tonometer, 2: High Speed Camera, 3: Light Source, 4: Computer,5: Tonometer Operator, 6: Human Subject
2
Materials and Methods
The schematic of the experimental setup is shown in Fig.2. The experiments were conducted on four different humansubjects of various age groups and gender (one female andthree males). High-speed images were acquired using PhotronMini UX100 and a high-intensity light source Veritas MiniConstellation at 2000 frames per second with a spatial res-olution of 512 pixels × 320 pixels. The images were takenfrom different views like side view, orthographic views, obliqueviews, inclined views, and back views to capture as muchinformation as possible since the fluid dynamics involved arehighly transient and three-dimensional in nature. The tonome-ter’s nozzle was kept at a working distance of approximately11mm from the human eye, which is the standard protocolfor NCT200 to give a correct reading of intraocular pressure.The high-intensity light source was placed in different strate-gic locations to give the desired lighting for different views.The initial vortex and jet were observed by smoke flow visu-alization and scattering techniques. The trailing jet was alsovisualized using alumina particles at various frames per secondusing scattering techniques. However, a dead goat eye wasplaced in the place of the real human subject for smoke flowvisualization in order to characterize the air puff coming outof the tonometer and to understand the roles of the leadingvortex and the trailing jet. Experiments were conducted ontwo different eye conditions: dry and wet. Dry eye conditionswere studied so that we have a comprehensive understandingof the corneal deflection and observe whether any dropletsare ejected in dry conditions. The wet eye conditions weresimulated using eye drops that were prescribed by an ophthal-mologist. Some industrial brands of eye drops that were usedare Refresh Tears, Lubrex, Trehalube, Systrane Ultra. Thedrops were used on the human subjects just before the tonom-etry measurement to mimic watery eye condition. The imageswere acquired with the Photron FastCam Viewer (softwarepackage 4.0.3.4.) and the raw images were processed usinga combination of open-source tools, ImageJ (19) and pythonprogramming language (20). Preprocessing of the raw imageswere performed using FFT Bandpass Filter (21) and by usingCLAHE (Contrast Limited Adaptive Histogram Equalization)(22). The significant structures were filtered down to 40 pixels,and small structures up to 3 pixels were used for the FFTBandpass Filter. For the CLAHE, the block size used was 127pixels, histogram bins of 256, and a maximum slope of 3 wereused. The various kinematic parameters involved were thentracked, and the results were post-processed using Pythonprogramming language(20). The raw data of the kinematicparameters were converted into probability density functionusing kernel density estimation.
Results and Discussions
Fig. 1. demarcates the various phases of the tonometry processfrom a fluid dynamical perspective based on timescale. PhaseA consists of the leading vortex approaching the human eye,and covering a working distance of approximately 11mm inapproximately 2.6ms. Phase B starts with the initial sheetejection and ends till the the effect of capillary waves is felton the initial sheet. This phase lasts for approximately 3ms.Phase C begins with the corneal deflection due to the trailingjet impinging the cornea and this phase lasts up to 7.5ms.Phase D starts when the first detectable capillary waves are
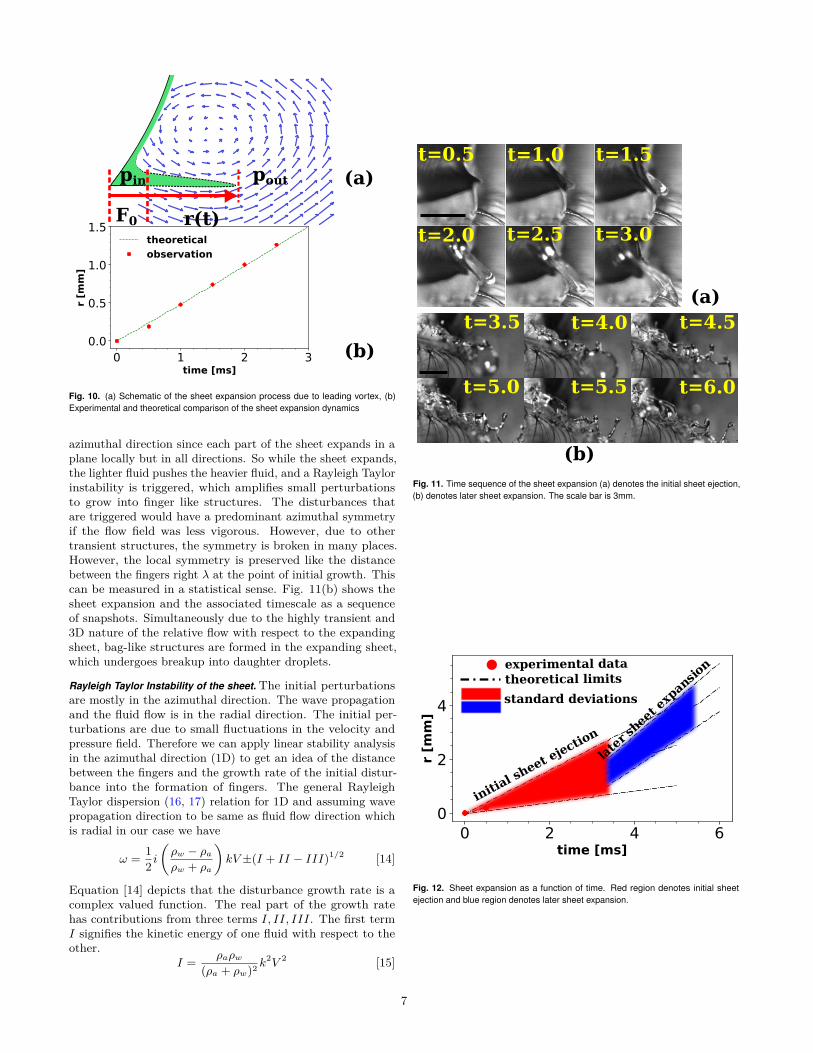
seen on the surface of the eye and this phase lasts up to3ms. Phase E consists of all the interesting fluid mechanicalphenomena related to sheet expansion, Rayleigh Taylor waves,bag formation, finger like structure formation. This phaselasts for approximately 5ms. The last phase F consists ofthe disintegration into the droplets due to Rayleigh plateaubreakup. This phase lasts for approximately 3.5ms. Thisphase and beyond deals with the droplets of various size andvelocity propagating under the combined effect of the initiallinear momentum of the droplet, the acceleration due to gravityand effects of air-resistance. All the phases are discussed belowin their respective subsections.
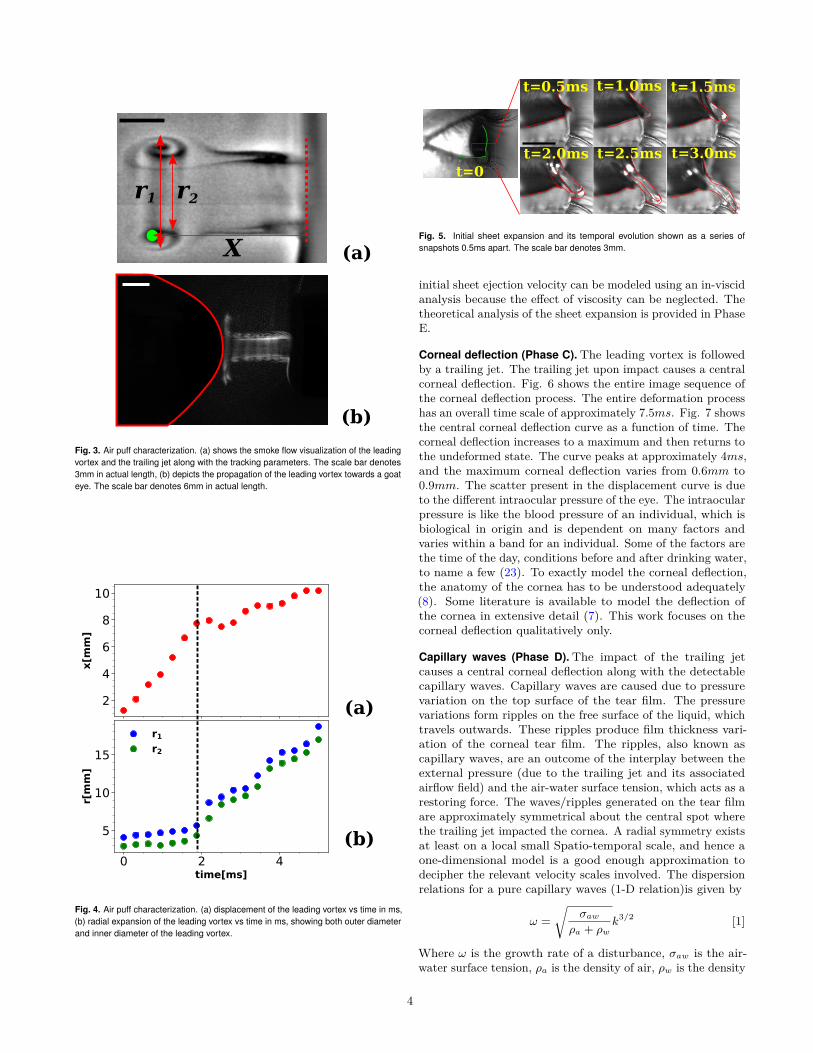
Vortex ring approaches the eye (Phase A). The non-contacttonometry procedure starts with the ejection of an air puff,which is essentially a leading vortex followed by a trailing jetfrom the tonometer nozzle. The position of the leading vortexwas tracked from the smoke flow visualization images. Theleading vortex propagates before it interacts with the tear filmof the human eye. Fig. 3 depicts the air puff characteristics.Fig. 3(a) shows the smoke flow visualization of the leadingpropagating vortex and the trailing jet. The vortex propa-gation was tracked by measuring the horizontal position xof the vortex core (shown as a green dot), from a predefinedreference line (shown as a red dotted line) which is the exitplane of the tonometer nozzle, as a function of time. Two otherparameters, r1 and r2 were also tracked to understand thevortex’s radial dynamics. r1 gives an estimate of the vortex’souter envelope, and r2 gives us an idea of the internal lengthscale of the propagating vortex. Fig. 4(a) shows the vortex’spropagation characteristics as it approaches an obstacle, whichwas essentially a goat’s eye. Fig. 4(b) shows the temporalevolution of r1 and r2. r1 and r2 increases linearly with time,showing a small expansion of the leading vortex. Both r1 andr2 are increasing at the same rate since the slope is approx-imately identical, as can be observed from Fig. 4(b). Thesudden jumps at approximately 2ms in both Fig. 4(a) and 4(b)denote the time at which the leading vortex starts interactingwith the eye. The leading vortex takes approximately 3msto cover a working distance of approximately 11mm for thehuman subjects. The leading vortex average velocity scale isapproximately Vvortex∼5m/s.
Initial sheet ejection (Phase B). As the leading vortex ap-proaches the human eye, the velocity field locally adjacent tothe eye increases with time, which causes a sudden reductionin the local pressure. The effect of this reduced pressure isdifferent for dry and wet eye conditions. For dry eye, the teardistribution is uniform across the entire corneal surface, andthe interaction adhesive force between the tear film and thecornea is quite strong. Hence no sheet-like structures are seenin the dry eye condition, and hence no droplets are ejected out.However, for a teary eye condition as simulated using eye dropsfor the experiments, the excess tear is located in the lower partof the cornea. Hence the tear film thickness is not uniform,as was the case for dry eye. The tear film has a distributionthat is thicker at the bottom. Due to the higher thicknessof the film, the adhesive force between the cornea and thefilm is smaller compared to the dry eye conditions. Hence thereduced outer field pressure causes fluid sheet ejection in thecase of a wet eye. Fig. 5 shows the temporal evolution of thesheet, along with the corresponding time scale. The sheet’s
3
(a)
(b)
X
r1 r2
Fig. 3. Air puff characterization. (a) shows the smoke flow visualization of the leadingvortex and the trailing jet along with the tracking parameters. The scale bar denotes3mm in actual length, (b) depicts the propagation of the leading vortex towards a goateye. The scale bar denotes 6mm in actual length.
0 2 4time[ms]
2
4
6
8
10
x[m
m]
0 2 4time[ms]
5
10
15
r[mm]
r1r2
(a)
(b)
Fig. 4. Air puff characterization. (a) displacement of the leading vortex vs time in ms,(b) radial expansion of the leading vortex vs time in ms, showing both outer diameterand inner diameter of the leading vortex.
t=0.5ms
t=2.0ms t=2.5ms t=3.0ms
t=1.5mst=1.0ms
t=0
Fig. 5. Initial sheet expansion and its temporal evolution shown as a series ofsnapshots 0.5ms apart. The scale bar denotes 3mm.
initial sheet ejection velocity can be modeled using an in-viscidanalysis because the effect of viscosity can be neglected. Thetheoretical analysis of the sheet expansion is provided in PhaseE.
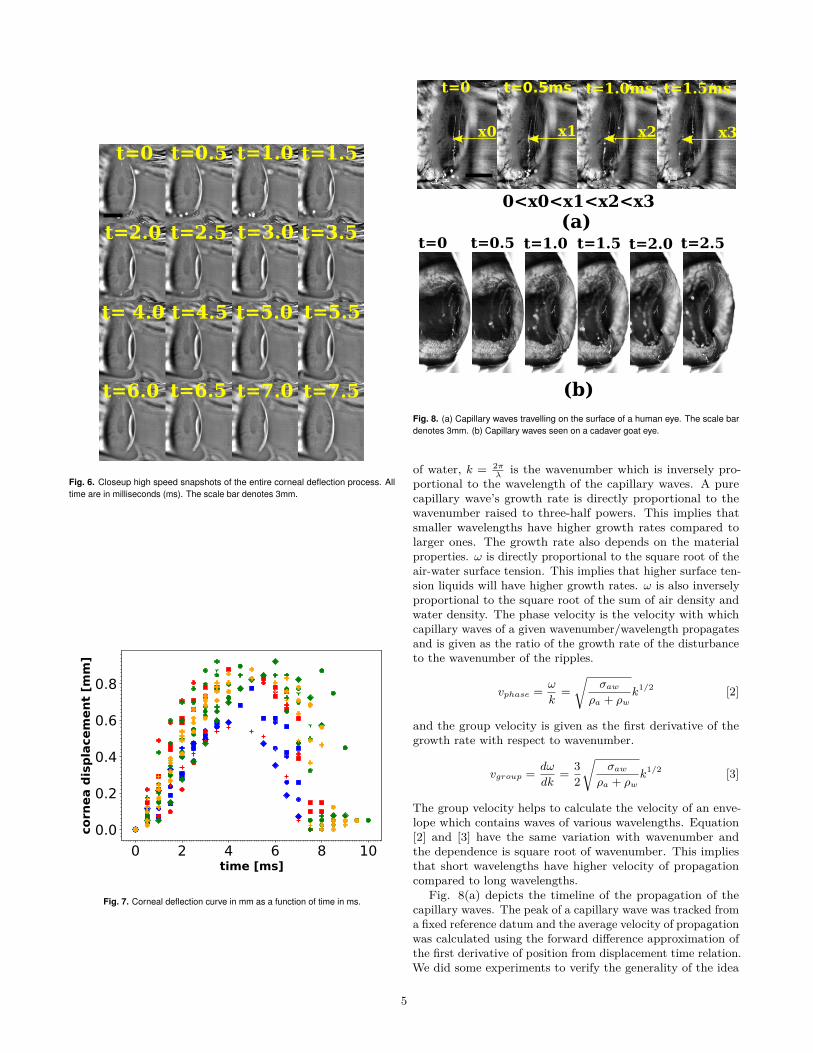
Corneal deflection (Phase C). The leading vortex is followedby a trailing jet. The trailing jet upon impact causes a centralcorneal deflection. Fig. 6 shows the entire image sequence ofthe corneal deflection process. The entire deformation processhas an overall time scale of approximately 7.5ms. Fig. 7 showsthe central corneal deflection curve as a function of time. Thecorneal deflection increases to a maximum and then returns tothe undeformed state. The curve peaks at approximately 4ms,and the maximum corneal deflection varies from 0.6mm to0.9mm. The scatter present in the displacement curve is dueto the different intraocular pressure of the eye. The intraocularpressure is like the blood pressure of an individual, which isbiological in origin and is dependent on many factors andvaries within a band for an individual. Some of the factors arethe time of the day, conditions before and after drinking water,to name a few (23). To exactly model the corneal deflection,the anatomy of the cornea has to be understood adequately(8). Some literature is available to model the deflection ofthe cornea in extensive detail (7). This work focuses on thecorneal deflection qualitatively only.
Capillary waves (Phase D). The impact of the trailing jetcauses a central corneal deflection along with the detectablecapillary waves. Capillary waves are caused due to pressurevariation on the top surface of the tear film. The pressurevariations form ripples on the free surface of the liquid, whichtravels outwards. These ripples produce film thickness vari-ation of the corneal tear film. The ripples, also known ascapillary waves, are an outcome of the interplay between theexternal pressure (due to the trailing jet and its associatedairflow field) and the air-water surface tension, which acts as arestoring force. The waves/ripples generated on the tear filmare approximately symmetrical about the central spot wherethe trailing jet impacted the cornea. A radial symmetry existsat least on a local small Spatio-temporal scale, and hence aone-dimensional model is a good enough approximation todecipher the relevant velocity scales involved. The dispersionrelations for a pure capillary waves (1-D relation)is given by
ω =√
σawρa + ρw
k3/2 [1]
Where ω is the growth rate of a disturbance, σaw is the air-water surface tension, ρa is the density of air, ρw is the density
4
t=0 t=0.5 t=1.0 t=1.5
t=2.0 t=2.5 t=3.0 t=3.5
t= 4.0 t=4.5 t=5.0 t=5.5
t=6.0 t=6.5 t=7.0 t=7.5
Fig. 6. Closeup high speed snapshots of the entire corneal deflection process. Alltime are in milliseconds (ms). The scale bar denotes 3mm.
0 2 4 6 8 10time [ms]
0.0
0.2
0.4
0.6
0.8
corn
ea d
isp
lacem
en
t [m
m]
Fig. 7. Corneal deflection curve in mm as a function of time in ms.
0<x0<x1<x2<x3
t=0.5mst=0 t=1.0ms t=1.5ms
x0 x1 x2 x3
(b)
(a)t=0 t=0.5 t=1.0 t=1.5 t=2.0 t=2.5
Fig. 8. (a) Capillary waves travelling on the surface of a human eye. The scale bardenotes 3mm. (b) Capillary waves seen on a cadaver goat eye.
of water, k = 2πλ
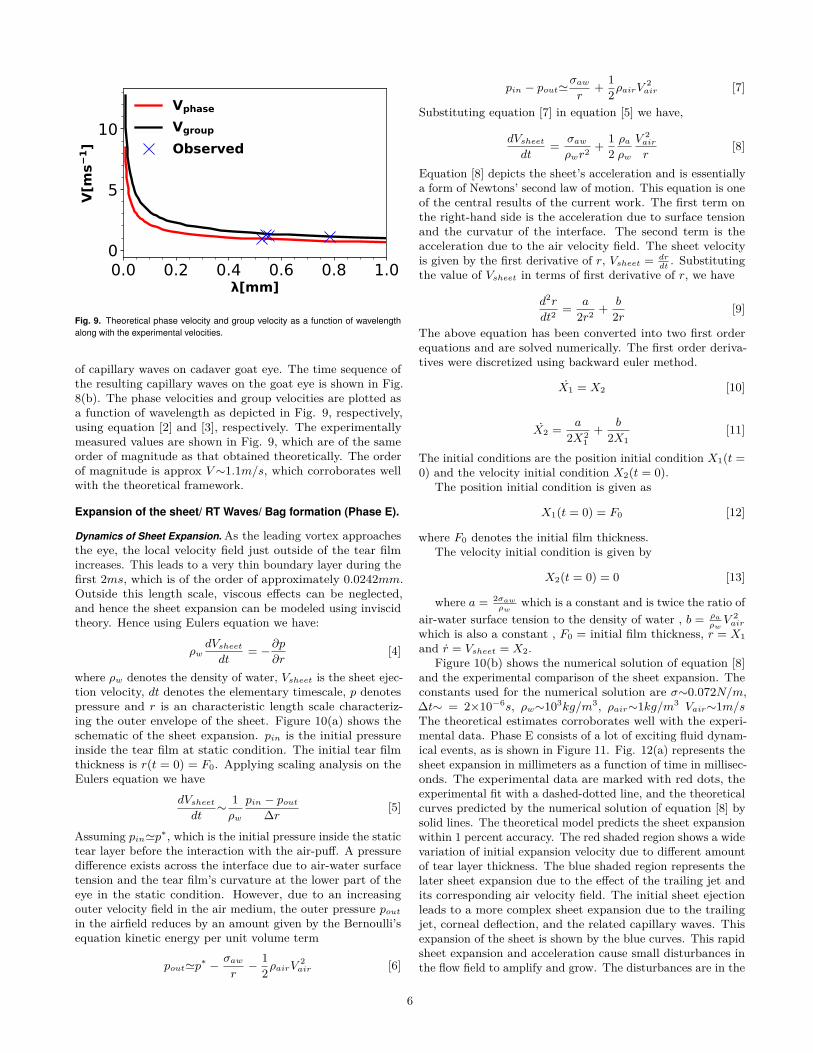
is the wavenumber which is inversely pro-portional to the wavelength of the capillary waves. A purecapillary wave’s growth rate is directly proportional to thewavenumber raised to three-half powers. This implies thatsmaller wavelengths have higher growth rates compared tolarger ones. The growth rate also depends on the materialproperties. ω is directly proportional to the square root of theair-water surface tension. This implies that higher surface ten-sion liquids will have higher growth rates. ω is also inverselyproportional to the square root of the sum of air density andwater density. The phase velocity is the velocity with whichcapillary waves of a given wavenumber/wavelength propagatesand is given as the ratio of the growth rate of the disturbanceto the wavenumber of the ripples.
vphase = ω
k=√
σawρa + ρw
k1/2 [2]
and the group velocity is given as the first derivative of thegrowth rate with respect to wavenumber.
vgroup = dω
dk= 3
2
√σaw
ρa + ρwk1/2 [3]
The group velocity helps to calculate the velocity of an enve-lope which contains waves of various wavelengths. Equation[2] and [3] have the same variation with wavenumber andthe dependence is square root of wavenumber. This impliesthat short wavelengths have higher velocity of propagationcompared to long wavelengths.
Fig. 8(a) depicts the timeline of the propagation of thecapillary waves. The peak of a capillary wave was tracked froma fixed reference datum and the average velocity of propagationwas calculated using the forward difference approximation ofthe first derivative of position from displacement time relation.We did some experiments to verify the generality of the idea
5
0.0 0.2 0.4 0.6 0.8 1.0[mm]
0
5
10
V[m
s1]
Vphase
Vgroup
Observed
Fig. 9. Theoretical phase velocity and group velocity as a function of wavelengthalong with the experimental velocities.
of capillary waves on cadaver goat eye. The time sequence ofthe resulting capillary waves on the goat eye is shown in Fig.8(b). The phase velocities and group velocities are plotted asa function of wavelength as depicted in Fig. 9, respectively,using equation [2] and [3], respectively. The experimentallymeasured values are shown in Fig. 9, which are of the sameorder of magnitude as that obtained theoretically. The orderof magnitude is approx V∼1.1m/s, which corroborates wellwith the theoretical framework.
Expansion of the sheet/ RT Waves/ Bag formation (Phase E).
Dynamics of Sheet Expansion. As the leading vortex approachesthe eye, the local velocity field just outside of the tear filmincreases. This leads to a very thin boundary layer during thefirst 2ms, which is of the order of approximately 0.0242mm.Outside this length scale, viscous effects can be neglected,and hence the sheet expansion can be modeled using inviscidtheory. Hence using Eulers equation we have:
ρwdVsheetdt
= −∂p∂r
[4]
where ρw denotes the density of water, Vsheet is the sheet ejec-tion velocity, dt denotes the elementary timescale, p denotespressure and r is an characteristic length scale characteriz-ing the outer envelope of the sheet. Figure 10(a) shows theschematic of the sheet expansion. pin is the initial pressureinside the tear film at static condition. The initial tear filmthickness is r(t = 0) = F0. Applying scaling analysis on theEulers equation we have
dVsheetdt
∼ 1ρw
pin − pout∆r [5]
Assuming pin'p∗, which is the initial pressure inside the statictear layer before the interaction with the air-puff. A pressuredifference exists across the interface due to air-water surfacetension and the tear film’s curvature at the lower part of theeye in the static condition. However, due to an increasingouter velocity field in the air medium, the outer pressure poutin the airfield reduces by an amount given by the Bernoulli’sequation kinetic energy per unit volume term
pout'p∗ − σawr− 1
2ρairV2air [6]
pin − pout'σawr
+ 12ρairV
2air [7]
Substituting equation [7] in equation [5] we have,
dVsheetdt
= σawρwr2 + 1
2ρaρw
V 2air
r[8]
Equation [8] depicts the sheet’s acceleration and is essentiallya form of Newtons’ second law of motion. This equation is oneof the central results of the current work. The first term onthe right-hand side is the acceleration due to surface tensionand the curvatur of the interface. The second term is theacceleration due to the air velocity field. The sheet velocityis given by the first derivative of r, Vsheet = dr
dt. Substituting
the value of Vsheet in terms of first derivative of r, we have
d2r
dt2= a
2r2 + b
2r [9]
The above equation has been converted into two first orderequations and are solved numerically. The first order deriva-tives were discretized using backward euler method.
X1 = X2 [10]
X2 = a
2X21
+ b
2X1[11]
The initial conditions are the position initial condition X1(t =0) and the velocity initial condition X2(t = 0).
The position initial condition is given as
X1(t = 0) = F0 [12]
where F0 denotes the initial film thickness.The velocity initial condition is given by
X2(t = 0) = 0 [13]
where a = 2σawρw
which is a constant and is twice the ratio ofair-water surface tension to the density of water , b = ρa
ρwV 2air
which is also a constant , F0 = initial film thickness, r = X1and r = Vsheet = X2.
Figure 10(b) shows the numerical solution of equation [8]and the experimental comparison of the sheet expansion. Theconstants used for the numerical solution are σ∼0.072N/m,∆t∼ = 2×10⁻⁶s, ρw∼103kg/m3, ρair∼1kg/m3 Vair∼1m/sThe theoretical estimates corroborates well with the experi-mental data. Phase E consists of a lot of exciting fluid dynam-ical events, as is shown in Figure 11. Fig. 12(a) represents thesheet expansion in millimeters as a function of time in millisec-onds. The experimental data are marked with red dots, theexperimental fit with a dashed-dotted line, and the theoreticalcurves predicted by the numerical solution of equation [8] bysolid lines. The theoretical model predicts the sheet expansionwithin 1 percent accuracy. The red shaded region shows a widevariation of initial expansion velocity due to different amountof tear layer thickness. The blue shaded region represents thelater sheet expansion due to the effect of the trailing jet andits corresponding air velocity field. The initial sheet ejectionleads to a more complex sheet expansion due to the trailingjet, corneal deflection, and the related capillary waves. Thisexpansion of the sheet is shown by the blue curves. This rapidsheet expansion and acceleration cause small disturbances inthe flow field to amplify and grow. The disturbances are in the
6
pin pout (a)
(b)
r(t)F0
0 1 2 3time [ms]
0.0
0.5
1.0
1.5
r [m
m]
theoretical
observation
Fig. 10. (a) Schematic of the sheet expansion process due to leading vortex, (b)Experimental and theoretical comparison of the sheet expansion dynamics
azimuthal direction since each part of the sheet expands in aplane locally but in all directions. So while the sheet expands,the lighter fluid pushes the heavier fluid, and a Rayleigh Taylorinstability is triggered, which amplifies small perturbationsto grow into finger like structures. The disturbances thatare triggered would have a predominant azimuthal symmetryif the flow field was less vigorous. However, due to othertransient structures, the symmetry is broken in many places.However, the local symmetry is preserved like the distancebetween the fingers right λ at the point of initial growth. Thiscan be measured in a statistical sense. Fig. 11(b) shows thesheet expansion and the associated timescale as a sequenceof snapshots. Simultaneously due to the highly transient and3D nature of the relative flow with respect to the expandingsheet, bag-like structures are formed in the expanding sheet,which undergoes breakup into daughter droplets.
Rayleigh Taylor Instability of the sheet. The initial perturbationsare mostly in the azimuthal direction. The wave propagationand the fluid flow is in the radial direction. The initial per-turbations are due to small fluctuations in the velocity andpressure field. Therefore we can apply linear stability analysisin the azimuthal direction (1D) to get an idea of the distancebetween the fingers and the growth rate of the initial distur-bance into the formation of fingers. The general RayleighTaylor dispersion (16, 17) relation for 1D and assuming wavepropagation direction to be same as fluid flow direction whichis radial in our case we have
ω = 12 i(ρw − ρaρw + ρa
)kV±(I + II − III)1/2 [14]
Equation [14] depicts that the disturbance growth rate is acomplex valued function. The real part of the growth ratehas contributions from three terms I, II, III. The first termI signifies the kinetic energy of one fluid with respect to theother.
I = ρaρw(ρa + ρw)2 k
2V 2 [15]
(a)
(b)
t=0.5 t=1.0 t=1.5
t=2.0 t=2.5 t=3.0
t=3.5 t=4.0 t=4.5
t=5.0 t=5.5 t=6.0
Fig. 11. Time sequence of the sheet expansion (a) denotes the initial sheet ejection,(b) denotes later sheet expansion. The scale bar is 3mm.
0 2 4 6time [ms]
0
2
4
r [m
m]
initial s
heet ejectio
n
experimental datatheoretical limits
standard deviations
late
r she
et e
xpan
sion
Fig. 12. Sheet expansion as a function of time. Red region denotes initial sheetejection and blue region denotes later sheet expansion.
7
The second term II signifies the apparent gravity felt by theexpanding sheet.
II = (ρw − ρa)(ρw + ρa)geffk [16]
The third term III is the contribution due to the surfacetension.
III = σaw(ρw + ρa)k
3 [17]
where V is the absolute value of the relative flow velocity ofair with respect to the sheet and geff is the apparent gravityexperienced by the sheet.
Re(ω) = (I + II − III)1/2 [18]
where Re(ω) denotes the real part of the complex valuedfunction which is physically the initial perturbations growthrate.
Re(ω)2 = (I + II − III) [19]
Equation [19] shows that the kinetic energy and the apparentgravity contribute positively to the growth of the disturbancewhereas surface tension has a negative effect on the growth ofthe disturbance and tries to suppress the growing disturbance.
d
dk(Re(ω)2) = d
dk(I + II − III)
d
dk(Re(ω)2) = ρaρwV
22k(ρa + ρw)2 + (ρw − ρa)geff
ρa + ρw− 3σawk2
(ρa + ρw)For extremum conditions (in this case it is a maxima) we havethe derivative of the real part of the square of the growth ratewith respect to the wavenumber to be zero.
d
dk(Re(ω)2) = 0 [20]
ρaρwV22k
(ρa + ρw)2 + (ρw − ρa)geffρa + ρw
− 3σawk2
(ρa + ρw) = 0 [21]
The solution of equation [20] will give us the wavenumberwhose real part of the growth rate is the maximum. Thissolution will provide the wavenumber of the fastest growingwave.
3σawk2 − 2ρaρwV 2
(ρa + ρw)k − (ρw − ρa)geff = 0 [22]
k2 − 2ρaρwV 2
3(ρa + ρw)σawk − (ρw − ρa)geff
3σaw= 0 [23]
k2 −Bk − C = 0 [24]
where B = 2ρaρwV2
3(ρa+ρw)σawand C = (ρw−ρa)geff
3σaw
kmax = B
2 +
√B2
4 + C [25]
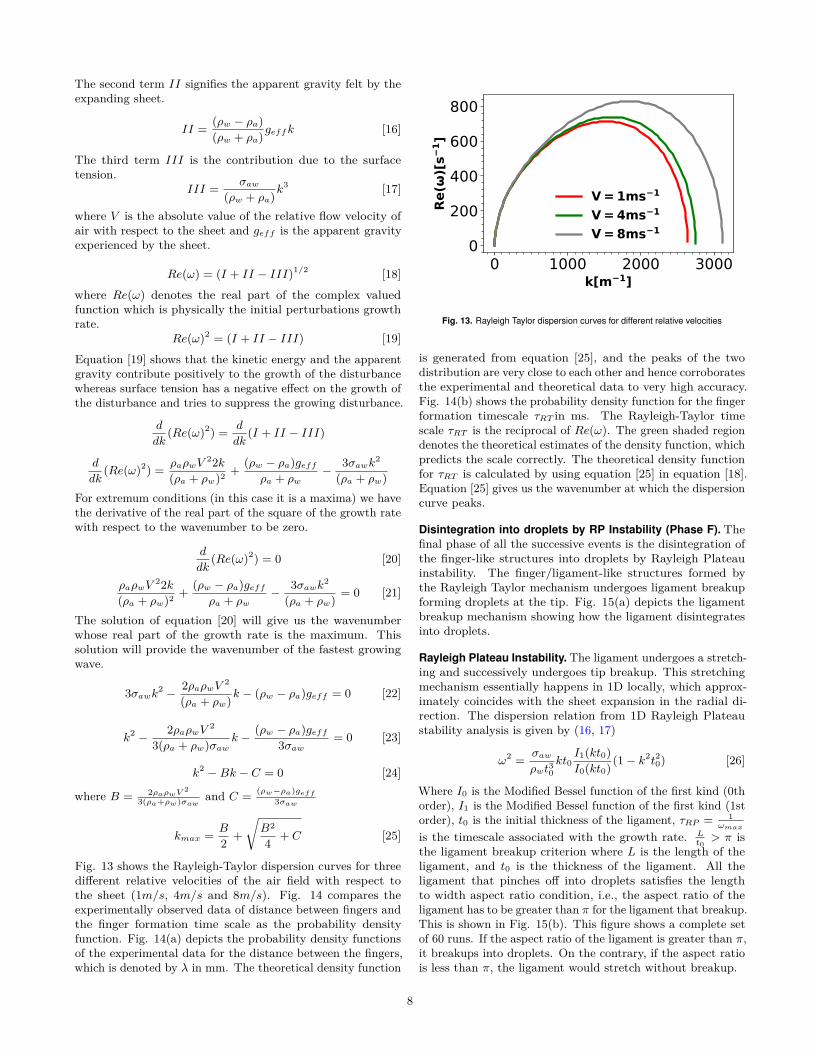
Fig. 13 shows the Rayleigh-Taylor dispersion curves for threedifferent relative velocities of the air field with respect tothe sheet (1m/s, 4m/s and 8m/s). Fig. 14 compares theexperimentally observed data of distance between fingers andthe finger formation time scale as the probability densityfunction. Fig. 14(a) depicts the probability density functionsof the experimental data for the distance between the fingers,which is denoted by λ in mm. The theoretical density function
0 1000 2000 3000k[m 1]
0
200
400
600
800
Re(
)[s
1]
V = 1ms 1
V=4ms 1
V=8ms 1
Fig. 13. Rayleigh Taylor dispersion curves for different relative velocities
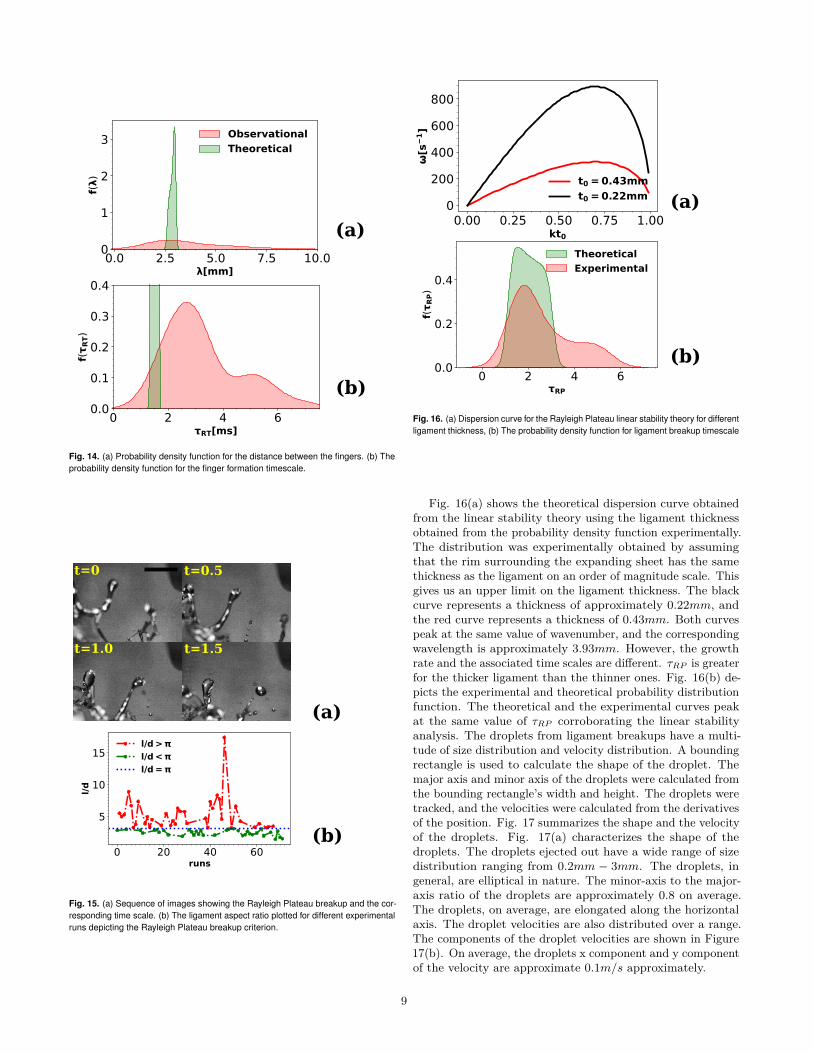
is generated from equation [25], and the peaks of the twodistribution are very close to each other and hence corroboratesthe experimental and theoretical data to very high accuracy.Fig. 14(b) shows the probability density function for the fingerformation timescale τRT in ms. The Rayleigh-Taylor timescale τRT is the reciprocal of Re(ω). The green shaded regiondenotes the theoretical estimates of the density function, whichpredicts the scale correctly. The theoretical density functionfor τRT is calculated by using equation [25] in equation [18].Equation [25] gives us the wavenumber at which the dispersioncurve peaks.
Disintegration into droplets by RP Instability (Phase F). Thefinal phase of all the successive events is the disintegration ofthe finger-like structures into droplets by Rayleigh Plateauinstability. The finger/ligament-like structures formed bythe Rayleigh Taylor mechanism undergoes ligament breakupforming droplets at the tip. Fig. 15(a) depicts the ligamentbreakup mechanism showing how the ligament disintegratesinto droplets.
Rayleigh Plateau Instability. The ligament undergoes a stretch-ing and successively undergoes tip breakup. This stretchingmechanism essentially happens in 1D locally, which approx-imately coincides with the sheet expansion in the radial di-rection. The dispersion relation from 1D Rayleigh Plateaustability analysis is given by (16, 17)
ω2 = σawρwt30
kt0I1(kt0)I0(kt0) (1− k2t20) [26]
Where I0 is the Modified Bessel function of the first kind (0thorder), I1 is the Modified Bessel function of the first kind (1storder), t0 is the initial thickness of the ligament, τRP = 1
ωmax
is the timescale associated with the growth rate. Lt0> π is
the ligament breakup criterion where L is the length of theligament, and t0 is the thickness of the ligament. All theligament that pinches off into droplets satisfies the lengthto width aspect ratio condition, i.e., the aspect ratio of theligament has to be greater than π for the ligament that breakup.This is shown in Fig. 15(b). This figure shows a complete setof 60 runs. If the aspect ratio of the ligament is greater than π,it breakups into droplets. On the contrary, if the aspect ratiois less than π, the ligament would stretch without breakup.
8
(a)
(b)
0.0 2.5 5.0 7.5 10.0[mm]
0
1
2
3
f()
Observational
Theoretical
0 2 4 6RT[ms]
0.0
0.1
0.2
0.3
0.4
f(RT)
Observational
Theoretical
Fig. 14. (a) Probability density function for the distance between the fingers. (b) Theprobability density function for the finger formation timescale.
t=0 t=0.5
t=1.0 t=1.5
0 20 40 60runs
5
10
15
l/d
l/d >
l/d<
l/d=
(a)
(b)
Fig. 15. (a) Sequence of images showing the Rayleigh Plateau breakup and the cor-responding time scale. (b) The ligament aspect ratio plotted for different experimentalruns depicting the Rayleigh Plateau breakup criterion.
(a)
(b)
0.00 0.25 0.50 0.75 1.00kt0
0
200
400
600
800
[s1]
t0 = 0.43mm
t0 =0.22mm
0 2 4 6RP
0.0
0.2
0.4
f(RP)
Theoretical
Experimental
Fig. 16. (a) Dispersion curve for the Rayleigh Plateau linear stability theory for differentligament thickness, (b) The probability density function for ligament breakup timescale
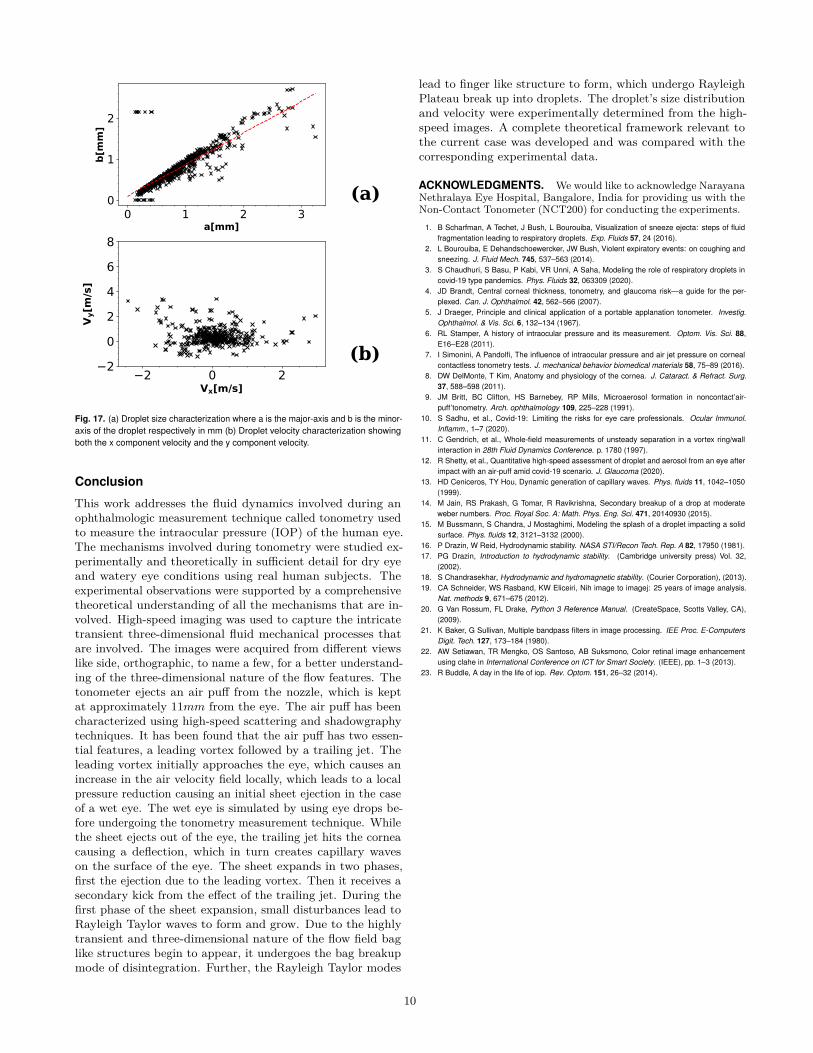
Fig. 16(a) shows the theoretical dispersion curve obtainedfrom the linear stability theory using the ligament thicknessobtained from the probability density function experimentally.The distribution was experimentally obtained by assumingthat the rim surrounding the expanding sheet has the samethickness as the ligament on an order of magnitude scale. Thisgives us an upper limit on the ligament thickness. The blackcurve represents a thickness of approximately 0.22mm, andthe red curve represents a thickness of 0.43mm. Both curvespeak at the same value of wavenumber, and the correspondingwavelength is approximately 3.93mm. However, the growthrate and the associated time scales are different. τRP is greaterfor the thicker ligament than the thinner ones. Fig. 16(b) de-picts the experimental and theoretical probability distributionfunction. The theoretical and the experimental curves peakat the same value of τRP corroborating the linear stabilityanalysis. The droplets from ligament breakups have a multi-tude of size distribution and velocity distribution. A boundingrectangle is used to calculate the shape of the droplet. Themajor axis and minor axis of the droplets were calculated fromthe bounding rectangle’s width and height. The droplets weretracked, and the velocities were calculated from the derivativesof the position. Fig. 17 summarizes the shape and the velocityof the droplets. Fig. 17(a) characterizes the shape of thedroplets. The droplets ejected out have a wide range of sizedistribution ranging from 0.2mm − 3mm. The droplets, ingeneral, are elliptical in nature. The minor-axis to the major-axis ratio of the droplets are approximately 0.8 on average.The droplets, on average, are elongated along the horizontalaxis. The droplet velocities are also distributed over a range.The components of the droplet velocities are shown in Figure17(b). On average, the droplets x component and y componentof the velocity are approximate 0.1m/s approximately.
9
(a)
(b)2 0 2
Vx[m/s]
2
0
2
4
6
8
Vy[m
/s]
0 1 2 3a[mm]
0
1
2
b[m
m]
Fig. 17. (a) Droplet size characterization where a is the major-axis and b is the minor-axis of the droplet respectively in mm (b) Droplet velocity characterization showingboth the x component velocity and the y component velocity.
Conclusion
This work addresses the fluid dynamics involved during anophthalmologic measurement technique called tonometry usedto measure the intraocular pressure (IOP) of the human eye.The mechanisms involved during tonometry were studied ex-perimentally and theoretically in sufficient detail for dry eyeand watery eye conditions using real human subjects. Theexperimental observations were supported by a comprehensivetheoretical understanding of all the mechanisms that are in-volved. High-speed imaging was used to capture the intricatetransient three-dimensional fluid mechanical processes thatare involved. The images were acquired from different viewslike side, orthographic, to name a few, for a better understand-ing of the three-dimensional nature of the flow features. Thetonometer ejects an air puff from the nozzle, which is keptat approximately 11mm from the eye. The air puff has beencharacterized using high-speed scattering and shadowgraphytechniques. It has been found that the air puff has two essen-tial features, a leading vortex followed by a trailing jet. Theleading vortex initially approaches the eye, which causes anincrease in the air velocity field locally, which leads to a localpressure reduction causing an initial sheet ejection in the caseof a wet eye. The wet eye is simulated by using eye drops be-fore undergoing the tonometry measurement technique. Whilethe sheet ejects out of the eye, the trailing jet hits the corneacausing a deflection, which in turn creates capillary waveson the surface of the eye. The sheet expands in two phases,first the ejection due to the leading vortex. Then it receives asecondary kick from the effect of the trailing jet. During thefirst phase of the sheet expansion, small disturbances lead toRayleigh Taylor waves to form and grow. Due to the highlytransient and three-dimensional nature of the flow field baglike structures begin to appear, it undergoes the bag breakupmode of disintegration. Further, the Rayleigh Taylor modes
lead to finger like structure to form, which undergo RayleighPlateau break up into droplets. The droplet’s size distributionand velocity were experimentally determined from the high-speed images. A complete theoretical framework relevant tothe current case was developed and was compared with thecorresponding experimental data.
ACKNOWLEDGMENTS. We would like to acknowledge NarayanaNethralaya Eye Hospital, Bangalore, India for providing us with theNon-Contact Tonometer (NCT200) for conducting the experiments.
1. B Scharfman, A Techet, J Bush, L Bourouiba, Visualization of sneeze ejecta: steps of fluidfragmentation leading to respiratory droplets. Exp. Fluids 57, 24 (2016).
2. L Bourouiba, E Dehandschoewercker, JW Bush, Violent expiratory events: on coughing andsneezing. J. Fluid Mech. 745, 537–563 (2014).
3. S Chaudhuri, S Basu, P Kabi, VR Unni, A Saha, Modeling the role of respiratory droplets incovid-19 type pandemics. Phys. Fluids 32, 063309 (2020).
4. JD Brandt, Central corneal thickness, tonometry, and glaucoma risk—a guide for the per-plexed. Can. J. Ophthalmol. 42, 562–566 (2007).
5. J Draeger, Principle and clinical application of a portable applanation tonometer. Investig.Ophthalmol. & Vis. Sci. 6, 132–134 (1967).
6. RL Stamper, A history of intraocular pressure and its measurement. Optom. Vis. Sci. 88,E16–E28 (2011).
7. I Simonini, A Pandolfi, The influence of intraocular pressure and air jet pressure on cornealcontactless tonometry tests. J. mechanical behavior biomedical materials 58, 75–89 (2016).
8. DW DelMonte, T Kim, Anatomy and physiology of the cornea. J. Cataract. & Refract. Surg.37, 588–598 (2011).
9. JM Britt, BC Clifton, HS Barnebey, RP Mills, Microaerosol formation in noncontact’air-puff’tonometry. Arch. ophthalmology 109, 225–228 (1991).
10. S Sadhu, et al., Covid-19: Limiting the risks for eye care professionals. Ocular Immunol.Inflamm., 1–7 (2020).
11. C Gendrich, et al., Whole-field measurements of unsteady separation in a vortex ring/wallinteraction in 28th Fluid Dynamics Conference. p. 1780 (1997).
12. R Shetty, et al., Quantitative high-speed assessment of droplet and aerosol from an eye afterimpact with an air-puff amid covid-19 scenario. J. Glaucoma (2020).
13. HD Ceniceros, TY Hou, Dynamic generation of capillary waves. Phys. fluids 11, 1042–1050(1999).
14. M Jain, RS Prakash, G Tomar, R Ravikrishna, Secondary breakup of a drop at moderateweber numbers. Proc. Royal Soc. A: Math. Phys. Eng. Sci. 471, 20140930 (2015).
15. M Bussmann, S Chandra, J Mostaghimi, Modeling the splash of a droplet impacting a solidsurface. Phys. fluids 12, 3121–3132 (2000).
16. P Drazin, W Reid, Hydrodynamic stability. NASA STI/Recon Tech. Rep. A 82, 17950 (1981).17. PG Drazin, Introduction to hydrodynamic stability. (Cambridge university press) Vol. 32,
(2002).18. S Chandrasekhar, Hydrodynamic and hydromagnetic stability. (Courier Corporation), (2013).19. CA Schneider, WS Rasband, KW Eliceiri, Nih image to imagej: 25 years of image analysis.
Nat. methods 9, 671–675 (2012).20. G Van Rossum, FL Drake, Python 3 Reference Manual. (CreateSpace, Scotts Valley, CA),
(2009).21. K Baker, G Sullivan, Multiple bandpass filters in image processing. IEE Proc. E-Computers
Digit. Tech. 127, 173–184 (1980).22. AW Setiawan, TR Mengko, OS Santoso, AB Suksmono, Color retinal image enhancement
using clahe in International Conference on ICT for Smart Society. (IEEE), pp. 1–3 (2013).23. R Buddle, A day in the life of iop. Rev. Optom. 151, 26–32 (2014).
10