dynamics of non‐structural carbohydrates in
TRANSCRIPT

495
Dynamics of non- structural carbohydrates in terrestrial plants: a global synthesis
Jordi Martínez-Vilalta,1,2,10 anna Sala,3 doloreS aSenSio,1 lucía Galiano,4,5 Günter HocH,6 Sara Palacio,7 Frida i. PiPer,8,9 and FranciSco lloret,1,2
1CREAF, Cerdanyola del Vallès, E-08193, Barcelona, Spain2Universitat Autònoma Barcelona, Cerdanyola del Vallès, E-08193, Barcelona, Spain
3Division of Biological Sciences, University of Montana, Missoula, Montana 59812 USA4Swiss Federal Research Institute WSL, CH-8903, Birmensdorf, Switzerland5Institute of Hydrology, University of Freiburg, Freiburg, D-79098 Germany
6Department of Environmental Sciences–Botany, University of Basel, 4056, Basel, Switzerland7Instituto Pirenaico de Ecología (IPE-CSIC), Avenida Nuestra Señora de la Victoria 16, 22700 Jaca, Spain
8Centro de Investigación en Ecosistemas de la Patagonia (CIEP), Simpson 471, Coyhaique, Chile9Instituto de Ecología y Biodiversidad, Las Palmeras 3425, Santiago, Chile
Abstract. Plants store large amounts of non- structural carbohydrates (NSC). While multi-ple functions of NSC have long been recognized, the interpretation of NSC seasonal dynamics is often based on the idea that stored NSC is a reservoir of carbon that fluctuates depending on the balance between supply via photosynthesis and demand for growth and respiration (the source–sink dynamics concept). Consequently, relatively high NSC concentrations in some plants have been interpreted to reflect excess supply relative to demand. An alternative view, however, is that NSC accumulation reflects the relatively high NSC levels required for plant survival; an important issue that remains highly controversial. Here, we assembled a new glob-al database to examine broad patterns of seasonal NSC variation across organs (leaves, stems, and belowground), plant functional types (coniferous, drought- deciduous angiosperms, winter deciduous angiosperms, evergreen angiosperms, and herbaceous) and biomes (boreal, temper-ate, Mediterranean, and tropical). We compiled data from 121 studies, including seasonal measurements for 177 species under natural conditions. Our results showed that, on average, NSC account for ~10% of dry plant biomass and are highest in leaves and lowest in stems, whereas belowground organs show intermediate concentrations. Total NSC, starch, and solu-ble sugars (SS) varied seasonally, with a strong depletion of starch during the growing season and a general increase during winter months, particularly in boreal and temperate biomes. Across functional types, NSC concentrations were highest and most variable in herbaceous species and in conifer needles. Conifers showed the lowest stem and belowground NSC concen-trations. Minimum NSC values were relatively high (46% of seasonal maximums on average for total NSC) and, in contrast to average values, were similar among biomes and functional types. Overall, although starch depletion was relatively common, seasonal depletion of total NSC or SS was rare. These results are consistent with a dual view of NSC function: whereas starch acts mostly as a reservoir for future use, soluble sugars perform immediate functions (e.g., osmoregulation) and are kept above some critical threshold. If confirmed, this dual func-tion of NSC will have important implications for the way we understand and model plant carbon allocation and survival under stress.
Key words: carbon storage; global synthesis; non-structural carbohydrates; non-structural carbon compounds; osmoregulation; plant carbon economy; seasonal dynamics; soluble sugars; source–sink imbalances; starch; stress responses; terrestrial plants.
introduction
Plants acquire carbon via photosynthesis and use most of it as substrate for metabolism (e.g., respiration) and to build structural biomass. A smaller fraction is retained in the form of non- structural carbon compounds (NCC), including non- structural carbohydrates (NSC: starch, soluble sugars, and, in some herbs and grasses, fructans),
and neutral lipids, which occur in large quantities only in some taxa. NCC pools are broadly referred to as storage because they support metabolism at night and a variety of plant functions during stressful periods when carbon assimilation is insufficient to meet demand (Chapin et al. 1990, Kozlowski 1992, Dietze et al. 2014). At any given point in time, carbon assimilation may be greater or lower than demand for plant functions (respiration, growth, etc.), resulting in periods of carbon surplus and deficit, respectively. Accordingly, the NCC pool (biomass × concentration) may increase or decrease. In
Ecological Monographs, 86(4), 2016, pp. 495–516© 2016 by the Ecological Society of America
Manuscript received 23 December 2015; revised 5 August 2016; accepted 23 August 2016. Corresponding Editor: Todd E. Dawson.
10 E-mail: [email protected]

496 Ecological Monographs Vol. 86, No. 4JORDI MARTÍNEZ- VILALTA ET AL.
the long term, plants will not survive if carbon supply via photosynthesis does not meet overall demands, and periods of carbon surplus must necessarily offset periods of carbon deficit. Despite their critical role in the plant carbon balance, our understanding of the dynamics, role and regulation of NCC storage in perennial wild plants remains limited (Dietze et al. 2014, Hartmann and Trumbore 2016) and, in many respects, it has not advanced much since the classical reviews by Chapin et al. (1990) and Kozlowski (1992).
Although, on an annual basis, net carbon flux to storage may be small relative to allocation to respiration and growth (but see Klein and Hoch 2015), storage is a critical plant function. On a daily basis, starch storage during the day supplies carbon for growth and respi-ration at night (Walter et al. 2005, Smith and Stitt 2007). In plants that seasonally shed their leaves, maintenance during leafless seasons necessarily relies on stored carbon (e.g., Barbaroux et al. 2003, Crone et al. 2009). In long- lived plants, storage is also important to cope with con-ditions that reduce carbon input via photosynthesis relative to demand, including shade, drought and distur-bances such as herbivory and fire (e.g., Canadell and López- Soria 1998, Bréda et al. 2006, Myers and Kitajima 2007, Palacio et al. 2008, Hartmann et al. 2013a, O’Brien et al. 2014, Piper and Fajardo 2014, Dickman et al. 2015).
Climate change is predicted to increase the frequency and severity of drought and the incidence of related biotic stress factors, such as insect pests and pathogens (McDowell et al. 2008, 2011, Paritsis and Veblen 2011, Gaylord et al. 2013, Oliva et al. 2014). Not surprisingly, due to the critical role of storage for survival under stress, these predicted changes have led to a recent renewed interest in NCC storage (particularly NSC), which is increasingly acknowledged as a key component in tree and ecosystem models (Sala et al. 2012, McDowell et al. 2013, Richardson et al. 2013, Dietze et al. 2014). Progress, however, is hampered by our limited understanding of the dynamics, role, and regulation of carbon storage. For instance, there is evidence that NSC concentrations in mature plants from very contrasted biomes, including arctic (Chapin and Shaver 1988), temperate (Hoch et al. 2003), and tropical (Würth et al. 2005) climates, tend to remain relatively high year round, regardless of seasonal fluctuations in climatic conditions, with minimum values being typically 30–60% of the seasonal maxima, at least in perennial organs (cf. previous references). Several, non- exclusive hypotheses have been proposed to explain this pattern: (1) plants at current atmospheric conditions store surplus carbon and are not carbon limited (Körner 2003); (2) a significant fraction of storage becomes sequestered over time and is not accessible (Millard et al. 2007); (3) relatively high NSC levels are required to ensure long- term survival and result from NSC storage being a strong sink in itself (relative to alternative demands; Sala et al. 2012, Wiley and Helliker 2012, Dietze et al. 2014). These alternative views underlie the broader question as to whether plant growth is limited by
carbon availability (Palacio et al. 2014, Körner 2015) and have profound consequences on how we understand and model growth and productivity (Fatichi et al. 2013).
Several aspects may contribute to the limited progress in our understanding of carbon storage dynamics in plants, besides the inherent complexity of the topic. Although intuitive, the definition of storage is difficult (Chapin et al. 1990). In the broadest sense, carbon storage may be defined as carbon that builds up in the plant and can be mobilized in the future to support biosynthesis for growth or other plant functions (Chapin et al. 1990). This definition includes all compounds that serve any cell function but that can be converted (recycled) to provide additional carbon sources. Therefore, with the exception of highly immobile carbon compounds such as cellulose and lignin, any other compound in a plant that can be degraded is, in theory, a storage compound, and any living tissue within the plant can be considered a storage organ (Spicer 2014). Although recycling of carbon (i.e., the reutilization of compounds that were initially invested in growth or defense) was thought to be unimportant rel-ative to that of nitrogen or phosphorous (Chapin et al. 1990), there is some evidence that hemicellulose in cell walls may be recycled and used as storage (Hoch 2007, Schädel et al. 2009).
The concentration of NSC, including starch (and/or fructans) and soluble sugars, is often used as a measure of storage. However, this use of NSC is problematic for several reasons (Hoch 2015). First, it ignores the storage role of lipids (e.g., Hoch et al. 2003), which, along with starch, are the only compounds synthesized exclusively for storage, with no other metabolic function. Second, and related to the first, NSC is a mixture of two fractions (starch and soluble sugars) with contrasted functions, whose inter- conversion at different time scales (Dietze et al. 2014) make their roles difficult to separate in practice. While starch is a purely storage compound for future use, soluble sugars perform a variety of immediate functions besides supporting new growth and demands for respiration and defense, including their role as inter-mediary metabolites, osmolytes, and substrates for transport (e.g., sucrose; Fig. 1). Indeed, together with other low molecular carbon compounds and inorganic ions, soluble sugars are involved in signaling (Gibson 2005), cold tolerance (Graham and Patterson 1982), turgor maintenance (Morgan 1984, Hummel et al. 2010), phloem transport (Savage et al. 2016), and, possibly, xylem repair (Salleo et al. 2004, Secchi and Zwieniecki 2011). While some of these functions may be associated with particular stresses (e.g., drought or cold tolerance), others may be critical under any situation. The distinction between immediate vs. future needs is important for pre-dictions of seasonal dynamics of NSC and its compo-nents. While the starch fraction may become severely depleted, the immediate metabolic functions of the soluble fraction require this pool to remain above the threshold necessary to carry these functions. The mag-nitude of this threshold is unknown, but if significant it

DYNAMICS OF NSC IN TERRESTRIAL PLANTSNovember 2016 497
could help explain the relative abundance of NSC. To the extent that strictly storage compounds also serve as a source of soluble sugars to perform immediate plant functions, plants are likely to prevent acute depletions of the NSC pool at all times.
Non- structural carbohydrates seasonal dynamics have often been interpreted in a context of source–sink activity, derived from the idea that “plants accumulate carbohy-drates during periods of excess production and deplete
them when demand for growth and respiration exceeds the rate of production” as proposed by Mooney (1972) and later by Kozlowski (1992). Although the nuances and complexities of source–sink relationships and mul-tiple functions of NSC have been duly acknowledged (e.g., the fact that many carbon compounds or activities, including storage, can be sources and sinks, depending on the organ and the specific conditions when they occur; Chapin et al. 1990, Hoch 2007), over time, the use of a
FiG. 1. Conceptual diagram showing the main roles and functions of different non- structural carbohydrate (NSC) fractions in different plant organs. SS designates soluble sugars, and SSNew indicates those soluble sugars that correspond to recently assimilated carbon.
Photosynthesis
SSNew
SS
RESERVOIRStarchFructans
CONSUMPTIONGrowthRespiration
NON-CONSUMPTION,IMMEDIATE USE
OsmoticMetabolic intermediates
RESERVOIRStarchFructans
CONSUMPTIONGrowthRespiration
RESERVOIRStarchFructans
CONSUMPTIONGrowthRespiration
EXPORT(Biomass loss and exudates)
SS
SS
EXPORT(Biomass loss)
EXPORT(Biomass loss)
Defense
Defense
Defense
NON-CONSUMPTION,IMMEDIATE USEOsmoticMetabolic intermediates
Tran
spor
t

498 Ecological Monographs Vol. 86, No. 4JORDI MARTÍNEZ- VILALTA ET AL.
simplified source–sink framework to interpret NSC dynamics has become common among plant ecologists and forest modelers. According to this framework, plants have a source (photosynthesis) and a number of sinks (growth, respiration, export, etc., but excluding storage), and NSC pools grow and shrink purely as a function of the balance between them (i.e., storage is not a regulated process in itself; see Dietze et al. 2014).
This simplified source–sink framework has led to some predictions. For instance, because deciduous species experience greater asynchrony between supply (restricted to the growing season) and demand (throughout the year and particularly strong during leaf flushing in early spring), seasonal fluctuations of NSC should be stronger in deciduous relative to evergreen species (Kramer and Kozlowski 1979, Chapin et al. 1990, Piispanen and Saranpää 2001). Likewise, seasonal NSC fluctuations should be stronger in seasonal climates, where accumu-lation during favorable periods supports carbon demands during less favorable times (Chapin et al. 1990, Piispanen and Saranpää 2001). However, data in the literature is not always consistent with these predictions. For instance, fluctuations of NSC are not necessarily stronger in deciduous than in evergreen species (Hoch et al. 2003, Palacio et al. 2007a, Richardson et al. 2013). These incon-sistencies point towards the need to carefully evaluate NSC seasonal dynamics in the context of all potential functions of its components.
The large variability in NSC seasonal dynamics in plants was captured in Kozlowski’s seminal review over 20 years ago (Kozlowski 1992), which provided inval-uable insight on when and where organs in woody plants acted as sources and sinks. However, a quantitative syn-thesis of patterns of seasonal variation among organs, plant functional types and climate was lacking, perhaps reflecting limited data (most available data were for tem-perate tree species) and statistical tools at the time. This leaves us with a voluminous case- specific literature from which it is difficult to draw general patterns of variation and their possible biological significance. Here we assembled a global database on seasonal dynamics of NSC concentrations in plants to examine patterns of variation as a function of organ (leaves, stems, and belowground), plant functional type (coniferous, drought- deciduous angiosperms, winter deciduous angi-osperms, evergreen angiosperms, and herbaceous) and biome (boreal, temperate, Mediterranean, and tropical). We refer specifically to total NSC (NSCT) as the sum of starch, fructans (when present), and soluble sugars, whereas we use NSC to refer generically to any of the fractions analyzed (NSCT, starch, or soluble sugars). These are the most commonly reported NCC in the liter-ature and for which most data is available. However, we recognize that other organic compounds (e.g., sugar, alcohols, lipids) are important in some species (see Discussion).
Our main goal is to explore broad patterns of seasonal NSC dynamics and their potential biological significance
in the general context of source–sink relationships but explicitly considering the potential functions of different NSC components (cf. Fig. 1). We hypothesize that:
1. The concentrations of NSC in different plant organs reflect their respective function and their role in whole-plant C dynamics (Fig. 1). Specifically, we expect (a) high concentrations of NSC (particularly soluble sugars) in leaves, where the proportion of lig-nified tissue is lower and where soluble sugars are important for osmoregulation, phloem loading and the sustained maintenance of metabolism; (b) gen-erally higher concentrations of starch in roots than in leaves reflecting a greater long-term storage role in the former; and (c) lower concentrations of NSC in stems, where the relative proportion of lignified and non-living tissues tends to be highest.
2. Average NSC concentrations and its fractions vary according to plant functional type and biome, although some of this variation may average out at relatively long (e.g., annual) time scales due to con-trasted seasonal dynamics (cf. next paragraph). Specifically, (a) NSC concentrations will be higher in herbaceous than woody species, reflecting their higher proportion of living, metabolically active tissues. Among woody species, we expect (b) higher overall concentrations of NSC in conifer foliage, in agreement with its known role in storage and cold tolerance (Kozlowski 1992). Among biomes, we expect (c) gen-erally lower NSC concentrations in tropical eco-systems (Körner 2003), as relatively lower climatic stress levels and high competition for light may result in proportionally higher C allocation to growth.
3. The concentration of NSC in plants varies seasonally showing consistent patterns within biomes and func-tional types. Seasonal oscillations (regular changes) may occur in all organs, but (a) their magnitude, par-ticularly in woody plants, will be lower in stems due to their generally larger pools (relative to demands; Körner 1994). Ultimately, NSC oscillations reflect the underlying environmental seasonality under which species live and, in particular, the temporal imbalance between assimilation, growth and stress responses (at different temporal scales). Thus, we expect (b) NSC levels to decline at the beginning of the growing season due to higher demand than supply, and increase towards the end of the growing season. In addition, (c) high levels of soluble sugars and low levels of starch will occur during particularly stressful periods (e.g., winter in boreal ecosystems, summer in the Mediterranean) and will be preceded by starch accumulation. In general, we expect (d) greater starch oscillations under situations with greater source–sink asynchronies such as in more sea-sonal environments (e.g., boreal).
4. Plants keep relatively high minimum NSC concentra-tions at all times. Specifically, we expect (a) relatively high and similar seasonal NSC minimums relative to

DYNAMICS OF NSC IN TERRESTRIAL PLANTSNovember 2016 499
maximums across biomes and functional types and (b) lower minimum levels (relative to seasonal max-imums) for starch than for soluble sugars, reflecting the longer-term storage role of starch but multiple, immediate functions of soluble sugars.
MetHodS
Literature searches
The literature on NSC is vast and covers many fields (plant ecology, food industry, forage, biofuels, to name just a few). In a first phase we conducted a search on the Web of Science (WoS, accessed 27 May 2012) looking for the following combination of words in any field of the papers: “(NSC OR TNC OR starch OR carbohydrate*) AND (plant* OR shrub* OR tree* OR seedling* OR sapling*) AND (seasonal* OR temporal*)”. To target papers that emphasized NSC dynamics, from the 2143 references obtained, we selected only those containing the words “(seasonal* OR temporal*) AND (NSC OR TNC OR starch OR carbohydrate*)” in the abstract or title, which reduced the number of references to 1226. We reviewed the abstracts of these 1226 papers and selected only those including seasonal NSC data on wild species measured under natural, field conditions. We included forest planta-tions but not orchard trees or cultivated plants because the latter have been subjected to centuries of artificial selection, with potential consequences on their carbon dynamics. These criteria resulted in a final list of 296 papers.
All individual NSC data points were extracted from the text, tables or figures of each study, in the latter case using the software TechDig (Version 2.0, Ronald B. Jones). In most studies, NSC concentrations were expr-essed as % or mg/g dry mass directly. Otherwise, whenever possible, values were converted to mg/g. When reported results were not in mg/g dry mass and conversion was not possible with the information in the paper, we attempted to contact the original authors for proper conversions. Ultimately, data that could not be expressed in mg/g dry mass was not included in the analyses. The exact compo-sition of the soluble sugar component varies depending on the method (Chow and Landhäusser 2004), although glucose, fructose, and sucrose are often the dominant sugars and are those most commonly measured. However, these potential differences did not alter our results (see Data analyses section). Reported values of starch (and or fructans) and soluble sugars were added up to estimate total NSC (thereafter NSCT) in studies in which this latter variable was not reported or where components other than starch (or fructans), and soluble sugars were measured.
Database construction
Whenever available, additional information was ext racted from the original studies regarding their
location (latitude, longitude, altitude, climate, community type, biome), type of study (observational or experi-mental), study duration, species, ontogenetic state (seedling, sapling, mature, cutting), organ (root, stem, leaves, buds, reproductive, mixed aboveground), organ type (fine or coarse roots, lignotuber, main or terminal stem, current or older leaves), tissue (bark, sapwood, heartwood, phloem, cortex, all), sampling month and year, measured NSC component (NSCT, soluble sugars, starch, other compounds) and detailed methods used during sample processing, extraction, and quantification. For studies involving experimental manipulations, we only considered results from unmanipulated controls, which were identified in experimental treatment cate-gories. In addition, to ensure good temporal coverage and reduce unwanted variability due to specific characteristics of the sampled material that were not well represented in our data set, we selected only data that fulfilled the fol-lowing criteria: (1) study duration was at least four months, (2) the same individuals or populations were measured at least three times spanning the length of the study, (3) plants were mature, (4) measurements were taken on leaves, stems, or belowground organs, (5) tissue was not bark, phloem, or cortex, (6) values reported were NSCT, starch/fructans, or soluble sugars, and (7) species were land plants (i.e., saltwater and freshwater species were not included). While the original database contained samples from seedlings, saplings, and adults, seedling and sapling data did not sufficiently cover the range of vari-ation among organs, functional types and biomes, and were not included in the final analyses.
All species names were checked against standard taxo-nomical nomenclature and species were assigned to broad functional types (coniferous, drought- deciduous angio-sperms, winter deciduous angiosperms, evergreen angio-sperms, and herbaceous) using the information provided in the original articles and searches in mainstream web databases, including The Plant List, Ency clopedia of Life, Global Species, Integrated Taxonomic Information Sys-tem, and Global Biodiversity Information Facility (all available online).11, 12, 13, 14, 15 We verified that all herba-ceous plants in the database are perennial. From the 296 studies identified in the initial search, 123 studies (including 177 species) matched our final criteria and were subse-quently used for all analyses. These studies covered boreal (12 studies), temperate (77 studies), Mediterranean (14 studies), and tropical biomes (18 studies), and included at least 15 species from each of the considered functional types (Appendix S1: Table S1, Appendix S2: Fig. S1). We only considered biomes for which we had sufficient data (e.g., the two studies in desert biomes were not con-sidered). All grasses from grasslands in mid latitudes were included in the temperate biome.
11 http://www.theplantlist.org/12 http://eol.org/13 http://www.globalspecies.org/14 http://www.itis.gov/15 http://www.gbif.org/

500 Ecological Monographs Vol. 86, No. 4JORDI MARTÍNEZ- VILALTA ET AL.
Our final analysis included three main explanatory var-iables: organ, functional type and biome. The variable organ had three basic levels: leaves, aboveground stems, thereafter referred to as stems, and belowground organs (including roots, bulbs, rhizomes and lignotubers). In some analyses, belowground organs were split between roots and primarily reserve organs. Although any living tissue in a plant can store starch and SS (i.e., serves as a storage organ to some degree) some belowground organs such as bulbs and lignotubers become specialized to pri-marily serve a “reserve” function (Chapin et al. 1990). For simplicity, we refer to these as “belowground reserve organs” throughout the text. All belowground organs (including reserve organs) were merged into a single “belowground” category in more complex models when the low sample size for belowground reserve organs did not allow testing for interactions with other variables (cf. Data analyses section). For grasses and some herbaceous plants, data is often reported for aboveground tissues rather than separately for leaves or stems. In these cases, we evaluated each case individually from visual images of each species. For rosette- like plants and tussock- like grasses, values for aboveground biomass were taken as leaves. A new aggregation variable, “context,” was created to include all different combinations of study, site, different levels of environmental conditions within a study or site (e.g., altitude), and organ type (e.g., different leaf cohorts or stem types). This variable was used in sta-tistical analyses to account for additional sources of var-iability that could affect the absolute value of reported NSC concentrations (cf. Data analyses section).
Before conducting the analyses, the month of the year for data pertaining to the Southern Hemisphere was changed to match the seasons in the Northern Hemisphere. Note that we use the term season in a general sense, using a mid- latitude meteorological definition in which spring begins on 1 March, summer on 1 June, autumn on 1 September, and winter on 1 December (or the comple-mentary dates for Southern Hemisphere locations). This definition is used mainly as a reference to describe general temporal patterns, and it is not necessarily related to the local phenological development of the study species at each site, which was not available for most studies.
Data analyses
We carried out three different types of analyses, all of them on three main response variables: soluble sugars (SS) concentration, starch concentration, and their sum (NSCT). Note that, for simplicity, we refer to starch, but the starch fraction includes fructans for species where this compound was reported.
Hypotheses 1 and 2 (average NSC differences across organs, biomes and functional types).—In a first set of analyses we focused on the absolute values of SS, starch, and NSCT concentrations. Data for different months were averaged by different combinations of species,
study, context, organ, biome, and functional type, and these combinations constituted the smallest experimental unit in our analyses. Three mixed- effects linear models (GLMM) were conducted for each response variable: the first model included only organ as fixed factor, the second included organ, functional type, and their inter-action, and the third included organ, biome, and their interaction. Our data set did not allow for simultaneous-ly testing functional type and biome effects (and their interaction), as many combinations of functional type and biome were not represented (Appendix S2: Fig. S2), reflecting the covariance between these two variables at the global scale. Species identity, study and context, the latter nested within study, were included as random fac-tors in all models.
Our analysis of NSC concentrations and its fractions relies on available published data. However, a recent study on the comparability of NSC measurements across laboratories concludes that NSC estimates for woody plant tissues may not be directly comparable (Quentin et al. 2015), which could affect our analyses of average NSC concentrations. We therefore tested whether methods used for starch and SS extraction and quantifi-cation (largely following the classification by Quentin et al. 2015) confounded our results (Appendix S3). Note, however, that results regarding methodological compar-isons per se have to be interpreted with caution because our study was not designed to test them.
Including a methodological variable improved the fit of the base model explained above in only four out of 27 cases (Table 1; see Appendix S3 for details). In each of these four cases, starch was the only response variable affected, and only by extraction methods (SS extraction in one case and starch extraction in three cases). The effect of starch extraction was always in the same direction, with acid extractions resulting in higher starch concentrations than enzymatic methods (P < 0.05 in all three cases; Appendix S3: Fig. S2). Although including SS extraction improved the biome model for starch, individual SS extraction methods did not significantly affect starch esti-mates (P > 0.05 for all pairwise comparisons; only water extractions of SS produced marginally higher starch esti-mates, P = 0.082; Appendix S3: Fig. S1). When including methodological effects improved the base model fit, we assessed whether results differed in any meaningful way from the base model. In three out of the four cases, model results were identical. Only in one case (the starch model including organ, functional type, and starch extraction as fixed factors) there was a minor difference (Appendix S3). In summary, results remained nearly identical when meth-odological variables were accounted for (i.e., they are not confounded by methodological effects) and, for sim-plicity, we opted to present the results using the base model while noting any minor significant differences in the results when accounting for methods.
Hypothesis 3 (seasonal dynamics).—In another set of analyses, we aimed at describing the seasonal dynamics

DYNAMICS OF NSC IN TERRESTRIAL PLANTSNovember 2016 501
of SS, starch, and NSCT concentrations using general-ized additive mixed models (GAMM). These models expand the GLMM structure to include semi- parametric terms so that the linear predictor incorporates nonlinear smooth functions of at least one covariate (Wood 2006). These models were applied to the raw measurements including all the individual data points from all select-ed studies meeting the criteria specified in the Database construction section (i.e., data were not averaged) and in-cluded a smooth term describing the temporal dynamics of the response variable as a function of month (using cu-bic splines as the smooth function; Wood 2006). The (ap-proximate) P value of this smooth term measures how likely it is that the splines that make up the term equal zero and, hence, can be used to assess the significance of seasonal variations. Two different GAMM models were fitted to each of the response variables. In the first one, organ, functional type, and their interaction were in-cluded as fixed factors, and a different temporal smooth function was fitted for each combination of organ and functional type (factor smooth interaction). In the sec-ond model, organ, biome, and their interaction were in-cluded as fixed factors, and a different temporal smooth function was also fitted for each combination of organ and biome. In all cases, the random part of the models included species identity, study, and context (the latter nested within study).
Hypothesis 4 (minimum NSC).—Finally, a last set of GLMM analyses was aimed at characterizing the mini-mum seasonal NSC values as a function of organ, func-tional type, and biome. Minimum values were calculated as a percentage of seasonal maximums for each NSC fraction and for each combination of species, study, con-text, organ, biome, and functional type. Three models were fit to each response variable (SS, starch and NSCT), with the exact same structure as the models for mean NSC described in Data analyses: Hypotheses 1 and 2 (i.e., including organ or organ × functional type or or-gan × biome as fixed factors and with the same random structure). In addition, minimum NSC concentrations (absolute values) were modeled as a function of maxi-
mum NSC and functional type for each organ and NSC fraction, to assess whether the relationship between min-imum and maximum NSC varied with functional type. A different model was fitted for each combination of NSC fraction and organ, using the same random structure as before (species crossed with context nested within study).
All analyses were conducted with the software R (v. 3.1; the R Foundation for Statistical Computing, Vienna, Austria) using the packages lme4 (GLMM) and gamm4 (GAMM). NSC, starch, and soluble sugar concentra-tions were not normally distributed and were square- root transformed before conducting the analyses. Percentage minimum values required normalization (square- root transformation) only for starch. In all cases, random effects were assumed to follow a normal distribution with zero mean. The residuals of all reported models were approximately normally distributed and showed no obvious pattern. Significance for all statistical analyses was accepted at α = 0.05. Linear hypothesis testing in GLMM was conducted using the function glht in package multcomp. Coefficients of determination (marginal and conditional R2) were calculated using the r.squaredGLMM function (MuMIn package; Nakagawa and Schielzeth 2013).
reSultS
Hypothesis 1: Mean NSC variation among organs
On average, NSCT concentrations were higher in leaves (144 ± 10 mg/g; model estimated mean ± SE) than below-ground (106 ± 8 mg/g) and in belowground organs than in stems (70 ± 7 mg/g; P < 0.05 in both cases). Starch concentrations were similar in leaves (64 ± 6 mg/g) and belowground (71 ± 7 mg/g) and significantly higher in these two organs than in stems (33 ± 5 mg/g; P < 0.05). Finally, results for SS concentrations were similar to those for NSCT, with leaves (70 ± 5 mg/g) > belowground (42 ± 4 mg/g) > stem (34 ± 3 mg/g) (P < 0.05 in both cases). These mixed models explained a large fraction of the overall variance in the data (conditional R2 = 0.88, 0.83, and 0.90 for NSCT, starch, and SS, respectively), but the
table 1. P values of the comparison between the base models of non- structural carbohydrates (NSC) as a function of organ, biome, and functional type (without explicitly considering methodological effects) and the same models including a methodological variable as fixed effect.
Model +SS extraction +SS quantification +Starch extraction +Starch quantification
NSCT-Organ 0.095 0.177 0.157 0.063NSCT-Organ × Biome 0.159 0.082 0.146 0.051NSCT-Organ × FT 0.156 0.218 0.209 0.055SS-Organ 0.079 0.161 NA NASS-Organ × Biome 0.236 0.075 NA NASS-Organ × FT 0.290 0.064 NA NAStarch-Organ 0.077 NA 0.011* 0.754Starch-Organ × Biome 0.029* NA 0.041* 0.911Starch-Organ × FT 0.129 NA 0.009* 0.659
Notes: Different columns correspond to different methodological variables. P < 0.05 (marked with an asterisk) indicates a significant improvement due to the inclusion of the corresponding methodological variable (see Appendix S3 for further details). SS, soluble sugars; FT, functional type; NA, not evaluated.

502 Ecological Monographs Vol. 86, No. 4JORDI MARTÍNEZ- VILALTA ET AL.
contribution of organ, the fixed factor, was relatively small (marginal R2 = 0.10–0.16), implying that a large fraction of the variance was explained by the random part of the models (attributable to differences among species, sites, and conditions within sites).
When belowground reserve organs, such as bulbs and lignotubers, were considered as a separate category instead of being included in the belowground class (see Methods: Database construction), the results illustrated high NSCT concentrations in these reserve organs, particularly for starch (Fig. 2). Note that starch and soluble sugars do not necessarily add up to NSCT because not all studies report the three components (cf. Appendix S2: Fig. S2).
Hypothesis 2: Mean NSC variation among functional types and biomes
The variance explained by the fixed part of the model increased substantially when including the interaction organ × functional type (marginal R2 = 0.22–0.27; Appendix S2: Table S1). For all organs, NSCT and its fractions were generally higher in herbaceous than in woody species (Fig. 3; Appendix S2: Table S1). In leaves and belowground, starch concentrations were higher in herbaceous species than in any other functional type, but no significant difference was found between other func-tional types. In stems, starch concentrations were lower in conifers than in any other functional type (with the exception of herbaceous species when methodological effects were explicitly accounted for; cf. Appendix S3). Soluble sugar concentrations belowground were higher in herbaceous species than in any other functional type, whereas no significant difference was found between
other functional types. In leaves and stems, SS concentra-tions were again highest in herbs, but the differences were only significant with respect to leaves of evergreen and drought- deciduous species and to conifer stems. Among woody species, conifers had the highest starch, SS, and NSCT concentrations in leaves, although the differences with other functional types were not statistically signif-icant. In general, differences in NSCT mirrored the main patterns observed for starch and SS, with conifers having significantly lower NSCT values than any other func-tional type in stems and belowground organs (Fig. 3; Appendix S2: Table S1).
The explanatory power of biome was lower than for functional type (marginal R2 = 0.12–0.24 for the model including organ × biome interactions; Appendix S2: Table S2). Consistent with this, differences in average starch and SS concentrations were greater among func-tional types than among biomes (Fig. 4). Mean starch concentrations did not differ among biomes for any organ. Soluble sugars in leaves were higher in boreal and temperate biomes than in tropical ones, whereas Mediterranean systems showed intermediate values. In stems and belowground, SS were similar among biomes. Differences in NSCT among biomes were similar to those reported for SS (Fig. 4; Appendix S2: Table S2). Because herbaceous species show distinctive patterns and dif-ferent representation across biomes, we repeated the analyses by excluding herbaceous species. Results remained similar in most cases, with the following excep-tions: starch concentrations in stems were significantly higher in tropical than in boreal or temperate ecosystems; and NSCT concentrations in stems and belowground were higher in tropical than in temperate biomes
FiG. 2. Box- and- whisker plot of NSC concentrations as a function of organ and fraction (soluble sugars, starch, and total NSC). “Reserve” refers to belowground reserve organs such as bulbs and lignotubers. Thick horizontal bars (black) show the median, whereas fine dashed lines indicate the mean. The upper and lower “hinges” correspond to the first and third quartiles (the 25th and 75th percentiles), and whiskers extend from the hinge to the highest (or lowest) value that is within 1.5 × IQR of the hinge. All these statistics are computed across species by context combinations (context corresponds to different combinations of study, site, and specific measurement conditions; see Methods: Database construction). Different letters indicate significant differences between organs for a given NSC fraction (GLMM models).

DYNAMICS OF NSC IN TERRESTRIAL PLANTSNovember 2016 503
(P < 0.05, results not shown), whereas all other biomes showed intermediate values.
In the tropical biome, where sample size was similar for evergreen and drought- deciduous species (Appendix S2: Table S2), we conducted a separate analysis to compare these two functional types. The results of the corre-sponding models showed similar concentrations of SS in the three studied organs between the two functional groups. However, relative to evergreen species, drought- deciduous species had higher NSCT and starch concen-trations belowground, and higher NSCT in stems (P < 0.05, results not shown).
Hypothesis 3i: Seasonal NSC patterns across functional types
All functional types considered in this study showed significant seasonal oscillations in at least one organ for NSCT, starch and SS (Fig. 5). The largest seasonal varia-tions were observed for starch concentrations in leaves and belowground organs for herbaceous and conifer species. Although the amplitude of seasonal variations of
the three NSC fractions was generally lower in stems rel-ative to leaves and belowground organs, such lower var-iation was highly consistent, resulting in statistically significant seasonal variations in stems for all functional types, which were not observed for the other two organs.
In conifers, seasonal patterns of starch and SS were distinctly different from those of other functional groups, and were characterized by opposite temporal dynamics for starch and SS in leaves: a very sharp starch peak in late spring–early summer coincided with the seasonal minimum for SS (Fig. 5). The temporal dynamics of NSCT in leaves were similar to those of starch. Starch levels in conifers peaked belowground first (~early spring), then in stems (mid spring) and finally in leaves (late spring–early summer). Soluble sugars belowground and in stems were less variable, with a hint of a seasonal minimum around late spring–early summer in stems.
Evergreen angiosperm species showed a maximum in starch levels in leaves around late spring and a minimum belowground later in the season (late summer–early fall). Soluble sugars only showed seasonal variation in stems, with a minimum around late spring–early summer, which
FiG. 3. Box- and- whisker plot of NSC concentrations as a function of functional type, organ, and fraction (soluble sugars, starch, and total NSC). Thick horizontal bars (black) show the median, whereas fine dashed lines indicate the mean. The upper and lower “hinges” correspond to the first and third quartiles (the 25th and 75th percentiles), and whiskers extend from the hinge to the highest (or lowest) value that is within 1.5 × IQR of the hinge. All these statistics are computed across species by context combinations (context corresponds to different combinations of study, site, and specific measurement conditions; see Methods: Database construction). Different letters indicate significant differences between functional types for a given organ and NSC fraction (GLMM models). Note that when the effect of starch extraction was included, starch concentrations in the stems of herbaceous species were no longer significantly different from those of conifer stems; that is, the letter code corresponding to herbaceous species in the central panel of the figure would be “AB” instead of “B” (cf. Appendix S3). Abbreviations: C, conifer; E, evergreen; DD, drought deciduous; WD, winter deciduous; H, herbaceous.

504 Ecological Monographs Vol. 86, No. 4JORDI MARTÍNEZ- VILALTA ET AL.
was also mirrored in the NSCT patterns. Drought- deciduous species showed low seasonal variation in starch levels, with a seasonal minimum apparent only in stems (late spring–early summer). Similar temporal pat-terns were observed for SS and NSCT in stems, although the minimum occurred slightly earlier, roughly coin-ciding with a NSCT peak belowground. In leaves, a clear peak in SS concentrations was observed around mid-summer, which was mirrored in the NSCT patterns. Very similar temporal patterns were obtained when the few non- tropical, drought- deciduous species were excluded from the analyses (results not shown). Comparisons of seasonal dynamics for evergreen and drought- deciduous species in tropical systems, where sample sizes for the two groups were similar (Appendix S2: Table S2), were also generally consistent with the previous patterns, although there were slightly more pronounced seasonal oscilla-tions in drought- deciduous species, particularly for SS in leaves (Appendix S2: Fig. S3).
Winter- deciduous species showed a maximum in starch concentrations around late summer for belowground organs and stems (Fig. 5). Soluble sugars increased during spring and early summer in leaves, when values were lowest in stems and belowground. The seasonal
patterns for NSCT concentrations in winter deciduous species were broadly similar to those for SS, except that the variation of NSCT in leaves was not significant, and the respective maximum and minimum peaks were somewhat offset in stems and belowground. Note that the presence of leaves’ data in the summer and winter for drought- and winter- deciduous species, respectively, is due to the pooling of different studies with slightly dif-ferent phenologies that end up covering the whole season. Model predictions for these months are thus based on limited data and should be considered with caution.
Finally, herbaceous species showed a marked peak in starch concentrations belowground around late summer–early fall, and a minimum in SS around late spring–early summer in this same organ, which was reflected in NSCT levels (Fig. 5). Soluble sugar levels followed a two- peak pattern (~spring and ~fall) in leaves and stems. In leaves, this pattern was accompanied by large and opposite oscil-lations in starch.
Hypothesis 3ii: Seasonal NSC patterns across biomes
Seasonal oscillations of starch and SS were significant for all organs only in boreal and temperate biomes. The
FiG. 4. Box- and- whisker plot of NSC concentrations as a function of biome, organ, and fraction (soluble sugars, starch, and total NSC). Thick horizontal bars (black) show the median, whereas fine dashed lines indicate the mean. The upper and lower “hinges” correspond to the first and third quartiles (the 25th and 75th percentiles), and whiskers extend from the hinge to the highest (or lowest) value that is within 1.5 × IQR of the hinge. All these statistics are computed across species by context combinations (context corresponds to different combinations of study, site, and specific measurement conditions; see Methods: Database construction). Different letters indicate significant differences between biomes for a given organ and NSC fraction (GLMM models). Abbreviations: Bor, Boreal; Tem, Temperate; Med, Mediterranean; Tro, Tropical.

DYNAMICS OF NSC IN TERRESTRIAL PLANTSNovember 2016 505
amplitude of the oscillations in these biomes was largest for starch, and particularly noticeable in leaves. In cases where Mediterranean or tropical biomes also had signif-icant oscillations, the magnitude of such oscillation was generally lower than those observed for boreal and tem-perate ecosystems (Fig. 6).
Boreal ecosystems showed contrasting temporal dyn-amics for starch and SS, consistent with the patterns for conifers (Fig. 6). In leaves, stems and belowground organs, starch peaked around late spring–early summer, mid spring to late summer, and midsummer, respectively; whereas SS were lowest around late spring to midsummer in all organs. Temperate biomes were characterized by maximum starch concentrations towards late spring–early summer, particularly in leaves, coinciding with minimum levels of SS in all organs (Fig. 6). These patterns resulted in NSCT peaking around late spring in leaves, and showing a minimum around the same time in stems and belowground. Starch in belowground organs of tem-perate species showed a complex pattern with three peaks around early spring, midsummer, and autumn, probably due to the combination of different functional types.
Mediterranean ecosystems were characterized by low seasonal variability in starch and SS (Fig. 6). Soluble sugars showed significant patterns in all organs, with a
peak around midsummer. NSCT also showed seasonal variability belowground, with a minimum in spring and a maximum in late summer. Finally, tropical systems showed relatively low seasonal variability, although not as low as Mediterranean ones (Fig. 6). The most notable patterns were an increase of SS from early to late spring in leaves, a U- shaped seasonal pattern for all fractions belowground and for starch and soluble sugars in stems, and a minimum NSCT peak in late spring–early summer in stems. Overall, seasonal patterns for all biomes remained qualitatively similar if herbs were excluded from the analyses (i.e., only woody species were con-sidered), except for a conspicuous early spring peak of NSCT in belowground organs of tropical species (Appendix S2: Fig. S4).
Hypothesis 4: Minimum NSC values
Seasonal minimum and maximum concentrations of NSCT, starch, and SS were positively related, regardless of the organ or NSC fraction being considered, and this relationship was generally similar among functional types (Fig. 7). The only exceptions were NSCT and SS in leaves and SS in stems of drought- deciduous species, where there was no relationship between minimum and maximum
FiG. 5. Seasonal variation (centered smooths, square- root [sqrt] transformed; measured as mg/g dry mass) of NSC concentrations as a function of month for different functional type (columns) and organ (rows) combinations, according to the fitted GAMM models (see Methods: Data analyses). Three NSC fractions (total NSC [NSCT], starch, soluble sugars [SS]) are shown in each panel. Shaded areas around the contour plot for each estimate correspond to ±SE. In each panel, asterisks indicate that the smooth term is significant (at *P < 0.05, **P < 0.01, or ***P < 0.001 for NSCT/Starch/SS, in this order; ns, not significant). Seasons are indicated by a colored bar in the x- axis of each panel: blue, winter; green, spring; yellow; summer; orange, autumn. For Southern Hemisphere data, the month of the year was changed to match the seasons in the Northern Hemisphere. Abbreviations: C, conifer; E, evergreen; DD, drought deciduous; WD, winter deciduous; H, herbaceous.

506 Ecological Monographs Vol. 86, No. 4JORDI MARTÍNEZ- VILALTA ET AL.
concentrations (Fig. 7). Despite substantial seasonal var-iation in NSC concentrations (cf. previous section), minimum NSC values, defined as a percentage of the sea-sonal maximum, were relatively high, in most cases between 30% and 50% of seasonal maxima (Figs. 8–10). A histogram of minimum NSC values as a function of organ and fraction showed clearly that starch was the only fraction for which seasonal depletion was common (particularly in leaves and stems, where a substantial proportion of min(starch) ~0 was observed; Fig. 8).
Mixed models indicated similar minimum NSCT across organs (overall average = 46% ± 2%), regardless of whether belowground reserve organs were considered a different category or were included in the belowground class. Minimum starch was higher in belowground reserve organs (40% ± 6%) than in stems (22% ± 3%) or leaves (19% ± 3%) (P < 0.05), whereas roots showed interme-diate values. For SS, minimum values were highest in leaves (47% ± 2%), although differences were only signif-icant with regards to stems (37% ± 2%) (P < 0.05).
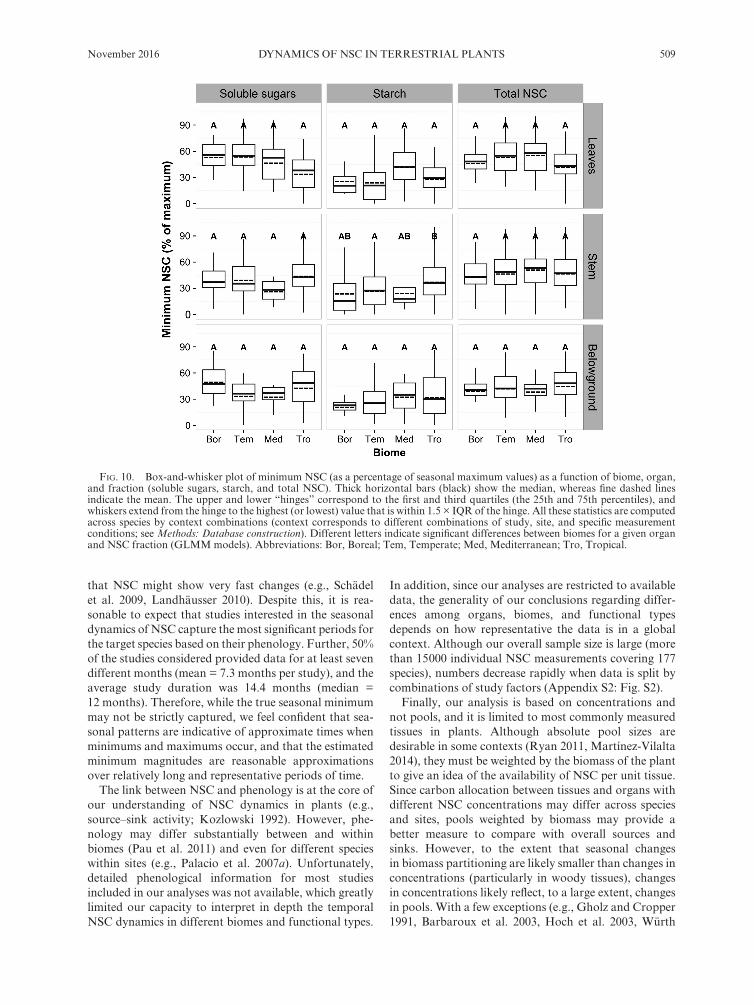
In general, minimum NSC (NSCT, starch or SS) values varied much less among functional types and biomes than mean NSC, and the variance explained by mixed models was always lower for minimum NSC (compare Appendix S2: Tables S3–S4 with Tables S1–S2; and Figs. 9–10 with Figs. 3–4). Minimum starch did not differ
among functional types for any organ (Fig. 9). Across biomes, minimum starch only differed in stems, being higher in tropical than in temperate ecosystems, whereas Mediterranean and boreal biomes had intermediate values (Fig. 10). Minimum SS did not differ among func-tional types or biomes for any organ. Finally, minimum NSCT did not differ among biomes. Among functional types, only stems of winter deciduous and evergreen species had significantly higher minimum NSCT than herbaceous species (Fig. 9).
diScuSSion
Overall, our results indicate that NSC seasonal dynamics respond to temporal imbalances between carbon uptake (photosynthesis) and demands for growth and respiration. However, they also show that these imbalances are most likely not sufficient to explain sea-sonal patterns of NSC concentrations in different organs, plant functional types, and biomes (Sala et al. 2012, Dietze et al. 2014). Predictions from a simplified source–sink framework that does not account for storage (in itself) as a potentially regulated process and for multiple functions of NSC were not fully met (see Introduction for a detailed account of this framework). For instance, sea-sonal oscillations of NSC concentrations were not
FiG. 6. Seasonal variation (centered smooths, square- root transformed; measured as mg/g dry mass) of NSC concentrations as a function of month for different biome (columns) and organ (rows) combinations, according to the fitted GAMM models (see Methods: Data analyses). Three NSC fractions (total NSC, starch, soluble sugars [SS]) are shown in each panel. Shaded areas around the contour plot for each estimate correspond to ±SE. In each panel, asterisks indicate that the smooth term is significant (at *P < 0.05, **P < 0.01, or ***P < 0.001 for NSCT/Starch/SS, in this order; ns, not significant). Seasons are indicated by a colored bar in the x- axis of each panel: blue, winter; green, spring; yellow; summer; orange, autumn. For Southern Hemisphere data the month of the year was changed to match the seasons in the Northern Hemisphere.

DYNAMICS OF NSC IN TERRESTRIAL PLANTSNovember 2016 507
necessarily greater in deciduous relative to evergreen woody species (Fig. 5), or in more seasonal climates rel-ative to less seasonal ones (Fig. 6). Importantly, we found relatively high and consistent minimum seasonal NSC levels (relative to maximums) regardless of biome and functional type (Figs. 9 and 10). The reservoir function of storage was supported by frequent starch depletion. In contrast, soluble sugars were seldom depleted (Fig. 8), suggesting that this NSC fraction serves important imme-diate physiological functions other than long- term carbon storage. Although the multiple functions of dif-ferent NSC fractions and the regulation of NSC levels beyond a simple balance between carbon uptake and demands for growth and respiration have been acknowl-edged in the past (e.g., Chapin et al. 1990), our study evi-dences that such functions occur across organs, functional types and biomes. These ideas are yet to be fully inte-grated into our interpretation and modeling of NSC dynamics (Dietze et al. 2014).
Caveats/limitations
Although we specifically tested that differences in average NSC and its fractions among organs, func-ti onal types and biomes were not confounded by
FiG. 7. Minimum NSC concentration as a function of the seasonal maximum values, for different organs and fractions (soluble sugars, starch, and total NSC; measured as mg/g dry mass). Each dot corresponds to a different species by context combination (context corresponds to different combinations of study, site, and specific measurement conditions; see Methods: Database construction). Colors indicate different functional types. Simple linear regressions are shown for each functional type. All values are square- root transformed to ensure normality. Abbreviations: C, conifer; E, evergreen; DD, drought deciduous; WD, winter deciduous; H, herbaceous.
FiG. 8. Histogram of minimum NSC (as a percentage of seasonal maximum values) for different organs and NSC fractions (soluble sugars, starch, and total NSC). Counts correspond to the number of different species by context combinations in each bin.

508 Ecological Monographs Vol. 86, No. 4JORDI MARTÍNEZ- VILALTA ET AL.
methodological artifacts (see Appendix S3), the quantifi-cation of NSC and its fractions remains highly problematic (Quentin et al. 2015). Therefore, the average values given here should be taken with caution until future tests can be done with a resolved and reliable methodology that reduces experimental variability. However, and most importantly, Quentin et al. (2015) showed that relative differences among samples are reasonably consistent within and between laboratories (more so for starch). Since we ana-lyzed relative values within individual studies (see Methods: Data analyses), results pertaining to seasonal dynamics and seasonal minima should also be robust against methodo-logical artifacts related to different extraction or quantifi-cation techniques, as well as more subtle laboratory effects. In addition, “study” was included as a random factor in all GLMM and GAMM models, thus accounting for method-ological variability among studies.
Another important consideration is that the compounds analyzed in this study (starch, fructans, and soluble sugars) are those most routinely measured, but they are not the only carbon storage compounds in plants. For instance, in some members of the Pinaceae and some angiosperm tree species like Tilia, neutral lipids can comprise almost half of the total
non- structural mobile carbon pool (Hoch and Körner 2003, Hoch et al. 2003). These compounds are equivalent to starch in the sense that they are synthesized primarily for storage purposes, with no other known function (Chapin et al. 1990). In addition, certain species accumulate large quan-tities of other compounds not assessed in this study (e.g., sugar alcohols; Hoch et al. 2003, Arndt et al. 2008). Therefore, interpretation of the results pertains to NSC, measured only as soluble sugars and starch (or fructans). The degree to which seasonal patterns across functional types and biomes would change if all storage compounds were included in the analysis is not known, although pre-vious research in temperate trees suggests that this effect may be relatively small, at least for lipids (Hoch et al. 2003). Unfortunately, storage compounds other than NSC have not been studied for most plant species.
Our criterion for selection of studies was that they reported at least three measurements over a minimum period of four months. Such criterion was used as a com-promise to capture as much temporal variability and data as possible. However, the degree to which seasonal min-imums in our analysis reflect a true seasonal (or longer term) minimum is not known, particularly considering
FiG. 9. Box- and- whisker plot of minimum NSC (as a percentage of seasonal maximum values) as a function of functional type, organ, and fraction (soluble sugars, starch, and total NSC). Thick horizontal bars (black) show the median, whereas fine dashed lines indicate the mean. The upper and lower “hinges” correspond to the first and third quartiles (the 25th and 75th percentiles), and whiskers extend from the hinge to the highest (or lowest) value that is within 1.5 × IQR of the hinge. All these statistics are computed across species by context combinations (context corresponds to different combinations of study, site, and specific measurement conditions; see Methods: Database construction). Different letters indicate significant differences between functional types for a given organ and NSC fraction (GLMM models). Abbreviations: C, conifer; E, evergreen; DD, drought deciduous; WD, winter deciduous; H, herbaceous.
DYNAMICS OF NSC IN TERRESTRIAL PLANTSNovember 2016 509
that NSC might show very fast changes (e.g., Schädel et al. 2009, Landhäusser 2010). Despite this, it is rea-sonable to expect that studies interested in the seasonal dynamics of NSC capture the most significant periods for the target species based on their phenology. Further, 50% of the studies considered provided data for at least seven different months (mean = 7.3 months per study), and the average study duration was 14.4 months (median = 12 months). Therefore, while the true seasonal minimum may not be strictly captured, we feel confident that sea-sonal patterns are indicative of approximate times when minimums and maximums occur, and that the estimated minimum magnitudes are reasonable approximations over relatively long and representative periods of time.
The link between NSC and phenology is at the core of our understanding of NSC dynamics in plants (e.g., source–sink activity; Kozlowski 1992). However, phe-nology may differ substantially between and within biomes (Pau et al. 2011) and even for different species within sites (e.g., Palacio et al. 2007a). Unfortunately, detailed phenological information for most studies included in our analyses was not available, which greatly limited our capacity to interpret in depth the temporal NSC dynamics in different biomes and functional types.
In addition, since our analyses are restricted to available data, the generality of our conclusions regarding differ-ences among organs, biomes, and functional types depends on how representative the data is in a global context. Although our overall sample size is large (more than 15 000 individual NSC measurements covering 177 species), numbers decrease rapidly when data is split by combinations of study factors (Appendix S2: Fig. S2).
Finally, our analysis is based on concentrations and not pools, and it is limited to most commonly measured tissues in plants. Although absolute pool sizes are desirable in some contexts (Ryan 2011, Martínez- Vilalta 2014), they must be weighted by the biomass of the plant to give an idea of the availability of NSC per unit tissue. Since carbon allocation between tissues and organs with different NSC concentrations may differ across species and sites, pools weighted by biomass may provide a better measure to compare with overall sources and sinks. However, to the extent that seasonal changes in biomass partitioning are likely smaller than changes in concentrations (particularly in woody tissues), changes in concentrations likely reflect, to a large extent, changes in pools. With a few exceptions (e.g., Gholz and Cropper 1991, Barbaroux et al. 2003, Hoch et al. 2003, Würth
FiG. 10. Box- and- whisker plot of minimum NSC (as a percentage of seasonal maximum values) as a function of biome, organ, and fraction (soluble sugars, starch, and total NSC). Thick horizontal bars (black) show the median, whereas fine dashed lines indicate the mean. The upper and lower “hinges” correspond to the first and third quartiles (the 25th and 75th percentiles), and whiskers extend from the hinge to the highest (or lowest) value that is within 1.5 × IQR of the hinge. All these statistics are computed across species by context combinations (context corresponds to different combinations of study, site, and specific measurement conditions; see Methods: Database construction). Different letters indicate significant differences between biomes for a given organ and NSC fraction (GLMM models). Abbreviations: Bor, Boreal; Tem, Temperate; Med, Mediterranean; Tro, Tropical.

510 Ecological Monographs Vol. 86, No. 4JORDI MARTÍNEZ- VILALTA ET AL.
et al. 2005, Gough et al. 2009), total NSC pools (and their seasonal dynamics) in woody plants are rarely reported in the literature. In fact, an analysis focusing on seasonal pool dynamics would require repeated and simultaneous measurements of biomass fractions, including roots, which is practically unfeasible in mature woody plants.
Hypothesis 1: Average NSC concentrations are higher in leaves and belowground organs
Although our models explained a large proportion of the variance in average NSC values, the variability explained by fixed factors (organ, functional type, biome) was relatively low. Among those, organ had the highest contribution to explained variance and biome the lowest. In agreement with our initial hypothesis, the concen-tration of NSC and its fractions in different organs (Fig. 2) was consistent with their respective functions. Concentrations were highest in leaves and belowground reserve organs, and lowest in stems, with intermediate values in roots. High concentrations of NSCT and, par-ticularly, SS in leaves are consistent with their role as the main sources of carbohydrates, and likely reflect their high metabolic rates, high concentrations of interme-diary metabolites, and high proportion of living cells requiring turgor maintenance (Sala et al. 2012, Sala and Mencuccini 2014). Both leaf and root NSC concentra-tions were high relative to stems, where a higher pro-portion of tissue is lignified or non- living. In roots, whose osmotic and metabolic demands are intermediate, SS and NSCT concentrations were also intermediate. Note, however, that differences in SS between leaves, stems, and roots also reflect the fact that phloem tissue, where the SS component is likely high, is included in leaves but not necessarily in roots and stems. The results of our global synthesis show that starch concentrations were as high in roots as in leaves, and highest in belowground reserve organs such as bulbs and lignotubers, general-izing previous results from specific case studies (e.g., Brocklebank and Hendry 1989, Canadell and López- Soria 1998, Pratt et al. 2014).
Hypotheses 2: Highest NSC is found in herbaceous species and conifer needles,
with little variation across biomes
As hypothesized, herbaceous species generally showed higher concentrations of NSCT, SS, and starch than woody species, although differences were not always sta-tistically significant (Fig. 3). This result probably reflects the lower proportion of lignified tissue in herbs and it is consistent with studies comparing herbs, graminoids, and shrubs from the Arctic tundra (Chapin and Shaver 1988) and herbs, shrubs, and trees from cold temperate to tropical forests in China (Li et al. 2016). In our case, differences were particularly high in belowground organs, likely because, in many herbs, roots are the only organ that remains during unfavorable periods. On average,
herbaceous plants tend to have higher leaf mass fraction (Poorter et al. 2012) and higher specific leaf area, nitrogen concentration in leaves, assimilation, and respiration rates (in leaves and roots) than woody species (Wright et al. 2004, Reich et al. 2008, Kattge et al. 2011). Larger supply (assimilation) and demand (growth, respiration) relative to total pools of stored carbon (smaller in herbs relative to woody plants) likely also explain why seasonal NSC oscillations are larger in herbs than in woody species (Fig. 5).
Along with herbs, conifer foliage exhibited the highest average NSC concentration, even though differences were not statistically significant with respect to all other functional types (Fig. 3). The role of evergreen conifer foliage as an important storage organ has been recog-nized previously (Li et al. 2002, Hoch et al. 2003). The fact that conifer stems and belowground organs have lower NSC compared to other functional types is likely associated with the lower amount of parenchyma in conifer sapwood relative to angiosperm species (Spicer 2014, Morris et al. 2016, Plavcová et al. 2016). It has been hypothesized that these lower NSC concentrations in conifer sapwood may result in lower capacity to refill embolized xylem conduits (Johnson et al. 2012) and, thus, explain the wider hydraulic safety margins in conifers (Choat et al. 2012). However, xylem refilling remains a highly controversial issue (Cochard and Delzon 2013) and further research is needed to elucidate the link (if any) between low NSC and wide hydraulic safety margins in conifer xylem.
Overall, we found few significant differences in average NSC, starch, and SS concentrations among biomes (Fig. 4). NSC values, however, were significantly higher in leaves of temperate species relative to Mediterranean or tropical ones. This result may reflect the fact that tem-perate species include many conifers and herbs, whose foliage is NSC rich, while there were no conifers and few herbaceous species in Mediterranean or tropical biomes in our database. In addition, differences in biomass allo-cation among biomes and functional types may also help to explain patterns of NSC variation. For instance, the generally lower NSC concentrations in Mediterranean species compared to boreal or temperate ones may be compensated at the plant level by higher relative biomass allocation to roots and leaves in the former (Poorter et al. 2012). Finally, some combinations of biome by functional type were not well represented in our database (e.g., tem-perate evergreens from the Southern Hemisphere), which limits our capacity to draw general conclusions.
When considering woody plants only, tropical species tended to have higher starch concentrations in stems than boreal and temperate plants, and higher NSCT concen-trations in stems and belowground relative to temperate species. This result is contrary to our prediction that rel-atively higher C allocation to growth in tropical systems would result in overall lower NSC concentrations (Körner 2003). It is also in contrast with a recent study reporting lower NSC concentrations in the stem sapwood

DYNAMICS OF NSC IN TERRESTRIAL PLANTSNovember 2016 511
of tropical compared to temperate tree species, where all samples were analyses using the same protocol for NSC (Plavcová et al. 2016). This latter study, however, is based on only four tropical species sampled at a single date during the wet season. If confirmed, relatively high NSC levels in tropical species may indicate an adaptation to high levels of disturbance from herbivory (Coley and Barone 1996) and/or shade, consistent with previous results on saplings (Myers and Kitajima 2007, Poorter and Kitajima 2007, Poorter et al. 2010).
Hypothesis 3: NSC seasonal dynamics cannot be explained solely by imbalances between supply
and demand for growth and respiration
Seasonal variations in NSC and its fractions were detected in all organs from most functional types and biomes (Figs. 5 and 6). As hypothesized, the amplitude of these seasonal oscillations was generally larger in leaves and belowground than in stems, again highlighting the higher metabolic activity in the former organs. These pat-terns are consistent with previous results from individual studies (e.g., Hoch et al. 2003, Woodruff and Meinzer 2011), which also suggest that differences among organs may be less marked in smaller plants (e.g., sub- shrubs, Palacio et al. 2007b). Although the absolute variation in stems was low, the seasonal variation of NSCT, starch, and SS was consistently significant in stems but not so in leaves or belowground organs. Because stem biomass can be very large (particularly in trees) small oscillations in concentration may represent significant amounts of mobilized carbon, suggesting an important role of stems on the overall seasonal plant carbohydrate dynamics, at least in trees. For instance, Hoch et al. (2003) reported that the amount of non- structural carbon stored in stems and branches would be sufficient to rebuild the whole leaf canopy more than four times in temperate deciduous species, whereas it was ~60% of the amount of carbon contained in foliage for evergreen species. Along the same lines, Barbaroux et al. (2003) found similar total NSC pools in stems and roots of adult Quercus petraea and Fagus sylvatica, despite much higher concentrations in their roots. Similar results were obtained by Piper and Fajardo (2014) studying Nothofagus betuloides and N. pumilio. The importance of stem pools may be even larger in tropical trees, where stems plus branches have been found to store 80% of the total tree NSC pool (Würth et al. 2005).
The strongest seasonal variation in woody plants occurred in leaves and belowground organs of conifers (Fig. 5), despite the fact that conifers tend to have lower rates of assimilation and biomass production per unit of leaf mass than angiosperms (Enquist 2003, Carnicer et al. 2013). As opposed to other woody forms, where seasonal NSC variation in leaves was driven by SS, seasonal vari-ation of NSCT in conifer foliage was driven by starch, which showed an opposite pattern to that of SS. These results are consistent with the well- known role of sugars
promoting cold tolerance and the corresponding con-version of starch to SS in winter (Amundson et al. 1992, Kozlowski 1992, Gruber et al. 2011). High osmotic needs in winter associated with cold acclimation (Graham and Patterson 1982) could also explain the decline in starch levels belowground in autumn and winter in perennial herbs, concurrent with maximum SS concentrations.
In agreement with a simplified source–sink framework that accounts only for imbalances between supply via photosynthesis and demand for growth and respiration, dynamics of NSC concentrations in most organs and functional types showed maximums prior to or at the onset of the growth season and subsequent declines (at least in mid latitudes, where the correspondence between months and meteorological seasons is clearer; Fig. 5). Our results showed that, among woody forms, seasonal fluctuations were not always greater in deciduous species, in agreement with previous research (Hoch et al. 2003, Palacio et al. 2007a, Richardson et al. 2013). Rather, NSC oscillations were most pronounced in conifers which, with the exception of Larix decidua, are all ever-green species. In addition, seasonal oscillations below-ground and in stems were similar in drought- deciduous and evergreen angiosperms (winter deciduous showed more pronounced variation), although among tropical species seasonal fluctuations were greater in drought- deciduous than in evergreen species (Appendix S2: Fig. S3). The fact that deciduous species do not necessarily show higher seasonal variation than evergreen species may indicate (1) that shoot growth is largely supplied by current assimilates and independent of stored carbon reserves (Keel and Schädel 2010, Landhäusser 2010), (2) that growth demands are lower in deciduous species (e.g., Tomlinson et al. 2014), or (3) that storage is strongly reg-ulated in all species, as reported for herbaceous plants (Smith and Stitt 2007, see also McDowell et al. 2011, Sala et al. 2012, Stitt and Zeeman 2012, Dietze et al. 2014). Additional research is needed to resolve these contrasting (and, to some extent, compatible) interpretations.
The simplified source–sink framework also predicts stronger NSC oscillations in more seasonal climates, where accumulation during favorable periods supports carbon demands during less favorable times (Kramer and Kozlowski 1979, Piispanen and Saranpää 2001). Our results partially support this prediction. Seasonal vari-ation was most pronounced in boreal and temperate biomes (more seasonal) and lower in relatively less sea-sonal, tropical biomes (note, however, that species from rainforests and seasonal tropical forests were pooled together in our analysis). At the same time, however, we observed higher minimum starch in stems of tropical rel-ative to temperate species (Fig. 10), which may reflect the relatively high pressure from defoliators in tropical systems (Coley and Barone 1996, Poorter and Kitajima 2007). In addition, our results show that seasonal oscilla-tions were surprisingly low for Mediterranean biomes, which are characterized by a strong seasonality (mild to cold winters and hot, dry summers). These results

512 Ecological Monographs Vol. 86, No. 4JORDI MARTÍNEZ- VILALTA ET AL.
contrast with other studies showing substantial season-ality of NSC in Mediterranean species (Körner 2003, Palacio et al. 2007b, Rosas et al. 2013, Pratt et al. 2014). Our results, however, are averages for all species within a biome, and seasonal patterns may differ markedly between Mediterranean species, which frequently encompass diverse plant functional types (even within a site, cf. Palacio et al. 2007a). In addition, Mediterranean climates and their seasonality are more variable in time and space than other climates (Lionello et al. 2006). As a result, temporal patterns may average out when data from different sites, including species with contrasted leaf habits and growth forms, are combined, which could mask individual seasonal variations. It should also be noted that differences in seasonal variation among biomes likely reflect, to some extent, the uneven distri-bution of functional types across biomes (particularly herbs and conifers).
Hypothesis 4: Plants rarely deplete their NSC
As initially hypothesized, seasonal depletion of total NSC was rare, and seasonal NSC minimums remained above 40% of the maximum in most cases (average of 46% for NSCT; Figs. 9 and 10). This is consistent with positive associations between seasonal minimums and maximums across studies for all NSC fractions (except for some instances in drought- deciduous species; Fig. 7), and also agrees with previous studies showing that woody plants rarely completely deplete their NSC pools unless when they are under (natural or artificial) extreme condi-tions leading to death (Bonicel et al. 1987, Hoch et al. 2002, 2003, Körner 2003, Galiano et al. 2011, Hartmann et al. 2013b, Sevanto et al. 2014).
In a purely passive view of carbon storage (i.e., storage in itself is not regulated and cannot be a competing sink), fluctuations of NSC concentrations should be driven exclusively by phenological changes in assimilation vs. growth and respiration. In this case, the magnitude of NSC fluctuations would depend on the relative mag-nitude and temporal dynamics of different carbon flows and the observed high levels of minimum NSC concen-trations (relative to maximums) would be interpreted as a surplus of carbon at all times (Körner 2003, Fatichi et al. 2013, Palacio et al. 2014). Alternatively, if NSC serve multiple functions (in addition to a reservoir of carbon to buffer periods of stress), it would be reasonable to expect that selection has favored perennial species that keep sufficient NSC reserves at all times (Sala et al. 2012, Wiley and Helliker 2012, Dietze et al. 2014) and, therefore, complete NSC depletion under field conditions should also be rare. Unfortunately, these two alternative views of carbon storage frequently predict similar NSC tem-poral dynamics and this critical issue remains difficult to resolve using purely descriptive approaches (as the one used here).
Although most of our results are consistent with the two previous interpretations, some lines of evidence
suggest that the view of NSC storage as purely an overflow of carbon may need re- evaluation. First, NSC seasonal dynamics cannot be explained solely by imbalances between supply and demand for growth and respiration (see Discussion: Hypothesis 3). Second, the variability of minimum values (as a percentage of maximums) was much smaller than that of average values, and seasonal minimums remained relatively high and constant among functional types and biomes (Figs. 9 and 10). Determining what can be considered a high (or low) minimum NSC value is somewhat arbitrary because we lack a biologi-cally meaningful reference. However, there is a growing body of literature relating NSC levels with tree mortality, particularly in the context of drought stress. Only a few of these studies report temporal data (at least three points over time) that allows estimating minimum NSC that are comparable to our values. For these studies, average minimum NSCT (as a percentage of maximums) in dying trees relative to the maximum value for the corresponding control treatment were 30–32% for Pinus edulis leaves (Adams et al. 2013, Dickman et al. 2015), ~31% for Sequoia sempervirens (average between leaves and roots; Quirk et al. 2013), ~44% for Pinus sylvestris (average across organs; Aguadé et al. 2015), and ~48% for Pinus radiata (whole- plant level; Mitchell et al. 2014). Similarly, Pinus edulis trees experimentally subjected to shade but kept watered died when their leaf and twig NSCT were ~35% relative to pre- treatment conditions (Sevanto et al. 2014), and in Pinus ponderosa mortality of seedlings sub-jected to darkness started when whole- plant NSCT con-centrations approached 40% of their initial value (A. L. Bayless and A. Sala, unpublished results). Overall, these values, albeit limited and for gymnosperms only (mostly Pinus), correspond well with our overall estimate of 46% minimum NSC, supporting the notion that NSC levels are maintained above a minimum critical threshold except during extremely stressful conditions (Sala et al. 2012, Wiley and Helliker 2012, Dietze et al. 2014).
Finally, and most important, whereas depletion of SS or NSC was very rare, starch depletion was relatively common in all organs (Fig. 8). These results are con-sistent with a dual NSC function: whereas starch (and fructans) act mostly as reservoirs for future use, soluble sugars perform immediate functions (e.g., osmotic) and, therefore, their concentration has to be kept above some critical threshold (McDowell et al. 2011, Sala et al. 2012, Dietze et al. 2014, Sala and Mencuccini 2014). This view is supported by several studies showing that starch is more depleted than SS under lethal drought (Adams et al. 2013, Mitchell et al. 2013, Sevanto et al. 2014, Dickman et al. 2015, Garcia- Forner et al. 2016), and by modeling and empirical results indicating that NSC has two distinct pools with different turnover times (Richardson et al. 2013, 2015). These immediate vs. long- term functions of NSC are connected by the mutual conversion between starch and SS (Fig. 1), which involves highly regulated biochemical pathways (Dietze et al. 2014). Mutual conversion between starch and sugars

DYNAMICS OF NSC IN TERRESTRIAL PLANTSNovember 2016 513
commonly results in relative stable NSC levels, compared to larger seasonal oscillations of starch and SS (Fischer and Höll 1991, Terziev et al. 1997, Hoch et al. 2003, Richardson et al. 2013; Figs. 5 and 6 in this study). The requirement to keep relatively high SS concentrations seems to be most pressing for woody species subjected to cold periods, for which the soluble sugar fraction increases during winter months, often at the expense of starch (Figs. 5 and 6), in agreement with previous studies (Sauter 1988, Amundson et al. 1992, Kozlowski 1992, Schrader and Sauter 2002, Reyes- Díaz et al. 2005, Deslauriers et al. 2009, Gruber et al. 2011).
Conclusion: there is more to NSC than storage (and vice versa)
Despite the inherent limitations of this study (see above), our results confirm many long- held views on the role and dynamics of NSC in terrestrial plants and, at the same time, call for a more careful evaluation of seasonal NSC dynamics. Specifically, the reserve function of NSC, particularly of starch, was clear. Maximum starch values occurred in belowground reserve organs and their sea-sonal dynamics (e.g., accumulation prior to the growing season in conifer and evergreen angiosperms from mid latitudes) suggests that starch accumulates to support later growth or metabolism when plants remain dormant. At the same time, however, our results show that imbal-ances between supply and demand for growth and respi-ration alone are insufficient to explain the observed NSC patterns and their seasonal dynamics. All the patterns we report can be explained if we account for additional roles of NSC (e.g., metabolic, osmotic) and for the fact that performing these roles requires maintaining relatively high concentrations of soluble sugars at all times. If the general dual function of NSC as reservoir (starch) and in performing immediate physiological functions (SS) is confirmed, NSC concentrations at a single point in time may not be a good measure of storage (sensu Chapin et al. 1990), which would call for a better definition of what carbon storage is and how it should be measured.
Further research combining experimental approaches and field studies for a wide range of plant species and environmental conditions is needed to confirm the dual role (immediate vs. future use) and multiple functions of NSC, including their role in plant water relations. We stress the need for concurrent assessment of NSC dynamics with phenology and physiology (e.g., gas exchange, water potential, turgor, and hydraulic perfor-mance) in different organs to allow for a better inte-gration of whole- plant carbon and water economy. Isotopic techniques combined with modelling of carbon allocation (Richardson et al. 2013, Hartmann et al. 2015, Hartmann and Trumbore 2016), new methodologies to quantify cambial growth at short timescales (Chan et al. 2016, Deslauriers et al. 2016) and molecular approaches to decipher gene expression and metabolic profiling (Stitt and Zeeman 2012) offer promising avenues to measure
the fluxes into and out of NSC pools and disentangle the roles of different NSC fractions and how they vary over time.
Our results suggest that plants exhibit relatively high NSC thresholds to support immediate metabolic func-tions, which could help explain the general abundance of NSC in plants. If so, mortality should occur when NSC fall below these thresholds, even in non- stressed plants. Experiments to confirm these thresholds and whether and how they vary across functional types and physio-logical strategies are needed. If confirmed, the dual function of NSC, together with the fact that SS are mobile within the plant and can be interconverted to starch in all plant organs (Fig. 1), will have to be accounted for explicitly in models of NSC dynamics in plants and in studies of plant survival under stress.
acknowledGMentS
This research has been supported by the Spanish government through grants CGL2010- 16373 and CGL2013- 46808- R to J. Martínez- Vilalta and CGL2012- 32965 and CGL2015- 6741- R to F. Lloret. J. Martínez- Vilalta and F. Lloret were supported by the Catalan government through grant 2014 SGR 453. J. Martínez- Vilalta benefits from an ICREA Academia award. A. Sala was funded by a sabbatical leave from the University of Montana. L. Galiano was supported by an AvH postdoctoral fellowship from the Alexander von Humboldt- Foundation. F. Piper was supported by the Chilean Foundation of Science and Technology (Fondecyt, grants 11121175 and 1160330). S. Palacio was funded by a Ramón y Cajal contract (RYC- 2013- 14164). We are very thankful for the constructive comments by Nate G. McDowell and other reviewers, which have greatly improved this manuscript. A. Sala and J. Martínez- Vilalta contributed equally to this work.
literature cited
Adams, H. D., M. J. Germino, D. D. Breshears, G. A. Barron-Gafford, M. Guardiola-Claramonte, C. B. Zou, and T. E. Huxman. 2013. Nonstructural leaf carbohydrate dynamics of Pinus edulis during drought- induced tree mortality reveal role for carbon metabolism in mortality mechanism. New Phytologist 197:1142–1151.
Aguadé, D., R. Poyatos, M. Gómez, J. Oliva, and J. Martínez-Vilalta. 2015. The role of defoliation and root rot pathogen infection in driving the mode of drought- related physiological decline in Scots pine (Pinus sylvestris L.). Tree Physiology 35:229–242.
Amundson, R. G., J. L. Hadley, J. F. Fincher, S. Fellows, and R. G. Alscher. 1992. Comparisons of seasonal changes in photosynthetic capacity, pigments, and carbohydrates of healthy sapling and mature red spruce and of declining and healthy red spruce. Canadian Journal of Forest Research 22:1605–1616.
Arndt, S. K., S. J. Livesley, A. Merchant, T. M. Bleby, and P. F. Grierson. 2008. Quercitol and osmotic adaptation of field- grown Eucalyptus under seasonal drought stress. Plant, Cell & Environment 31:915–924.
Barbaroux, C., N. Bréda, and E. Dufrêne. 2003. Distribution of above- ground and below- ground carbohydrate reserves in adult trees of two contrasting broad- leaved species (Quercus petraea and Fagus sylvatica). New Phytologist 157: 605–615.

514 Ecological Monographs Vol. 86, No. 4JORDI MARTÍNEZ- VILALTA ET AL.
Bonicel, A., G. Haddad, and J. Gagnaire. 1987. Seasonal varia-tions of starch and major soluble sugars in the different organs of young poplars. Plant Physiology and Biochemistry 25:451–459.
Bréda, N., R. Huc, A. Granier, and E. Dreyer. 2006. Temperate forest trees and stands under severe drought: a review of eco-physiological responses, adaptation processes and long- term consequences. Annals of Forest Science 63:625–644.
Brocklebank, K. J., and G. A. F. Hendry. 1989. Characteristics of plant species which store different types of reserve carbo-hydrates. New Phytologist 112:255–260.
Canadell, J., and L. López-Soria. 1998. Lignotuber reserves support regrowth following clipping of two Mediterranean shrubs. Functional Ecology 12:31–38.
Carnicer, J., A. Barbeta, D. Sperlich, M. Coll, and J. Peñuelas. 2013. Contrasting trait syndromes in angiosperms and coni-fers are associated with different responses of tree growth to temperature on a large scale. Frontiers in Functional Plant Ecology 4:409.
Chan, T., T. Hölttä, F. Berninger, H. Mäkinen, P. Nöjd, M. Mencuccini, and E. Nikinmaa. 2016. Separating water- potential induced swelling and shrinking from measured radial stem variations reveals a cambial growth and osmotic concentration signal. Plant, Cell & Environment 39:233–244.
Chapin, F. S., E.-D. Schulze, and H. A. Mooney. 1990. The ecology and economics of storage in plants. Annual Review of Ecology and Systematics 21:423–447.
Chapin, F. S., and G. R. Shaver. 1988. Differences in carbon and nutrient fractions among arctic growth forms. Oecologia 77:506–514.
Choat, B., et al. 2012. Global convergence in the vulnerability of forests to drought. Nature 491:752–755.
Chow, P. S., and S. M. Landhäusser. 2004. A method for rou-tine measurements of total sugar and starch content in woody plant tissues. Tree Physiology 24:1129–1136.
Cochard, H., and S. Delzon. 2013. Hydraulic failure and repair are not routine in trees. Annals of Forest Science 70:659–661.
Coley, P. D., and J. A. Barone. 1996. Herbivory and plant defenses in tropical forests. Annual Review of Ecology and Systematics 27:305–335.
Crone, E. E., E. Miller, and A. Sala. 2009. How do plants know when other plants are flowering? Resource depletion, pollen limitation and mast- seeding in a perennial wildflower. Ecology Letters 12:1119–1126.
Deslauriers, A., A. Giovannelli, S. Rossi, G. Castro, G. Fragnelli, and L. Traversi. 2009. Intra- annual cambial activity and carbon availability in stem of poplar. Tree Physiology 29:1223–1235.
Deslauriers, A., J.-G. Huang, L. Balducci, M. Beaulieu, and S. Rossi. 2016. The contribution of carbon and water in mod-ulating wood formation in black spruce saplings. Plant Physiology 170:2072–2084.
Dickman, L. T., N. G. Mcdowell, S. Sevanto, R. E. Pangle, and W. T. Pockman. 2015. Carbohydrate dynamics and mortality in a piñon- juniper woodland under three future precipitation scenarios. Plant, Cell & Environment 38:729–739.
Dietze, M. C., A. Sala, M. S. Carbone, C. I. Czimczik, J. A. Mantooth, A. D. Richardson, and R. Vargas. 2014. Nonstructural carbon in woody plants. Annual Review of Plant Biology 65:667–687.
Enquist, B. J. 2003. Scaling the macroecological and evolution-ary implications of size and metabolism within and across plant taxa. Pages 321–341 in T. M. Blackburn and K. J. Gaston, editors. Macroecology: Concepts and Consequences: 43rd Symposium of the British Ecological Society. Blackwell, Malden, Massachusetts, USA.
Fatichi, S., S. Leuzinger, and C. Körner. 2013. Moving beyond photosynthesis: from carbon source to sink- driven vegetation modeling. New Phytologist 201:1086–1095.
Fischer, C., and W. Höll. 1991. Food reserves of Scots pine (Pinus sylvestris L.). Trees—Structure and Function 5: 187–195.
Galiano, L., J. Martínez-Vilalta, and F. Lloret. 2011. Carbon reserves and canopy defoliation determine the recovery of Scots pine 4 yr after a drought episode. New Phytologist 190:750–759.
Garcia-Forner, N., A. Sala, C. Biel, R. Savé, and J. Martínez-Vilalta. 2016. Individual traits as determinants of time to death under extreme drought in Pinus sylvestris L. Tree Physiology, in press.
Gaylord, M. L., T. E. Kolb, W. T. Pockman, J. A. Plaut, E. A. Yepez, A. K. Macalady, R. E. Pangle, and N. G. McDowell. 2013. Drought predisposes piñon–juniper woodlands to insect attacks and mortality. New Phytologist 198:567–578.
Gholz, H. L., and W. P. Cropper Jr. 1991. Carbohydrate dynamics in mature Pinus elliottii var. elliottii trees. Canadian Journal of Forest Research 21:1742–1747.
Gibson, S. I. 2005. Control of plant development and gene expression by sugar signaling. Current Opinion in Plant Biology 8:93–102.
Gough, C. M., C. E. Flower, C. S. Vogel, D. Dragoni, and P. S. Curtis. 2009. Whole- ecosystem labile carbon production in a north temperate deciduous forest. Agricultural and Forest Meteorology 149:1531–1540.
Graham, D., and B. D. Patterson. 1982. Responses of plants to low, nonfreezing temperatures: proteins, metabolism, and acclimation. Annual Review of Plant Physiology 33: 347–372.
Gruber, A., D. Pirkebner, C. Florian, and W. Oberhuber. 2011. No evidence for depletion of carbohydrate pools in Scots pine (Pinus sylvestris L.) under drought stress. Plant Biology 14:142–148.
Hartmann, H., N. G. McDowell, and S. Trumbore. 2015. Allocation to carbon storage pools in Norway spruce saplings under drought and low CO2. Tree Physiology 35:243–252.
Hartmann, H., and S. Trumbore. 2016. Understanding the roles of nonstructural carbohydrates in forest trees—from what we can measure to what we want to know. New Phytologist 211:386–403. doi:10.1111/nph.13955, in press.
Hartmann, H., W. Ziegler, O. Kolle, and S. Trumbore. 2013a. Thirst beats hunger—declining hydration during drought prevents carbon starvation in Norway spruce saplings. New Phytologist 200:340–349.
Hartmann, H., W. Ziegler, and S. Trumbore. 2013b. Lethal drought leads to reduction in nonstructural carbohydrates in Norway spruce tree roots but not in the canopy. Functional Ecology 27:413–427.
Hoch, G. 2007. Cell wall hemicelluloses as mobile carbon stores in non- reproductive plant tissues. Functional Ecology 21:823–834.
Hoch, G. 2015. Carbon reserves as indicators for carbon limita-tion in trees. Pages 321–346 in U. Lüttge and W. Beyschlag, editors. Progress in botany. Springer International Publish-ing, Cham, Switzerland.
Hoch, G., and C. Körner. 2003. The carbon charging of pines at the climatic treeline: a global comparison. Oecologia 135:10–21.
Hoch, G., M. Popp, and C. Körner. 2002. Altitudinal increase of mobile carbon pools in Pinus cembra suggests sink limita-tion of growth at the Swiss treeline. Oikos 98:361–374.
Hoch, G., A. Richter, and C. Körner. 2003. Non- structural car-bon compounds in temperate forest trees. Plant, Cell & Environment 26:1067–1081.

DYNAMICS OF NSC IN TERRESTRIAL PLANTSNovember 2016 515
Hummel, I., et al. 2010. Arabidopsis plants acclimate to water deficit at low cost through changes of carbon usage: an integrated perspective using growth, metabolite, enz-yme, and gene expression analysis. Plant Physiology 154: 357–372.
Johnson, D. M., K. A. McCulloh, D. R. Woodruff, and F. C. Meinzer. 2012. Hydraulic safety margins and embolism rever-sal in stems and leaves: Why are conifers and angiosperms so different? Plant Science 195:48–53.
Kattge, J., et al. 2011. TRY—a global database of plant traits. Global Change Biology 17:2905–2935.
Keel, S. G., and C. Schädel. 2010. Expanding leaves of mature deciduous forest trees rapidly become autotrophic. Tree Physiology 30:1253–1259.
Klein, T., and G. Hoch. 2015. Tree carbon allocation dynamics determined using a carbon mass balance approach. New Phytologist 205:147–159.
Körner, C. 1994. Biomass fractionation in plants: a reconsider-ation of definitions based on plant functions. Pages 173–185 in J. Roy and E. Garnier, editors. Whole plant perspective on carbon–nitrogen interactions. SPB Academic Publishing, The Hague, The Netherlands.
Körner, C. 2003. Carbon limitation in trees. Journal of Ecology 91:4–17.
Körner, C. 2015. Paradigm shift in plant growth control. Current Opinion in Plant Biology 25:107–114.
Kozlowski, T. T. 1992. Carbohydrate sources and sinks in woody plants. Botanical Review 58:107–222.
Kramer, P. J., and T. T. Kozlowski. 1979. Physiology of woody plants. Academic Press, New York, New York, USA.
Landhäusser, S. M. 2010. Aspen shoots are carbon autonomous during bud break. Trees 25:531–536.
Li, N., N. He, G. Yu, Q. Wang, and J. Sun. 2016. Leaf non- structural carbohydrates regulated by plant functional groups and climate: evidences from a tropical to cold- temperate for-est transect. Ecological Indicators 62:22–31.
Li, M., G. Hoch, and C. Körner. 2002. Source/sink removal affects mobile carbohydrates in Pinus cembra at the Swiss treeline. Trees—Structure and Function 16:331–337.
Lionello, P., P. Malanotte-Rizzoli, and R. Boscolo. 2006. Mediterranean climate variability. Elsevier, Amsterdam.
Martínez-Vilalta, J. 2014. Carbon storage in trees: pathogens have their say. Tree Physiology 34:215–217.
McDowell, N. G., D. J. Beerling, D. D. Breshears, R. A. Fisher, K. F. Raffa, and M. Stitt. 2011. The interdependence of mechanisms underlying climate- driven vegetation mortality. Trends in Ecology & Evolution 26:523–532.
McDowell, N. G., et al. 2013. Uncertainties and opportunities in modeling drought- associated vegetation mortality. New Phytologist 200:304–321.
McDowell, N. G., W. T. Pockman, C. D. Allen, D. D. Breshears, N. Cobb, T. Kolb, J. Plaut, J. Sperry, A. West, and D. G. Williams. 2008. Mechanisms of plant survival and mortality during drought: Why do some plants survive while others suc-cumb to drought? New Phytologist 178:719–739.
Millard, P., M. Sommerkorn, and G. A. Grelet. 2007. Environmental change and carbon limitation in trees: a bio-chemical, ecophysiological and ecosystem appraisal. New Phytologist 175:11–28.
Mitchell, P. J., A. P. O’Grady, D. T. Tissue, D. A. White, M. L. Ottenschlaeger, and E. A. Pinkard. 2013. Drought response strategies define the relative contributions of hydraulic dys-function and carbohydrate depletion during tree mortality. New Phytologist 197:862–872.
Mitchell, P. J., A. P. O’Grady, D. T. Tissue, D. Worledge, and E. A. Pinkard. 2014. Co- ordination of growth, gas exchange and hydraulics define the carbon safety margin in tree species
with contrasting drought strategies. Tree Physiology 34: 443–458.
Mooney, H. A. 1972. The carbon balance of plants. Annual Review of Ecology and Systematics 3:315–346.
Morgan, J. M. 1984. Osmoregulation and water stress in higher plants. Annual Review of Plant Physiology 35:299–319.
Morris, J., et al. 2016. A global analysis of parenchyma tissue fractions in secondary xylem of seed plants. New Phytologist 209:1553–1565.
Myers, J. A., and K. Kitajima. 2007. Carbohydrate storage enhances seedling shade and stress tolerance in a neotropical forest. Journal of Ecology 95:383–395.
Nakagawa, S., and H. Schielzeth. 2013. A general and simple method for obtaining R2 from generalized linear mixed- effects models. Methods in Ecology and Evolution 4: 133–142.
O’Brien, M. J., S. Leuzinger, C. D. Philipson, J. Tay, and A. Hector. 2014. Drought survival of tropical tree seedlings enhanced by non- structural carbohydrate levels. Nature Climate Change 4:710–714.
Oliva, J., J. Stenlid, and J. Martínez-Vilalta. 2014. The effect of fungal pathogens on the water and carbon economy of trees: implications for drought- induced mortality. New Phytologist 203:1028–1035.
Palacio, S., M. Maestro, and G. Montserratmarti. 2007a. Seasonal dynamics of non- structural carbohydrates in two species of mediterranean sub- shrubs with different leaf phenology. Environmental and Experimental Botany 59: 34–42.
Palacio, S., P. Millard, M. Maestro, and G. Montserrat-Martí. 2007b. Non- structural carbohydrates and nitrogen dynamics in Mediterranean sub- shrubs: an analysis of the functional role of overwintering leaves. Plant Biology 9:49–58.
Palacio, S., A. J. Hester, M. Maestro, and P. Millard. 2008. Browsed Betula pubescens trees are not carbon- limited. Functional Ecology 22:808–815.
Palacio, S., G. Hoch, A. Sala, C. Körner, and P. Millard. 2014. Does carbon storage limit tree growth? New Phytologist 201:1096–1100.
Paritsis, J., and T. T. Veblen. 2011. Dendroecological analysis of defoliator outbreaks on Nothofagus pumilio and their rela-tion to climate variability in the Patagonian Andes. Global Change Biology 17:239–253.
Pau, S., E. M. Wolkovich, B. I. Cook, T. J. Davies, N. J. B. Kraft, K. Bolmgren, J. L. Betancourt, and E. E. Cleland. 2011. Predicting phenology by integrating ecology, evolution and climate science. Global Change Biology 17:3633–3643.
Piispanen, R., and P. Saranpää. 2001. Variation of non- structural carbohydrates in silver birch (Betula pendula Roth) wood. Trees 15:444–451.
Piper, F. I., and A. Fajardo. 2014. Foliar habit, tolerance to defoliation and their link to carbon and nitrogen storage. Journal of Ecology 102:1101–1111.
Plavcová, L., G. Hoch, H. Morris, S. Ghiasi, and S. Jansen. 2016. The amount of parenchyma and living fibers affects storage of nonstructural carbohydrates in young stems and roots of temperate trees. American Journal of Botany 103:603–612.
Poorter, L., and K. Kitajima. 2007. Carbohydrate storage and light requirements of tropical moist and dry forest tree spe-cies. Ecology 88:1000–1011.
Poorter, L., K. Kitajima, P. Mercado, J. Chubiña, I. Melgar, and H. H. T. Prins. 2010. Resprouting as a persistence strat-egy of tropical forest trees: relations with carbohydrate stor-age and shade tolerance. Ecology 91:2613–2627.
Poorter, H., K. J. Niklas, P. B. Reich, J. Oleksyn, P. Poot, and L. Mommer. 2012. Biomass allocation to leaves, stems and

516 Ecological Monographs Vol. 86, No. 4JORDI MARTÍNEZ- VILALTA ET AL.
roots: meta- analyses of interspecific variation and environ-mental control. New Phytologist 193:30–50.
Pratt, R. B., A. L. Jacobsen, A. R. Ramirez, A. M. Helms, C. A. Traugh, M. F. Tobin, M. S. Heffner, and S. D. Davis. 2014. Mortality of resprouting chaparral shrubs after a fire and dur-ing a record drought: physiological mechanisms and demo-graphic consequences. Global Change Biology 20:893–907.
Quentin, A. G., et al. 2015. Non- structural carbohydrates in woody plants compared among laboratories. Tree Physiology 35:1146–1165.
Quirk, J., N. G. McDowell, J. R. Leake, P. J. Hudson, and D. J. Beerling. 2013. Increased susceptibility to drought-induced mortality in Sequoia sempervirens (Cupressaceae) trees under Cenozoic atmospheric carbon dioxide starvation. American Journal of Botany 100:582–591.
Reich, P. B., M. G. Tjoelker, K. S. Pregitzer, I. J. Wright, J. Oleksyn, and J.-L. Machado. 2008. Scaling of respiration to nitrogen in leaves, stems and roots of higher land plants. Ecology Letters 11:793–801.
Reyes-Díaz, M., M. Alberdi, F. Piper, L. A. Bravo, and L. J. Corcuera. 2005. Low temperature responses of Nothofagus dombeyi and Nothofagus nitida, two evergreen species from south central Chile. Tree Physiology 25:1389–1398.
Richardson, A. D., M. S. Carbone, B. A. Huggett, M. E. Furze, C. I. Czimczik, J. C. Walker, X. Xu, P. G. Schaberg, and P. Murakami. 2015. Distribution and mixing of old and new nonstructural carbon in two temperate trees. New Phytologist 206:590–597.
Richardson, A. D., M. S. Carbone, T. F. Keenan, C. I. Czimczik, D. Y. Hollinger, P. Murakami, P. G. Schaberg, and X. Xu. 2013. Seasonal dynamics and age of stemwood nonstructural carbohydrates in temperate forest trees. New Phytologist 197:850–861.
Rosas, T., L. Galiano, R. Ogaya, J. Peñuelas, and J. Martínez-Vilalta. 2013. Dynamics of non- structural carbohydrates in three Mediterranean woody species following long- term experimental drought. Frontiers in Plant Science 4:400.
Ryan, M. G. 2011. Tree responses to drought. Tree Physiology 31:237–239.
Sala, A., and M. Mencuccini. 2014. Ecosystem science: plump trees win under drought. Nature Climate Change 4:666–667.
Sala, A., D. R. Woodruff, and F. C. Meinzer. 2012. Carbon dynamics in trees: Feast or famine? Tree Physiology 32:764–775.
Salleo, S., M. A. Lo Gullo, P. Trifilò, and A. Nardini. 2004. New evidence for a role of vessel- associated cells and phloem in the rapid xylem refilling of cavitated stems of Laurus nobilis L. Plant, Cell & Environment 27:1065–1076.
Sauter, J. J. 1988. Temperature- induced changes in starch and sugars in the stem of Populus × canadensis «robusta». Journal of Plant Physiology 132:608–612.
Savage, J. A., M. J. Clearwater, D. F. Haines, T. Klein, M. Mencuccini, S. Sevanto, R. Turgeon, and C. Zhang. 2016. Allocation, stress tolerance and carbon transport in plants: How does phloem physiology affect plant ecology? Plant, Cell & Environment 39:709–725.
Schädel, C., A. Blöchl, A. Richter, and G. Hoch. 2009. Short- term dynamics of nonstructural carbohydrates and hemicelluloses in young branches of temperate forest trees during bud break. Tree Physiology 29:901–911.
Schrader, S., and J. J. Sauter. 2002. Seasonal changes of sucrose- phosphate synthase and sucrose synthase activities in poplar wood (Populus × canadensis Moench “robusta”) and their possible role in carbohydrate metabolism. Journal of Plant Physiology 159:833–843.
Secchi, F., and M. A. Zwieniecki. 2011. Sensing embolism in xylem vessels: the role of sucrose as a trigger for refilling. Plant, Cell & Environment 34:514–524.
Sevanto, S., N. G. Mcdowell, L. T. Dickman, R. Pangle, and W. T. Pockman. 2014. How do trees die? A test of the hydrau-lic failure and carbon starvation hypotheses. Plant, Cell & Environment 37:153–161.
Smith, A. M., and M. Stitt. 2007. Coordination of carbon sup-ply and plant growth. Plant, Cell & Environment 30:1126–1149.
Spicer, R. 2014. Symplasmic networks in secondary vascular tissues: parenchyma distribution and activity supporting long- distance transport. Journal of Experimental Botany 65:1829–1848.
Stitt, M., and S. C. Zeeman. 2012. Starch turnover: pathways, regulation and role in growth. Current Opinion in Plant Biology 15:282–292.
Terziev, N., J. Boutelje, and K. Larsson. 1997. Seasonal fluctu-ations of low- molecular- weight sugars, starch and nitrogen in sapwood of Pinus sylvestris L. Scandinavian Journal of Forest Research 12:216–224.
Tomlinson, K. W., L. Poorter, F. Bongers, F. Borghetti, L. Jacobs, and F. van Langevelde. 2014. Relative growth rate variation of evergreen and deciduous savanna tree species is driven by different traits. Annals of Botany 114:315–324.
Walter, A., M. M. Christ, G. A. Barron-gafford, K. A. Grieve, R. Murthy, and U. Rascher. 2005. The effect of elevated CO2 on diel leaf growth cycle, leaf carbohydrate content and can-opy growth performance of Populus deltoides. Global Change Biology 11:1207–1219.
Wiley, E., and B. Helliker. 2012. A re- evaluation of carbon stor-age in trees lends greater support for carbon limitation to growth. New Phytologist 195:285–289.
Wood, S. N. 2006. Generalized additive models: an introduc-tion with R. CRC Press, Boca Raton, Florida, USA.
Woodruff, D. R., and F. C. Meinzer. 2011. Water stress, shoot growth and storage of non- structural carbohydrates along a tree height gradient in a tall conifer: growth, water stress and carbohydrate storage. Plant, Cell & Environment 34: 1920–1930.
Wright, I. J., P. B. Reich, M. Westoby, D. D. Ackerly, Z. Baruch, F. Bongers, J. Cavender-Bares, T. Chapin, J. H. C. Cornelissen, and M. Diemer. 2004. The worldwide leaf eco-nomics spectrum. Nature 428:821–827.
Würth, M. K. R., S. Peláez-Riedl, S. J. Wright, and C. Körner. 2005. Non- structural carbohydrate pools in a tropical forest. Oecologia 143:11–24.
SuPPortinG inForMation
Additional Supporting Information may be found online at: http://onlinelibrary.wiley.com/doi/10.1002/ecm.1231/suppinfo
data aVailability
Data associated with this paper are available in Dryad: http://dx.doi.org/10.5061/dryad.j6r5k