dynamics of railway wagons subjected to braking/traction torque
TRANSCRIPT

1
Dynamics of railway wagons subjected to braking torques
on defective tracks
Zuoyan Zhang1 & Manicka Dhanasekar2 1 Modeller, Parsons Brinckerhoff, Brisbane, QLD4001, Australia
2 Professor, Queensland University of Technology, Brisbane, QLD4000,
Australia; [email protected]
Post Review Final Version to: International Journal of Vehicle System Dynamics
Jan 2011
Abstract
It is well known that track defects cause profound effects to the dynamics of railway wagons;
normally such problems are examined for cases of wagons running at a constant speed.
Brake/traction torques affect the speed profile due to the wheel-rail contact characteristics but
most of the wagon-track interaction models do not explicitly consider them in simulation.
The authors have recently published a model for the dynamics of wagons subject to braking /
traction torques on perfect track by explicitly considering the pitch degree of freedom for
wheelsets . The model is extended for cases of lateral and vertical track geometry defects and
worn railhead and wheel profiles. This paper presents results of the analyses carried out using
the extended model to the dynamics of wagons containing less than ideal wheel profiles
running on tracks with geometry defects and worn rails.
Keywords: braking/traction torque, wheel unloading, track irregularity, wagon yaw, wagon
roll, worn rail/wheel
1. Introduction
Wagon operations are commonly associated with braking/traction especially when they enter
and exit speed restriction zones and/or tight curves. Most of the wagon dynamics simulation
packages that primarily focus on long distance route simulations routinely require pre-defined

2
speed profiles for dealing with those situations. Such simulation algorithms usually do not
include wheelset pitch and hence cannot be explicitly used for the modelling of the wheelset
slip and skid expected under severe braking torques.
This paper refers to a mathematical formulation of full wagon systems acted upon by traction/
braking torques using a fixed coordinate reference system both in space and time published
by the authors recently [1]. With this formulation the complex behaviour of the wagon
dynamics under braking/traction torques can be truly modelled without any need for working
out the speed profile as a priori. Our previous paper focuses on wagons that run on perfect
track under the influence of normal and severe levels of traction and brake force sequences;
Wheelset skidding, wheel unloading and wagon pitch are also reported [1].
The current paper has extended our previous model to cases of track irregularity and worn
rail/ wheel profiles. Effects of the lateral track irregularities to the yaw moment and different
vertical sinusoid and plateau defects to the wagon roll are reported in this paper. The track
defect effect on wagon pitch and worn rail/wheel profile study are also presented.
2. Literature Review
Rotational motion of wagons includes pitch, yaw and roll, which are sparingly reported in the
literature. The paucity perhaps is linked to the steady state focus of most system simulation
packages. The effect of bogie and wagon pitch induced by the longitudinal forces was
examined experimentally through an instrumented bogie by McClanachan et al. [2]. The
prevalence of light duty vehicles has prompted investigations into methods to reduce the
vehicle body roll by Climb et al. [3].
The study of imperfect rails is mainly used to address ride characteristics and ride comfort.
Comprehensive rail geometry definition and properties can be found in Dukkipati [4]. The
geometry of wheel/rail profiles affects the creepage/creep and adhesion and they in turn result
in the complex dynamic behaviour of wagons. Vibration characteristics of track are the result
of cumulative forces and the source of increased stress, energy losses, additional wheel/rail
wear and passenger discomfort. Therefore, study of these characteristics and influences of the
rail profile can offer excellent source of information for the maintenance purpose. However,
the irregular rail profile concerned with corrugation which falls into the non-steady category

3
and the wheel/rail discontinuities such as the insulated rail joints, turnouts and switches are
not discussed here.
By introducing surface parameters [5], Pombo et al. [6] proposed a general geometric track
description which integrates track irregularities as a function of the track length to the
dynamics of the wheel/rail contact simulation. A simulation of the influences of periodic
track irregularities on a freight car was carried out by Chen and Jin [7]. Li et al. [8]
developed a real time technology to predict vehicle performance based on the track
geometry. Steenbergen [9, 10] investigated the relationship between different stages of wheel
flats and wheel/rail interaction.
Detailed description on wagon brake system is provided in [1]. Air brake system responses
rely on the air transmission speed of the brake pipe drop rate. Parametric study of railway air
brake system was given by Murtaza and Garg [11] and Piechowiak [12]. Cocci et al. [13]
developed a multibody system (MBS) model to perform braking simulation and compared it
with the experimental tests. Chou and Xia [14] proposed a controlled pneumatic brake system
to minimise the running costs of heavy-haul trains. Olson [15] developed single- and two-
wheel braking models to investigate ground vehicles. Malvezzi et al. [16] built a new speed
control system to analyse braking performance. The braking performance was assessed
through a function of several general parameters. Durali and Shadmehri [17] reported an
analysis of train derailment due to severe braking. The most comprehensive review that
summaries 80 years on brake vibration and/or noise was given by Cantoni et al. [18].
Handoko and Dhanasekar [19,20] reported a fixed reference frame formulation of a bogie
model. Lateral and vertical track irregularities were input to the bogie-track system to
generate vibration for studying bogie yaw and roll moments plus lateral and vertical
displacements of wheelsets. A sequence of longitudinal torque was applied to railway bogies
to investigate the bogie pitch moment. Bogie dynamics under heavy braking was presented in
Handoko [21], which also examined the effect of unevenly distributed brake torques applied
to wheelsets.

4
3. Wagon model description and formulation
A wagon consisting of one wagon body supported by two bogies one at the front and the
second at the rear, with each fitted with two wheelsets each and connected by mass less
elastic springs and dampers as presented in [1] is considered in this paper. This model
employs the fixed coordinate system introduced in [5]. Therefore contact kinematics are
calculated as a function of the variation of the velocity of the moving body and calculated in
real-time during the simulation process. Also, the effects of the severe application of heavy
braking and traction such as skid and slip can be accounted for in this formulation. Details of
the coordinates, formulations of wagon model, parameters used in wagon model can be found
in [1] and hence are not reproduced here.
3.1 Extended formulation for defective tracks
Track irregularities are rectified with due care during track maintenance because excessive
wagon response can result due to track disturbances leading to poor ride quality. With track
imperfections combined with large brake and traction torques applied on wheelsets, the
situation can even be more dangerous, but not well understood.
In this study, sinusoidal lateral track irregularities are found to affect the yaw moment and
other specific features of wagon movement through changes to the vehicle speed, which in
turn is affected by the defect amplitude and applied brake torques. Different vertical sinusoid
and plateau defects are used to exploit the wagon roll and pitch. The influences of brake and
traction torques on wheel unloading and wagon yaw and wagon roll are illustrated through
numerical examples.
3.1.1 Lateral irregularity of track
A general sinusoidal rail alignment irregularity may be expressed as in Equation (1).
( ) sin( )ir irY x k xπ= ∆ Equation (1)

5
where ir∆ is the amplitude of the defect and k is a parameter that defines the sine wavelength.
In the simulation, ir∆ is chosen from 5mm to 25 mm while irk is set as 0.045 1m− that
corresponds to a wavelength of 44.44m. The irregularity was assumed to occur at the 25th m
of the track with the view to ensuring suppression of the effect of initial condition on wagon
response.
3.1.2 Vertical irregularities of track
Track was assumed to exhibit sinusoid defects at the same location of both rails as defined
below:
( ) sin( )ir irZ x k xπ= ∆ Equation (2)
The sinusoid defect was then assumed to occur on the left and right rails with a phase angle
difference of 180° and 90° respectively. The analytical representation of these sinusoidal
irregularities is expressed in Equations (3) and (4):
( ) sin( / 2)L ir irZ x k xπ π= ∆ + Equation (3)
( ) sin( / 4)R ir irZ x k xπ π= ∆ + Equation (4)
In the Equations(2)(4), x is the longitudinal travel and Z is the vertical height of the rail.
Suffix L and R stands for left and right rail respectively. The cross level due to the sinusoidal
phase difference is provided in Equation (5):
( ) ( ) ( )C L RZ x Z x Z x= − Equation (5)
A plateau type defect (cross level) was assumed to occur only on the right rail in the
examples whilst the left rail was kept perfect. The defect is mathematically expressed as:
2 8( ) / (1 ( ) )C ir irZ x k x= ∆ + Equation (6)
where ir∆ is the amplitude and irk is a parameter that defines the sine wavelength.
6
Analyses carried out using the track shape containing sinusoidal vertical defect (Equation(2))
is termed as studies “case# S1” for convenience. Similarly, the two vertical defect situations
with phase difference (Equations (3) and (4)) are termed as “case#S2” and “case#S3”
respectively. The plateau case is termed as “case#C” in this paper.
4. Effects of Track Defect on Wagon Yaw
4.1 Speed influence
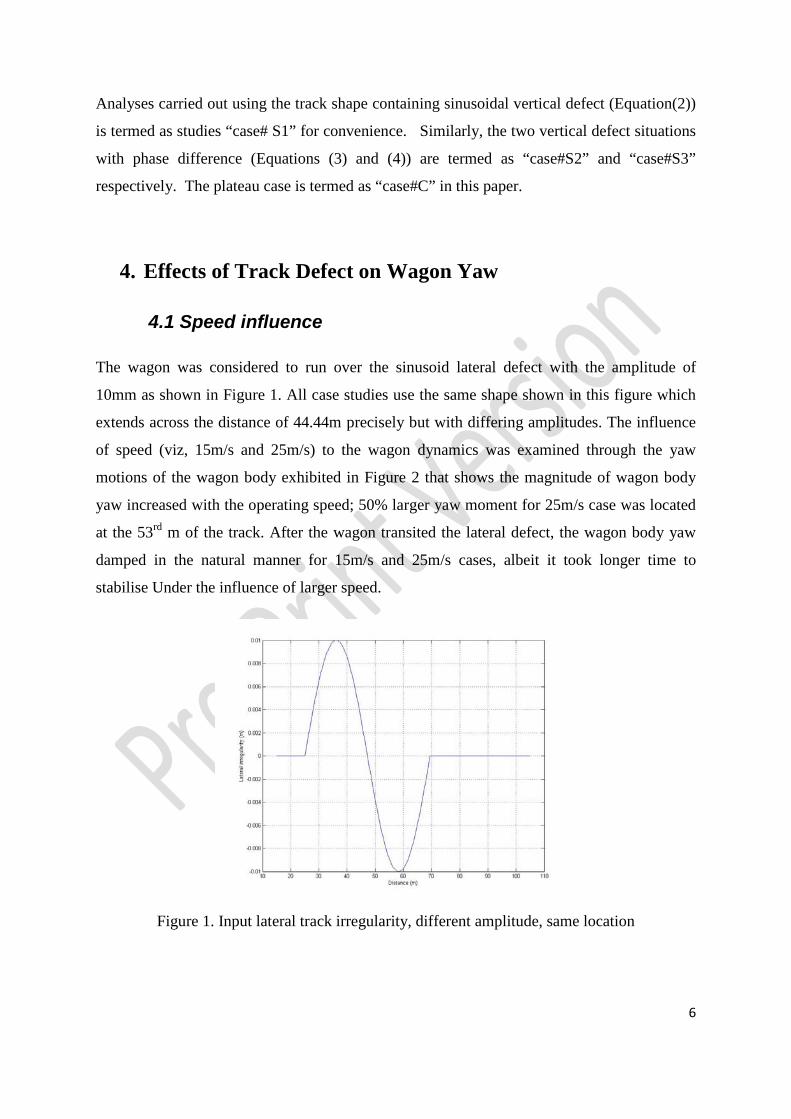
The wagon was considered to run over the sinusoid lateral defect with the amplitude of
10mm as shown in Figure 1. All case studies use the same shape shown in this figure which
extends across the distance of 44.44m precisely but with differing amplitudes. The influence
of speed (viz, 15m/s and 25m/s) to the wagon dynamics was examined through the yaw
motions of the wagon body exhibited in Figure 2 that shows the magnitude of wagon body
yaw increased with the operating speed; 50% larger yaw moment for 25m/s case was located
at the 53rd m of the track. After the wagon transited the lateral defect, the wagon body yaw
damped in the natural manner for 15m/s and 25m/s cases, albeit it took longer time to
stabilise Under the influence of larger speed.
Figure 1. Input lateral track irregularity, different amplitude, same location

7
Figure 2. Wagon body yaw motion for 15m/s and 25m/s cases
4.2 Defect magnitude influence
This section reports the results of wagons running over the sinusoid lateral defects with an
initial speed of 25m/s (this speed decreases slightly at the end of simulation due to energy
loss). Five amplitudes of the defects (5mm, 10mm,15mm, 20mm and 25mm) were
considered. The lateral displacements of wheelsets and the front/rear bogies and wagon body
yaw responses are presented in this section.
Figure 3 shows the front bogie yaw and rear bogie yaw moment for 5mm to 25mm defects.
All cases have exhibited two positive peaks and one negative peak, and the second positive
peak value has been found to be larger and the negative peaks always have given the absolute
maximum value. The magnitude of yaw moment is also generally proportional to the
magnitude of the track defect. It is worthy of mention that the negative peaks among 5mm to

8
20mm are relatively smooth, whereas a fluctuation was found in 25mm because flange
contact has occurred. Figure 4 describe the wheelset’ lateral displacements for the 25mm
defect case (Wheelset 1 refers to the front wheelset in front bogie and Wheelset 4 refers to the
rear wheelset of the rear bogie with the other two in sequential order); it can be seen that
flange contact lasts for about 10m travel of each wheelset.
Figure 3. Front and rear bogie yaw motion for 5mm – 25mm defect cases

9
Figure 4. Lateral displacements of wheelsets (25mm defect case)
Table 1 illustrates the relationship of lateral track irregularity and negative bogie/wagon body
yaw and their corresponding track distance. It implies that the track shape plays a
predominate role on yaw moment response. The magnitude of yaw is generally proportional
to the magnitude of the track defect, but the relationship is not strictly linear; the
corresponding track distances, which means where the largest yaw occur, are relatively
consistent. From Figure 1 we can see that the 47th m corresponds to the track defect balance
position while the 60th m shows the negative peak. The maximum wagon body yaw has
occurred between the negative peaks of the front bogie and rear bogie, and its value is
approximately double that of the bogie’s negative peaks.

10
Table 1. Magnitude and location of maximum negative yaw under lateral irregularity
Track
Defect
Front bogie
( 310− rad)
Dist (m) Rear bogie
( 310− rad)
Dist (m) Wagon body
( 310− rad)
Dist (m)
5mm -1.2 47.3 -1.1 60.0 -2.2 53.3
10mm -2.4 47.3 -2.3 60.3 -4.5 53.3
15mm -3.6 47.0 -3.5 60.0 -6.7 53.3
20mm -4.7 47.0 -4.5 60.5 -8.7 53.0
25mm -5.8 47.5 -5.5 60.7 -10.5 53.0
** these results are drawn from the 25m/s case study as set out in section 4.1.
4.3 Lateral dynamics under brake torque
The wagon was considered travelling on a track with sinusoidal rail alignment irregularity of
10mm amplitude as shown in Figure 1, whilst wo sorts of brake torques, 3.5kNm and 10kNm,
were applied equally to each wheelset and for the distance from the 25th m to the 95th m.
Noting that wheelset 4 leaves the track defect on the 85th m, an additional brake torque was
applied for 10m travel to examine the trend of braking on perfect rail. The wagon body yaw
is shown to stabilise quicker under the influence of the larger brake torque (Figure 5).
Figure 5. Wagon body yaw under brake torque
11
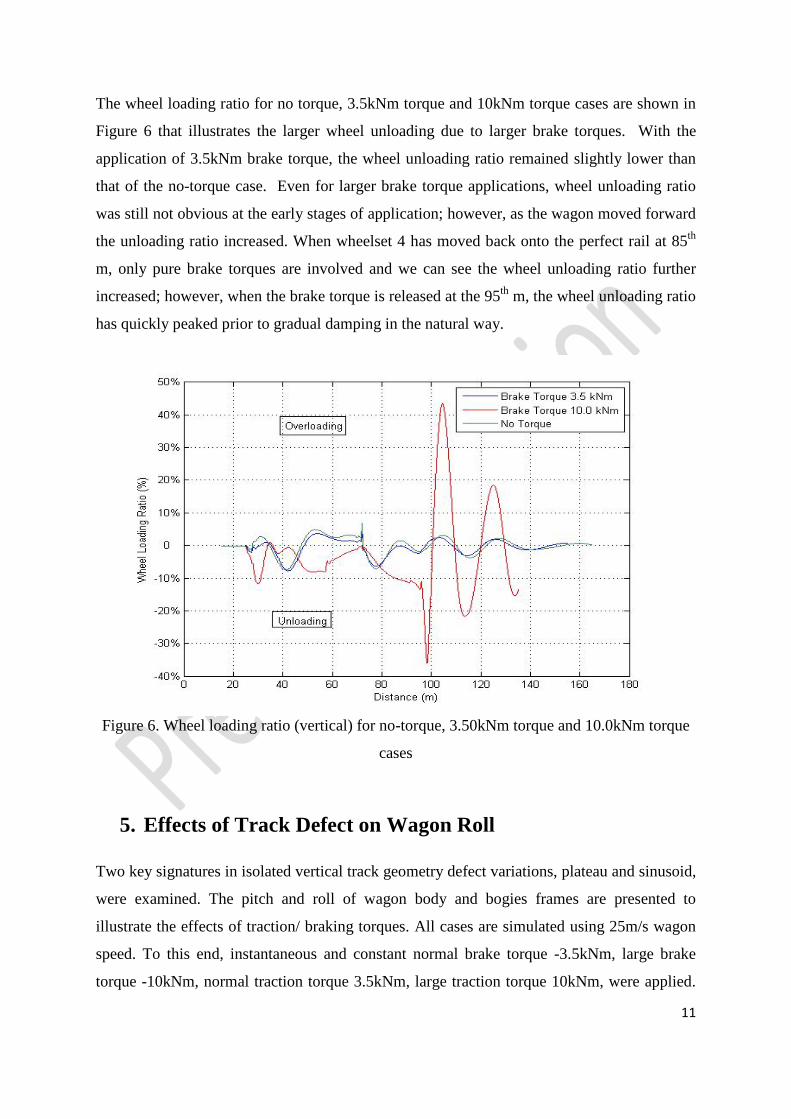
The wheel loading ratio for no torque, 3.5kNm torque and 10kNm torque cases are shown in
Figure 6 that illustrates the larger wheel unloading due to larger brake torques. With the
application of 3.5kNm brake torque, the wheel unloading ratio remained slightly lower than
that of the no-torque case. Even for larger brake torque applications, wheel unloading ratio
was still not obvious at the early stages of application; however, as the wagon moved forward
the unloading ratio increased. When wheelset 4 has moved back onto the perfect rail at 85th
m, only pure brake torques are involved and we can see the wheel unloading ratio further
increased; however, when the brake torque is released at the 95th m, the wheel unloading ratio
has quickly peaked prior to gradual damping in the natural way.
Figure 6. Wheel loading ratio (vertical) for no-torque, 3.50kNm torque and 10.0kNm torque
cases
5. Effects of Track Defect on Wagon Roll
Two key signatures in isolated vertical track geometry defect variations, plateau and sinusoid,
were examined. The pitch and roll of wagon body and bogies frames are presented to
illustrate the effects of traction/ braking torques. All cases are simulated using 25m/s wagon
speed. To this end, instantaneous and constant normal brake torque -3.5kNm, large brake
torque -10kNm, normal traction torque 3.5kNm, large traction torque 10kNm, were applied.

12
These torques were instantaneously applied when the leading wheelset of the front bogie
entered the irregularities and were held constant until the trailing wheelset of rear bogie left
the irregularities, at which time the torques were instantaneously removed. Although the
initail speed was set as 25m/s, these torques affected the wagon speed in a complex manner,
leading to final speed in the range of 19.6m/s to 29.3m/s for sinusoid cases and 7.8m/s (for
large brake case the wagon only ran 125 m rather than full 130m as the program was set to
run only 8 seconds for consistency) to 34.9m/s for plateau cases. It is recognised that sudden
application of such torques may not be practicable due to slackness in brake systems; as the
paper is not concerned with the simulation of full braking system, just the torques were
applied onto the wheelsets to demonstrate the ability of the model to handle application of
braking/ traction torques.
In the simulation for vertical track irregularity (Equation(2)), irk was set at 7 310−× m-1 and
ir∆ was studied as 5mm initially; in some cases the results of the 10mm defect size were also
presented to show some specific features.
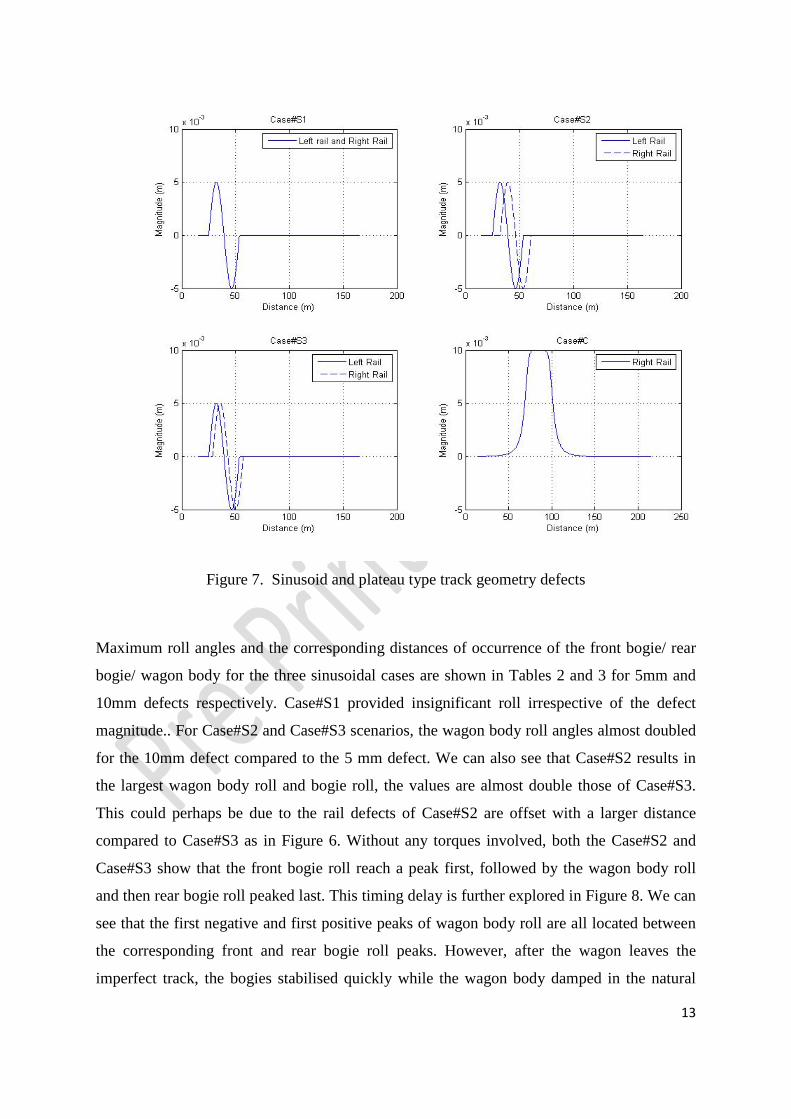
Three sinusoidal and one plateau defects (Figure 7) were considered in the simulation. These
four cases are termed as “Case#S1”/ “Case#S2”/ “Case#S3”/ “Case#C” respectively. It can
be noted that the plateau defect is longer (210m) than the sinusoid defects (160m). Thus the
duration of simulation has been carried out to sinusoid and cross level defects for 6s and 8s
respectively.
13
Figure 7. Sinusoid and plateau type track geometry defects
Maximum roll angles and the corresponding distances of occurrence of the front bogie/ rear
bogie/ wagon body for the three sinusoidal cases are shown in Tables 2 and 3 for 5mm and
10mm defects respectively. Case#S1 provided insignificant roll irrespective of the defect
magnitude.. For Case#S2 and Case#S3 scenarios, the wagon body roll angles almost doubled
for the 10mm defect compared to the 5 mm defect. We can also see that Case#S2 results in
the largest wagon body roll and bogie roll, the values are almost double those of Case#S3.
This could perhaps be due to the rail defects of Case#S2 are offset with a larger distance
compared to Case#S3 as in Figure 6. Without any torques involved, both the Case#S2 and
Case#S3 show that the front bogie roll reach a peak first, followed by the wagon body roll
and then rear bogie roll peaked last. This timing delay is further explored in Figure 8. We can
see that the first negative and first positive peaks of wagon body roll are all located between
the corresponding front and rear bogie roll peaks. However, after the wagon leaves the
imperfect track, the bogies stabilised quickly while the wagon body damped in the natural

14
manner. A more detailed wagon modelling would have provided a faster damping
characteristic. Due to Case#S1 having little effect on wagon roll, it is not further studied in
Figure 8.
Table 2. Wagon body/front bogie/rear bogie positive roll and the corresponding track
distance under irregularity of 5mm.
Front Bogie
( 310−× rad)
Dist
(m)
Rear Bogie
( 310−× rad)
Dist
(m)
Wagon Body
( 310−× rad)
Dist
(m)
Case#S1 N/A N/A N/A N/A N/A N/A
Case#S2 10.5 44.4 10.9 56.6 7.1 53.5
Case#S3 5.7 42.6 5.9 54.7 3.8 51.7
Table 3. Wagon body/front bogie/rear bogie positive roll and the corresponding track
distance under irregularity of 10 mm.
Front Bogie
( 310−× rad)
Dist
(m)
Rear Bogie
( 310−× rad)
Dist
(m)
Wagon Body
( 310−× rad)
Dist
(m)
Case#S1 N/A N/A N/A N/A N/A N/A
Case#S2 22.0 44.5 21.1 56.6 14.2 53.7
Case#S3 11.4 42.6 11.8 54.7 7.5 51.9

15
Figure 8. Front bogie/rear bogie/wagon body roll for Cases#S2 & #S3 for10mm defect
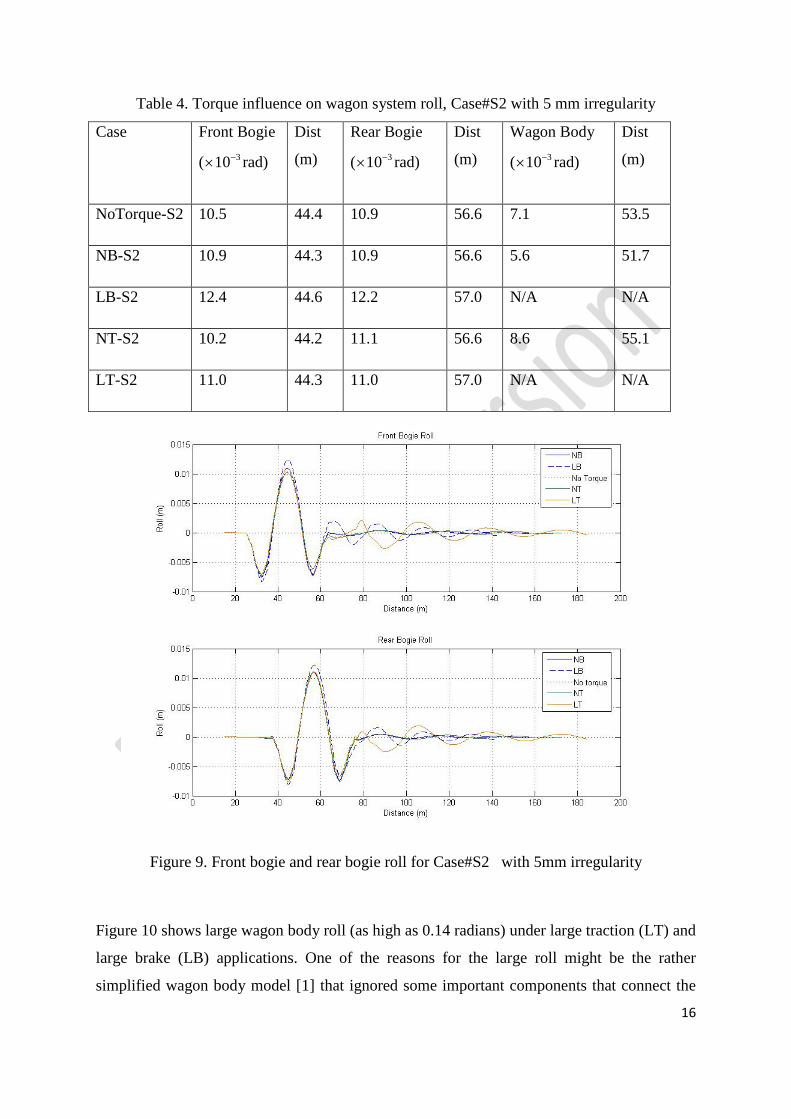
Table 4 presents the effects of the brake and traction torques applied during wheelset passage
over the 5mm irregularities (S2 type). In this table, NB stands for normal brake torque (-
3.50kNm), LB stands for large brake torque (-10.0kNm), NT stands for normal traction torque
(3.5kNm), and LT stands for large traction torque (10.0kNm).
Since the large brake and traction torques reduce the wagon body roll to negative values from
the beginning, it is meaningless to compare the initial position with the largest bogie roll
location. The bogie and wagon body roll are graphically shown in Figures 9 and 10
respectively. The torque generally has only limited effects on bogie roll. The large brake
torques generally increased the bogie roll while the traction effects induced far more complex
behaviour of bogies and wagon.
16
Table 4. Torque influence on wagon system roll, Case#S2 with 5 mm irregularity
Case
Front Bogie
( 310−× rad)
Dist
(m)
Rear Bogie
( 310−× rad)
Dist
(m)
Wagon Body
( 310−× rad)
Dist
(m)
NoTorque-S2 10.5 44.4 10.9 56.6 7.1 53.5
NB-S2 10.9 44.3 10.9 56.6 5.6 51.7
LB-S2 12.4 44.6 12.2 57.0 N/A N/A
NT-S2 10.2 44.2 11.1 56.6 8.6 55.1
LT-S2 11.0 44.3 11.0 57.0 N/A N/A
Figure 9. Front bogie and rear bogie roll for Case#S2 with 5mm irregularity
Figure 10 shows large wagon body roll (as high as 0.14 radians) under large traction (LT) and
large brake (LB) applications. One of the reasons for the large roll might be the rather
simplified wagon body model [1] that ignored some important components that connect the

17
wagon body with the frames of the bogies. For example, in freight trains, wagon body is
connected with the three-piece bogie through a flat centre bowl that is secured by a pin pivot.
This plate provides stiffness on all directions if contact occurs once gap clearance is closed
due to longitudinal translation or roll of components. The centre plate is attached to a sturdy
longitudinal beam that connects both bolsters. This beam is expected to prevent large roll of
bogie components. Gap elements will be required to accurately model these components and
the wagon model in [1] ignores these components and represent the connection between the
wagon body and bogie frames through a series of springs and dashpots only. Further, for ease
of demonstrating wagon body roll to the effects of brake/ traction torques, the wagon body
was considered only partly loaded (approximately 30t); a fully loaded wagon (120t) would
not have experienced such high roll. In spite of these limitations of the wagon model, the
interesting feature is that even without the constraints of centre bowl and the longitudinal
beam, the numerical simulation could provide results due to the wagon body maintaining
varying equilibrium positions due to existence of continuous flange contact.
Figure 10. Wagon body roll for Case#S2 with 5mm irregularity
Case studies with irregularity magnitude of 10mm have been carried out and the bogie and
wagon body roll are summarised in Table 5 and their responses are graphically shown in

18
Figure 11 and Figure 12 respectively. Wagon roll for the no-torque cases, exhibited linear
relationship with the irregularity magnitude (for example, with the defect magnitude
doubling, the roll angle doubled). When brake/traction torques are applied, this simple linear
rule was no longer valid as shown in Table 6. Little difference on the front bogie and rear
bogie roll (see Figure 11) can be seen among the normal brake, normal traction and no-torque
cases, but the larger brake/traction torques did make the bogie roll smaller in both positive
and negative values. Moreover, the large brake/traction torques have also produced the
smallest roll values which occur in advance along the track compared with the other three
cases. However, for no torque, normal brake and traction torque cases, the wagon/bogie roll
are still roughly doubled from 5mm case to 10mm cases.
Table 5 Torque influence on wagon system roll, Case#S2 with 10mm irregularity
Cases
Front Bogie
( 310−× rad)
Dist
(m)
Rear Bogie
( 310−× rad)
Dist
(m)
Wagon Body
( 310−× rad)
Dist
(m)
S2 22.0 44.5 21.1 56.6 14.2 53.7
NB-S2 22.5 44.4 22.2 56.6 11.7 51.5
LB-S2 13.2 42.8 12.8 55.2 N/A N/A
NT-S2 20.9 44.4 22.5 56.8 18.3 55.9
LT-S2 11.8 42.6 11.5 55.2 N/A N/A

19
Figure 11. Front bogie and rear bogie roll for Case#S2 with 10 mm defect
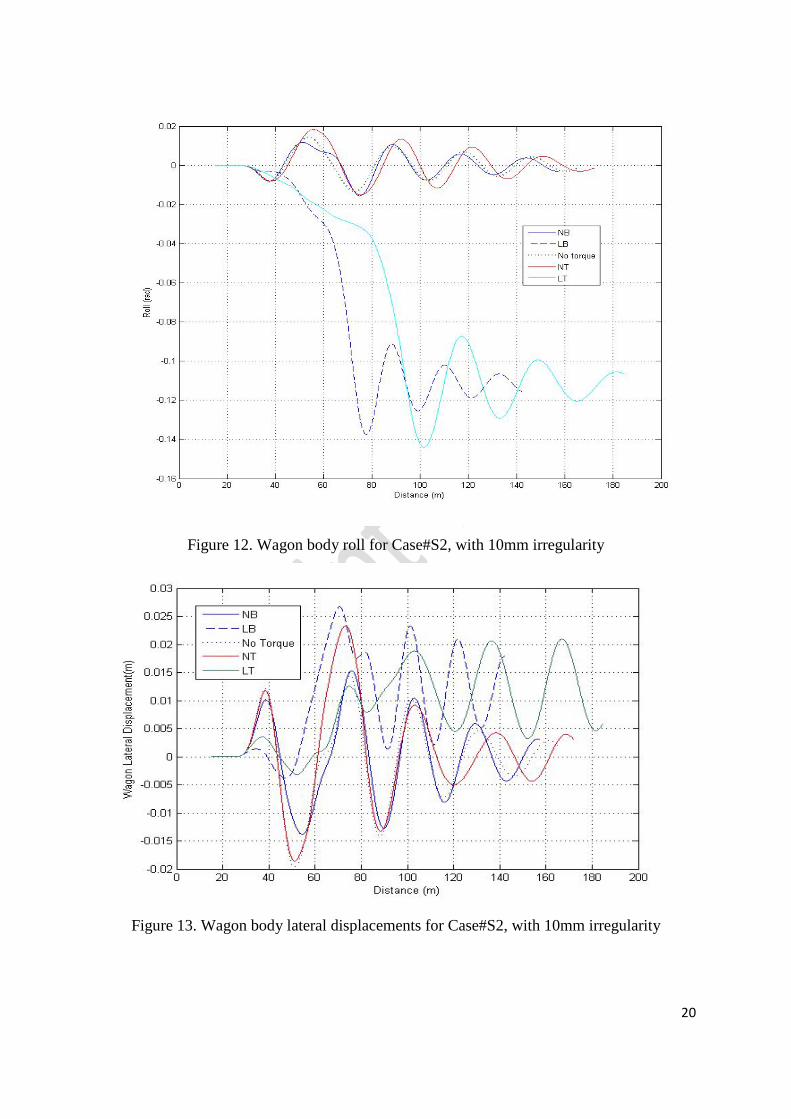
In Figure 12, the LB and LT torques increased the wagon body roll and restricted its
movement between -0.09 rad to -0.15 rad; this level being much higher in absolute terms
than that of the other three cases. This can be explained through Figure 13 that shows the
wagon lateral displacements. It is interesting to see that the LB and LT torques held the
wagon body to one side after both bogies peaked and the torques were released; the wagon
body then damped but maintained a higher level of lateral displacement than the balance
position.
20
Figure 12. Wagon body roll for Case#S2, with 10mm irregularity
Figure 13. Wagon body lateral displacements for Case#S2, with 10mm irregularity

21
Under cross level (see Figure 14), the large brake torque sustained considerably negative
wagon body roll while the large traction torque did not produce this effect; however, from the
100th m until the 160th m, the large traction torque did keep the wagon body roll negative,
until after the brake torque was released at the 155th m of travel. The NB and NT torque
cases did not cause any alarming body roll as the LB case. In both LB and LT Cases#S2 as
shown in Figure 11, the wagon body roll increased with the existence of torque, and after
torques were released at 76m, they both failed to return to its original balanced positions.
However, the cross level shows a different pattern: after torque was released, the LT returned
to the balanced position with the speed around 34.9m/s(125.6km/h) while such a recovery did
not occur with the LB case.
Figure 14. Wagon body roll for Case# C
The phenomenon of large wagon body roll under LT and LB torques shown in Figures 12 and
14 could be explained using the simplified modelling in [1] as was done for Figure 10. The
large roll of the wagon body occurred after the roll of both bogies peaked with the wagon
body failed to return to the initial position, but maintaining a new equilibrium position by
maintaining the flange contact even after the torques were released. In real wagons, after
22
peaking of both bogie rolls, the centre bowl and the longitudinal beam would have restored
the wagon to its initial equilibrium position rather than sustaining flange contact.
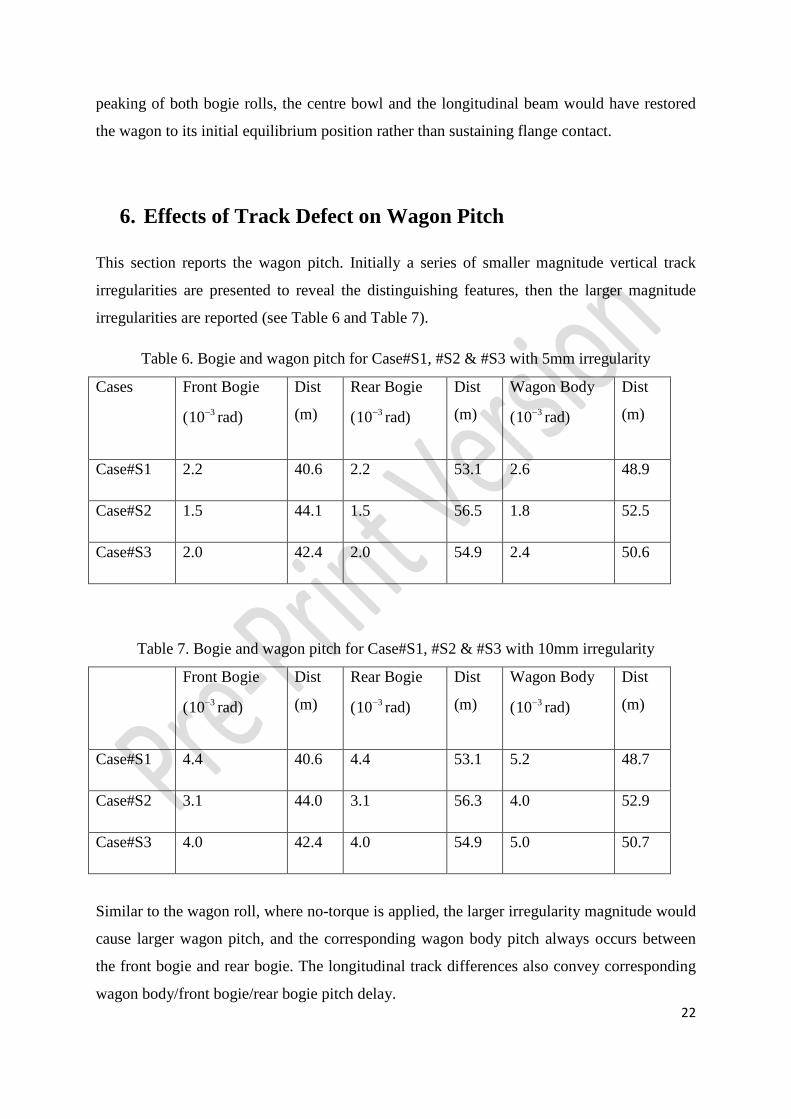
6. Effects of Track Defect on Wagon Pitch
This section reports the wagon pitch. Initially a series of smaller magnitude vertical track
irregularities are presented to reveal the distinguishing features, then the larger magnitude
irregularities are reported (see Table 6 and Table 7).
Table 6. Bogie and wagon pitch for Case#S1, #S2 & #S3 with 5mm irregularity
Cases
Front Bogie
( 310− rad)
Dist
(m)
Rear Bogie
( 310− rad)
Dist
(m)
Wagon Body
( 310− rad)
Dist
(m)
Case#S1 2.2 40.6 2.2 53.1 2.6 48.9
Case#S2 1.5 44.1 1.5 56.5 1.8 52.5
Case#S3 2.0 42.4 2.0 54.9 2.4 50.6
Table 7. Bogie and wagon pitch for Case#S1, #S2 & #S3 with 10mm irregularity
Front Bogie
( 310− rad)
Dist
(m)
Rear Bogie
( 310− rad)
Dist
(m)
Wagon Body
( 310− rad)
Dist
(m)
Case#S1 4.4 40.6 4.4 53.1 5.2 48.7
Case#S2 3.1 44.0 3.1 56.3 4.0 52.9
Case#S3 4.0 42.4 4.0 54.9 5.0 50.7
Similar to the wagon roll, where no-torque is applied, the larger irregularity magnitude would
cause larger wagon pitch, and the corresponding wagon body pitch always occurs between
the front bogie and rear bogie. The longitudinal track differences also convey corresponding
wagon body/front bogie/rear bogie pitch delay.

23
Torque influence on wagon system pitch is presented in Table 8.
Table 8. Torque influence on wagon system pitch, Case#S2, 5mm irregularity
Cases
Front Bogie
( 310−× rad)
Dist
(m)
Rear Bogie
( 310−× rad)
Dist
(m)
Wagon Body
( 310−× rad)
Dist
(m)
No Torque - S2 1.5 44.1 1.5 56.5 1.8 52.5
NB-S2 1.6 44.1 1.6 56.6 2.0 52.5
LB-S2 1.9 44.0 1.9 56.8 1.6 53.4
NT-S2 1.4 44.1 1.5 56.5 1.8 53.3
LT-S2 1.2 44.2 1.2 56.4 2.4 51.5
The maximum front bogie pitch and rear bogie pitch occur almost at the same longitudinal
distance (44.1 m for the front bogie; 56.5m for the rear bogie), indicating the predominance
of the track geometry profile onto the dynamic response signature. The peak values of front
bogie pitch and rear bogie pitch under brake torque are larger than the no-torque cases;
traction torques have the capability to reduce the wagon pitch and bogie pitches below the
no-torque cases. These characteristics were similar to the published graphics in [1]; therefore,
no further graphics shown.
Table 9 illustrates that the normal brake/traction does not influence either the maximum
bogie pitch (magnitude) or the corresponding track distance (location). However, similar to
the wagon body roll, for combinations of large brake/traction torques and larger magnitude
irregularities, the corresponding track distance of the maximum value of the bogie pitch was
ahead of other three cases and their values also were higher.

24
Table 9. Torque influence on wagon system pitch, Case#S2, 10mm irregularity
Cases
Front Bogie
( 310−× rad)
Dist
(m)
Rear Bogie
( 310−× rad)
Dist
(m)
Wagon Body
( 310−× rad)
Dist
(m)
No Torque - S2 3.1 44.0 3.1 56.3 4.0 52.9
NB-S2 3.2 44.1 3.2 56.4 3.8 52.5
LB-S2 4.3 42.2 4.4 54.9 3.9 51.4
NT-S2 3.0 43.9 3.0 56.4 4.0 53.9
LT-S2 3.6 42.4 3.7 54.9 5.3 87.8
7. Studies on the Effects of Worn Rail and Wheel Profiles
The profiles of the railhead and wheel tread change during operation due to natural wear; the
worn rail/wheel usually results in extra energy consumption, higher impact forces and
accelerated rail/wheel wear. Of great importance to study of the worn rail/wheel, is to spline
their profiles, which usually suffers from the resolution of the measured data. Technically, the
flange contact could be studied but larger inaccuracy may occur since the spline wheel profile
has singularity at flange. In this section, only the wheel lateral forces, wheelset slip and
wagon travel distances are reported due to worn rail/ worn wheel analyses; for ease of
understanding the data, either the rail or the wheel was considered worn – not both the rail
and the wheel in a single analysis.
7.1 Worn Rail Study
Figure 15 exhibits the wheelset on the center of narrow gauge track (1067mm) used in
Australia, with the nominal distance between the wheel and the rail of 1140mm. For the new
wheel - rail contact point positions, the nominal width and height were 570mm (half of
1140mm shown in Fig. 15) and 0mm respectively; whereas, for the worn rail - new wheel

25
contact, the contact point would have a different width and height values, dependent on their
relative worn intensities.
Figure 15. Wheelset on narrow gauge track
A measured worn rail is shown in Figure 16, which is typical of railhead wear (also known as
table wear). Rails are normally fitted with a cant of 1 in 20 inclination. With the help of
Spline2 V6.0 software [22], the worn rail profile spline representation was generated using a
fifth order polynomial. Derivatives of the rail profile are fitted with relatively smooth curves
that are continuous up to the third derivatives.
Figure 16. Measured worn rail

26
In order to examine the effect of the worn rail to brake torques, two sets of brake torques,
Sequenece#1 and Sequence#2 as shown in Figure 17, were applied on each wheelset from
t=1 second to t=5 seconds. The initial speed of the wagon was set as 25m/s as used in
previous case studies. Given the new wheel radius 0.425m, the initial wheelsets angular
velocity would be 58.8 rad/s.
Figure 17. Input brake torque
The new rail/new wheel case studies are termed as Case#nr1 and Case#nr2 respectively for
the application of Sequenece#1 and Sequence#2 brake torques (Fig. 17). The worn rail/new
wheel case studies are termed as Case#wr1 and Case#wr2 respectively for the application of
Sequenece#1 and Sequence#2 brake torques.
Figure 18(a) shows wheel lateral forces under gentle brake torque (Sequence #1) application
for both the new and the worn rails. The wheel lateral force decreases with the increase in
brake torque (refer to Figure 18(a) and Figure 17, sequence#1) and reaches its peak value at
the 3rd second where the brake torque was maximum. Then the wheel lateral force increased
to the original value after brake torque was released. Beyond the brake application time t=1

27
second to t=5 seconds, the wheel lateral force remained steady. For the larger brake torque
application sequence#2 (see Figure 17), Figure 18 (b) shows a distinct feature. After the
wheel lateral forces achieved their peak at t=3seconds, it did not remain steady as in Figure
18(a) for Sequence#1, even though the brake torque was released at t=5seconds; however, no
flange contact was observed, which re-confirmed that the changes to the lateral force (Figure
18) was solely due to the effects of brake torque (Fig. 17). This can be seen from the lateral
force diagram for the left wheel of the same wheelset plotted in Figure 19; only Sequence#2
is shown. From Figure 18(b) and Figure 19, equilibrium in the lateral direction can be
observed – without any need for flange contact.
Figure 18. Lateral forces of right wheel of the first wheelset:rail cases

28
Figure 19. Lateral forces of left wheel of the first wheelset: rail cases, Sequence#2
The difference between the angular velocity of the wheel and the corresponding longitudinal
velocity leads to wheel slip. In [19], the slip rate calculated was about 5%, but the brake
torque applied to the wheelset was constant (5,000 Nm) and the total mass was much smaller.
The manner in which the brake torques were applied (Figure 17) in this paper is more
complex than the treatment in [19]: however an approximate calculation can confirm that the
slip rate for the cases considered in this paper is similar that published in [19]. For example,
the initial speed of 25.0m/s at t=1second at the commencement of brake torque has reduced to
22.3032m/s at t=5second when the brake torque was released; this represents an average
deceleration over the four seconds of brake application of 0.6742m/s2 (which includes slip).
By considering the average torque of 3000Nm (for cases #nr1 and #wr1, see Figure 17), the
total torque on the wagon system applied to the four wheelsets would be 12,000Nm. Using
the mass of the wagon (wagon body (30t) + two bogie frames (2 × 2.5t) + four wheelsets (4 ×
1.12t)) as 39,480kg and the radius of the wheels as 0.425m, the deceleration can be worked
out as (12,000/(39480×0.425)) = 0.7152m/s2, which shows the computer model predicted
deceleration (0.6742m/s2) is approximately 5.7% smaller. Therefore, it can be claimed that
the slip under the brake torque sequence#1 (Figure 17) is approximately 5.7%. Further
results from the analyses are shown numerically in Table 10, which lists the actual wheelset
rotation angle, the actual travel distance, and the no slip travel distance, for new rail and worn
rail cases. The actual travel distance (m) and the wheelset rotation angle (radians) were
obtained from the results of the analysis program. The no-slip travel distance was calculated
by multiplying the wheelset rotation angle with the wheel radius (0.425m). The results show
that the worn rail marginally increase the slip and the increase in slip is more pronounced for

29
severe brake application. Note the reported distance is the total distance travelled that
includes 2 seconds of no torque and 4 seconds brake torque travel time.
.Table 10. Travel distances for the new rail and worn rail
Case Wheelset
rotation
angle (rad)
No-slip travel
distance (m)
Actual travel
distance (m)
Slip
(mm)
Effect of
worn rail
(mm)
Case#nr1 333.6857 141.8164 141.8556 39.2 +0.255%
Case#wr1 333.6807 141.8143 141.8536 39.3
Case#nr2 320.8581 136.3647 136.4413 76.6 +0.261%
Case#wr2 320.8531 136.3626 136.4394 76.8
Figure 20 shows the wheelset angular velocity difference for new rails. As identified in Table
10 and Figure 18, this rail profile is only marginally worn and hence the slip rate is not much
different between the new and worn rail cases. It can be seen that the slip occurs in a fraction
of second and it increases with the increasing braking torque. For Case#wr1, it shows
approximately linear proportional increases with a maximum value 0.0476. For Case#wr2, it
shows nonlinear characteristics with a maximum value 0.1072.
Figure 20. Angular velocity difference of wheelset under normal and severe brake torques

30
7.2 Worn Wheel Study
A measured original worn wheel is shown in Figure 21. Unlike the rail profile, derivatives of
the wheel profile were not so smooth especially at the flange area; therefore only the smooth
wheel tread part data wereused in the simulation. Unlike the worn rail (Figure 16), the wheel
considered (Figure 21) is seriously worn and is defined as ‘hollow-worn’ with 2.9mm wear.
Figure 21. The measured profile of the worn wheel used (Y axis dimensions shown
horizontally and Z axis dimensions shown vertically. All units: mm)
The new wheel/new rail, case studies Case#nw1 and Case#nw2 correspond to Sequenece#1
and Sequence#2 respectively are already discussed in Table 10; the worn wheel/new rail, case
studies Case#ww1 and Case#ww2 correspond to Sequenece#1 and Sequence#2 respectively
are new and specific to this Section 7.2.
Figure 22 exhibits the lateral forces of right wheel of the first wheelset. In Figure 22 (a),
during the brake torque application from t=1 to t=3 seconds, both the new wheel and the
worn wheel generally have shown linear reduction; however, after brake torque is released at
5th second, worn wheel has shown non-steady state while the new wheel has remained steady.
Turning attention to Figure 22 (b), even at the first 2 seconds of brake application, the worn
wheel exhibits non-linear characteristic, after t=5 seconds, the situation has remained similar
to the Case#ww1. The forces jumped at the end of 6th second in Case#ww1 and the flange
contact force was expected to push the wheel back to conventional position. However, as
-10
0
10
20
30
40
50
60
70
0 20 40 60 80 100 120 140 160
NR Freight Worn/Hollow (2.9 mm) Wheel 1

31
stated previously, the flange area of wheel was not modelled, so there was no flange contact
force to push the wagon back to equilibrium position. The computer program failed to
converge shortly because no contact points (in flange area) could be found. The reduction in
the lateral force, due to no-flange contact, is solely attributed to the characteristics of teh
applied brake torque.
Figure 22. Lateral forces of right Wheel of the first wheelset—wheel cases
The travel distance is summarised in Table 11. The worn wheels have shown worse
performance on wheel lateral forces; however, the corresponding travel distance was the
shortest amongst the cases studied. This phenomenon confirms the operational matters where
the drivers report better vehicle stability with hollow worn wheels. The severely worn wheel
considered in this section has exhibited pronounced effect (-16.58% and -16.71%) of
reduction in slip compared to their respective new wheel cases (Table 11).

32
Table 11. Travel distances for the new wheel and worn wheel
Case Wheelset
rotation
angle (Rad)
No slip
travel
distance
(m)
Actual
travel
Distance
(m)
Slip
(mm)
Effect of Worn
Wheel (%)
Case#nw1** 333.6857 141.8164 141.8556 39.2 -16.58%
Case#ww1 333.6952 141.8205 141.8532 32.7
Case#nw2** 320.8581 136.3647 136.4413 76.6 -16.71%
Case#ww2 320.8823 136.3750 136.4388 63.8
** these results are as same as Case#nr1, Case#nr2 since the rail and wheel profile are same.
8. Conclusions
A fixed coordinate system formulation for the rigid multi-body rail wagon dynamics
presented earlier by the authors is reviewed. The formulation employs a three-dimensional
contact model with full parameterisation of the surfaces of the two contacting bodies. The
benefit of the formulation is its ability to determine roll of the wagon components, which
other standard commercial packages cannot determine. Further the model does not require
setting up of speed profile as a priori since the speed is determined as a result of the applied
brake/ traction torque.
Several numerical examples were studied to examine the effects of brake/ traction
torque on tracks with various types and levels of irregularities. The following conclusions
were made:
o The wagon yaw, pitch and roll exhibit a positive propositional relationship to the track
defect amplitude.
o Large brake (LB) torque results in large wheel unloading ratio to the track lateral
irregularity; wagons under normal level of braking or no-torque (steady state case) do
not suffer wheel unloading due to track irregularities considered in this paper. =
o With the increase in the longitudinal phase difference of the sinusoid irregularity
between the left/right rails (cross level), the wagon roll increases. Cross level defects
also determines when the largest wagon body/bogie roll is likely to occur.

33
o The sinusoidal track irregularity effect on wagon roll is more severe than the cross
level irregularity induced wagon roll in the model consider in this paper.
o The normal torques generally do not induce bogie roll; however, large external
torques can affect the wagon body roll.
o Large brake torque generally increases the absolute value of the wagon body roll
whilst the traction effects induce far more complex dynamics of bogies and wagon
body.
o If no brake torque is applied on the worn wheel/rail, steady wheel lateral forces can
still be achieved.
References
1. Z. Zhang, and M. Dhanasekar, Dynamics of railway wagons subjected to
braking/traction torque, Vehicle Syst. Dyn. 47 (3) (2009), pp. 285 – 307.
2. M. Mcclanachan, C.Cole, D.Roach, AND B.Scown, An Investigation of the Effect of
Bogie and Wagon Pitch Associated with Longitudinal Train Dynamics, The
Dynamics of Vehicles on Roads and on Tracks, Vehicle Syst. Dyn. Suppl.(33) (1999),
pp. 374-385.
3. D. Climb, J. Wagner, AND A.Baviskar, Investigation of active torsion bar actuator
configurations to reduce vehicle body roll. Vehicle Syst. Dyn. 44 (9), (2006) pp.719-
736.
4. R. V. Dukkipati, Vehicle Dynamics, Boca Raton, Fla, CRC Press, 2000.
5. A. A. Shabana, AND J. R. Sany, A Survey of Rail Vehicle Track Simulation and
Flexible Multibody Dynamics. Nonlinear Dyn. 26(2) (2001), pp.179-210.
6. J. Pombo, J. Ambrósio, AND M.Silva, A new wheel–rail contact model for railway
dynamics, Vehicle Syst. Dyn., 45 (2) (2007), pp165-189.
7. G. X. Chen, AND X.C. Jin, A Simulation Study on Influence of Periodic Irregularities
on Derailment safety of a Freight car on Tangent Track, Proceedings 7th International
Heavy Haul Conference, Brisbane, Australia, 2001, P.533.
8. D. Li, A. Meddah, K. Hass, AND S. Kalay, Relating track geometry to vehicle
performance using neural network approach, I Mech E Part F: J. Rail and Rapid
Transit, 220 (3)(2006), pp.273-281.

34
9. M.J.M.M. Steenbergen, The role of the contact geometry in wheel–rail impact due to
wheel flats, Vehicle. Syst. Dyn. 45(12) (2007), pp. 1097-1116.
10. M.J.M.M. Steenbergen, The role of the contact geometry in wheel-rail impact due to
wheel flats: Part II, Vehicle Syst. Dyn, 46(8) (2008), pp.713 -737.
11. M. A.Murtaza, AND S.B.L. Garg, Parametric study of railway air brake system, I
Mech E Part F: J. Rail and Rapid Transit, 206(1992), pp.21-36.
12. T.Piechowiak, Pneumatic train brake simulation method, Vehicle Syst. Dyn. 47(12)
(2009), pp.1473-1492.
13. G. Cocci, P. Presciani, A.Rindi, AND G. P. J. Volterrani, Railway wagon model with
anti slip braking system. 16th European MDI user conference. Berchtesgaden,
Germany, 2001.
14. M.Chou, AND X. Xia, Optimal cruise control of heavy-haul trains equipped with
electronically controlled pneumatic brake systems, Control Engineering Practice, 15
(5)(2007), pp.511-519.
15. B. J. Olson, Nonlinear Dynamics of Longitudinal Ground Vehicle Traction,
Mechanical Engineering. Michigan, USA, Michigan State University, 2001.
16. M. Malvezzi, P. Presciani, B. Allotta, AND P. Toni, Probabilistic Analysis of Braking
Performance in Railways, I Mech E Part F: J. Rail and Rapid Transit, 217(3) (2003),
pp.149-165.
17. M. Durali, AND B. Shadmehri, Nonlinear Analysis of Train Derailment in Severe
Braking, J. of Dyn. Syst., Measurement, and Control, 125(1) (2003), pp.48-53.
18. C. Cantoni, R. Cesarini, G. Mastinu, G. Rocca, R.Sicigliano, Brake comfort - a
review, Vehicle Syst. Dyn. 47(8) (2009), pp.901 -947.
19. Y. Handoko, AND M. Dhanasekar, An Inertial Reference Frame Method for the
Simulation of Effect of Longitudinal Force to the Dynamics of Railway Wheelsets,
Nonlinear Dyn. 45(3-4) (2006), pp.399-425.
20. Y. Handoko, AND M. Dhanasekar, Wheelset Skid in Railway Bogies, I Mech E Part
F: J. Rail and Rapid Transit, 221(2) (2007), pp237-245.
21. Y. Handoko, Investigation of the Dynamics of Railway Bogies Subjected to Traction
/Braking Torque, Ph.D dissertation., Center for Railway Engineering. Central
Queensland University, Australia, 2006.
22. B. J. Thijse, Spline 2 V6.0 Software, Delft University of Technology, Laboratory of
Material Science, Delft, 2002.