dynamics of respiratory symptoms during infancy and
TRANSCRIPT

Dynamics of respiratory symptoms duringinfancy and associations with wheezing atschool age
Jakob Usemann 1,2,7, Binbin Xu1,7, Edgar Delgado-Eckert1, Insa Korten1,2,Pinelopi Anagnostopoulou2, Olga Gorlanova1, Claudia Kuehni 3,Martin Röösli4,5, Philipp Latzin 1,2 and Urs Frey,1 on behalf of the BILD studygroup6
Affiliations: 1University Children’s Hospital Basel (UKBB), Basel, Switzerland. 2Paediatric RespiratoryMedicine, Dept of Paediatrics, Inselspital, Bern University Hospital, University of Bern, Bern, Switzerland.3Institute of Social and Preventive Medicine, University of Bern, Bern, Switzerland. 4Swiss Tropical and PublicHealth Institute Basel, Basel, Switzerland. 5University of Basel, Basel, Switzerland. 6For a list of the membersof the BILD study group see the Acknowledgements section. 7These authors contributed equally.
Correspondence: Urs Frey, University Children’s Hospital Basel, Spitalstrasse 33, 4056 Basel, Switzerland.E-mail: [email protected]
ABSTRACT Children with frequent respiratory symptoms in infancy have an increased risk for laterwheezing, but the association with symptom dynamics is unknown. We developed an observer-independent method to characterise symptom dynamics and tested their association with subsequentrespiratory morbidity.
In this birth-cohort of healthy neonates, we prospectively assessed weekly respiratory symptoms duringinfancy, resulting in a time series of 52 symptom scores. For each infant, we calculated the transitionprobability between two consecutive symptom scores. We used these transition probabilities to construct aMarkov matrix, which characterised symptom dynamics quantitatively using an entropy parameter. Usingthis parameter, we determined phenotypes by hierarchical clustering. We then studied the associationbetween phenotypes and wheezing at 6 years.
In 322 children with complete data for symptom scores during infancy (16864 observations), weidentified three dynamic phenotypes. Compared to the low-risk phenotype, the high-risk phenotype,defined by the highest entropy parameter, was associated with an increased risk of wheezing (odds ratio(OR) 3.01, 95% CI 1.15–7.88) at 6 years. In this phenotype, infants were more often male (64%) and hadbeen exposed to environmental tobacco smoke (31%). In addition, more infants had siblings (67%) andattended childcare (38%).
We describe a novel method to objectively characterise dynamics of respiratory symptoms in infancy,which helps identify abnormal clinical susceptibility and recovery patterns of infant airways associatedwith persistent wheezing.
@ERSpublicationsUnsupervised analysis of symptom dynamics during infancy identifies subjects susceptible topersistent airway disease http://ow.ly/r9xz30lDpHB
Cite this article as: Usemann J, Xu B, Delgado-Eckert E, et al. Dynamics of respiratory symptomsduring infancy and associations with wheezing at school age. ERJ Open Res 2018; 4: 00037-2018[https://doi.org/10.1183/23120541.00037-2018].
Copyright ©ERS 2018. This article is open access and distributed under the terms of the Creative Commons AttributionNon-Commercial Licence 4.0.
This article has supplementary material available from openres.ersjournals.com
Received: March 05 2018 | Accepted after revision: Aug 28 2018
https://doi.org/10.1183/23120541.00037-2018 ERJ Open Res 2018; 4: 00037-2018
ORIGINAL ARTICLEPAEDIATRIC PULMONOLOGY

IntroductionWheezing disorders in early childhood are a major health issue due to their high prevalence [1] andmethods to identify infants at risk for subsequent asthma are therefore needed. Exposure to host factors(e.g. sex and maternal atopy) and environmental risk factors (e.g. childcare, siblings, environmentaltobacco smoke (ETS) and air pollution) influence the incidence and duration of respiratory symptomsduring infancy [2, 3], and are associated with wheezing episodes during childhood [4]. In clinical practice,assessing risk factors, estimating the frequency of respiratory symptoms and examining symptom patterns(e.g. episodic versus persistent symptoms) [5] may help identify infants at risk for later asthma.
The pattern of symptom deterioration and recovery may be especially informative, as it is determined bythe symptom dynamics that a subject undergoes during a given period of time. While it is known thatpersistent wheeze in infants is more closely associated with later asthma and reduced lung function thanepisodic wheeze [5, 6], no previous study has attempted to characterise symptom dynamics in anobserver-independent manner, or to estimate their association with persistent respiratory symptoms atschool age.
We hypothesise that symptom dynamics are not only determined by exposure to risk factors related toairway infections (e.g. siblings and childcare), but also by host factors and exposure to ETS or airpollution. The symptom dynamics may thus contain information on susceptibility of the airways toinfectious triggers. This hypothesis was supported by the previous study of STERN et al. [7], in whichinfants exposed to higher air pollution levels recovered more slowly from viral infections than those withlower exposure levels.
In order to quantify symptom dynamics, we adapted a Markov matrix approach [8]. Previous studies useda Markov model to study the trajectory of asthma severity [9] and asthma control [10]. We took a similarapproach by studying the probabilities of transition between different respiratory symptom states using aMarkov matrix and further characterised this matrix using the Shannon entropy [11]. Utilising thismeasure of disorder, we quantitatively characterised the pattern of symptom deterioration and recoverywith one single number.
Using this novel method, our aim was to characterise the symptom dynamics of respiratory symptomscores during infancy, assessed weekly for each infant. We tested whether we could identify a symptomdynamic phenotype of infants with higher risk for persistent wheezing and atopic disease (primaryoutcomes), and allergic sensitisation, lung function measurements and exhaled nitric oxide fraction (FeNO)measurements (secondary outcomes) at school age.
Secondly, in order to facilitate the comparison of this study to previous studies [6, 12, 13], which relied onthe total number of infants’ symptoms only, we defined similarly sized “reference phenotypes” based onthe total number of weeks with respiratory symptoms. We then compared dynamic phenotypes andreference phenotypes relative to the above outcome measures at school age. Lastly, we explored if and howspecific dynamic symptom phenotypes are influenced by host factors and environmental risk factors.
MethodsStudy designIn the Basel–Bern Infant Lung Development (BILD) birth-cohort study [14], we prospectively assessedweekly respiratory symptom scores (states 0–4) [15] during infancy, resulting in 52 consecutiveobservations. We used these symptom scores to construct a Markov matrix for each infant. The entries inthis matrix are the empirical probabilities of transitioning from any given symptom score to any otherwithin a week’s time. These Markov matrices were further characterised using one single quantitativemeasure, namely the average Shannon entropy.
We first tested whether we could identify symptom dynamics phenotypes based on this entropy parameterusing an unsupervised analysis. We defined similarly sized “reference phenotypes” based on the totalnumber of symptom weeks during infancy. Next, we compared associations between symptom dynamicsphenotypes and reference phenotypes with wheezing and atopic disease at 6 years (primary outcomes).Allergic sensitisation, lung function measurements and FeNO measurements were secondary outcomes.Lastly, we compared the distribution of risk factors across phenotypes.
Study participantsUnselected, healthy term-born neonates were recruited antenatally in Bern and Basel, Switzerland [14].Between 1999 and 2015, 369 children from Bern were invited for a follow-up. The Ethics Committees ofBern and Basel approved the study. Written informed consent was obtained from parents beforeenrolment.
https://doi.org/10.1183/23120541.00037-2018 2
PAEDIATRIC PULMONOLOGY | J. USEMANN ET AL.

Exposure: respiratory symptoms during infancyDuring the first year of life, research nurses called the parents weekly to assess respiratory symptoms usingstandardised symptom scores with four levels of severity (table 1) [3, 15]. “Weeks with any respiratorysymptom” were defined as the total number of weeks a child had a respiratory symptom independent oftype or severity, while “weeks with severe respiratory symptoms” were defined as a symptom score of threeor more (e.g. general practitioner (GP) consultation, as noted previously) [3, 15].
Markov matrices in assessing the dynamics of respiratory symptomsWe used a Markov model approach to examine dynamic behaviour between consecutive symptom scores.We assessed transitions between different levels of symptom scores ranging from healthy (score 0) to mostsevere (score 4). For each symptom state (i.e. initial state, first time point), we counted how often atransition to any other state (i.e. target state, second time point) occurred, as assessed during thesubsequent week. For each infant, this count information was displayed in a 5×5 matrix (verticalaxis=initial state and horizontal axis=target state). These counts were absolute frequencies, which wereused to calculate relative frequencies for each transition (figures 1a–c). From this so called Markov matrix[8], we calculated the average Shannon entropy [16] of the empirical conditional probability distributionsencoded in each row. Further information on the mathematical approach is provided in figure 2 and theonline supplementary material.
Risk factorsWe used a standardised questionnaire to assess pre- and postnatal exposure to risk factors for respiratorysymptoms during infancy or asthma development [3]. Parental atopic disease was defined if any of thefollowing was present: self-reported or doctor-diagnosed allergic asthma, history of allergic rhinitis, oratopic dermatitis. Maternal asthma was defined as doctor-diagnosed or self-reported. Maternal educationwas categorised as low (3 years of secondary education) or high (⩾4 years of secondary education).Duration of breastfeeding (exclusive or nonexclusive) was assessed weekly and binary-coded (<26 weeks or⩾26 weeks).
Outcomes: respiratory and allergic diseases at 6 yearsAsthma and allergy were assessed by an adapted International Study of Asthma and Allergies inChildhood (ISAAC) questionnaire. We chose the outcomes “any wheezing” (wheezing between one and6 years) and “current wheezing” (wheezing over the past 12 months before follow-up). Atopic disease wasdefined as allergic rhinitis, allergic asthma, or atopic dermatitis. Allergic sensitisation was assessed using askin-prick test (SPT), determined to be positive if a wheal diameter in any of the tested aeroallergens wasgreater than in a positive control [14]. Spirometry was performed according to guidelines [17]. Forcedexpiratory volume in 1 s (FEV1), forced vital capacity (FVC), FEV1/FVC ratio and forced expiratory flowat 25–75% of FVC (FEF25–75%) were expressed as z-scores [18]. We measured online FeNO according tocurrent guidelines [19].
Statistical analysisEntropy is a measure of disorder within a dynamic system and higher entropy values correspond to moreirregularity [11]. The higher the fluctuation between many different respiratory symptoms, the higher is theentropy. For each infant, we calculated the average Shannon entropy [20] over the rows of the Markovmatrix, which provided a quantitative measure of the irregularity patterns of symptom deterioration andrecovery. Ward’s hierarchical clustering [21] was performed to identify phenotypes based on the entropy.
TABLE 1 Respiratory symptom score and associated day and night-time symptoms
Symptomscore
Symptoms (cough, wheeze, or breathing difficulty)
Day time Night time
0 None None1 Slight; no treatment given Slight; sleep not disturbed2 Required treatment but no outside help Sleep disturbed once; no help required3 Severe; required help from GP Sleep disturbed more than once or child needed help4 Very severe; admitted to hospital Sleep very disturbed or GP called
GP: general practitioner. Reproduced from [15] with permission from the publisher.
https://doi.org/10.1183/23120541.00037-2018 3
PAEDIATRIC PULMONOLOGY | J. USEMANN ET AL.

The optimal number of clusters and thereby of phenotypes was determined by the majority of indices [22].We defined similarly sized “reference phenotypes” by the frequency distribution of the total number ofweeks with respiratory symptoms during infancy. Using logistic regression, we studied the association ofsymptom dynamic phenotypes, reference phenotypes and asthma risk factors with outcomes. For theoutcomes any wheezing, current wheezing, atopic disease and positive SPT, analyses were adjusted for sex,maternal education, maternal asthma, ETS exposure, childcare, and siblings. FeNO was additionally adjustedfor hay fever and inhaled corticosteroid (ICS) use. For lung function, we adjusted for maternal education,maternal asthma, ETS exposure, childcare and siblings [23]. We used Chi-squared and Kruskal–Wallis teststo compare characteristics across phenotypes and accounted for multiple testing. We used the weightedkappa-statistic to compare agreement between symptom dynamic phenotypes and reference phenotypes.
For sensitivity analyses, we repeated the analysis in infants who had one or more episodes with a symptomscore of three or more and also within an additional, independent sample from our cohort of 242 infants.To explore whether the entropy distribution was an artefact of our analysis, we re-categorised thesymptom states, simulated data and perturbed the existing data. Furthermore, we assessed the robustnessof our findings after correcting for unobserved events. In particular, we theoretically explored therepercussions of observing more severe respiratory symptoms.
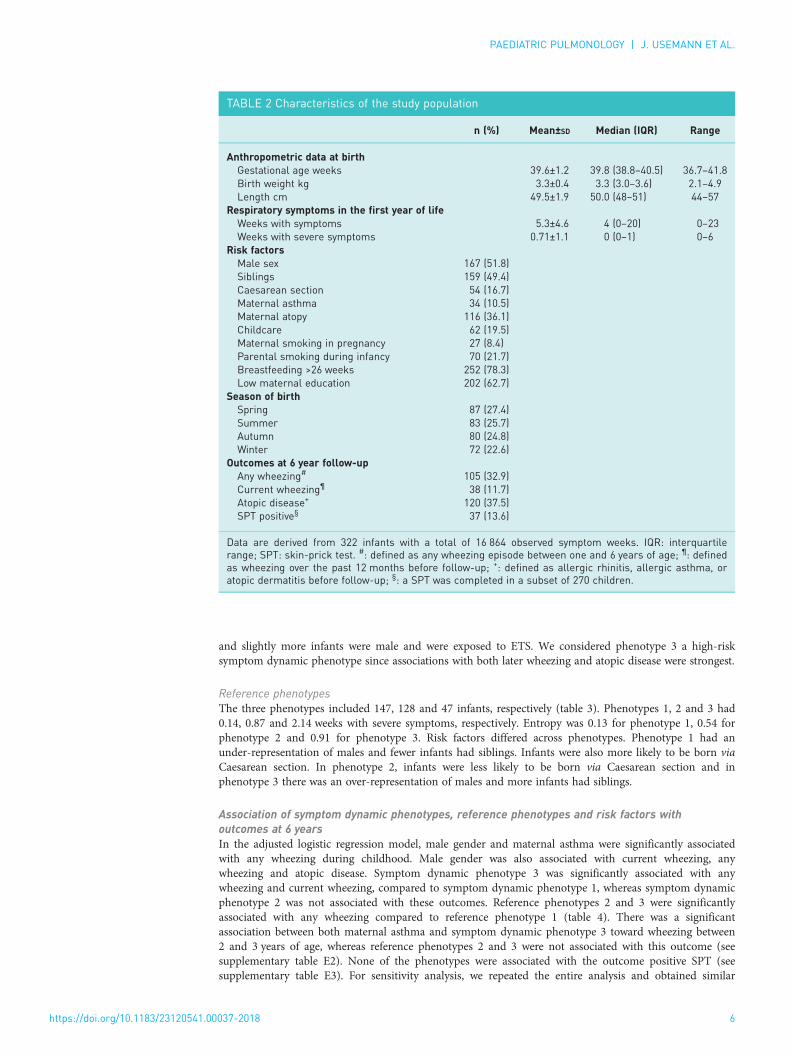
ResultsFrom 369 eligible subjects, 322 (87%) were studied (see supplementary figure E1), each having ⩾50 weeksof symptom series during infancy and complete data on risk factors and outcomes (table 2). Demographicdata and distribution of respiratory symptoms did not differ between infants followed-up and those lost tofollow-up. With respect to risk factors, infants lost to follow-up were more frequently exposed to ETS andwere less breastfed (see supplementary table E1).
Distribution of respiratory symptomsIn infants followed-up, we had information for 16864 person–weeks. The number of weeks with anyrespiratory symptom was determined (on average) as median 4 weeks (range 0–23 weeks). In contrast,severe symptoms were rare at median 0 weeks (range 0–6 weeks). The distribution of all symptom states isshown in figure 3.
4a)
b) c)
3
2
1
00 2 4 6 8 10 12 14 16
Init
ial
sta
te 0
–4
Target state 0–4 Target state 0–4
Init
ial
sta
te 0
–4
18 20 22 24 26
Weeks during the first year of life
Markov matrix written in terms of the absolute
numbers of transitions observed
4
3
2
1
0
1
0
0
2
26
0
0
2
1
6
2
1
0
3
1
1
0
2
0
0
2
2
1
3
0
0
0
0
1
4
4
3
2
1
0
100
0
0
18.2
86.7
0
0
40
25
54.5
6.7
1
0
60
25
9.1
0
2
0
0
50
18.2
3.3
3
0
0
0
0
3.3
4
Markov matrix written in terms of the relative
frequencies (in percentage) of transitions observed
28 30 32 34 36 38 40 42 44 46 48 50 52
Sym
pto
m s
core
FIGURE 1 Distribution of respiratory symptom states during infancy of one infant and corresponding Markov matrices. Panel (a) shows theTemporal pattern of respiratory symptom scores during the first year of life for one infant. We assessed transitions between different levels of thesymptom scores (state 0: healthy state, symptom score 0; states 1–4: symptomatic states, symptom scores 1–4). For each symptom state (i.e.initial state, 1st time point), we counted how often a transition to any other state (i.e. target state, 2nd time point) occurred, as assessed duringthe subsequent week. This count information is displayed in a 5×5 matrix. Absolute values are displayed in panel (b), whereas the correspondingrelative frequencies are displayed in panel (c).
https://doi.org/10.1183/23120541.00037-2018 4
PAEDIATRIC PULMONOLOGY | J. USEMANN ET AL.

Dynamics of respiratory symptoms assessed by the Markov matrixThe dynamic patterns of respiratory symptoms for two infants are shown in figure 2. Both had the samenumber of symptom weeks and the same distribution of symptom scores, but different patterns for theMarkov matrix landscape. The shape of the landscape as characterised by a single entropy parameterdiffered as well. Infant 1 (figures 2a–c) had an entropy of 0.58 versus infant 2 (figures 2d–f ) who had anentropy of 0.70. The higher entropy value for infant 2 indicates higher fluctuation between respiratorysymptom scores compared to infant 1.
Outcomes at 6 yearsFrom 322 children followed-up, 105 (32.9%) had an outcome of any wheezing and 38 (11.7%) had anoutcome of current wheezing. There were 120 children (37.5%) with atopic disease and a subgroup of 270completed a SPT, of which 37 (13.6%) were positive (table 2). Lung function tests were completed in 222children (68.7%) and 231 (71.7%) had FeNO measurements.
Identification of phenotypesHierarchical Ward’s clustering was feasible and identified three symptom dynamic phenotypes. We definedthree similarly sized reference phenotypes using the frequency distribution of the total number of weekswith respiratory symptoms.
Over- and under-representation of risk factors across phenotypesSymptom dynamic phenotypesThe three symptom dynamic phenotypes included 145, 135 and 42 infants, respectively (table 3). Theydiffered with regard to the number of weeks with any symptoms and severe symptoms (phenotype 1 hadsevere symptoms for 0.22 weeks, phenotype 2 for 0.82 weeks and phenotype 3 for 2.11 weeks). Entropyalso differed across phenotypes (phenotype 1 had an entropy of 0.08, phenotype 2 of 0.56 and phenotype3 of 1.03) and so did risk factors. Phenotype 1 had an under-representation of infants with siblings andwith childcare attendance, and infants were more likely to be born via Caesarean section. Compared tophenotype 1, phenotype 2 had more infants with siblings and with childcare attendance, and infants wereless exposed to ETS. In phenotype 3, the smallest group, more infants had siblings and attended childcare,
4
Infant 1a)
b) c)
e) f)
d) Infant 2
3
2
1
00 5 10 15 20 25
Weeks
30 35 40 45 50 Target state 0–4 Target state 0–4
4
3
2
1
0
4
3
2
1
0
4
3
2
1
0
0
50
0
55.6
84.6
0
0
50
0
44.4
10.3
1
0
0
0
0
2.6
2
0
0
100
0
2.6
3
0
0
0
0
0
4 0 1 2 3 4
4
100
80
60
40
20
0
100
80
60
40
20
0
3
2
1
0
0
0
100
33.3
89.7
0
0
100
0
44.4
7.7
1
0
0
0
11.1
0
2
0
0
0
11.1
2.6
3
0
0
0
0
0
4 0 1 2 3 4
Markov matrix Infant 1 (entropy=0.58)
Markov matrix Infant 2 (entropy=0.70)
Init
ial
sta
te 0
–4
Init
ial
sta
te 0
–4
Target state 0–4 Target state 0–4
Init
ial
sta
te 0
–4
Init
ial
sta
te 0
–4
0 5 10 15 20 25Weeks
30 35 40 45 50
Sym
pto
m s
core
4
3
2
1
0Sym
pto
m s
core
FIGURE 2 Representative Markov matrix patterns of two infants. Panel (a) (infant 1) and panel (d) (infant 2) show the weekly respiratory symptomscores (states 0–4) during the first year of life. The total number of “weeks with respiratory symptoms” during the first year for both infants werethe same (37 weeks symptom score 0, 9 weeks symptom score 1, 1 week symptom score 2 and 2 weeks symptom score 3). The Markov matricesin panel (b) (infant 1) and panel (e) (infant 2) show the empirical probability of each transition (described in the methods and figure 1). In panels(c) and (f ), the colours correspond to the empirical probability of each transition. The pattern of the Markov matrix landscape was expressedusing a single average entropy parameter [16] (described in the supplementary material), which was 0.58 for infant 1 and 0.70 for infant 2.
https://doi.org/10.1183/23120541.00037-2018 5
PAEDIATRIC PULMONOLOGY | J. USEMANN ET AL.
and slightly more infants were male and were exposed to ETS. We considered phenotype 3 a high-risksymptom dynamic phenotype since associations with both later wheezing and atopic disease were strongest.
Reference phenotypesThe three phenotypes included 147, 128 and 47 infants, respectively (table 3). Phenotypes 1, 2 and 3 had0.14, 0.87 and 2.14 weeks with severe symptoms, respectively. Entropy was 0.13 for phenotype 1, 0.54 forphenotype 2 and 0.91 for phenotype 3. Risk factors differed across phenotypes. Phenotype 1 had anunder-representation of males and fewer infants had siblings. Infants were also more likely to be born viaCaesarean section. In phenotype 2, infants were less likely to be born via Caesarean section and inphenotype 3 there was an over-representation of males and more infants had siblings.
Association of symptom dynamic phenotypes, reference phenotypes and risk factors withoutcomes at 6 yearsIn the adjusted logistic regression model, male gender and maternal asthma were significantly associatedwith any wheezing during childhood. Male gender was also associated with current wheezing, anywheezing and atopic disease. Symptom dynamic phenotype 3 was significantly associated with anywheezing and current wheezing, compared to symptom dynamic phenotype 1, whereas symptom dynamicphenotype 2 was not associated with these outcomes. Reference phenotypes 2 and 3 were significantlyassociated with any wheezing compared to reference phenotype 1 (table 4). There was a significantassociation between both maternal asthma and symptom dynamic phenotype 3 toward wheezing between2 and 3 years of age, whereas reference phenotypes 2 and 3 were not associated with this outcome (seesupplementary table E2). None of the phenotypes were associated with the outcome positive SPT (seesupplementary table E3). For sensitivity analysis, we repeated the entire analysis and obtained similar
TABLE 2 Characteristics of the study population
n (%) Mean±SD Median (IQR) Range
Anthropometric data at birthGestational age weeks 39.6±1.2 39.8 (38.8–40.5) 36.7–41.8Birth weight kg 3.3±0.4 3.3 (3.0–3.6) 2.1–4.9Length cm 49.5±1.9 50.0 (48–51) 44–57
Respiratory symptoms in the first year of lifeWeeks with symptoms 5.3±4.6 4 (0–20) 0–23Weeks with severe symptoms 0.71±1.1 0 (0–1) 0–6
Risk factorsMale sex 167 (51.8)Siblings 159 (49.4)Caesarean section 54 (16.7)Maternal asthma 34 (10.5)Maternal atopy 116 (36.1)Childcare 62 (19.5)Maternal smoking in pregnancy 27 (8.4)Parental smoking during infancy 70 (21.7)Breastfeeding >26 weeks 252 (78.3)Low maternal education 202 (62.7)
Season of birthSpring 87 (27.4)Summer 83 (25.7)Autumn 80 (24.8)Winter 72 (22.6)
Outcomes at 6 year follow-upAny wheezing# 105 (32.9)Current wheezing¶ 38 (11.7)Atopic disease+ 120 (37.5)SPT positive§ 37 (13.6)
Data are derived from 322 infants with a total of 16 864 observed symptom weeks. IQR: interquartilerange; SPT: skin-prick test. #: defined as any wheezing episode between one and 6 years of age; ¶: definedas wheezing over the past 12 months before follow-up; +: defined as allergic rhinitis, allergic asthma, oratopic dermatitis before follow-up; §: a SPT was completed in a subset of 270 children.
https://doi.org/10.1183/23120541.00037-2018 6
PAEDIATRIC PULMONOLOGY | J. USEMANN ET AL.

results in infants with one or more episodes with a symptom score of three or more (data not shown).There was no association between any of the predictors and lung function and FeNO measurements at6 years (see supplementary table E4).
Comparison between symptom dynamic phenotypes and reference phenotypesThere was a high degree of overlap between the dynamic and reference phenotypes, with a weightedkappa-statistic value of 0.61. The overlap of infants allocated to each phenotype was 107 (74%) tophenotype 1, 76 (56%) to phenotype 2 and 20 (48%) to phenotype 3. Infants in dynamic phenotype 3had greater fluctuation between respiratory symptom scores compared to reference phenotype 3 (entropy1.03 versus 0.91). This indicates that phenotyping based on symptom dynamics identifies infants withdifferent characteristics compared to the reference method based on the number of symptom weeksalone. For example, in high-risk symptom dynamic phenotype 3, we found an over-representation ofinfants from smoking parents; whereas, in reference phenotype 3, other factors (e.g. maternal atopy) wereover-represented (table 3).
Sensitivity analysesThe robustness of our findings was assessed in various sensitivity analyses. These are discussed in thesupplementary material.
DiscussionWe developed a novel method, which, based on a time series of weekly symptom scores from healthyinfants in the first year of life, characterised symptom dynamics (i.e. the pattern of symptom deteriorationand recovery) in an observer-independent fashion. With this method we identified three symptomdynamic phenotypes, of which one had more infants attending childcare and a greater number of infantswith siblings. In addition, the number of male infants slightly higher and there was more exposure to ETS.Compared to the reference phenotype, this dynamic phenotype had a slightly higher prevalence forwheeze (26% versus 21%) and atopic disease (46% versus 36%) at 6 years. Of all clinically measuredexposures in infancy in our unselected cohort, infants in this dynamic phenotype had the highest OR forwheeze between one and 6 years (OR 4.31, 95% CI 1.95–9.48) and current wheeze at 6 years (OR 3.01,95% CI 1.15–7.88). These findings suggest that host factors and susceptibility to environmental factors in
++
+
++ ++++ ++
++
+++
+++
++
+
++++
+++
++ + + +
++
+++
+++++
++
+ +++
+ + +
+
(0–0)
50
40
30
20
We
ek
s
10
0
(0–1)
1
(0–2) (0–3) (0–4) (1–2) (1–3) (1–4) (2–3) (2–4) (3–4) (1–1) (2–2) (3–3) (4–4) (1–0) (2–0) (2–1) (3–0) (3–1) (3–2) (4–0) (4–1) (4–2) (4–3)
Healthy
Increasing symptoms
Stable symptoms
Decreasing symptoms
2
1
3
4
2 3
Transitions
4
FIGURE 3 Respiratory symptom transitions of all study participants. The vertical-axis represents the number of transitions (in weeks) observedduring the first year of life. The horizontal-axis represents all possible transitions (Type 1: healthy state; Type 2: increasing symptoms; Type 3:stable symptoms; Type 4: decreasing symptoms). Data are shown as box plots, while the numbers in brackets indicate initial symptom score(initial state) and target symptom score (target state), as assessed in the subsequent week.
https://doi.org/10.1183/23120541.00037-2018 7
PAEDIATRIC PULMONOLOGY | J. USEMANN ET AL.

TABLE 3 Characteristics of symptom dynamic phenotypes and reference phenotypes
Phenotype 1 Phenotype 2 Phenotype 3 p-value
Dynamic(n=145)
Reference(n=147)
Dynamic(n=135)
Reference(n=128)
Dynamic(n=42)
Reference(n=47)
Dynamic Reference
Respiratory symptomsWeeks with severe symptoms 0.22±0.43 0.14±0.37 0.82±1.03 0.87±0.98 2.11±1.64 2.14±1.53 <0.001 <0.001Weeks with any symptoms 1.84±1.58 1.57±1.09 7.03±3.64 6.61±1.96 12.19±3.56 13.87±3.03 <0.001 <0.001
Respiratory symptoms transition statesEntropy of transition states 0.08±0.05 0.13±0.16 0.56±0.14 0.54±0.25 1.03±0.12 0.91±0.23 <0.001 <0.001
Risk factorsMale sex 50.3 43.5 49.6 56.3 64.3 65.9 0.223 0.012Siblings 37.2 38.1 57.1 53.9 66.7 72.4 <0.001 <0.001Caesarean section 24.8 23.8 10.4 10.2 9.5 12.7 0.002 0.008Maternal asthma 9.6 8.8 9.6 10.2 16.7 17.1 0.385 0.278Maternal atopy 37.2 33.3 34.8 35.9 35.7 44.7 0.914 0.370Childcare 13.7 11.5 19.3 20.3 38.1 40.4 0.006 <0.001Maternal smoking during pregnancy 7.6 6.8 8.2 10.2 11.9 8.5 0.668 0.606Parental smoking during infancy 24.8 23.1 15.5 20.3 30.9 21.3 0.051 0.805Breastfeeding ⩽26 weeks 21.4 20.4 21.5 23.4 23.8 21.3 0.941 0.829Low maternal education 64.1 61.9 62.2 64.1 59.5 61.7 0.851 0.983
Season of birthSpring 25.5 26.5 31.1 27.3 19.1 27.7 0.264 0.983Summer 22.1 18.4 27.4 35.9 33.3 21.3 0.289 0.003Autumn 35.8 35.4 16.3 15.6 14.3 17.1 <0.001 <0.001Winter 16.5 19.7 25.2 21.1 33.3 34.1 0.042 0.111
Outcomes at 6 year follow-upAny wheezing# 27.6 22.4 28.9 38.3 64.3 51.1 <0.001 <0.001Current wheezing¶ 9.6 8.8 9.6 11.7 26.2 21.3 0.008 0.071Atopic disease+ 35.4 36.3 37.1 39.4 46.3 36.2 0.449 0.855SPT positive§ 13.3 14.5 12.3 13.1 19.4 13.2 0.545 0.942
Data are presented as % or mean±SD. Symptom dynamic phenotypes were defined by the average entropy of transition states and reference phenotypes by weeks with any respiratorysymptom. Differences in the distribution of characteristics across phenotypes were assessed using Chi-squared tests for categorical variables and Kruskal–Wallis tests for continuousvariables. Significant p-values at the Bonferroni-corrected α-level of 0.017 are shown in bold. SPT: skin-prick test. #: defined as any wheezing episode between one and 6 years of age;¶: defined as wheezing over the past 12 months before follow-up; +: defined as allergic rhinitis, allergic asthma, or atopic dermatitis before follow-up; §: a SPT was completed in a subsetof 270 children.
https://doi.org/10.1183/23120541.00037-20188
PAED
IATRIC
PULM
ONOLO
GY
|J.U
SEMANN
ETAL.

TABLE 4 Association of symptom dynamic phenotypes, reference phenotypes and risk factorswith outcomes during childhood
Outcome Univariable association Multivariable association#
OR 95% CI p-value OR 95% CI p-value
Any wheezing between one and 6 years¶ (n=105/322)Reference phenotypesPhenotype 1 (baseline; n=147) 1 Reference 1 ReferencePhenotype 2 (n=128) 2.14 1.26–3.62 0.005 1.93 1.11–3.35 0.019Phenotype 3 (n=47) 3.61 1.81–7.19 <0.001 2.84 1.32–6.11 0.008
Symptom dynamic phenotypesPhenotype 1 (baseline; n=145) 1 Reference 1 ReferencePhenotype 2 (n=135) 1.07 0.63–1.79 0.809 1.06 0.61–1.84 0.830Phenotype 3 (n=42) 4.72 2.27–9.72 <0.001 4.31 1.95–9.48 <0.001
Risk factorsMale sex 3.05 1.86–5.01 <0.001 2.90 1.75–4.81 <0.001Siblings 1.22 0.77–1.95 0.386 1.27 0.78–2.09 0.328Maternal asthma 2.23 1.09–4.58 0.028 2.16 1.03–4.55 0.041Childcare 1.49 0.84–2.64 0.169 1.40 0.75–2.59 0.284Parental smoking during infancy 1.08 0.61–1.89 0.783 0.99 0.55–1.81 0.995Low maternal education 1.23 0.76–2.01 0.391 1.13 0.66–1.93 0.644
Current wheezing at 6 years+ (n=38/322)Reference phenotypesPhenotype 1 (baseline; n=147) 1 Reference 1 ReferencePhenotype 2 (n=128) 1.36 0.62–2.99 0.433 1.22 0.54–2.75 0.618Phenotype 3 (n=47) 2.78 1.13–6.86 0.026 2.25 0.83–6.11 0.110
Symptom dynamic phenotypesPhenotype 1 (baseline; n=145) 1 Reference 1 ReferencePhenotype 2 (n=135) 0.99 0.45–2.21 0.994 1.01 0.44–2.31 0.968Phenotype 3 (n=42) 3.32 1.37–8.01 0.008 3.01 1.15–7.88 0.025
Risk factorsMale sex 2.52 1.21–5.28 0.014 2.26 1.06–4.81 0.033Siblings 1.15 0.58–2.28 0.670 1.19 0.61–2.42 0.616Maternal asthma 1.71 0.65–4.45 0.141 1.66 0.62–4.41 0.306Childcare 1.35 0.61–3.02 0.462 1.38 0.58–3.27 0.457Parental smoking during infancy 1.33 0.61–2.89 0.468 1.15 0.51–2.59 0.723Low maternal education 1.77 0.82–3.78 0.141 1.63 0.73–3.66 0.229
Atopic disease at 6 years§ (n=120/320)Reference phenotypesPhenotype 1 (baseline; n=146) 1 Reference 1 ReferencePhenotype 2 (n=127) 1.13 0.69–1.86 0.602 1.06 0.63–1.78 0.824Phenotype 3 (n=47) 0.99 0.51–1.97 0.987 0.89 0.41–1.91 0.772
Symptom dynamic phenotypesPhenotype 1 (baseline; n=144) 1 Reference 1 ReferencePhenotype 2 (n=135) 1.07 0.65–1.74 0.778 1.12 0.66–1.88 0.667Phenotype 3 (n=41) 1.57 0.78–3.17 0.205 1.74 0.81–3.77 0.159
Risk factorsMale sex 2.15 1.35–3.42 0.001 2.10 1.29–3.40 0.003Siblings 1.09 0.69–1.72 0.686 1.01 0.63–1.63 0.944Maternal asthma 1.55 0.76–3.18 0.226 1.51 0.72–3.17 0.274Childcare 0.62 0.34–1.14 0.127 0.63 0.33–1.21 0.168Parental smoking during infancy 1.09 0.63–1.88 0.752 0.92 0.55–1.64 0.786Low maternal education 2.30 1.40–3.77 0.001 2.03 1.20–3.41 0.008
Logistic regression analysis was carried out for the outcomes any wheezing, current wheezing and atopicdisease. Symptom dynamic phenotypes were defined by average entropy of transition states and referencephenotypes by weeks with any respiratory symptom. When considering phenotypes as exposure, phenotype1 from the reference phenotype or symptom dynamic phenotype, respectively, served as baseline. OR:odds ratio. #: adjusted for the binary variables male gender, low maternal education, maternal asthma,maternal smoking during pregnancy, childcare attendance during infancy and presence of siblings;¶: defined as any wheezing episode between one and 6 years of age; +: defined as wheezing over the past12 months before follow-up; §: defined as allergic rhinitis, allergic asthma, or atopic dermatitis beforefollow-up.
https://doi.org/10.1183/23120541.00037-2018 9
PAEDIATRIC PULMONOLOGY | J. USEMANN ET AL.

infancy are not only associated with the total number of symptoms, but are associated with symptomdynamics even more so. The same is even truer if we consider the subsequent persistence of airwaysymptoms into childhood. Although we observed an expected overlap between the symptom dynamic andreference phenotypes, our findings are consistent with the hypothesis that symptom dynamics providerelevant information on airway susceptibility and recovery patterns. The latter may be relevant for ourunderstanding of airway vulnerability in the development of chronic disease.
Comparison with the literaturePrevious studies using unsupervised methods assessed symptoms at two timepoints [24] and up to 14timepoints [12] during childhood. The resolution of respiratory symptoms in our study is unique, since wehad a minimum of 50 observations per infant. Comparison of phenotypes between this study and previousstudies is limited given that previous studies phenotyped based on “wheeze” during childhood [6, 13, 24–26],while our study focused on “any respiratory symptom” during infancy. Previous studies often investigatedthe association of phenotypes with risk factors during childhood (e.g. allergic sensitisation), while our studyspecifically assessed prenatal (e.g. maternal smoking during pregnancy) and early postnatal risk factors (e.g.breastfeeding and childcare attendance). The symptom dynamics and total number of symptom weeksduring infancy were not associated with lung function or FeNO at 6 years. These findings differ from theresults in a large European birth cohort (the ALSPAC study) describing an association between differentwheezing phenotypes (e.g. early transient and persistent wheeze) and lung function at 8–9 years [6, 12].Differences could be due to the small number of lung function measurements performed at 6 years in ourstudy, or that only a few children had severely reduced lung function in this unselected study population.Furthermore, while our method assessed “any respiratory symptom” for phenotyping (mostly cough andrhinitis), the ALSPAC study assessed “wheezing” [6, 12], which may reflect other airway properties.
Potential mechanisms, and interplay between host and environmental risk factorsInterplay between an exposure (e.g. virus or pollutants) and host predisposition (e.g. infant from asthmaticmothers or male sex) is hypothesised to determine response to a respiratory infection. Studies furthersuggest that the severity of respiratory infections in children depends on virus type [27], microbialcomposition [28] and environmental factors [3, 29]. The interplay between these factors is suggested toaffect airway epithelial function [30, 31]. Further prospective studies may assess if previously suggestedmarkers to assess epithelial function (e.g. cytokine expression and impaired interferon response) [30] arerelevant for future disease.
Strengths and limitationsWe prospectively assessed respiratory symptoms weekly by telephone interview, obtaining reliable data onrespiratory morbidity [15] and reducing potential recall bias compared to retrospectively reportedsymptoms. We had few missing data points, with only two infants out of all eligible participants beingexcluded for having less than 50 weeks of observations. We used the same questionnaire to assess riskfactors and outcome data throughout the entire study period at both centres, reducing potentialinter-centre differences. Since this study was conducted in an unselected population, there were only 38subjects with current wheezing at 6 years. However, the high-risk phenotypes incorporated only smallnumbers of infants and as such misclassification of even one subject could majorly influence our findings.While the number of participants lost to follow-up was low (13%), a potential selection bias may still haveinfluenced our findings. Few cohort studies prospectively assessed respiratory symptoms during infancy[3, 13, 32]. Due to a lack of data, we could not validate our method in any of those studies, butdid perform an external validation in 242 infants from our cohort not yet seen for follow-up (seesupplementary table E5). We performed several sensitivity analyses to rule out that the distribution ofentropy was a methodological artefact. For example, we tested whether this distribution could be amathematical artefact related to the scoring system (five states). However, recategorisation of the states(0, 1, 2, (3+4)→3), did not systematically change the identified phenotypes. After correcting for unobservedevents, we investigated the scenario of analysing a hypothetical population at higher risk. This analysisresulted in higher entropy values and also a different entropy distribution (see supplementary material).These results suggest that the phenotypes obtained using our method may depend on the distribution ofsymptom severity. Consequently, an external validation of our method in a different study population mayyield different phenotypes.
Clinical relevance and research applicationsOur results indicate that specific symptom dynamics during infancy are associated with wheezing at6 years. The developed method could potentially be used in ongoing research on asthma control and riskprediction, as it objectively quantifies symptom patterns and could be considered complementary toroutine asthma biomarkers (e.g. asthma predictive index, FeNO and lung function). Furthermore,
https://doi.org/10.1183/23120541.00037-2018 10
PAEDIATRIC PULMONOLOGY | J. USEMANN ET AL.

assessment of symptom patterns is noninvasive and does not require laboratory equipment. It could thusbe used in primary care and telemonitoring settings [33]. Smartphone applications for the assessment ofsymptoms are already available and have been used in patients with asthma [34], cystic fibrosis [35], andrhinitis [36]. These novel tools may enable automatic, low-cost assessment of symptoms from whichespecially high-risk populations may benefit. The mathematical algorithm could be integrated with thetools’ software, which would enable the calculation of symptom dynamics without profound expertise, aswell as in larger patient groups.
ConclusionIn this study, we developed a method to quantitatively characterise the symptom dynamics ofprospectively assessed respiratory symptoms and found that specific dynamic symptom patterns wereassociated with host and environmental factors and persistent wheezing up to 6 years in a high-riskphenotype. Although host factors (male sex) and environmental factors (ETS exposure during infancy)were more frequent in this phenotype, these infants were predominantly exposed to infectious risk factors(siblings and childcare) in the first year. Beyond solely looking at the total number of symptoms, thedynamics of symptom patterns may provide relevant information on the susceptibility and recoverycapacity of the airways after environmental stimuli in infancy. The developed method has potential invarious research settings and might contribute to our understanding of airway susceptibility associatedwith persistent airway disease.
Acknowledgements: The authors thank the parents for participating in the study, and the study nurses Christine Becher,Monika Graf and Linda Beul-Béguin (Paediatric Respiratory Medicine, Dept of Paediatrics, Inselspital, Bern UniversityHospital, University of Bern, Bern, Switzerland) for performing the weekly phone calls to the parents, and the entireBILD cohort team. We would also like to thank Karine Hugentobler (University Children’s Hospital Basel (UKBB),Basel, Switzerland) for her critical reading of the manuscript.
Author contributions: J. Usemann, P. Latzin, M. Röösli, C. Kuehni and U. Frey were investigators in this study andcontributed to the study design. I. Korten, A. Schmidt, P. Anagnostopoulou, E. Proietti, O. Fuchs, O. Gorlanova andJ. Usemann are members of the BILD study team and contributed to data collection and analysis. J. Usemann, B. Xu,M. Röösli, C. Kuehni, P. Latzin, E. Delgado-Eckert and U. Frey contributed to the data interpretation. E. Delgado-Eckertand B. Xu conceived the computational approach. All authors contributed to the writing and review of the report, andapproved the final version of the manuscript.
The current Basel–Bern Infant Lung Development (BILD) cohort study group is: Pinelopi Anagnostopoulou, Bern;Urs Frey, Basel; Oliver Fuchs, Bern; Olga Gorlanova, Basel; Insa Korten, Bern; Claudia Kuehni, Bern; Philipp Latzin,Bern; Elena Proietti, Zurich; Martin Röösli, Basel; Anne Schmidt, London; and Jakob Usemann, Basel.
Conflict of interest: P. Latzin reports receiving personal fees from Vertex, Novartis, Roche, Polyphor, Vifor and Gileadoutside the submitted work.
Support statement: This study was supported by grants from the Swiss National Science Foundation (grant320030_163311 awarded to U. Frey, P. Latzin and C. Kuehni, and grant 32003B_162820 awarded to C. Kuehni) and aresearch fellowship from the Austrian, German and Swiss Paediatric Respiratory Society (awarded to J. Usemann).Funding information for this article has been deposited with the Crossref Funder Registry.
References1 Braman SS. The global burden of asthma. Chest 2006; 130: 4S–12S.2 Gorlanova O, Thalmann S, Proietti E, et al. Effects of breastfeeding on respiratory symptoms in infancy. J Pediatr
2016; 174: 111–117.3 Latzin P, Frey U, Roiha HL, et al. Prospectively assessed incidence, severity, and determinants of respiratory
symptoms in the first year of life. Pediatr Pulmonol 2007; 42: 41–50.4 Morgan WJ, Stern DA, Sherrill DL, et al. Outcome of asthma and wheezing in the first 6 years of life: follow-up
through adolescence. Am J Respir Crit Care Med 2005; 172: 1253–1258.5 Frey U, von Mutius E. The challenge of managing wheezing in infants. N Engl J Med 2009; 360: 2130–2133.6 Henderson J, Granell R, Heron J, et al. Associations of wheezing phenotypes in the first 6 years of life with atopy,
lung function and airway responsiveness in mid-childhood. Thorax 2008; 63: 974–980.7 Stern G, Latzin P, Roosli M, et al. A prospective study of the impact of air pollution on respiratory symptoms and
infections in infants. Am J Respir Crit Care Med 2013; 187: 1341–1348.8 Asmussen S. Applied probability and queues. 2nd Edn. New York, Springer, 2003.9 Chen W, Marra CA, Lynd LD, et al. The natural history of severe asthma and influences of early risk factors:
a population-based cohort study. Thorax 2016; 71: 267–275.10 Combescure C, Chanez P, Saint-Pierre P, et al. Assessment of variations in control of asthma over time. Eur Respir
J 2003; 22: 298–304.11 Bishop CM. Pattern recognition and machine learning. New York, Springer, 2006.12 Granell R, Henderson AJ, Sterne JA. Associations of wheezing phenotypes with late asthma outcomes in the Avon
Longitudinal Study of Parents and Children: a population-based birth cohort. J Allergy Clin Immunol 2016; 138:1060–1070.
13 Depner M, Fuchs O, Genuneit J, et al. Clinical and epidemiologic phenotypes of childhood asthma. Am J RespirCrit Care Med 2014; 189: 129–138.
https://doi.org/10.1183/23120541.00037-2018 11
PAEDIATRIC PULMONOLOGY | J. USEMANN ET AL.

14 Fuchs O, Latzin P, Kuehni CE, et al. Cohort profile: the Bern infant lung development cohort. Int J Epidemiol2012; 41: 366–376.
15 Silverman M, Wang M, Hunter G, et al. Episodic viral wheeze in preschool children: effect of topical nasalcorticosteroid prophylaxis. Thorax 2003; 58: 431–434.
16 Pratt WK. Chapter 15: Image feature extraction. In: Introduction to digital image processing. Boca Raton, CRCPress, 2013.
17 Miller MR, Hankinson J, Brusasco V, et al. Standardisation of spirometry. Eur Respir J 2005; 26: 319–338.18 Quanjer PH, Stanojevic S, Cole TJ, et al. Multi-ethnic reference values for spirometry for the 3–95-yr age range:
the global lung function 2012 equations. Eur Respir J 2012; 40: 1324–1343.19 American Thoracic Society, European Respiratory Society. ATS/ERS recommendations for standardized
procedures for the online and offline measurement of exhaled lower respiratory nitric oxide and nasal nitric oxide,2005. Am J Respir Crit Care Med 2005; 171: 912–930.
20 Paninski L. Estimation of entropy and mutual information. Neural Computation 2003; 15: 1191–1253.21 Ward JH, Jr. Hierarchical grouping to optimize an objective function. J Am Stat Assoc 1963; 58: 236–244.22 Charrad M, Ghazzali N, Boiteau V, et al. NbClust: an R package for determining the relevant number of clusters
in a data set. J Stat Softw 2014; 61: 1–36.23 Dogaru CM, Strippoli MP, Spycher BD, et al. Breastfeeding and lung function at school age: does maternal asthma
modify the effect? Am J Respir Crit Care Med 2012; 185: 874–880.24 Spycher BD, Silverman M, Brooke AM, et al. Distinguishing phenotypes of childhood wheeze and cough using
latent class analysis. Eur Respir J 2008; 31: 974–981.25 Garcia-Aymerich J, Benet M, Saeys Y, et al. Phenotyping asthma, rhinitis and eczema in MeDALL
population-based birth cohorts: an allergic comorbidity cluster. Allergy 2015; 70: 973–984.26 Spycher BD, Silverman M, Pescatore AM, et al. Comparison of phenotypes of childhood wheeze and cough in 2
independent cohorts. J Allergy Clin Immunol 2013; 132: 1058–1067.27 Carlsson CJ, Vissing NH, Sevelsted A, et al. Duration of wheezy episodes in early childhood is independent of the
microbial trigger. J Allergy Clin Immunol 2015; 136: 1208–1214.28 von Mutius E. The microbial environment and its influence on asthma prevention in early life. J Allergy Clin
Immunol 2016; 137: 680–689.29 Caudri D, Savenije OE, Smit HA, et al. Perinatal risk factors for wheezing phenotypes in the first 8 years of life.
Clin Exp Allergy 2013; 43: 1395–1405.30 Cook J, Saglani S. Pathogenesis and prevention strategies of severe asthma exacerbations in children. Curr Opin
Pulm Med 2016; 22: 25–31.31 Holt PG, Sly PD. Viral infections and atopy in asthma pathogenesis: new rationales for asthma prevention and
treatment. Nat Med 2012; 18: 726–735.32 Bonnelykke K, Vissing NH, Sevelsted A, et al. Association between respiratory infections in early life and later
asthma is independent of virus type. J Allergy Clin Immunol 2015; 136: 81–86.33 de Jongste JC, Carraro S, Hop WC, et al. Daily telemonitoring of exhaled nitric oxide and symptoms in the
treatment of childhood asthma. Am J Respir Crit Care Med 2009; 179: 93–97.34 Cook KA, Modena BD, Simon RA. Improvement in asthma control using a minimally burdensome and proactive
smartphone application. J Allergy Clin Immunol Pract 2016; 4: 730–737.35 Wood J, Jenkins S, Putrino D, et al. High usability of a smartphone application for reporting symptoms in adults
with cystic fibrosis. J Telemed Telecare 2018; 24: 547–552.36 Caimmi D, Baiz N, Tanno LK, et al. Validation of the MASK-rhinitis visual analogue scale on smartphone screens
to assess allergic rhinitis control. Clin Exp Allergy 2017; 47: 1526–1533.
https://doi.org/10.1183/23120541.00037-2018 12
PAEDIATRIC PULMONOLOGY | J. USEMANN ET AL.