e book - worksheets vol. 1 - information
DESCRIPTION
An e-book of worksheets on the topic 'Information'(Statistics). The work is 27 pages long containing 10 worksheets. The file size is 1.4 MB.TRANSCRIPT

©2012 GCSE Maths Tutor All Rights Reserved www.gcsemathstutor.com

This book is under copyright to GCSE Maths Tutor. However, it may be distributed freely provided it is not sold for profit.
Contents
line graphs 3 - 5
pie charts 6, 7
grouped data 8, 9
tree diagrams 11 - 14
simple probability 15, 16
histograms 17 - 19
mean, mode, median, range 20, 21
cumulative frequency 22, 23
outcome of two independent events 24, 25
outcome of mutually exclusive events 26, 27
Info. & Prob. – data line graphs question sheet IP-LG-01 GCSE Maths Tutor www.gcsemathstutor.com [email protected]
GCSE Maths Tutor www.gcsemathstutor.com [email protected]
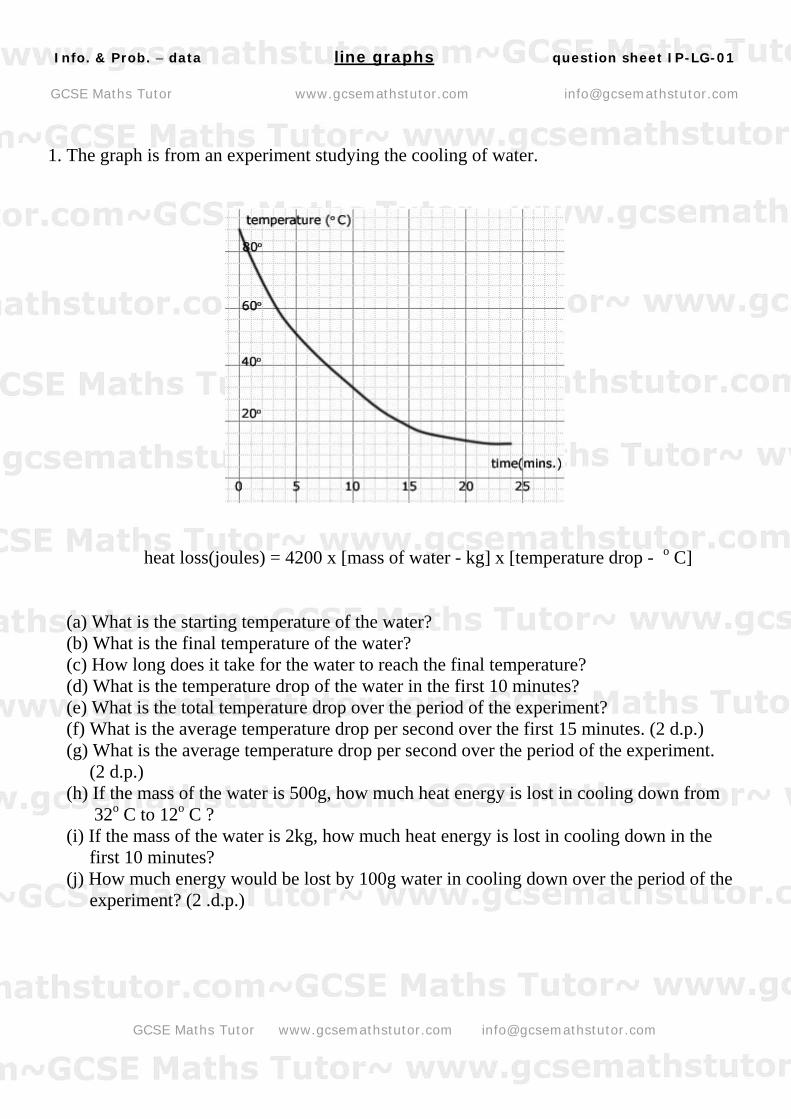
1. The graph is from an experiment studying the cooling of water.
heat loss(joules) = 4200 x [mass of water - kg] x [temperature drop - o C]
(a) What is the starting temperature of the water? (b) What is the final temperature of the water? (c) How long does it take for the water to reach the final temperature? (d) What is the temperature drop of the water in the first 10 minutes? (e) What is the total temperature drop over the period of the experiment? (f) What is the average temperature drop per second over the first 15 minutes. (2 d.p.) (g) What is the average temperature drop per second over the period of the experiment. (2 d.p.) (h) If the mass of the water is 500g, how much heat energy is lost in cooling down from 32o C to 12o C ? (i) If the mass of the water is 2kg, how much heat energy is lost in cooling down in the first 10 minutes? (j) How much energy would be lost by 100g water in cooling down over the period of the experiment? (2 .d.p.)

Info. & Prob. – data line graphs question sheet IP-LG-01 GCSE Maths Tutor www.gcsemathstutor.com [email protected]
GCSE Maths Tutor www.gcsemathstutor.com [email protected]
2. The graph is a survey of weed numbers in one hectare of rough grassed area over time.
mass of weeds(g) = 17.5 x (number of weeds)
(a) How many weeds were there after 4 weeks? (b) How many days did it take for the weed numbers to reach 100?(nearest whole day) (c) How many weeds grew between the 4th and 5th week? (d) How many days did it take for the weed numbers to reach 200? (nearest whole day) (e) What is the mass of weeds in kilograms at the end of 5 weeks? (2 d.p.) (f) If one hectare measures 100 x 100 metres, how many weeds are there per square metre after 4 weeks? (3 d.p.) (g) What mass of weeds(kg) would you expect in a grassed area measuring 1kilometre square after 21 days?

Info. & Prob. – data line graphs question sheet IP-LG-01 GCSE Maths Tutor www.gcsemathstutor.com [email protected]
GCSE Maths Tutor www.gcsemathstutor.com [email protected]
1. (a) 88o C (b) 12o C (c) 24 mins. (d) 56o C (e) 76o C (f) 0.08 o C/sec. (g) 0.05 o C/sec. (h) 42,000 joules (i) 470,400 joules ((j) 31,920 joules 2. (a) 120 (b) 26 days (c) 110 (d) 34 days (e) 4.03 kg (f) 0.012 (g) 113.75 kg

Info. & Prob. – data pie charts question sheet IP-PC-01 GCSE Maths Tutor www.gcsemathstutor.com [email protected]
GCSE Maths Tutor www.gcsemathstutor.com [email protected]
1. The cost of running a car over a year is £1950. For each cost calculate the angle swept out if the data were to be presented as a pie chart. (answers to 2 d.p.) (a) insurance £300 (b) road tax £120 (c) M.O.T. test £50 (d) petrol £1200 (e) repairs £200 (f) s ervicing £80 2. A pie chart is constructed representing the ice cream tastes of 1080 children. If the angles swept out for each flavour are as follows, calculate the number of children each angle represents. (a) 25o lime (b) 47o banana (c) 69o orange (d) 105o chocolate (e) 72o strawberry (f) 11o vanilla 3. A weekly household budget is £280. For each cost calculate the angle swept out if the data were to be presented as a pie chart. (answers to 2 d.p.) (a) rent £125 (b) food £80 (c) heating & lighting £25 (d) clothing £15 (e) holidays £35 For each cost (below) calculate the % of the budget taken. (f) rent (g) food (h) heating & lighting (i) clothing (j) holidays 4. The pie chart represents the favourite subjects of 700 students in a secondary school.
(a) How many students liked French? (b) How many students in total liked science and mathematics? (c) What angle was swept out by english? (d) What angle was swept out by students not liking P.E.? (1 d.p.)

Info. & Prob. – data pie charts answer sheet IP-PC-01 GCSE Maths Tutor www.gcsemathstutor.com [email protected]
GCSE Maths Tutor www.gcsemathstutor.com [email protected]
1. (a) 55.38o (b) 22.15o (c) 9.23o (d) 221.54o (e) 36.92o (f) 14.77o 2. (a) 75 (b) 141 (c) 207 (d) 315 (e) 216 (f) 33 3. (a) 160.71o (b) 102.86o (c) 32.14o (d) 19.29o (e) 45.00o (f) 44.64% (g) 28.57% (h) 8.93% (i) 5.36% (j) 12.50% 4. (a) 84 (b) 427 (c) 72o (d) 334.8 o

Info. & Prob. – data grouped data question sheet IP-GD-01 GCSE Maths Tutor www.gcsemathstutor.com [email protected]
GCSE Maths Tutor www.gcsemathstutor.com [email protected]
1. The table shows data on the height(h) of 50 seedlings(measurements expressed in mm).
class interval mid-point frequency mid-point x freq.10 15h≤ < 8 15 20h≤ < 17 20 25h≤ < 19 25 30h≤ < 5
totals First complete the table. Using the information answer the questions: (a) What is the modal class? (b) Estimate the median height of seedlings. (whole number) (c) Estimate the mean height of seedlings. (2 d.p.) 2. The table shows the distribution of children's age(a) in a secondary school.
class interval mid-point frequency mid-point x freq.11 12a≤ < 42 12 13a≤ < 38 13 14a≤ < 45 14 15a≤ < 38
totals First complete the table. Using the information answer the questions. (a) What is the modal class? (b) Estimate the median age of the children at the school. (whole number) (c) Estimate the mean age of children at the school. (2 d.p.) 3. The table shows the number of visits(v) to the doctor patients at a surgery make in a year.
class interval mid-point frequency mid-point x freq.0 5v≤ < 5 5 1v≤ < 0 47
10 15v≤ < 11 totals
First complete the table. Using the information answer the questions. (a) What is the modal class? (b) Estimate the median number of visits made to the surgery in a year. (whole number) (c) Estimate the mean number of visits made to the surgery in a year. (2 d.p.)
Info. & Prob. – data grouped data question sheet IP-GD-01 GCSE Maths Tutor www.gcsemathstutor.com [email protected]
GCSE Maths Tutor www.gcsemathstutor.com [email protected]
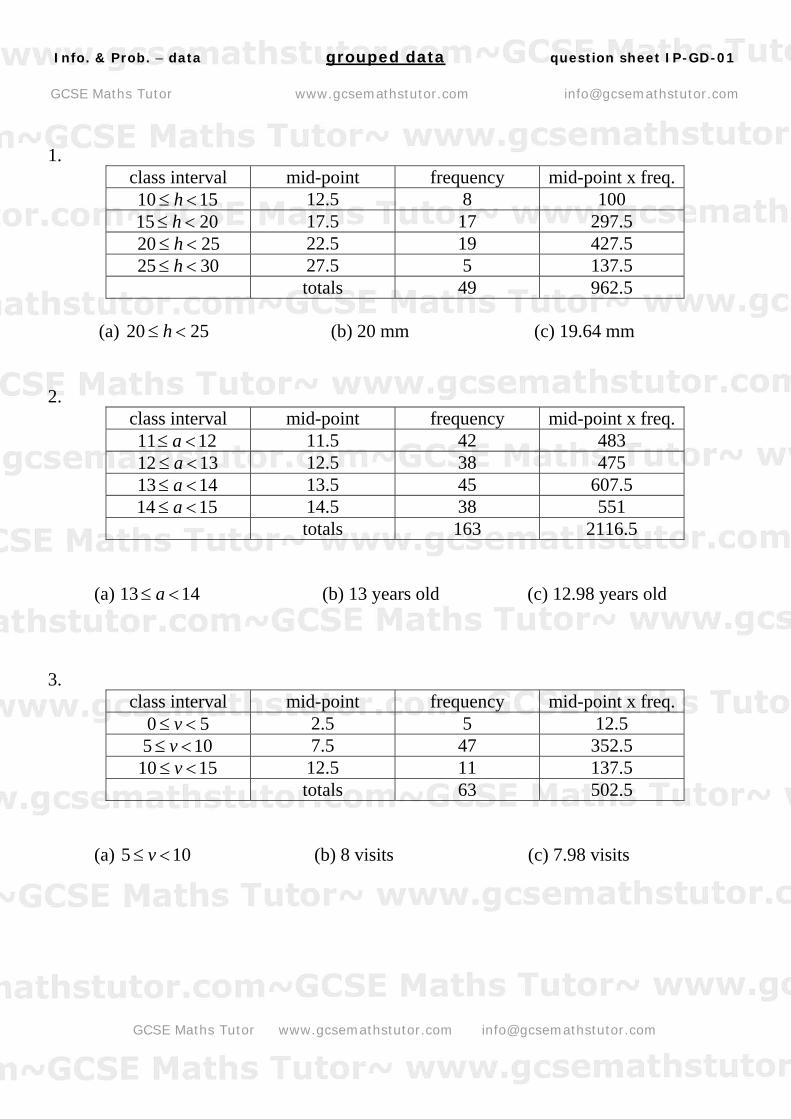
1.
class interval mid-point frequency mid-point x freq.10 15h≤ < 12.5 8 100 15 20h≤ < 17.5 17 297.5 20 25h≤ < 22.5 19 427.5 25 30h≤ < 27.5 5 137.5
totals 49 962.5 (a) (b) 20 mm (c) 19.64 mm 20 25h≤ < 2.
class interval mid-point frequency mid-point x freq.11 12a≤ < 11.5 42 483 12 13a≤ < 12.5 38 475 13 14a≤ < 13.5 45 607.5 14 15a≤ < 14.5 38 551
totals 163 2116.5 (a) 13 (b) 13 years old (c) 12.98 years old 14a≤ < 3.
class interval mid-point frequency mid-point x freq.0 5v≤ < 2.5 5 12.5 5 1v≤ < 0 7.5 47 352.5
10 15v≤ < 12.5 11 137.5 totals 63 502.5
(a) (b) 8 visits (c) 7.98 visits 5 10v≤ <

Info. & Prob. – probability tree diagrams question sheet IP-TD-01 GCSE Maths Tutor www.gcsemathstutor.com [email protected]
GCSE Maths Tutor www.gcsemathstutor.com [email protected]
Illustrate each question with a 'tree diagram'. 1. A cloth bag contains 8 black marbles and 4 white marbles. If two marbles are removed from the bag one after the other, what is the probability that: (answers to 3 d.p.) (a) the first is black and the second white (b) both are coloured black (c) both are coloured white 2. Two cards are removed from a pack of cards, one after the other. What is the probability that: (answers to 3 d.p.) (a) both cards are spades (b) neither card is a spade (c) only the second card is a spade 3. Two cards are removed from a pack of cards, one after the other. What is the probability that: (answers to 3 d.p.) (a) one of the cards is an ace (b) two aces are obtained (c) no aces are obtained 4. An earthenware jar contains £1 in 2p coins and £10 in 50p coins. If two coins are taken from the jar at random, what is the probability that the value of the two coins is: (answers to 3 d.p.) (a) 52p (b) £1 (c) 4p 5. A child has a bag of coloured sweets consisting of 5 red sweets, 12 orange and 9 green. If the child eats 2 of the sweets one after the other, what is the probability that: Note in this question, 3 tree diagrams are required. (answers to 3 d.p.) (a) the first sweet eaten was orange and the second red (b) no red sweets were eaten (c) both the eaten sweets were green in colour

Info. & Prob. – probability tree diagrams answer sheet IP-TD-01 GCSE Maths Tutor www.gcsemathstutor.com [email protected]
GCSE Maths Tutor www.gcsemathstutor.com [email protected]
1. (a) 0.242 (b) 0.424 (c) 0.091
2. (a) 0.059 (b) 0.0.559 (c) 0.191

Info. & Prob. – probability tree diagrams answer sheet IP-TD-01 GCSE Maths Tutor www.gcsemathstutor.com [email protected]
GCSE Maths Tutor www.gcsemathstutor.com [email protected]
3. (a) 0.072 (b) 0.005 (c) 0.851
4. (a) 0.207 (b) 0.079 (c) 0.507

Info. & Prob. – probability tree diagrams answer sheet IP-TD-01 GCSE Maths Tutor www.gcsemathstutor.com [email protected]
GCSE Maths Tutor www.gcsemathstutor.com [email protected]
5. (a) 0.092
(b) 0.646

Info. & Prob. – probability tree diagrams answer sheet IP-TD-01 GCSE Maths Tutor www.gcsemathstutor.com [email protected]
GCSE Maths Tutor www.gcsemathstutor.com [email protected]
5. (c) 0.111
Info. & Prob. – probability simple probability question sheet IP-SPB-01 GCSE Maths Tutor www.gcsemathstutor.com [email protected]
GCSE Maths Tutor www.gcsemathstutor.com [email protected]
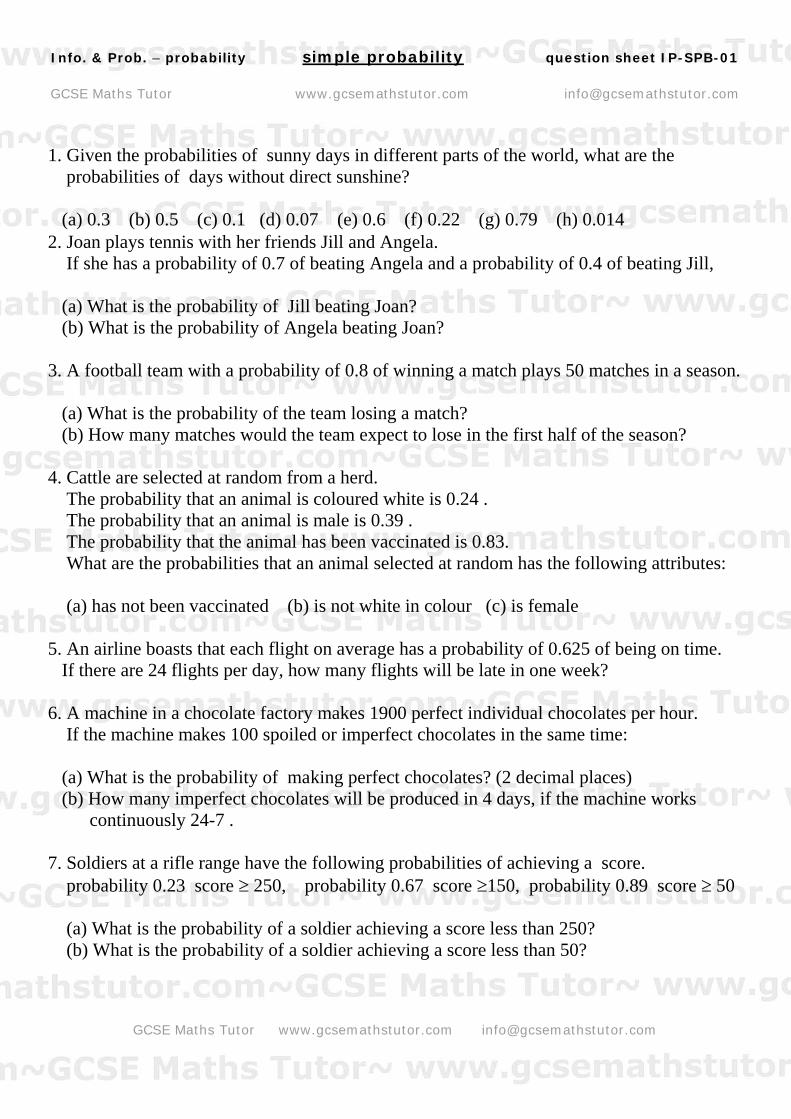
1. Given the probabilities of sunny days in different parts of the world, what are the probabilities of days without direct sunshine? (a) 0 .3 (b) 0.5 (c) 0.1 (d) 0.07 (e) 0.6 (f) 0.22 (g) 0.79 (h) 0.014 2. Joan plays tennis with her friends Jill and Angela. If she has a probability of 0.7 of beating Angela and a probability of 0.4 of beating Jill, (a) What is the probability of Jill beating Joan? (b) What is the probability of Angela beating Joan? 3. A football team with a probability of 0.8 of winning a match plays 50 matches in a season. (a) What is the probability of the team losing a match? (b) How many matches would the team expect to lose in the first half of the season? 4. Cattle are selected at random from a herd. The probability that an animal is coloured white is 0.24 . The probability that an animal is male is 0.39 . The probability that the animal has been vaccinated is 0.83. What are the probabilities that an animal selected at random has the following attributes: (a) has not been vaccinated (b) is not white in colour (c) is female 5. An airline boasts that each flight on average has a probability of 0.625 of being on time. If there are 24 flights per day, how many flights will be late in one week? 6. A machine in a chocolate factory makes 1900 perfect individual chocolates per hour. If the machine makes 100 spoiled or imperfect chocolates in the same time: (a) What is the probability of making perfect chocolates? (2 decimal places) (b) How many imperfect chocolates will be produced in 4 days, if the machine works continuously 24-7 . 7. Soldiers at a rifle range have the following probabilities of achieving a score. probability 0.23 score ≥ 250, probability 0.67 score ≥150, probability 0.89 score ≥ 50 (a) What is the probability of a soldier achieving a score less than 250? (b) What is the probability of a soldier achieving a score less than 50?

Info. & Prob. – probability simple probability answer sheet IP-SPB-01 GCSE Maths Tutor www.gcsemathstutor.com [email protected]
GCSE Maths Tutor www.gcsemathstutor.com [email protected]
1. (a) 0.7 (b) 0.5 (c) 0.9 (d) 0.93 (e) 0.4 (f) 0.78 (g) 0.21 (h) 0.986 2. (a) 0.6 (b) 0.3 3. (a) 0.2 (b) 5 4. (a) 0.17 (b) 0.76 (c) 0.61 5. 63 6. (a) 0.95 (b) 9600 7. (a) 0.77 (b) 0.11
Info. & Prob. – data histograms question sheet IP-HIS-01 GCSE Maths Tutor www.gcsemathstutor.com [email protected]
GCSE Maths Tutor www.gcsemathstutor.com [email protected]
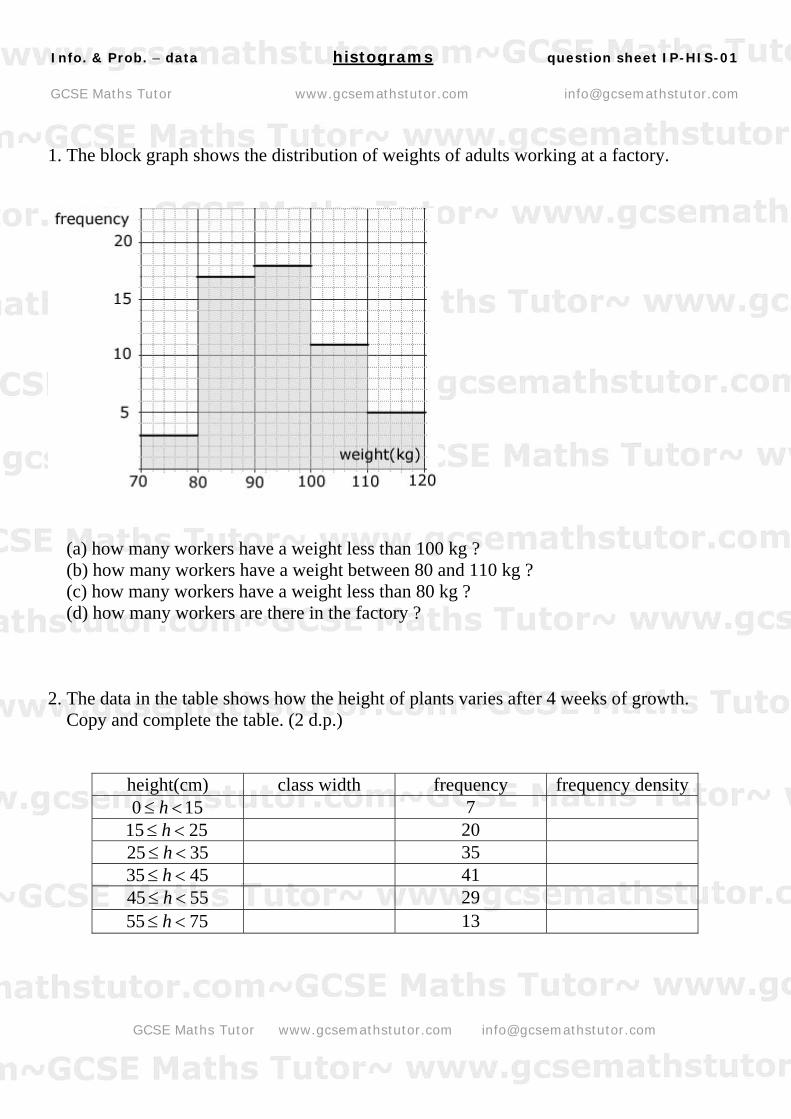
1. The block graph shows the distribution of weights of adults working at a factory.
(a) how many workers have a weight less than 100 kg ? (b) how many workers have a weight between 80 and 110 kg ? (c) how many workers have a weight less than 80 kg ? (d) how many workers are there in the factory ?
2. The data in the table shows how the height of plants varies after 4 weeks of growth. Copy and complete the table. (2 d.p.)
height(cm) class width frequency frequency density0 1h≤ < 5 7
15 25h≤ < 20 25 35h≤ < 35 35 45h≤ < 41 45 55h≤ < 29 55 75h≤ < 13

Info. & Prob. – data histograms question sheet IP-HIS-01 GCSE Maths Tutor www.gcsemathstutor.com [email protected]
GCSE Maths Tutor www.gcsemathstutor.com [email protected]
3. The histogram illustrates the results of a survey into the weights of potatoes in a sack.
(a) how many potatoes have a weight less than 90 g ? (b) how many potatoes have a weight between 100 and 110 g ? (c) how many potatoes have a weight between 110 and 140 g ? (d) how many potatoes are there in the sack ? 4. A school nurse collected data on the size of pupil's waist-lines.
(a) how many pupils had a waist-line less than 110 cm ? (b) how many pupils had a waist-line greater than 90 cm ? (c) how many pupils had their waist-line measured ?
Info. & Prob. – data histograms answer sheet IP-HIS-01 GCSE Maths Tutor www.gcsemathstutor.com [email protected]
GCSE Maths Tutor www.gcsemathstutor.com [email protected]
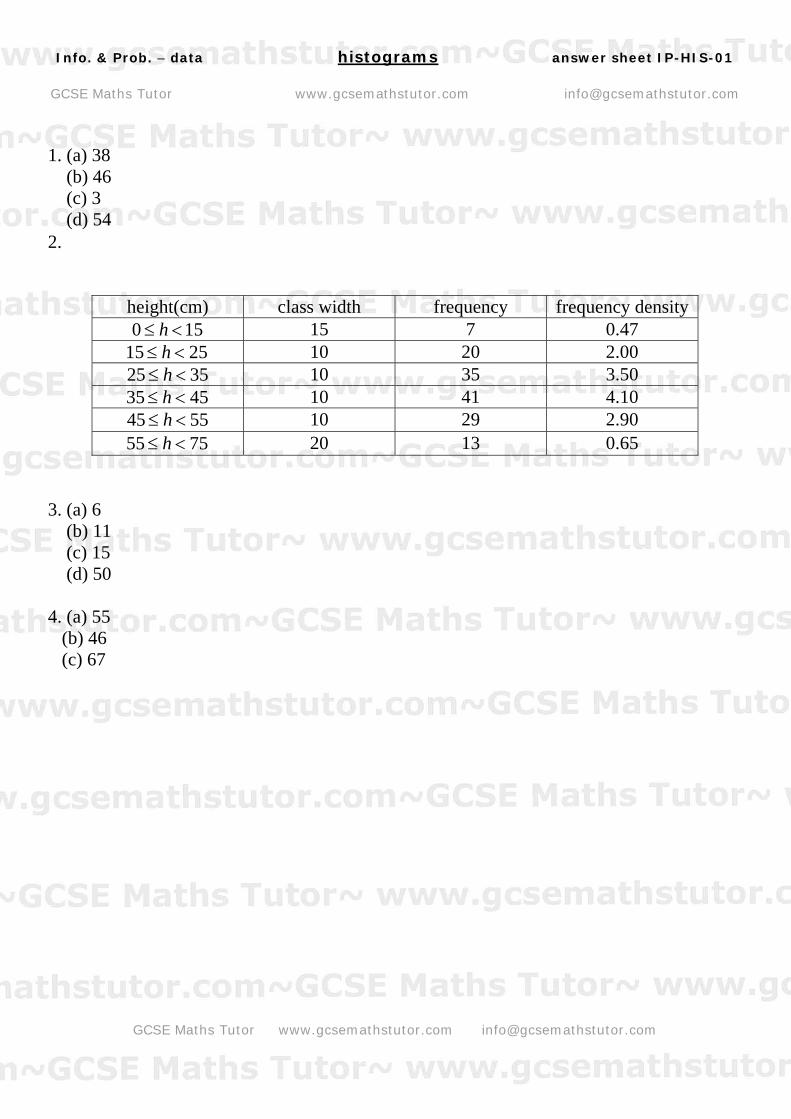
1. (a) 38 (b) 46 (c) 3 ( d) 54 2.
height(cm) class width frequency frequency density0 1h≤ < 5 15 7 0.47
15 25h≤ < 10 20 2.00 25 35h≤ < 10 35 3.50 35 45h≤ < 10 41 4.10 45 55h≤ < 10 29 2.90 55 75h≤ < 20 13 0.65
3. (a) 6 (b) 11 (c) 15 (d) 50 4. (a) 55 (b) 46 (c) 67
Info. & Prob. – data mode, median, mean, range question sheet IP-MMM-01 GCSE Maths Tutor www.gcsemathstutor.com [email protected]
GCSE Maths Tutor www.gcsemathstutor.com [email protected]
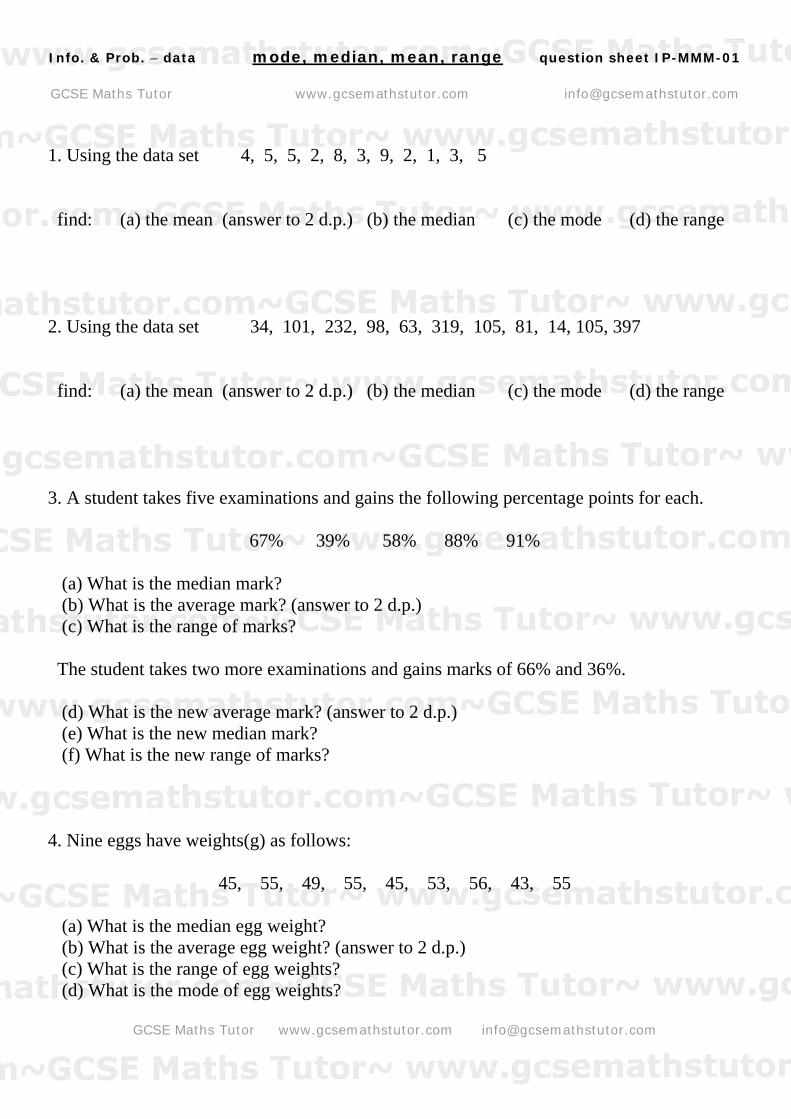
1. Using the data set 4, 5, 5, 2, 8, 3, 9, 2, 1, 3, 5 find: (a) the mean (answer to 2 d.p.) (b) the median (c) the mode (d) the range
2. Using the data set 34, 101, 232, 98, 63, 319, 105, 81, 14, 105, 397 find: (a) the mean (answer to 2 d.p.) (b) the median (c) the mode (d) the range 3. A student takes five examinations and gains the following percentage points for each.
67% 39% 58% 88% 91% (a) What is the median mark? (b) What is the average mark? (answer to 2 d.p.) (c) What is the range of marks? The student takes two more examinations and gains marks of 66% and 36%. (d) What is the new average mark? (answer to 2 d.p.) (e) What is the new median mark? (f) What is the new range of marks? 4. Nine eggs have weights(g) as follows:
45, 55, 49, 55, 45, 53, 56, 43, 55
(a) What is the median egg weight? (b) What is the average egg weight? (answer to 2 d.p.) (c) What is the range of egg weights? (d) What is the mode of egg weights?

Info. & Prob. – data mode, median, mean, range answer sheet IP-MMM-01 GCSE Maths Tutor www.gcsemathstutor.com [email protected]
GCSE Maths Tutor www.gcsemathstutor.com [email protected]
1. (a) 4.27 (b) 4 (c) 5 (d) 8
2. (a) 140.82 (b) 101 (c) 105 (d) 383 3. (a) 67% (b) 68.60% (c) 52% (d) 63.57% (e) 66% (f) 55% 4. (a) 53g (b) 50.67 (c) 13g (d) 55g

Info. & Prob. – data cumulative frequency question sheet IP-CUF-01 GCSE Maths Tutor www.gcsemathstutor.com [email protected]
GCSE Maths Tutor www.gcsemathstutor.com [email protected]
1. The table represents the height and numbers of saplings in a strip of farm land.
height(cm) numbers(frequency) cumulative frequency 50 60h< ≤ 2 60 70h< ≤ 9 70 80h< ≤ 15 80 90h< ≤ 12 90 100h< ≤ 7
(a) copy and complete the table (b) plot points and sketch a graph of cumulative frequency against height (c) use the graph to find the median height of saplings (d) what is the lower quartile value? (e) what is the higher quartile value? (f) what is the interquartile range? (g) how many saplings had a height more than 75 cm? (h) what height did more than 85% of the saplings attain? (all answers to nearest whole number)
2. The table represents the value of shoes in a shop and how many were sold in a month.
cost of a pair of shoes(£) pairs sold(frequency) cumulative frequency 5 cos 10t< ≤ 7
10 cos 15t< ≤ 21 15 cos 20t< ≤ 39 20 cos 25t< ≤ 24 25 cos 30t< ≤ 15
(a) copy and complete the table (b) plot points and sketch a graph of cumulative frequency against shoe cost (c) use the graph to find the median cost of shoes (d) what is the lower quartile value? (e) what is the higher quartile value? (f) what is the interquartile range? (g) how many shoes cost more than £27? (h) what was the highest price for 90% of the shoes? (all answers to nearest whole number)
Info. & Prob. – data cumulative frequency answer sheet IP-CUF-01 GCSE Maths Tutor www.gcsemathstutor.com [email protected]
GCSE Maths Tutor www.gcsemathstutor.com [email protected]
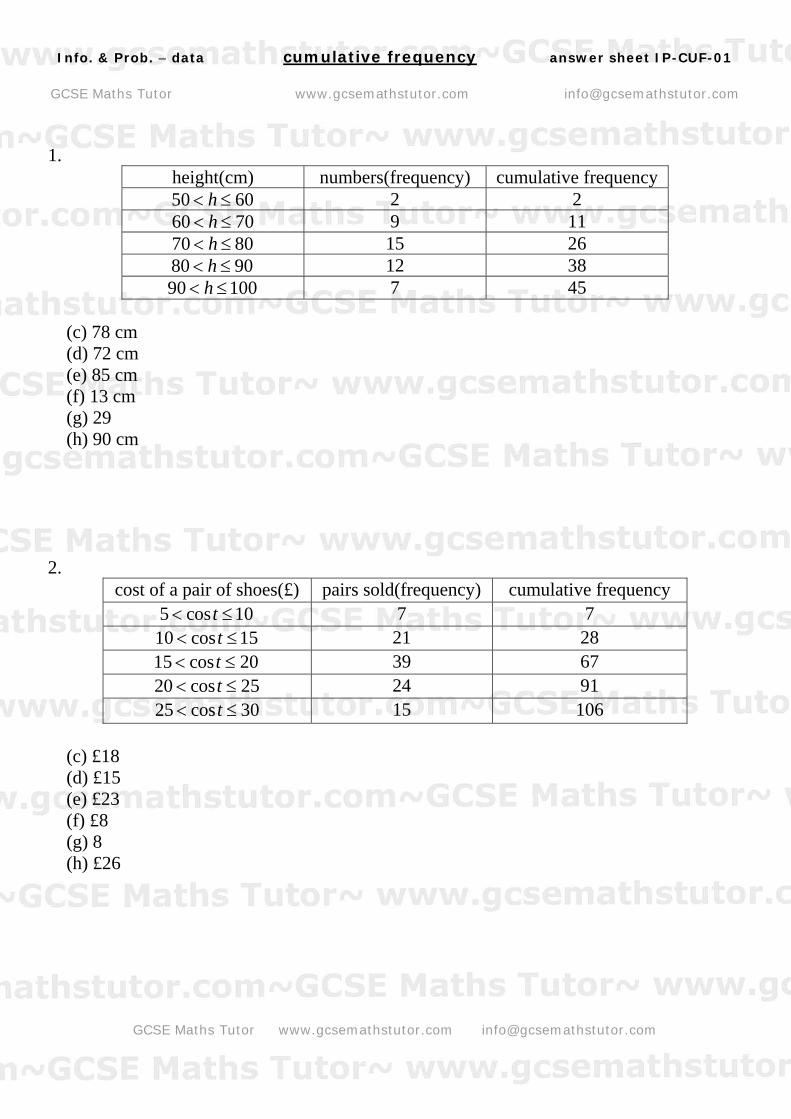
1.
height(cm) numbers(frequency) cumulative frequency 50 60h< ≤ 2 2 60 70h< ≤ 9 11 70 80h< ≤ 15 26 80 90h< ≤ 12 38 90 100h< ≤ 7 45
(c) 78 cm (d) 72 cm (e) 85 cm (f) 13 cm (g) 29 (h) 90 cm
2. cost of a pair of shoes(£) pairs sold(frequency) cumulative frequency
5 cos 10t< ≤ 7 7 10 cos 15t< ≤ 21 28 15 cos 20t< ≤ 39 67 20 cos 25t< ≤ 24 91 25 cos 30t< ≤ 15 106
(c) £18 (d) £15 (e) £23 (f) £8 (g) 8 (h) £26

Info. & Prob. – probability outcome of two events question sheet IP-TE-01 GCSE Maths Tutor www.gcsemathstutor.com [email protected]
GCSE Maths Tutor www.gcsemathstutor.com [email protected]
1. Two coins are flipped together. Using H for head and T for tail, list all the pairs of combinations from flipping the coins. 2. Sandwiches are available in chicken(C), beef(B) and ham(H). They can have fillers of salad(S), chilli(CH) and coleslaw(CO). Using the letter code e.g chicken and coleslaw C.CO , list all the pairs of combinations of sandwiches. 3. Two dices are thrown together. By drawing a table of all possible outcomes, work out the probability of the following scores. (answers to 3 d.p.) (a) 12 (b) 2 (c) 10 (d) 7 (e) 5 4. Two coloured spinners, each with 4 coloured regions(red, blue, green & yellow) are spun one after the other. What is the probability of the following outcomes? (answers to 3 d.p.) (a) two colours the same (b) red followed by a red (c) two different colours 5. Two coins are tossed at the same time. What is the probability of the following outcomes: (a) one head and one tail (b) two heads (c) both coins land the same way up 6. Three balls, one coloured yellow, one black and one white are in a cloth bag. One ball is removed from the bag and then another, without replacing the first ball. (answers to 3 d.p.) (a) What is the probability that a black ball is selected followed by a yellow ball? (b) On a new selection of two balls from three, what is the probability that a black ball is left in the bag? 7. A standard pack of cards consists of four suits of 13 cards - diamonds(red), hearts(red), clubs(black) and spades(black). If two cards are chosen randomly, (a) what is the probability that the second card will be the same suit as the first? (b) what is the probability that both cards will be aces. (c) what is the probability that both cards will be black. (answers to 4 d.p.)
Info. & Prob. – probability outcome of two events answer sheet IP-TE-01 GCSE Maths Tutor www.gcsemathstutor.com [email protected]
GCSE Maths Tutor www.gcsemathstutor.com [email protected]
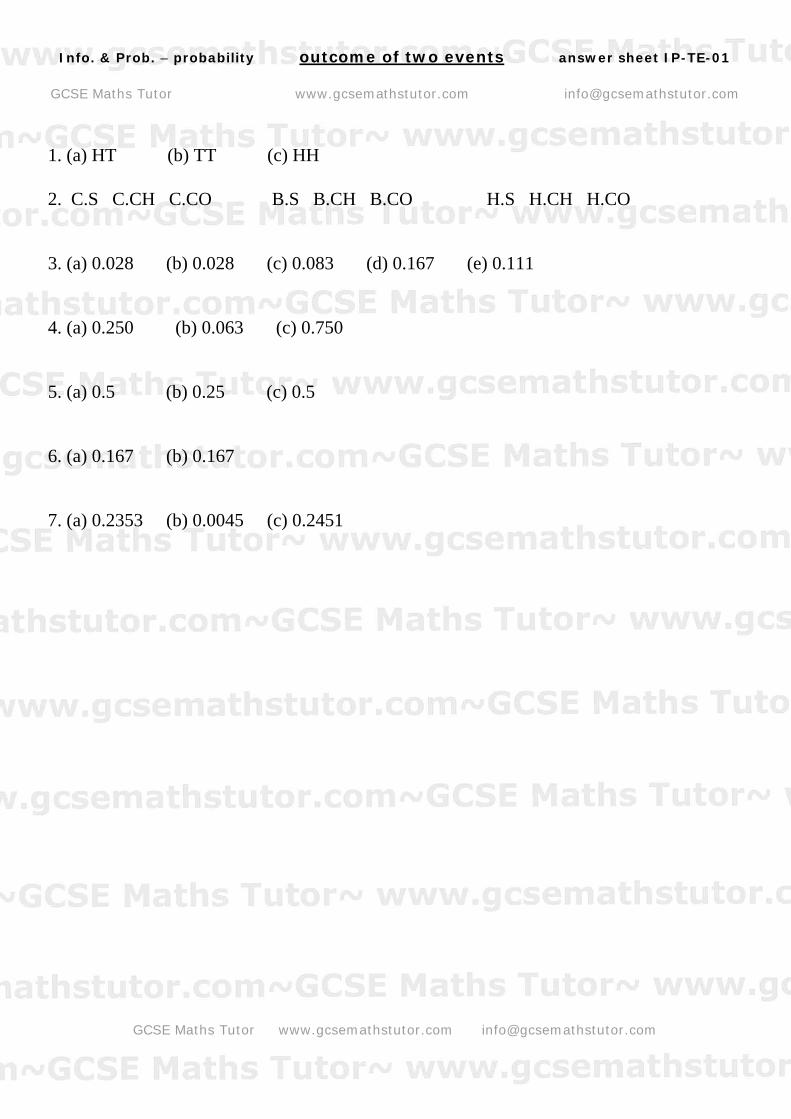
1. (a) HT (b) TT (c) HH 2. C.S C.CH C.CO B.S B.CH B.CO H.S H.CH H.CO 3. (a) 0.028 (b) 0.028 (c) 0.083 (d) 0.167 (e) 0.111 4. (a) 0.250 (b) 0.063 (c) 0.750 5. (a) 0.5 (b) 0.25 (c) 0.5 6. (a) 0.167 (b) 0.167 7. (a) 0.2353 (b) 0.0045 (c) 0.2451
Info. & Prob. – probability two mutually exclusive events question sheet IP-MEE-01 GCSE Maths Tutor www.gcsemathstutor.com [email protected]
GCSE Maths Tutor www.gcsemathstutor.com [email protected]
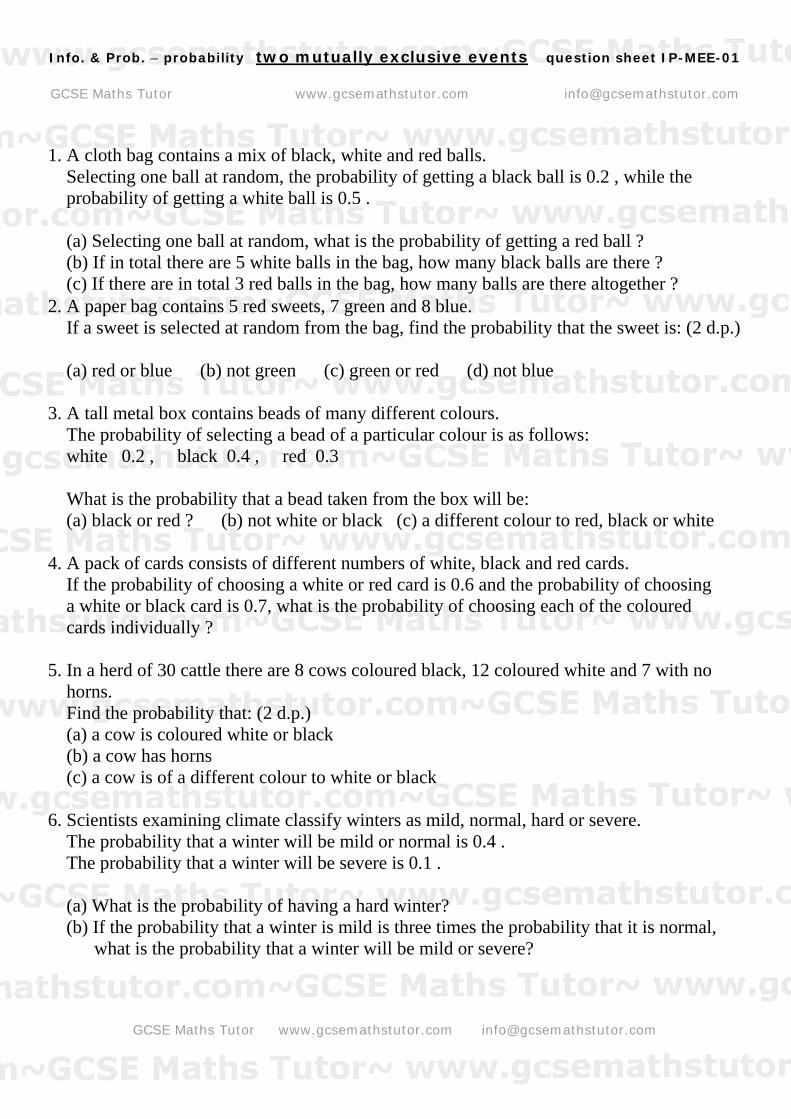
1. A cloth bag contains a mix of black, white and red balls. Selecting one ball at random, the probability of getting a black ball is 0.2 , while the probability of getting a white ball is 0.5 . (a) Selecting one ball at random, what is the probability of getting a red ball ? (b) If in total there are 5 white balls in the bag, how many black balls are there ? (c) If there are in total 3 red balls in the bag, how many balls are there altogether ? 2. A paper bag contains 5 red sweets, 7 green and 8 blue. If a sweet is selected at random from the bag, find the probability that the sweet is: (2 d.p.) (a) red or blue (b) not green (c) green or red (d) not blue 3. A tall metal box contains beads of many different colours. The probability of selecting a bead of a particular colour is as follows: white 0.2 , black 0.4 , red 0.3 What is the probability that a bead taken from the box will be: (a) black or red ? (b) not white or black (c) a different colour to red, black or white 4. A pack of cards consists of different numbers of white, black and red cards. If the probability of choosing a white or red card is 0.6 and the probability of choosing a white or black card is 0.7, what is the probability of choosing each of the coloured cards individually ? 5. In a herd of 30 cattle there are 8 cows coloured black, 12 coloured white and 7 with no horns. Find the probability that: (2 d.p.) (a) a cow is coloured white or black (b) a cow has horns (c) a cow is of a different colour to white or black 6. Scientists examining climate classify winters as mild, normal, hard or severe. The probability that a winter will be mild or normal is 0.4 . The probability that a winter will be severe is 0.1 . (a) What is the probability of having a hard winter? (b) If the probability that a winter is mild is three times the probability that it is normal, what is the probability that a winter will be mild or severe?
Info. & Prob. – probability two mutually exclusive events answer sheet IP-MEE-01 GCSE Maths Tutor www.gcsemathstutor.com [email protected]
GCSE Maths Tutor www.gcsemathstutor.com [email protected]
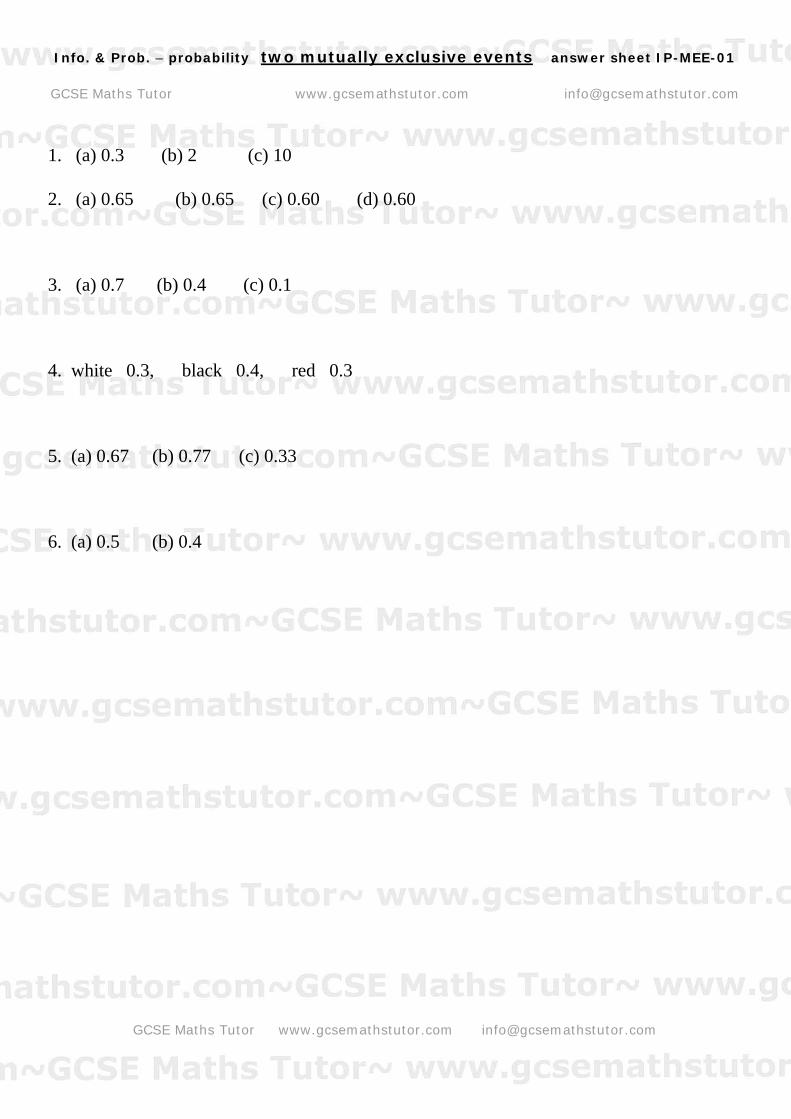
1. (a) 0.3 (b) 2 (c) 10 2. (a) 0.65 (b) 0.65 (c) 0.60 (d) 0.60 3. (a) 0.7 (b) 0.4 (c) 0.1 4. white 0.3, black 0.4, red 0.3 5. (a) 0.67 (b) 0.77 (c) 0.33 6. (a) 0.5 (b) 0.4