資 料 編 data book - suruga bank...資 料 編 data book - suruga bank ... 8
TRANSCRIPT

© 2017SURUGA bank, Ltd. All rights reserved.
資 料 編
Data Book
2019年9月期
1H, FY3/2020(April-September 2019)
SURUGA bank, Ltd.
© 2017SURUGA bank, Ltd. All rights reserved.© 2019SURUGA bank, Ltd. All rights reserved.
目次Table of contents
財務サマリー(連結・単体)Summary of financial results (Consolidated / Non-consolidated)
1
貸出金(末残)Loans (Period-end balance)
2
業種別貸出金(末残)Loan breakdown by industry (Period-end balance)
3
預金(末残)Deposits (Period-end balance)
4
預金(平残・利回り)Deposits (Average balance / Yield)
5
有価証券(末残・平残・利回り・評価損益)Securities (Period-end balance / Average balance / Yield / Unrealized gains (losses))
6
個人預り資産(末残)Individual deposit assets (Period-end balance)
7
利ざや(全体・国内)・経営指標・従業員数・店舗数Interest margins (Overall / Domestic) / Management indices / Number of employees and branches
8
与信関連費用Credit costs
9
自己資本比率Capital adequacy ratio
10
グループ会社の業績Summary of financial results of subsidiaries and affiliates
11

© 2017SURUGA bank, Ltd. All rights reserved.© 2019SURUGA bank, Ltd. All rights reserved. 1
財務サマリー(連結・単体)Summary of financial results (Consolidated / Non-consolidated)
連結 / Consolidated (10億円 / Billions of yen)1H, FY3/16 1H, FY3/17 1H, FY3/18 1H, FY3/19 1H, FY3/20
業務粗利益 / Gross operating profit 56.7 58.5 62.5 57.0 47.6業務純益 / Net operating profit 32.1 32.1 36.2 3.5 21.1実質与信費用 / Actual credit costs 3.1 4.3 5.4 124.1 8.5経常利益 / Ordinary profit 28.9 28.0 31.1 (85.7) 20.0親会社株主に帰属する中間純利益 又は親会社株主に帰属する中間純損失/Profit attributable to owners of parent
18.9 19.2 21.1 (100.7) 15.9
(末残 / Period-end balance) (10億円 / Billions of yen)Sep. 15 Sep. 16 Sep. 17 Sep. 18 Sep. 19
預金 / Deposits 4,075.9 4,089.1 4,065.8 3,410.3 3,159.0貸出金 / Loans 3,057.4 3,184.7 3,286.9 3,090.9 2,677.6有価証券 / Securities 227.5 225.0 125.5 144.3 129.8純資産 / Total net assets 304.8 315.4 362.5 238.9 253.6総資産 / Total assets 4,418.7 4,438.1 4,465.4 3,747.7 3,441.5
単体 / Non-consolidated (10億円 / Billions of yen)1H, FY3/16 1H, FY3/17 1H, FY3/18 1H, FY3/19 1H, FY3/20
業務粗利益 / Gross operating profit 53.0 54.0 57.0 53.9 42.4業務純益 / Net operating profit 29.8 30.0 33.1 3.3 18.3実質与信費用 / Actual credit costs 1.7 2.3 3.2 119.6 6.3経常利益 / Ordinary profit 27.8 27.4 29.9 (83.7) 19.3中間純利益 又は中間純損失/ Net income
18.5 19.1 20.4 (98.2) 15.6
(末残 / Period-end balance) (10億円 / Billions of yen)Sep. 15 Sep. 16 Sep. 17 Sep. 18 Sep. 19
預金 / Deposits 4,081.9 4,097.6 4,076.0 3,415.9 3,164.9貸出金 / Loans 3,057.8 3,184.6 3,286.0 3,085.8 2,671.6有価証券 / Securities 231.5 230.9 130.9 147.2 132.5純資産 / Total net assets 294.8 306.6 352.4 229.2 239.0総資産 / Total assets 4,407.9 4,431.9 4,458.8 3,735.8 3,424.6
© 2017SURUGA bank, Ltd. All rights reserved.© 2019SURUGA bank, Ltd. All rights reserved. 2
貸出金(末残)Loans (Period-end balance)
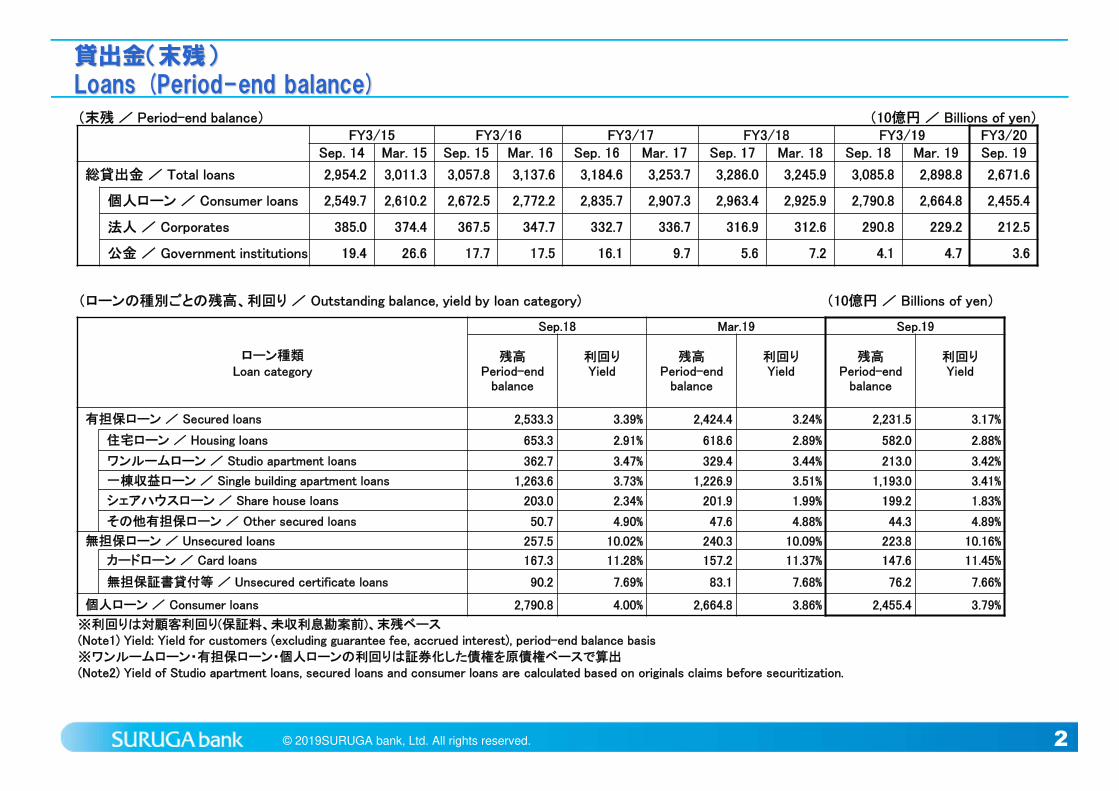
(末残 / Period-end balance) (10億円 / Billions of yen)FY3/15 FY3/16 FY3/17 FY3/18 FY3/19 FY3/20
Sep. 14 Mar. 15 Sep. 15 Mar. 16 Sep. 16 Mar. 17 Sep. 17 Mar. 18 Sep. 18 Mar. 19 Sep. 19
総貸出金 / Total loans 2,954.2 3,011.3 3,057.8 3,137.6 3,184.6 3,253.7 3,286.0 3,245.9 3,085.8 2,898.8 2,671.6
個人ローン / Consumer loans 2,549.7 2,610.2 2,672.5 2,772.2 2,835.7 2,907.3 2,963.4 2,925.9 2,790.8 2,664.8 2,455.4
法人 / Corporates 385.0 374.4 367.5 347.7 332.7 336.7 316.9 312.6 290.8 229.2 212.5
公金 / Government institutions 19.4 26.6 17.7 17.5 16.1 9.7 5.6 7.2 4.1 4.7 3.6
(ローンの種別ごとの残高、利回り / Outstanding balance, yield by loan category) (10億円 / Billions of yen)
ローン種類Loan category
Sep.18 Mar.19 Sep.19
残高Period-end
balance
利回りYield
残高Period-end
balance
利回りYield
残高Period-end
balance
利回りYield
有担保ローン / Secured loans 2,533.3 3.39% 2,424.4 3.24% 2,231.5 3.17%
住宅ローン / Housing loans 653.3 2.91% 618.6 2.89% 582.0 2.88%
ワンルームローン / Studio apartment loans 362.7 3.47% 329.4 3.44% 213.0 3.42%
一棟収益ローン / Single building apartment loans 1,263.6 3.73% 1,226.9 3.51% 1,193.0 3.41%
シェアハウスローン / Share house loans 203.0 2.34% 201.9 1.99% 199.2 1.83%
その他有担保ローン / Other secured loans 50.7 4.90% 47.6 4.88% 44.3 4.89%
無担保ローン / Unsecured loans 257.5 10.02% 240.3 10.09% 223.8 10.16%
カードローン / Card loans 167.3 11.28% 157.2 11.37% 147.6 11.45%
無担保証書貸付等 / Unsecured certificate loans 90.2 7.69% 83.1 7.68% 76.2 7.66%
個人ローン / Consumer loans 2,790.8 4.00% 2,664.8 3.86% 2,455.4 3.79%
※利回りは対顧客利回り(保証料、未収利息勘案前)、末残ベース(Note1) Yield: Yield for customers (excluding guarantee fee, accrued interest), period-end balance basis※ワンルームローン・有担保ローン・個人ローンの利回りは証券化した債権を原債権ベースで算出(Note2) Yield of Studio apartment loans, secured loans and consumer loans are calculated based on originals claims before securitization.

© 2017SURUGA bank, Ltd. All rights reserved.© 2019SURUGA bank, Ltd. All rights reserved. 3
業種別貸出金(末残)Loan breakdown by industry (Period-end balance)
(10億円 / Billions of yen)FY3/15 FY3/16 FY3/17 FY3/18 FY3/19 FY3/20
Sep. 14 Mar. 15 Sep. 15 Mar. 16 Sep. 16 Mar. 17 Sep. 17 Mar. 18 Sep. 18 Mar. 19 Sep. 19構成比
% toTotal
構成比% toTotal
構成比% toTotal
構成比% toTotal
構成比% toTotal
構成比% toTotal
構成比% toTotal
構成比% toTotal
構成比% toTotal
構成比% toTotal
構成比% toTotal
製造業Manufacturing
67.1 2.2% 70.1 2.3% 72.2 2.3% 66.3 2.1% 65.3 2.0% 66.7 2.0% 54.2 1.6% 54.2 1.6% 48.1 1.5% 38.6 1.3% 37.3 1.3%
農業、林業Agriculture and forestry
5.7 0.1% 5.6 0.1% 5.5 0.1% 5.4 0.1% 5.2 0.1% 5.1 0.1% 5.0 0.1% 4.9 0.1% 4.7 0.1% 4.6 0.1% 4.5 0.1%
漁業Fishery
0.4 0.0% 0.4 0.0% 0.1 0.0% 0.1 0.0% 0.0 0.0% 0.0 0.0% 0.0 0.0% 0.0 0.0% 0.0 0.0% 0.0 0.0% 0.0 0.0%
鉱業、採石業、砂利採取業Mining, quarrying and gravel
- - - - 0.0 0.0% - - - - - - - - - - 0.2 0.0% 0.2 0.0% 0.2 0.0%
建設業Construction
22.9 0.7% 21.8 0.7% 19.5 0.6% 19.0 0.6% 17.0 0.5% 16.6 0.5% 15.2 0.4% 15.4 0.4% 13.1 0.4% 12.7 0.4% 8.7 0.3%
電気、ガス、熱供給、水道業Utilities
5.9 0.1% 6.7 0.2% 5.6 0.1% 5.4 0.1% 5.2 0.1% 5.0 0.1% 3.1 0.0% 1.0 0.0% 1.1 0.0% 1.0 0.0% 1.0 0.0%
情報通信業Information and communication
1.6 0.0% 1.5 0.0% 1.6 0.0% 1.5 0.0% 1.5 0.0% 1.5 0.0% 1.4 0.0% 1.6 0.0% 1.3 0.0% 1.3 0.0% 1.2 0.0%
運輸業、郵便業Transportation andpostal service
13.7 0.4% 13.0 0.4% 13.0 0.4% 12.0 0.3% 11.9 0.3% 13.5 0.4% 13.2 0.4% 13.8 0.4% 12.7 0.4% 9.9 0.3% 9.8 0.3%
卸売業、小売業Wholesale and retail trade
49.1 1.6% 47.0 1.5% 44.0 1.4% 42.0 1.3% 38.8 1.2% 38.9 1.1% 37.4 1.1% 35.8 1.1% 31.6 1.0% 31.0 1.0% 31.6 1.1%
金融業、保険業Finance and insurance
81.2 2.6% 72.1 2.3% 73.6 2.4% 73.6 2.3% 73.0 2.2% 74.7 2.2% 74.0 2.2% 74.7 2.3% 70.6 2.2% 27.8 0.9% 27.2 1.0%
不動産業、物品賃貸業Real estate, goods rentaland leasing
86.8 2.8% 87.6 2.9% 85.8 2.8% 77.3 2.4% 70.2 2.2% 71.4 2.1% 70.3 2.1% 69.3 2.1% 67.5 2.1% 64.0 2.2% 53.7 2.0%
各種サービス業Services
45.5 1.5% 43.0 1.4% 40.6 1.3% 38.5 1.2% 37.6 1.1% 36.2 1.1% 35.6 1.0% 33.6 1.0% 30.9 1.0% 28.8 0.9% 27.6 1.0%
国・地方公共団体Government andmunicipal government
19.4 0.6% 26.6 0.8% 17.7 0.5% 17.5 0.5% 16.1 0.5% 9.7 0.2% 5.6 0.1% 7.2 0.2% 4.1 0.1% 4.7 0.1% 3.6 0.1%
その他Others
2,554.3 84.8% 2,615.3 86.8% 2,678.2 87.5% 2,778.3 88.5% 2,842.3 89.2% 2,913.9 89.5% 2,970.3 90.3% 2,933.8 90.3% 2,799.1 90.7% 2,673.6 92.2% 2,464.7 92.2%
合計Total
2,954.2 100.0% 3,011.3 100.0% 3,057.8 100.0% 3,137.6 100.0% 3,184.6 100.0% 3,253.7 100.0% 3,286.0 100.0% 3,245.9 100.0% 3,085.8 100.0% 2,898.8 100.0% 2,671.6 100.0%

© 2017SURUGA bank, Ltd. All rights reserved.© 2019SURUGA bank, Ltd. All rights reserved. 4
預金(末残)Deposits (Period-end balance)
(10億円 / Billions of yen)FY3/15 FY3/16 FY3/17 FY3/18 FY3/19 FY3/20
Sep. 14 Mar. 15 Sep. 15 Mar. 16 Sep. 16 Mar. 17 Sep. 17 Mar. 18 Sep. 18 Mar. 19 Sep. 19
総預金Total deposits
3,843.3 3,959.1 4,081.9 4,056.4 4,097.6 4,105.4 4,076.0 4,089.6 3,415.9 3,165.6 3,164.9
円貨預金Yen deposits
3,686.8 3,774.0 3,904.3 3,949.2 4,011.1 4,026.9 3,960.1 4,083.5 3,410.9 3,161.4 3,160.9
外貨預金Foreign currency deposits
156.5 185.1 177.6 107.1 86.4 78.5 115.9 6.1 4.9 4.2 4.0
個人Individuals
2,821.4 2,889.4 2,983.7 3,085.9 3,134.7 3,190.8 3,208.2 3,191.8 2,743.3 2,505.7 2,456.1
円貨預金Yen deposits
2,812.7 2,882.2 2,977.2 3,079.5 3,128.5 3,184.4 3,201.8 3,185.9 2,738.4 2,501.6 2,452.1
外貨預金Foreign currency deposits
8.6 7.1 6.4 6.3 6.2 6.3 6.3 5.9 4.8 4.1 3.9
法人Corporates
630.2 580.3 557.8 507.2 517.7 484.0 507.5 501.4 453.0 456.6 463.6
円貨預金Yen deposits
549.7 501.6 470.7 445.6 471.6 476.8 500.2 501.2 452.8 456.5 463.6
外貨預金Foreign currency deposits
80.4 78.7 87.0 61.5 46.1 7.2 7.3 0.2 0.1 0.0 0.0
公金Government institutions
391.7 489.3 540.4 463.3 445.0 430.5 360.2 396.3 219.5 203.3 245.1
円貨預金Yen deposits
324.3 390.1 456.3 424.0 411.0 365.6 258.0 396.3 219.5 203.3 245.1
外貨預金Foreign currency deposits
67.3 99.1 84.0 39.3 34.0 64.9 102.2 - - - -
※円貨預金=NCD含まず、非居住者円預金を含む。(Note) Yen deposits exclude NCD and include non-resident yen deposits.

© 2017SURUGA bank, Ltd. All rights reserved.© 2019SURUGA bank, Ltd. All rights reserved. 5
預金(平残・利回り)Deposits (Average balance / Yield)
(10億円 / Billions of yen)FY3/15 FY3/16 FY3/17 FY3/18 FY3/19 FY3/20
1st half Full year 1st half Full year 1st half Full year 1st half Full year 1st half Full year 1st half総預金Total deposits
3,789.3 3,813.1 3,967.8 4,012.6 4,036.3 4,054.5 4,050.1 4,047.0 3,791.3 3,504.2 3,078.9
円貨預金Yen deposits
3,651.1 3,669.0 3,803.7 3,853.8 3,960.4 3,982.7 3,969.1 3,975.5 3,785.4 3,499.0 3,074.9
外貨預金Foreign currency deposits
138.2 144.0 164.0 158.7 75.8 71.7 80.9 71.5 5.8 5.1 4.0
個人Individuals
2,767.0 2,807.3 2,914.5 2,966.5 3,097.9 3,127.5 3,195.3 3,198.8 3,015.1 2,799.2 2,464.7
円貨預金Yen deposits
2,758.0 2,799.0 2,907.7 2,959.9 3,091.6 3,121.2 3,189.0 3,192.6 3,009.6 2,794.2 2,460.7
外貨預金Foreign currency deposits
9.0 8.3 6.7 6.6 6.2 6.3 6.3 6.1 5.5 4.9 3.9
法人Corporates
607.4 583.5 541.4 540.4 485.1 482.6 486.9 487.1 472.2 440.4 390.3
円貨預金Yen deposits
526.6 503.6 462.2 461.5 448.9 456.8 479.7 481.3 471.9 440.2 390.3
外貨預金Foreign currency deposits
80.7 79.8 79.2 78.8 36.2 25.8 7.1 5.7 0.2 0.1 0.0
公金Government institutions
414.8 422.2 511.8 505.6 453.2 444.2 367.8 361.0 303.9 264.5 223.8
円貨預金Yen deposits
366.4 366.3 433.7 432.3 419.9 404.6 300.3 301.4 303.9 264.5 223.8
外貨預金Foreign currency deposits
48.4 55.8 78.0 73.3 33.3 39.5 67.4 59.6 - - -
※ 円貨預金=NCD含まず、非居住者円預金を含む。(Note) Yen deposits exclude NCD and include non-resident yen deposits.
(%)FY3/15 FY3/16 FY3/17 FY3/18 FY3/19 FY3/20
1st half Full year 1st half Full year 1st half Full year 1st half Full year 1st half Full year 1st half預金利回りYield on deposits
0.10 0.10 0.10 0.11 0.10 0.10 0.09 0.08 0.05 0.04 0.03
流動性預金Liquid deposits
0.02 0.02 0.02 0.02 0.00 0.00 0.00 0.00 0.00 0.00 0.00
固定性預金Fixed-term deposits
0.14 0.14 0.15 0.15 0.15 0.15 0.14 0.13 0.08 0.08 0.07
© 2017SURUGA bank, Ltd. All rights reserved.© 2019SURUGA bank, Ltd. All rights reserved. 6
有価証券(末残・平残・利回り・評価損益)Securities (Period-end balance / Average balance / Yield / Unrealized gains (losses))
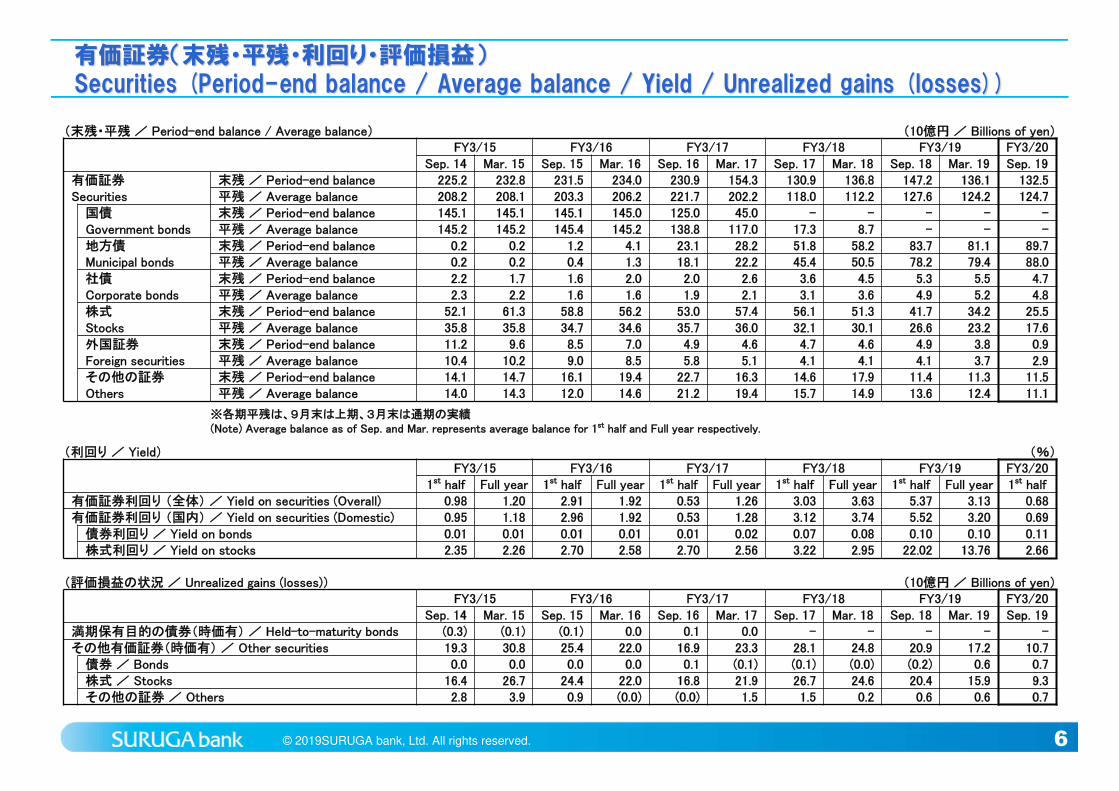
(末残・平残 / Period-end balance / Average balance) (10億円 / Billions of yen)FY3/15 FY3/16 FY3/17 FY3/18 FY3/19 FY3/20
Sep. 14 Mar. 15 Sep. 15 Mar. 16 Sep. 16 Mar. 17 Sep. 17 Mar. 18 Sep. 18 Mar. 19 Sep. 19有価証券 末残 / Period-end balance 225.2 232.8 231.5 234.0 230.9 154.3 130.9 136.8 147.2 136.1 132.5Securities 平残 / Average balance 208.2 208.1 203.3 206.2 221.7 202.2 118.0 112.2 127.6 124.2 124.7
国債 末残 / Period-end balance 145.1 145.1 145.1 145.0 125.0 45.0 - - - - -Government bonds 平残 / Average balance 145.2 145.2 145.4 145.2 138.8 117.0 17.3 8.7 - - -地方債 末残 / Period-end balance 0.2 0.2 1.2 4.1 23.1 28.2 51.8 58.2 83.7 81.1 89.7Municipal bonds 平残 / Average balance 0.2 0.2 0.4 1.3 18.1 22.2 45.4 50.5 78.2 79.4 88.0社債 末残 / Period-end balance 2.2 1.7 1.6 2.0 2.0 2.6 3.6 4.5 5.3 5.5 4.7Corporate bonds 平残 / Average balance 2.3 2.2 1.6 1.6 1.9 2.1 3.1 3.6 4.9 5.2 4.8株式 末残 / Period-end balance 52.1 61.3 58.8 56.2 53.0 57.4 56.1 51.3 41.7 34.2 25.5Stocks 平残 / Average balance 35.8 35.8 34.7 34.6 35.7 36.0 32.1 30.1 26.6 23.2 17.6外国証券 末残 / Period-end balance 11.2 9.6 8.5 7.0 4.9 4.6 4.7 4.6 4.9 3.8 0.9Foreign securities 平残 / Average balance 10.4 10.2 9.0 8.5 5.8 5.1 4.1 4.1 4.1 3.7 2.9その他の証券 末残 / Period-end balance 14.1 14.7 16.1 19.4 22.7 16.3 14.6 17.9 11.4 11.3 11.5Others 平残 / Average balance 14.0 14.3 12.0 14.6 21.2 19.4 15.7 14.9 13.6 12.4 11.1
※各期平残は、9月末は上期、3月末は通期の実績(Note) Average balance as of Sep. and Mar. represents average balance for 1st half and Full year respectively.
(利回り / Yield) (%)FY3/15 FY3/16 FY3/17 FY3/18 FY3/19 FY3/20
1st half Full year 1st half Full year 1st half Full year 1st half Full year 1st half Full year 1st half有価証券利回り (全体) / Yield on securities (Overall) 0.98 1.20 2.91 1.92 0.53 1.26 3.03 3.63 5.37 3.13 0.68有価証券利回り (国内) / Yield on securities (Domestic) 0.95 1.18 2.96 1.92 0.53 1.28 3.12 3.74 5.52 3.20 0.69
債券利回り / Yield on bonds 0.01 0.01 0.01 0.01 0.01 0.02 0.07 0.08 0.10 0.10 0.11株式利回り / Yield on stocks 2.35 2.26 2.70 2.58 2.70 2.56 3.22 2.95 22.02 13.76 2.66
(評価損益の状況 / Unrealized gains (losses)) (10億円 / Billions of yen)FY3/15 FY3/16 FY3/17 FY3/18 FY3/19 FY3/20
Sep. 14 Mar. 15 Sep. 15 Mar. 16 Sep. 16 Mar. 17 Sep. 17 Mar. 18 Sep. 18 Mar. 19 Sep. 19満期保有目的の債券(時価有) / Held-to-maturity bonds (0.3) (0.1) (0.1) 0.0 0.1 0.0 - - - - -その他有価証券(時価有) / Other securities 19.3 30.8 25.4 22.0 16.9 23.3 28.1 24.8 20.9 17.2 10.7
債券 / Bonds 0.0 0.0 0.0 0.0 0.1 (0.1) (0.1) (0.0) (0.2) 0.6 0.7株式 / Stocks 16.4 26.7 24.4 22.0 16.8 21.9 26.7 24.6 20.4 15.9 9.3その他の証券 / Others 2.8 3.9 0.9 (0.0) (0.0) 1.5 1.5 0.2 0.6 0.6 0.7

© 2017SURUGA bank, Ltd. All rights reserved.© 2019SURUGA bank, Ltd. All rights reserved. 7
個人預り資産(末残)Individual deposit assets (Period-end balance)
(10億円 / Billions of yen)FY3/15 FY3/16 FY3/17 FY3/18 FY3/19 FY3/20
Sep. 14 Mar. 15 Sep. 15 Mar. 16 Sep. 16 Mar. 17 Sep. 17 Mar. 18 Sep. 18 Mar. 19 Sep. 19
投資信託Mutual funds
125.4 134.3 122.0 119.4 110.6 107.9 104.4 93.6 88.1 80.4 76.7
個人年金保険Personal pension plans
81.3 71.0 63.2 56.4 51.4 43.7 38.0 35.6 33.3 25.4 23.3
一時払終身保険Single premium life insurance
13.5 14.2 14.9 14.9 14.6 14.2 14.7 15.2 15.4 15.3 15.1
国債等保護預りPublic bonds
27.1 22.3 17.0 14.1 11.8 10.2 9.2 8.8 8.4 8.3 7.8
外貨預金Foreign currency deposits
8.6 7.1 6.4 6.3 6.2 6.3 6.3 5.9 4.8 4.1 3.9
投資性商品 (A)Investment products (A)
256.1 249.0 223.7 211.4 194.8 182.6 172.8 159.3 150.2 133.6 127.2
個人預金(円貨)Individual deposits (Yen)
2,812.7 2,882.2 2,977.2 3,079.5 3,128.5 3,184.4 3,201.8 3,185.9 2,738.4 2,501.6 2,452.1
個人預り資産合計 (B)Total individual deposit assets (B)
3,068.9 3,131.3 3,201.0 3,291.0 3,323.3 3,367.1 3,374.7 3,345.2 2,888.7 2,635.2 2,579.3
投資性商品比率 (A) ÷ (B)The ratio of Investment products toTotal individual deposit assets (A) / (B)
8.3% 7.9% 6.9% 6.4% 5.8% 5.4% 5.1% 4.7% 5.2% 5.0% 4.9%

© 2017SURUGA bank, Ltd. All rights reserved.© 2019SURUGA bank, Ltd. All rights reserved. 8
利ざや(全体・国内)・経営指標・従業員数・店舗数Interest margins (Overall / Domestic) / Management indices / Number of employees and branches
(利ざや(全体) / Interest margins (Overall)) (%)FY3/15 FY3/16 FY3/17 FY3/18 FY3/19 FY3/20
1st half Full year 1st half Full year 1st half Full year 1st half Full year 1st half Full year 1st half資金運用利回り / Return on investments 2.59 2.65 2.72 2.70 2.73 2.81 2.89 2.93 2.82 2.84 2.71
貸出金利回り / Yield on loans 3.44 3.49 3.52 3.56 3.59 3.62 3.58 3.61 3.36 3.32 3.21有価証券利回り / Yield on securities 0.98 1.20 2.91 1.92 0.53 1.26 3.03 3.63 5.37 3.13 0.68
資金調達原価 / Yield on interest bearing liabilities 1.32 1.30 1.27 1.26 1.30 1.27 1.27 1.24 1.31 1.39 1.50預金等利回り / Yield on deposits 0.10 0.10 0.10 0.11 0.10 0.10 0.09 0.08 0.05 0.04 0.03経費率 / Expense ratio 1.22 1.19 1.16 1.14 1.19 1.16 1.17 1.15 1.25 1.33 1.45
預貸金利ざや /Loan-deposit margin (after deduction of expenses) 2.11 2.19 2.25 2.30 2.29 2.35 2.31 2.37 2.06 1.93 1.72
総資金利ざや / Net interest margin 1.26 1.35 1.44 1.43 1.42 1.54 1.62 1.68 1.51 1.45 1.21
(利ざや(国内) / Interest margins (Domestic)) (%)FY3/15 FY3/16 FY3/17 FY3/18 FY3/19 FY3/20
1st half Full year 1st half Full year 1st half Full year 1st half Full year 1st half Full year 1st half資金運用利回り / Return on investments 2.60 2.66 2.72 2.70 2.73 2.81 2.88 2.92 2.81 2.83 2.70
貸出金利回り / Yield on loans 3.46 3.51 3.54 3.57 3.59 3.62 3.58 3.61 3.36 3.32 3.21有価証券利回り / Yield on securities 0.95 1.18 2.96 1.92 0.53 1.28 3.12 3.74 5.52 3.20 0.69
資金調達原価 / Yield on interest bearing liabilities 1.29 1.27 1.24 1.22 1.26 1.23 1.22 1.20 1.26 1.34 1.44預金等利回り / Yield on deposits 0.09 0.10 0.10 0.10 0.10 0.09 0.08 0.07 0.05 0.04 0.03経費率 / Expense ratio 1.23 1.20 1.17 1.15 1.18 1.14 1.15 1.13 1.21 1.29 1.40
預貸金利ざや /Loan-deposit margin (after deduction of expenses) 2.13 2.20 2.25 2.31 2.31 2.38 2.34 2.40 2.09 1.97 1.76
総資金利ざや / Net interest margin 1.30 1.39 1.48 1.47 1.46 1.58 1.66 1.72 1.55 1.49 1.25
(経営指標 / Management indices)FY3/15 FY3/16 FY3/17 FY3/18 FY3/19 FY3/20
1st half Full year 1st half Full year 1st half Full year 1st half Full year 1st half Full year 1st halfOHR 48.5% 45.8% 43.7% 43.6% 44.7% 42.6% 41.7% 40.5% 44.1% 46.8% 52.8%EPS (円 / Unit: yen) 63.27 135.63 78.17 152.28 82.55 180.22 88.41 22.55 (424.26) (418.80) 67.50ROA (純利益ベース / Net income basis) 0.73% 0.78% 0.86% 0.82% 0.87% 0.95% 0.92% 0.11% (4.71%) (2.50%) 0.93%ROE (純利益ベース / Net income basis) 12.91% 13.92% 14.23% 14.12% 13.78% 15.14% 13.03% 1.67% (61.10%) (30.62%) 14.45%
(従業員数・店舗数 / Number of employees and branches)FY3/15 FY3/16 FY3/17 FY3/18 FY3/19 FY3/20
Sep. 14 Mar. 15 Sep. 15 Mar. 16 Sep. 16 Mar. 17 Sep. 17 Mar. 18 Sep. 18 Mar. 19 Sep. 19従業員数(人) / Number of employees (Unit: persons) 1,605 1,577 1,584 1,567 1,566 1,531 1,536 1,484 1,514 1,495 1,497店舗数(店) / Number of branches (Unit: branches) 130 131 133 132 133 133 132 132 132 131 130

© 2017SURUGA bank, Ltd. All rights reserved.© 2019SURUGA bank, Ltd. All rights reserved. 9
与信関連費用Credit costs
(10億円 / Billions of yen)FY3/15 FY3/16 FY3/17 FY3/18 FY3/19 FY3/20
1st half Full year 1st half Full year 1st half Full year 1st half Full year 1st half Full year 1st half
一般貸倒引当金繰入額Provision for general allowance for loan losses
- - - - (0.1) - 0.0 46.4 26.8 26.7 1.6
貸出金償却Write-off of loans
0.9 2.2 0.9 2.9 1.2 7.1 1.8 3.8 1.9 2.6 0.3
個別貸倒引当金繰入額Provision for specific allowance for loan losses
- - - - 0.6 - 0.7 12.2 90.3 105.4 4.2
延滞債権等売却損Losses on sales of delinquent loans
0.8 2.0 1.5 2.7 1.2 1.9 1.0 2.7 1.0 2.2 0.4
偶発損失引当金繰入額Provision for allowance for contingent losses
(0.1) (0.0) 0.0 0.0 0.0 0.0 0.0 0.0 (0.0) 0.0 (0.0)
貸倒引当金戻入益 (△)Reversal of allowance for loan losses (-)
1.3 2.4 0.5 0.6 - 2.5 - - - - -
与信費用Net credit costs
0.4 1.7 2.0 5.0 2.9 6.5 3.7 65.3 120.1 137.0 6.6
与信費用比率 (年率換算)Net credit costs ratio (annualized)
0.03% 0.05% 0.13% 0.16% 0.18% 0.20% 0.23% 2.02% 7.64% 4.48% 0.48%
償却債権取立益 (△)Recoveries on written-off claims (-)
0.2 0.7 0.2 0.6 0.5 1.0 0.4 1.3 0.5 0.7 0.2
実質与信費用Actual credit costs
0.1 0.9 1.7 4.4 2.3 5.5 3.2 64.0 119.6 136.3 6.3
実質与信費用比率 (年率換算)Actual credit costs ratio (annualized)
0.01% 0.03% 0.11% 0.14% 0.15% 0.17% 0.20% 1.98% 7.61% 4.46% 0.46%
FY3/15 FY3/16 FY3/17 FY3/18 FY3/19 FY3/201st half Full year 1st half Full year 1st half Full year 1st half Full year 1st half Full year 1st half
貸出金平残Average loan balance
2,846.2 2,883.8 2,964.7 3,004.0 3,105.1 3,136.0 3,223.1 3,229.7 3,134.8 3,054.7 2,739.3
与信費用比率=与信費用/貸出金平残 / Net credit costs ratio = Net credit costs / Average loan balance
実質与信費用比率=実質与信費用/貸出金平残 / Actual credit costs ratio = Actual credit costs / Average loan balance実質与信費用=与信費用-償却債権取立益 / Actual credit costs = Net credit costs - Recoveries on written-off claims

© 2017SURUGA bank, Ltd. All rights reserved.© 2019SURUGA bank, Ltd. All rights reserved. 10
自己資本比率Capital adequacy ratio
自己資本比率 / Capital adequacy ratio
国内基準 / Domestic standard
(連結 / Consolidated) (10億円 / Billions of yen)FY3/15 FY3/16 FY3/17 FY3/18 FY3/19 FY3/20
Sep. 14 Mar. 15 Sep. 15 Mar. 16 Sep. 16 Mar. 17 Sep. 17 Mar. 18 Sep. 18 Mar. 19 Sep. 19自己資本比率Capital adequacy ratio
11.62% 11.69% 12.25% 11.67% 12.37% 12.17% 12.93% 12.22% 8.64% 8.90% 9.33%
自己資本Own capital (Core capital)
262.6 272.8 289.4 286.0 303.4 315.8 335.1 331.0 223.1 220.0 235.7
控除項目(調整項目)Regulatory adjustments (-)
2.3 6.9 6.9 11.3 11.1 16.3 16.6 22.4 27.8 36.1 36.8
リスク・アセット等Risk-weighted assets
2,260.0 2,332.5 2,362.2 2,449.0 2,452.1 2,594.6 2,590.3 2,708.0 2,580.1 2,470.8 2,524.0
(単体 / Non-consolidated) (10億円 / Billions of yen)FY3/15 FY3/16 FY3/17 FY3/18 FY3/19 FY3/20
Sep. 14 Mar. 15 Sep. 15 Mar. 16 Sep. 16 Mar. 17 Sep. 17 Mar. 18 Sep. 18 Mar. 19 Sep. 19自己資本比率Capital adequacy ratio
11.53% 11.59% 12.15% 11.56% 12.22% 11.96% 12.70% 12.15% 8.65% 8.80% 9.23%
自己資本Own capital (Core capital)
257.6 267.2 283.1 279.2 295.9 307.2 325.5 324.7 219.7 213.7 228.9
控除項目(調整項目)Regulatory adjustments (-)
0.0 4.0 4.1 8.5 8.5 13.9 13.9 18.5 23.7 29.5 30.8
リスク・アセット等Risk-weighted assets
2,234.4 2,305.2 2,329.2 2,415.1 2,421.1 2,567.4 2,562.0 2,671.1 2,538.0 2,427.0 2,479.6
※自己資本比率は、「銀行法第14条の2の規定に基づき、銀行がその保有する資産等に照らし自己資本の充実の状況が適当であるかどうかを判断するための基準(平成18年金融庁告示第19号)」に基づき算出しております。なお、当社は国内基準にて開示しております。
(Note) Capital adequacy ratio is computed using the method stipulated in the “Standards for a bank to examine the status of capital adequacy in consideration of assets held by itpursuant to the Article 14-2 of the Banking Act” (Notification No. 19 issued by the Japanese Financial Services Agency in 2006). The company has applied domestic standard.
※バーゼルⅢを踏まえた新国内基準により算出しております。(Note) Capital adequacy ratio has been calculated in accordance with the new domestic standard based on “Basel Ⅲ”.

© 2017SURUGA bank, Ltd. All rights reserved.© 2019SURUGA bank, Ltd. All rights reserved. 11
グループ会社の業績Summary of financial results of subsidiaries and affiliates
(10億円 / Billions of yen)
会社名Company name
主要業務Main business
1H, FY3/20 前年同期比YoY change
スルガスタッフサービス(株)Suruga Staff Service Co., Ltd.
人材派遣業務Staffing
経常収益 / Ordinary income 0.1 0.0経常利益 / Ordinary profit 0.0 0.0中間純利益 / Net income 0.0 0.0
ダイレクトワン(株)DIRECTONE Co., Ltd.
貸金業務・保証業務Money lending and Credit guarantee
経常収益 / Ordinary income 1.8 (0.3)経常利益 / Ordinary profit 0.1 (0.7)中間純利益 / Net income 0.1 (0.4)
ライフ ナビ パートナーズ(株)Life NAVI PARTNERS Co., Ltd.
保険募集業務Insurance policy solicitation
経常収益 / Ordinary income 0.6 0.1経常利益 / Ordinary profit (0.1) 0.1中間純利益 / Net income (0.2) 0.0
SDP(株)SDP Co., Ltd.
住宅ローン等の保証業務Guarantee of mortgage loans, etc.
経常収益 / Ordinary income 0.7 0.0経常利益 / Ordinary profit 0.3 0.1中間純利益 / Net income 0.2 0.1
(株)エイ・ピー・アイA・P・I
印刷・製本業務、梱包・発送業務Printing, Bookbinding, Packing and Shipping
経常収益 / Ordinary income 0.1 0.0経常利益 / Ordinary profit 0.0 0.0中間純利益 / Net income 0.0 0.0
スルガカード(株)Suruga Card Co., Ltd.
クレジットカード業務Credit card services
経常収益 / Ordinary income 0.5 0.1経常利益 / Ordinary profit 0.1 0.0中間純利益 / Net income 0.0 0.0
スルガ・キャピタル(株)Suruga Capital Co., Ltd.
リース業務、保証業務Leasing and Credit guarantee
経常収益 / Ordinary income 3.2 (0.4)経常利益 / Ordinary profit 0.1 (0.1)中間純利益 / Net income 0.0 (0.1)
スルガコンピューターサービス(株)Suruga Computer Service Co., Ltd.
事務処理代行業務・システム開発業務Clerical agency services and System engineering
経常収益 / Ordinary income 0.4 0.0経常利益 / Ordinary profit 0.0 0.0中間純利益 / Net income 0.0 0.0
中部債権回収(株)CHUBU SERVICER Co., Ltd.
債権管理回収業務Servicer
経常収益 / Ordinary income 0.5 0.0経常利益 / Ordinary profit 0.0 0.0中間純利益 / Net income 0.0 0.0
合 計Total
経常収益 / Ordinary income 8.2 (0.6)経常利益 / Ordinary profit 0.5 (0.8)中間純利益 / Net income 0.2 (0.5)
持分法適用関連会社 / Equity-method accounted affiliates
SDPセンター(株)SDP Center Co., Ltd.
事務処理代行業務Clerical agency services
経常収益 / Ordinary income 0.4 (0.2)経常利益 / Ordinary profit 0.0 0.0中間純利益 / Net income 0.0 0.0

( 本件に関する照会先 / Inquiries )
総合企画本部 広報室 / IR Office, SURUGA bank, Ltd.
[TEL] 03-3279-5536 / +81-3-3279-5536
[e-mail] [email protected]