e-drive vehicle sales analyses - department of energy · e-drive vehicle sales analyses project...
TRANSCRIPT

Principal investigator: Yan (Joann) Zhou
Energy Systems DivisionArgonne National Laboratory
E-drive Vehicle Sales Analyses
Project VAN011
This presentation does not contain any proprietary, confidential, or otherwise restricted information
2015 Vehicle Technologies Annual Merit Review
June 11, 2015

OverviewTimeline Barriers
Start Date: October 2014End Date: Project continuation and direction determined annually by DOE
• Lack of readily available historical sales in the U.S. and other markets
• Lack of data on advanced vehicle usage and survival pattern
• Lack of data on cost components for levelizedcost analyses
• Limited understanding of existing E-drive vehicle purchase trend
Budget PartnersTotal Project Funding (DOE)• FY14: $84k (plus $56K for Navigant
report subscription)• FY15: $90k
Interaction/Collaborations• Hybridcars.com• European Automotive Industry Newsletter• Kelley Blue Book, NADA• Navigant Research• Tsinghua University, Beijing, China• National Renewable Energy Laboratory
2
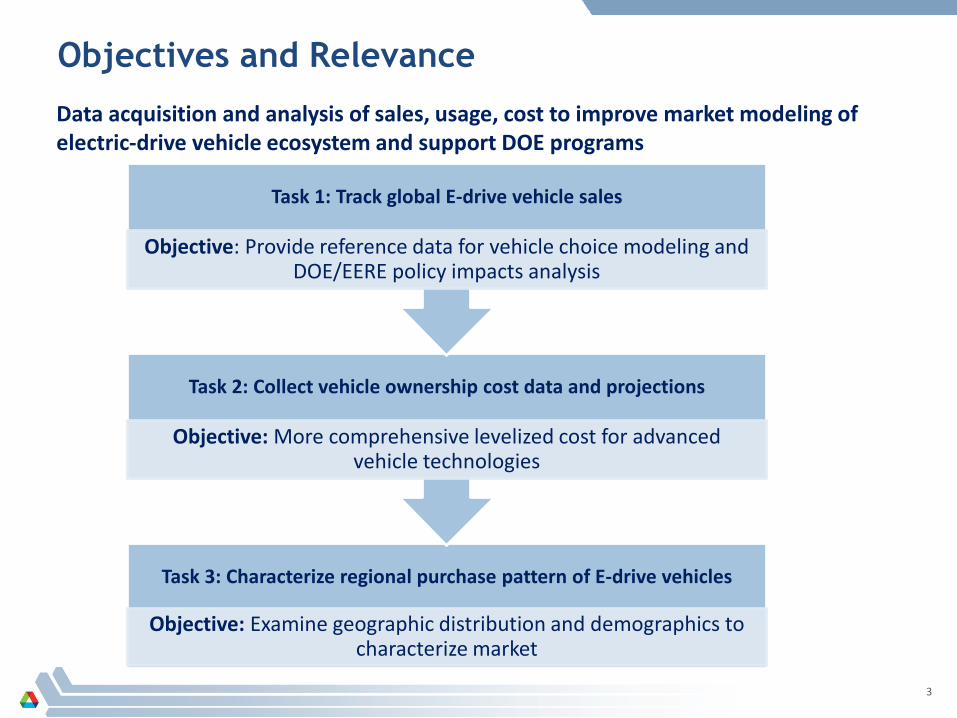
Data acquisition and analysis of sales, usage, cost to improve market modeling of electric-drive vehicle ecosystem and support DOE programs
Objectives and Relevance
Task 3: Characterize regional purchase pattern of E-drive vehicles
Objective: Examine geographic distribution and demographics to characterize market
Task 2: Collect vehicle ownership cost data and projections
Objective: More comprehensive levelized cost for advanced vehicle technologies
Task 1: Track global E-drive vehicle sales
Objective: Provide reference data for vehicle choice modeling and DOE/EERE policy impacts analysis
3

Approach and Accomplishments
Task Approach Accomplishments
Task 1: Track global E-drive vehicle sales
Collect historical sales by make and model
Summarize financial and non-financial policies matrix
• Monthly U.S. EV sales market report
• Monthly data products published on ANL and DOE website
• International sales trend comparison
• E-drive vehicle policy matrix for each country/region
Task 2: Characterize regional purchase pattern
Analyze sales by geographic and demographic factors to determine locations of plug-in vehicle sales and identify market niches
• Regional PEV adoption pattern
• Identified E-drive vehicle market niches in city/suburb/rural areas
Task 3: Collect vehicle ownership cost data and projections (New task)
Collect vehicle resale values and total ownership cost by model and market segment
• Summarized who has what based on data review and discussion with different data providers
4

Milestones
Due Date Milestones Status
Q1 FY2015 Publish monthly sales and market reports Completed
Q4 FY2015 Summarize total ownership cost by model and market On schedule
Q4 FY2015Summarize adoption trend and market niches in 4 selected
regions On schedule
5

Plug-in Electric Vehicles sales are growing, if somewhat erratically
0
2,000
4,000
6,000
8,000
10,000
12,000
14,000D
ec-1
0Ja
n-11
Feb-
11M
ar-1
1A
pr-1
1M
ay-1
1Ju
n-11
Jul-1
1A
ug-1
1Se
p-11
Oct
-11
Nov
-11
Dec
-11
Jan-
12Fe
b-12
Mar
-12
Apr
-12
May
-12
Jun-
12Ju
l-12
Aug
-12
Sep-
12O
ct-1
2N
ov-1
2D
ec-1
2Ja
n-13
Feb-
13M
ar-1
3A
pr-1
3M
ay-1
3Ju
n-13
Jul-1
3A
ug-1
3Se
p-13
Oct
-13
Nov
-13
Dec
-13
Jan-
14Fe
b-14
Mar
-14
Apr
-14
May
-14
Jun-
14Ju
l-14
Aug
-14
Sep-
14O
ct-1
4N
ov-1
4D
ec-1
4Ja
n-15
New
Plu
g-In
Veh
icle
Sal
es
Porsche Cayenne S E-hybridBMW i8Cadillac ELRPanamera S E-HybridFord Fusion EnergiHonda AccordFord C-Max EnergiPrius PHEVVoltKia Soul EVVW e-GolfMercedes B-ClassBMW i3Fiat 500EChevrolet SparkRAV4 EVTesla Model S*Honda Fit EVFord FocusBMW Active EMitsubishi I EVSmart EDLeaf
Source: http://www.transportation.anl.gov/technology_analysis/edrive_vehicle_monthly_sales.html
0
2,000
4,000
6,000
8,000
10,000
12,000
14,000D
ec-1
0Ja
n-11
Feb-
11M
ar-1
1A
pr-1
1M
ay-1
1Ju
n-11
Jul-1
1A
ug-1
1Se
p-11
Oct
-11
Nov
-11
Dec
-11
Jan-
12Fe
b-12
Mar
-12
Apr
-12
May
-12
Jun-
12Ju
l-12
Aug
-12
Sep-
12O
ct-1
2N
ov-1
2D
ec-1
2Ja
n-13
Feb-
13M
ar-1
3A
pr-1
3M
ay-1
3Ju
n-13
Jul-1
3A
ug-1
3Se
p-13
Oct
-13
Nov
-13
Dec
-13
Jan-
14Fe
b-14
Mar
-14
Apr
-14
May
-14
Jun-
14Ju
l-14
Aug
-14
Sep-
14O
ct-1
4N
ov-1
4D
ec-1
4Ja
n-15
New
Plu
g-in
Veh
icle
Sal
es
Toyota Prius
Chevrolet Volt
Nissan Leaf
TeslaModel S
FordC-Max
FordFusion
BMW i3
Others
Sales fluctuate due to: • Seasonal change (e.g. January)• Product life cycle
(e.g. Prius PHEV and Volt in the end of 2014)• State Incentives
(e.g. GA began offering $5000 for ZEVs in August 2013)• New model introduction/lower price
(e.g. Lower-priced Volt and Leaf in 2013)• Supply limitations• Gasoline prices
State incentives
Supply limits
Accomplishment
6

pickup
4% 2%
7% 4%
51%
28%
1% 2%
EV
Midsize
Large
2.2%1.3%
7.8%
17.8%
54.4%
14.9%
0.6% 1.0%
PEV
Large
Midsize
PEVs are available in diverse models covering more vehicle classes and types than HEVs
2014 Sales by EPA Size Class
0.8%7.2%
81.7%
4.4%5.9%
HEV
two seatersminicompactsubcompactcompactmidsizelargestation wagonSUVPickup
Midsize
8%
32%
58%
2%
PHEV
CompactMidsize
HEVs are predominantly mid-size cars
PHEVs tend to be smaller than HEVs, with larger shares of compacts and subcompacts
BEVs are larger on average than PHEVs (due to success of the large Tesla Model S and the mid-size Leaf)
Source: http://www.transportation.anl.gov/technology_analysis/edrive_vehicle_monthly_sales.html
Accomplishment
7
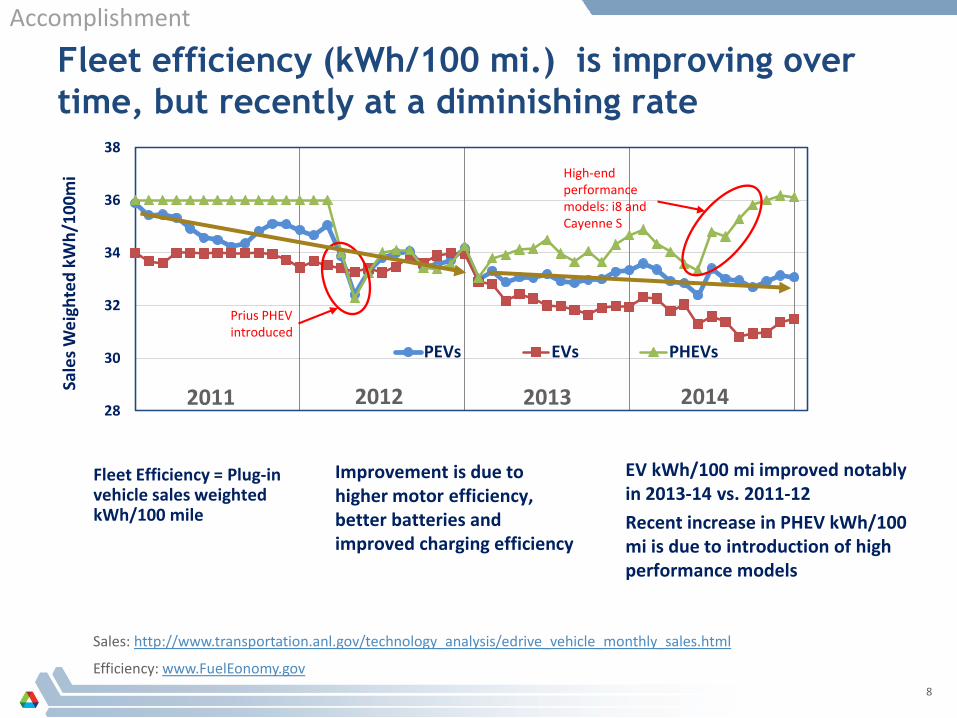
Fleet efficiency (kWh/100 mi.) is improving over time, but recently at a diminishing rate
Fleet Efficiency = Plug-in vehicle sales weighted kWh/100 mile
Improvement is due to higher motor efficiency, better batteries and improved charging efficiency
28
30
32
34
36
38
Sale
s Wei
ghte
d kW
h/10
0mi
PEVs EVs PHEVs
High-end performance models: i8 and Cayenne S
Prius PHEV introduced
EV kWh/100 mi improved notably in 2013-14 vs. 2011-12Recent increase in PHEV kWh/100 mi is due to introduction of high performance models
Sales: http://www.transportation.anl.gov/technology_analysis/edrive_vehicle_monthly_sales.html
Efficiency: www.FuelEonomy.gov
2011 2012 2013 2014
Accomplishment
8

Declines in the price of gasoline tend to reduce the incentive for people to buy HEVs. PEVs?
0
50
100
150
200
250
300
350
400
450
500
0
5,000
10,000
15,000
20,000
25,000
30,000
35,000
40,000
45,000
50,000
55,000
Oct
-99
Jan-
00A
pr-0
0Ju
l-00
Oct
-00
Jan-
01A
pr-0
1Ju
l-01
Oct
-01
Jan-
02A
pr-0
2Ju
l-02
Oct
-02
Jan-
03A
pr-0
3Ju
l-03
Oct
-03
Jan-
04A
pr-0
4Ju
l-04
Oct
-04
Jan-
05A
pr-0
5Ju
l-05
Oct
-05
Dec
-05
Apr
-06
Jul-0
6Se
p-06
Dec
-06
Apr
-07
Jul-0
7Se
p-07
Dec
-07
Mar
-08
Jun-
08Se
p-08
Dec
-08
Mar
-09
Jun-
09Se
p-09
Dec
-09
Mar
-10
Jun-
10Se
p-10
Dec
-10
Mar
-11
Jun-
11Se
p-11
Dec
-11
Mar
-12
Jun-
12Se
p-12
Dec
-12
Mar
-13
Jun-
13Se
p-13
Dec
-13
Mar
-14
Jun-
14Se
p-14
Dec
-14
Mar
-15
Jun-
15Se
p-15
Gas
olin
e Pr
ice
(cen
ts/g
allo
n)
Mon
thly
Sal
es
PEV Sales
Gasoline Price
HEV Sales
The price of gasoline is beyond the control of the automakers. So far it has affected HEVs more than PEVs.
Source: http://www.transportation.anl.gov/technology_analysis/edrive_vehicle_monthly_sales.html
Accomplishment
9

Extensive use of data products by DOE programs and other agencies Publish monthly sales and market trend on both Argonne and DOE websites Support DOE/EERE programs and activities such as eGallon Develop extra charts and provide interpretation as needed for DOE project
managers (market share, comparison of sales by model since market introduction, etc.)
DOE Website: http://energy.gov/articles/visualizing-electric-vehicle-salesANL Website:http://www.transportation.anl.gov/technology_analysis/edrive_vehicle_monthly_sales.html
National Science Foundation links to ANL EV sales webpage
Accomplishment
10

E-drive vehicle policy matrix for each country/region (China example)
Numerical Targets: Chinese State Council established goal 5 million PEV sales by 2020 under “Ten Cities One Thousand Vehicles” program
Regulation/Emission Standards: Set fleet average fuel consumption target of 5 L/100 km (47 mpg) by 2020
Fiscal Incentives to Consumers:– Phase 1 Subsidy: (2009-2012) for purchases of vehicles used for public service, such as
taxis and transit buses in selected cities.– Phase 1 Subsidy was extended in 2012 to nationwide. Subsidies were based on each
vehicle’s battery capacity: about $490/kWh toward any private PEV purchase (maximum $8200 per PHEV and $9835 per EV.
– Phase 2 Subsidy: (9/2013- Present) the basis for obtaining subsidy shifted from battery capacity to electric range (about $5700 - $100,000 for range over 30 miles)
– Phase 2 Subsidy will scale back by 20% in 2017-2018 and by 40% in 2019-2020
Accomplishment
11
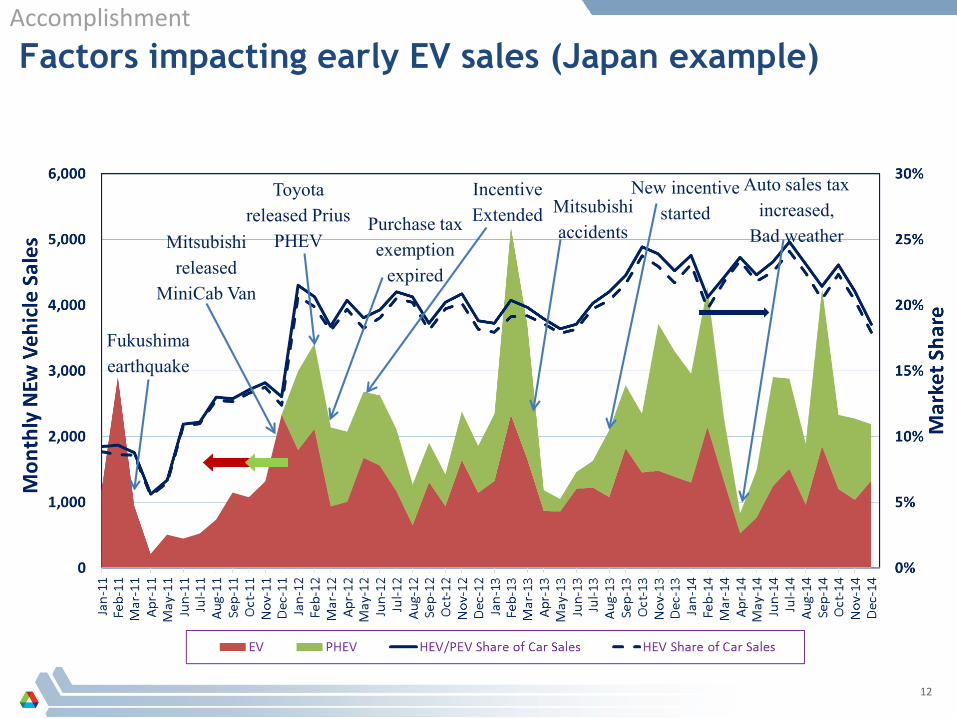
Fukushima earthquake
Purchase tax exemption
expired
New incentive startedMitsubishi
accidentsMitsubishi released
MiniCab Van
Incentive Extended
Toyota released Prius
PHEV
Auto sales tax increased,
Bad weather
Factors impacting early EV sales (Japan example) Accomplishment
12

Although the U.S. sells more PEVs, Japan sells many more HEVs and has a much higher market share
U.S. Vs. Japan Vs. W. EuropeSales and Market Share (of new car sales)
1.5%
.34%.68%
20.1%
6.1%
1.25%1.1%
.2%
19.3%
.59%
5.5%
.71%.1%
.8%
.32%
11%
.28%
3.7%
9.2%
3.9%
Note: Europe sales are BEV and PHEV combined
.49%.65%
5.4%
1.5%
1.6%
21.6%
Accomplishment
13

California leads the US in the adoption of PEVs. Charging infrastructure matches fairly well with PEV share.
CA 45%
Others 20%
GA 6%
Accomplishment
%PEV: state share of PEVs %CO: state share of charging outlets%LDV: state share of LDVs
2014 PEV Share Vs. Charging Outlets Share by State
PEV Stock Share
PEV/1000 people
Note: ZEV MOU States
Sources: Registration data provided by National Renewable Energy LaboratoryPopulation data estimated from U.S. Census Bureau Population Estimation by July 1 2014 14

BEVx most successful in outer suburbs; EREVs beat BEVs & PHEVs throughout suburbs (Chicago example)
5/18/201515
While BEVs in total look competitive in IL, affordable,100 mi. range mass market BEVs do not
Accomplishment
REX’ added gasoline range increases i3 marketability, expands low density suburban and rural shares.
Source: Registration data provided by National Renewable Energy Laboratory

High performance BEV benefits far exceed those of standard performance BEVs at all mph
5/18/201516
Compared to comparable gasoline vehicle
Infrastructure Impact Question: Will workplace charging be enough to help high performance PHEVs?
Accomplishment
High performance BEVs save much more than PHEVs

Collaboration and CoordinationTsinghua University, Beijing provides sales from China and Japan market
European Automotive Industry Newsletter (based in UK) provides European sales and gives permission to use the data
Collaborate with G. Mitchell (NREL) on regional PEV sales analysis
Explore opportunity for data acquisition and analysis with Alg, Vincentric, etc
17

Proposed Future Work
Task Future Work
Collect global E-drive vehicle sales
• Continue tracking U.S. sales and publish data products monthly
• Gather and maintain international E-drive vehicle sales and incentives databases for comparison
• Analyze sales to show trend and market niches
Characterize regional purchase pattern of E-drive vehicles
• Additional cities/regions (Atlanta, Boston, Los Angeles)
• Derive heterogenic national purchase/adoption trend
Collect vehicle ownership cost data and projections
• Collect resale data of E-drive vehicles from chosen database
• Analyze levelized cost (TCO) and depreciation by market segment
18

Summary Relevance
– Support vehicle choice and market modeling and related energy and GHG emission estimation in support of DOE advanced vehicle programs
Approach– Collect sales from collaborators and provide
analysis & interpretation– Summarize vehicle resale values and total
ownership cost by market segment– Characterize market characterization by
geographic and demographic factors to determine locations and identify market niches
Technical Accomplishments– Monthly U.S. EV sales market report– Monthly data products published on ANL and
DOE website– International sales trends comparison– E-drive vehicle policy matrix for each
country/region – Regional PEV adoption pattern – E-drive vehicle market niches in
city/suburb/rural areas
Collaborations– Collect data and information from Tsinghua
University and other agencies– Collaborate with NREL on regional E-drive
vehicle adoption analysis
Future Work– Continue tracking U.S. sales and publish data
products monthly– Gather and maintain international E-drive
vehicle sales and incentives databases for comparison
– Analyze sales to show trend and market niches– Additional cities/regions (Atlanta, Boston, Los
Angeles)– Derive heterogenic national purchase/adoption
trend– Collect resale data of E-drive vehicles from third
party– Analyze levelized cost (TCO) and depreciation of
E-drive vehicle by market segment
19

Technical Back-up Slides
20

China’s Phase I and Phase II EV incentives for both passenger vehicles and buses
Phase1 Phase 2Target market Public Private Public and PrivateIncentive duration 2009-2012 2010-2012 2013-2015Incentive scope HEV, PHEV, BEV,
FCEVPHEV, BEV PHEV, BEV, FCEV
Subsidy Standard HEV PV Up to 50,000¥Bus Up to 420,000¥
(L>= 10 m)PHEV PV Up to 50,000¥ 3,000¥/kWh 35,000¥ (R>=50 km)
Bus Up to 420,000¥ (L>= 10 m)
250,000¥ (L>=10 m)
BEV PV 60,000¥ 3,000¥/kWh 35,000¥ (80km <R<150 km)50,000¥ (150km <R< 250 km)60,000¥ (R>=250)
Bus 500,000¥ (L>=10 m)
300,000¥ (6m<L<8m)400,000¥ (8m<L<10m)500,000¥ (L>=10m)
SPV 2,000¥/kWhFCEV PV 250,000¥ 200,000¥
Bus 600,000¥ (L>=10 m)
500,000¥
Phase-outmechanism
NA NA 10% reduction in 201420% reduction in 2015
Pilot cities 25 cities 6 cities 28 cities and regions
1 US dollar = 6.1 Chinese Yuan (¥); L = length, R = range, PV = passenger vehicle, SPV= special purpose vehicle21

China: NEV share of total car production only reached 0.35% in 2014 but NEV bus market share of total large-size bus production reached 5.2%
Data source: Tsinghua University, Beijing, China
New energy vehicle in China includes HEV, PHEV, BEV, FCV
Data source: Tsinghua University, Beijing, China

Western Europe: Electric car sales pace, far from growing, is slowing
Norway is responsible for one-in-three of EVs sold in Western Europe
Last minute rush for tax saving which expired in the Netherlands by the end of 2013
Data source: Automotive Industry Newsletter23

W. Europe: 2014 PEV sales is up 51.7% from 2013 with 58,582 units sold. Norway still leads the market but gradually maturing
Top 3 Selling Models in 2014
Data source: Automotive Industry Newsletter

Highlights from Western Europe E-drive Market
Norway is responsible for one-in-three of EVs sold in Western Europe (WE). Monthly EV sales share of passenger cars reached record high in August, 15.2%
Top selling PEV models includes Nissan Leaf (25.1%), Tesla Model S (18.1%), BMW i3 (16.7%) and Renault Zoe (13.5%)
Over half of BMW i3 sold in Germany now come equipped with the range-extender engine
In France, in spite of a tempting €6,300 government sweetener to anyone buying a qualifying electric car, the segment has barely taken off, accounting <10% of WE EV market
Data source: Automotive Industry Newsletter
25