e ective machine learning based format selection and
TRANSCRIPT

EasyChair Preprint
№ 388
Effective Machine Learning Based Format
Selection and Performance Modeling for SpMV on
GPUs
Israt Nisa, Charles Siegel, Aravind Sukumaran Rajam,Abhinav Vishnu and P Sadayappan
EasyChair preprints are intended for rapiddissemination of research results and areintegrated with the rest of EasyChair.
August 1, 2018

Effective Machine Learning Based Format Selection and Performance Modeling forSpMV on GPUs
Israt Nisa∗, Charles Siegel†, Aravind Sukumaran Rajam∗, Abhinav Vishnu†, P. Sadayappan∗∗Dept. of Computer Science and Engineering
The Ohio State UniversityColumbus, OH, USA
{nisa.1, sukumaranrajam.1, sadayappan.1}@osu.edu†Pacific Northwest National Laboratory
Richland, WA, USA{charles.siegel, Abhinav.Vishnu}@pnnl.gov
Abstract—Sparse Matrix-Vector multiplication (SpMV)is a key kernel for many applications in computationalscience and data analytics. Several efforts have addressedthe optimization of SpMV on GPUs, and a number ofcompact sparse-matrix representations have been consideredfor it. It has been observed that the sparsity pattern ofnon-zero elements in a sparse matrix has a significantimpact on achieving SpMV performance. Further, no singlesparse-matrix format is consistently the best across the rangeof sparse matrices encountered in practice. In this paper,we perform a comprehensive study that explores the use ofMachine Learning to answer two questions:1) Given an unseen sparse matrix, can we effectively predictthe best format for SpMV on GPUs? 2) Can SpMV executiontime for that matrix be predicted, for different matrix formats?
By identifying a small set of sparse matrix features to usein training the ML models, we demonstrate that efficientprediction of the best format with ≈ 88% accuracy canbe achieved when selecting between six well known sparse-matrix formats on two GPU architectures (NVIDIA Pascal andKepler), and ≈ 10% relative mean error (RME) with executiontime prediction.
Keywords-Sparse matrix-vector multiplication (SpMV);GPU; Sparse Matrix format selection; XGBoost, Support Vec-tor Machine (SVM); Multilayer Perceptron (MLP), Decisiontree.
I. INTRODUCTION
Sparse Matrix-Vector multiplication (SpMV) is a widelyused kernel in scientific applications, graph analytics, andmachine learning. The development of efficient SpMV im-plementations for a variety of architectures has been widelyaddressed, including multi-core systems, many-core sys-tems and distributed memory systems comprising of multi-core/many-core architectures. In this paper, we focus onGPU implementations of SpMV. Over the last few years,significant research has been conducted on specialized for-mats, including but not limited to CSR, COO, ELL [1],HYB [2] and the recently proposed merge-based CSR [3],CSR5 [4], and yaSpMV [5]. A number of compact sparse-matrix representations have been evaluated for SpMV and it
has been found that no single format is uniformly superior– the best performing format for one sparse matrix couldachieve much lower performance than another format for adifferent sparse matrix. This variability leads to the format-selection problem: Can an effective model be devised toquickly predict the best-performing format for a previouslyunseen sparse matrix?
Since SpMV performance for different sparse matricescan vary considerably across various formats, a question ofinterest is: Can the SpMV execution time for a previouslyunseen sparse matrix be effectively predicted for variousrepresentation formats? Several prior efforts have consideredperformance modeling for the SpMV kernel [6], [7]. Usu-ally, analytical model-based approaches are leveraged forperformance modeling. However, analytical models assumelinear independence among features – an assumption that isproblematic for general performance modeling.
An alternative approach to analytical models is leveragingnon-parametric approaches such as Machine Learning (ML).These approaches typically require a dataset with groundtruth. For example, in format selection the ground truth isthe best format for a given matrix; in performance modeling,it is the actual achieved FLOPS for each format underconsideration. An advantage of ML algorithms is theirability to handle non-linearity in features – which becomesprevalent as the number of features describing the modelincrease.
Recently, format selection and performance modelingusing ML techniques have generated significant interest.Simple ML algorithms such as decision tree and multi-class Support Vector Machine (SVM) classifier have beenshown to achieve very good accuracy for format selection[8], [9], and [10]. Deep neural networks (DNNs) such asconvolutional neural networks (CNNs) are also starting tobe used for the classification problem [11], [12]. Zhao et al.[12] compress the sparse matrix as an image – and use CNNto solve the format selection problem.
Our objective in this paper is to assess the effectiveness

of a number of alternative ML-based approaches to formatselection for SpMV, as well as performance modeling ofSpMV for different formats. We also study the utility ofdifferent sparse matrix features for the format selectionproblem.
A. Contributions
We make the following contributions in this paper:
• We explore a set of base and ensemble ML algorithmsand achieve a classification accuracy of 91% acrossbasic storage formats like ELL, CSR, and HYB usingXGBoost ensemble algorithm.
• For recently proposed advanced formats such asmerged-based CSR and CSR5, we achieve a classifi-cation accuracy of 88% by using XGBoost algorithm.
• We achieve a low relative mean error (RME) in perfor-mance prediction over a large collection of over 2300sparse matrices from the SuiteSparse sparse matrixcollection.
We provide an in-depth analysis of results includingmetrics while using ensemble techniques; provide featureimportance for performance modeling/classification; andperformance penalty of mis-prediction.
The rest of the paper is organized as follows: Sec. IIpresents background information on sparse matrix formatsand pertinent machine learning algorithms. Sec. III presentsan analysis of properties of sparse matrices from the SuiteS-parse collection. Details on feature selection for sparsematrices are described in Sec. IV. Sec. V reports the exper-imental evaluation to compare the effectiveness of severalof ML techniques on the classification problem for effectiveformat selection. Sec. VI presents experimental results forperformance modeling of SpMV with the different formats.Section VII discusses related work on format classificationand performance modeling and we conclude in section VIII.
II. BACKGROUND
A. Sparse matrix storage formats:
Sparse Matrix-Vector multiplication (SpMV) is a keyprimitive for computational science and data science. Hencethere has been substantial literature on numerous opti-mization techniques to enhance SpMV performance. Theunderlying structure of the sparse matrices can be highlyirregular and has a direct impact on performance. SpMVperformance on two matrices with similar size and numberof non-zeros can be differ significantly, depending on thestorage format and efficiency of implementation. Variousmachine learning techniques can be applied to select thebest storage format for a sparse matrix. In this section,we describe various storage formats and machine learningalgorithms.
1) COO format: The COO (coordinate) format is thesimplest storage format. The sparse matrix is representedusing three dense arrays corresponding to row indices,column indices, and the non-zero element values. The size ofeach array is equal to the number of non-zero elements in thematrix. Figure 1(a) shows the layout of the COO format. Belland Garland [2] describe a GPU implementation of SpMV- first all product contributions are computed for the non-zero elements, followed by a segmented reduction acrossthreads. Along with a simple representation, COO also hasthe advantage of very stable performance across matriceswith very different sparsity.
2) CSR format: The compressed sparse row format(CSR) is the most commonly used format to represent sparsematrices. Like COO, CSR also uses 3 arrays to represent thesparse matrix. While the column indices and values arraysof CSR are identical to COO, the third array (row-pointer)stores the starting index of each row, with all non-zeroelements in each row being stored contiguously. Fig. 1(b)illustrated the CSR format. With the CSR format, SpMV canbe parallelized by assigning a thread to process each row –the scalar CSR kernel [2]. However, this approach has thedisadvantage of non-coalesced access to the column-indexand value arrays, which can be expensive for GPUs. Anotherapproach to parallelization is to assign a WARP to processa row. With such a work distribution, the access to columnindices and nonzero values do not suffer from uncoalescedaccess, but result in significant thread-divergence for rowswith few non-zeros.
3) ELLPACK format: In ELLPACK format, the rows withfewer non-zero elements than max nnz are left shifted andpadded with zeroes. One matrix presents the column indicesand the other presents the values of nonzero elements. Asshown in Fig. 1(c), ELL stores the matrix in a column-majorformat and each row is processed by a single thread [2].Good load balance across threads and avoidance of threaddivergence are achieved, but the memory access pattern tothe input vector x might not be contiguous.
4) HYB format: The HYB format combines the benefitsof COO and ELL. ELL performs well when the standarddeviation of non-zero elements per row is low. On theother hand, the COO format is insensitive to the underlyingstructure. The HYB format uses a combination of COOand ELL, storing some matrix rows in COO format andthe others in ELL format. A threshold parameter is usedto decide whether a row should be represented in COO orELL. If the number of non-zero values in a row is greaterthan the threshold, then an ELL format is used; otherwisethe COO format is used. The threshold is often computed asmax(4096, number of rows/3) [2]. The average number ofnon-zeros per row (nnz mu) can also be used as a thresholdmetric, which we use in this paper.
5) CSR5 format: Liu et al. [4] proposed CSR5 – whichis an extension of the CSR format. It uses five arrays to

Figure 1: Sparse matrix representation using COO, ELL,CSR and CSR5 formats
store the matrix, adding two more arrays to the three arraysused with CSR. A sparse matrix is partitioned into equallysized small 2D tiles to achieve good load balancing. Thetwo additional arrays are used to store a tile transpositionorder (tile ptr) and information about the tiles (tile desc).Figure 1(d) illustrates the CSR5 format.
6) Merge-based CSR format: The merge-based CSRSpMV algorithm for GPUs [3] also focuses on enhancingload balancing among threads despite the irregularity of theunderlying sparse matrix structure. It works with the stan-dard CSR sparse matrix representation. The standard SpMVimplementations using CSR suffer from load imbalance formatrices with high variance in the number of non-zerosin different rows of the matrix. Merge-based CSR aims toalleviate this load balancing problem. It logically partitionsthe work of processing a group of contiguous rows into equalsized sub-problems that are distributed across threads.
B. Machine Learning Algorithms
1) Decision Trees: A popular machine learning approachto classification is the use of Decision Trees (DT). Itspopularity is in part due to easy interpretability. The outputafter training is a binary tree, with each node incorporatinga rule to decide whether to proceed to its left or right child.The leaves of the tree encode the final predictions of themodel.
2) Support Vector Machines: A Support Vector Machine(SVM) is a model that constructs a hyperplane (or set ofhyperplanes) in a high dimensional space containing data.It does so by determining support vectors from the dataset which are closest to the boundary between classes ofsamples. It then places a hyperplane such that the distancebetween it and support vectors on either side is equal. SVMssuffer from being harder to interpret than decision trees,having a higher computational complexity, and only beingdirectly applicable to binary classification. However, SVMscan often achieve higher accuracy than decision trees.
3) Multi-Layer Perceptrons: The multi-layer perceptron(MLP) is a class of neural network models. MLPs modelfunctions by building iterated compositions that approximatethem. Each layer of an MLP consists of several neurons,which each take input from all neurons in the previouslayer, multiply them by weights and then return the outputfrom a nonlinear function at this value. Often, several MLPmodels are combined by averaging their predictions into anensemble to improve accuracy. It is known that MLPs canapproximate any function arbitrarily closely, and do so moreefficiently when utilizing the hierarchical structure [13].
4) XGBoost: XGBoost (for Extreme Gradient Boosting)is an ensemble ML technique for transforming a collectionof weak models into a strong model. Usually applied todecision trees, XGBoost trains a sequence of trees in sucha way that each one is most effective on those samplesthat are poorly classified by all previous trees. This canbe interpreted as performing gradient descent in functionspace [14] rather than on the parameters of a static func-tion. Along with ensembles of neural networks, XGBoosthas been extremely successful in competitive data science,winning several Kaggle competitions [15].
III. SPARSE MATRIX CHARACTERISTICS
To motivate the need for classification and performancemodeling, we tabulate a few important characteristics of thematrices in the SuiteSparse collection. These are shown inTable I. The columns associated with avg. rows and avg.cols present the average number of rows and columns of thematrices corresponding to the same nnz range. Similarly,avg. density, avg. nnz mu and avg. nnz sigma show theaverage density of the matrix, average nnz per row andaverage standard deviation of nnz per row, respectively. Inthis dataset, the nnz range is between 3 to 96M elements. Asignificant fraction (greater than 50%) of the matrices have

nnz range no of matrices avg. rows avg. cols avg. density avg. nnz mu avg. nnz sigma0∼10,000 747 639 759 4.62 7 4.5
10K ∼ 50K 508 3,590 4,248 1.29 15 1850K ∼ 100K 209 8,881 10,974 1.03 34 31100K ∼ 500K 362 24,695 30,714 .69 69 50500K ∼ 1M 147 70,669 92,925 .75 155 1281M ∼ 5M 208 173,473 205,277 .61 214 725M ∼ 50M 109 1,290,926 1,302,773 .43 852 42
>50M 9 8,101,908 8,101,908 .002 29 5
Table I: Feature analysis of the SuiteSparse repository
non-zero elements less than 50K. We also observe that theaverage density decreases with increasing number of rows,columns and nnz. However, no clear pattern is observed instandard deviation of average nnz per row.
A few storage formats are less sensitive to the irreg-ular matrix structure. For example, in COO format theparallelism is achieved by computing over each non zeroelement – resulting in excellent load balancing. However, thereplication of row entries adversely affects the performanceof the COO format. The ELL uses zero padding to fill upthe rows that have lesser than maximum number of non zeroelements in a row. Therefore, matrices with high variancein the row length are adversely affected due to work loadimbalance by each thread. A similar trend is also observedfor the CSR format. Since CSR conducts parallelism overrows of a matrix, similar workload at each row showsbetter performance using CSR format. Recent studies suchas CSR5 [4], merged-based CSR [3], yaspmv [5] aim toachieve a stable performance despite the irregularity in theunderlying structure of a matrix. Especially, merged-basedCSR shows consistent performance as a function of non-zeros on a large number of matrices.
Yet, there are a substantial number of matrices whereperformance is far lower than the matrices of similar nnz.Two such matrices, rgg n 2 19 sO and auto are shownin Figure 2. Both matrices have ≈ 6.5M non-zero ele-ments and are square matrices of dimensions 524K and450K, respectively. However, the achieved GFLOPS byusing CSR5 on rgg n 2 19 sO and auto are 22 and 18,respectively. Similarly, merged-based CSR provides 21 and15 GFLOPS for these two matrices. Figure 2 provides anindication of the complexity associated with performancemodeling and format selection problem, since these matricesare similar in macro structure, but significantly different inactual performance.
The performance of SpMV is sensitive to both architec-tural configuration as well as sparsity structure of the matrix.GPU specialized formats focus on higher parallelism as wellas reduced data movement and lower thread divergence. Thetrade-off between the reduction across the non-zeros is oftencompromised with atomic operations. In Figure 3, we showthe achieved GFLOPS for various matrices with differentformats. We conclude from the figure that no single format
Figure 2: Matrices with similar number of rows, columnsand non-zero elements but with different GFLOPS for CSR5and merged-based CSR formats
is a consistent winner across all the matrices. We observethat for the same matrix, the performance difference acrossformats can be significant. Hence, format determinationproblem requires effective feature extraction (such that thesparsity structure can be captured) and modeling techniquessuch as machine learning that can handle the non-linearitybetween extracted features.
0
5
10
15
20
25
GFLO
PS
COO ELL CSR HYB merged- basedCSR CSR5_time
Figure 3: GFLOPS comparisons across different matrixstorage format using Tesla k80c GPU and single precisiondata type
In this paper, we extract a total of seventeen (simple andadvanced combined) features to capture the structure of thematrices. This is followed by leveraging state of the art
set feature description
1
rows, cols number of rows and columnsnnz number of non zero elements
nnz mu average nnz per rowdensity density of the matrix
2
nnz max maximum number of nnz in a rownnz sigma standard dev. of nnz per row
row block count * avg. and std. deviation of the numberof continuous nnz chunk per row
row block size * avg. and std. deviation of the sizeof continuous nnz chunks in a row
3block count total number of the continuous
nnz chunks
row block count * min and max of the number ofcontinuous nnz chunks in a row
row block size * min and max of the sizeof continuous nnz chunks in a row
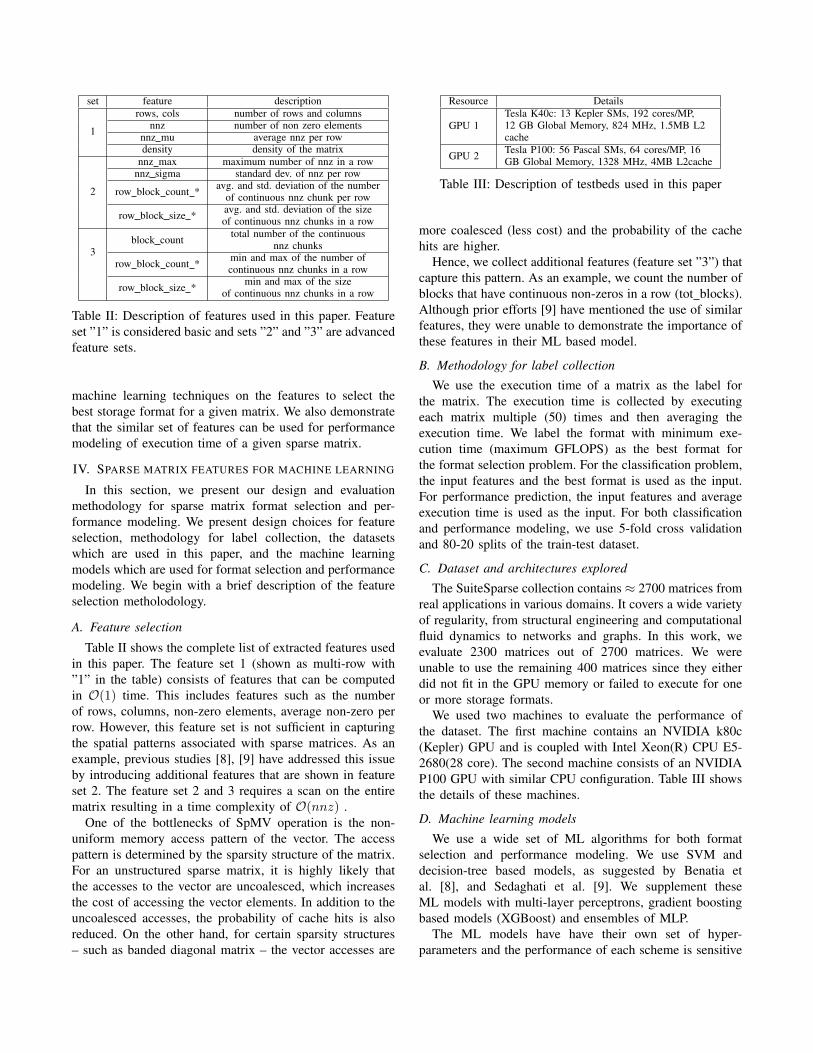
Table II: Description of features used in this paper. Featureset ”1” is considered basic and sets ”2” and ”3” are advancedfeature sets.
machine learning techniques on the features to select thebest storage format for a given matrix. We also demonstratethat the similar set of features can be used for performancemodeling of execution time of a given sparse matrix.
IV. SPARSE MATRIX FEATURES FOR MACHINE LEARNING
In this section, we present our design and evaluationmethodology for sparse matrix format selection and per-formance modeling. We present design choices for featureselection, methodology for label collection, the datasetswhich are used in this paper, and the machine learningmodels which are used for format selection and performancemodeling. We begin with a brief description of the featureselection metholodology.
A. Feature selection
Table II shows the complete list of extracted features usedin this paper. The feature set 1 (shown as multi-row with”1” in the table) consists of features that can be computedin O(1) time. This includes features such as the numberof rows, columns, non-zero elements, average non-zero perrow. However, this feature set is not sufficient in capturingthe spatial patterns associated with sparse matrices. As anexample, previous studies [8], [9] have addressed this issueby introducing additional features that are shown in featureset 2. The feature set 2 and 3 requires a scan on the entirematrix resulting in a time complexity of O(nnz) .
One of the bottlenecks of SpMV operation is the non-uniform memory access pattern of the vector. The accesspattern is determined by the sparsity structure of the matrix.For an unstructured sparse matrix, it is highly likely thatthe accesses to the vector are uncoalesced, which increasesthe cost of accessing the vector elements. In addition to theuncoalesced accesses, the probability of cache hits is alsoreduced. On the other hand, for certain sparsity structures– such as banded diagonal matrix – the vector accesses are
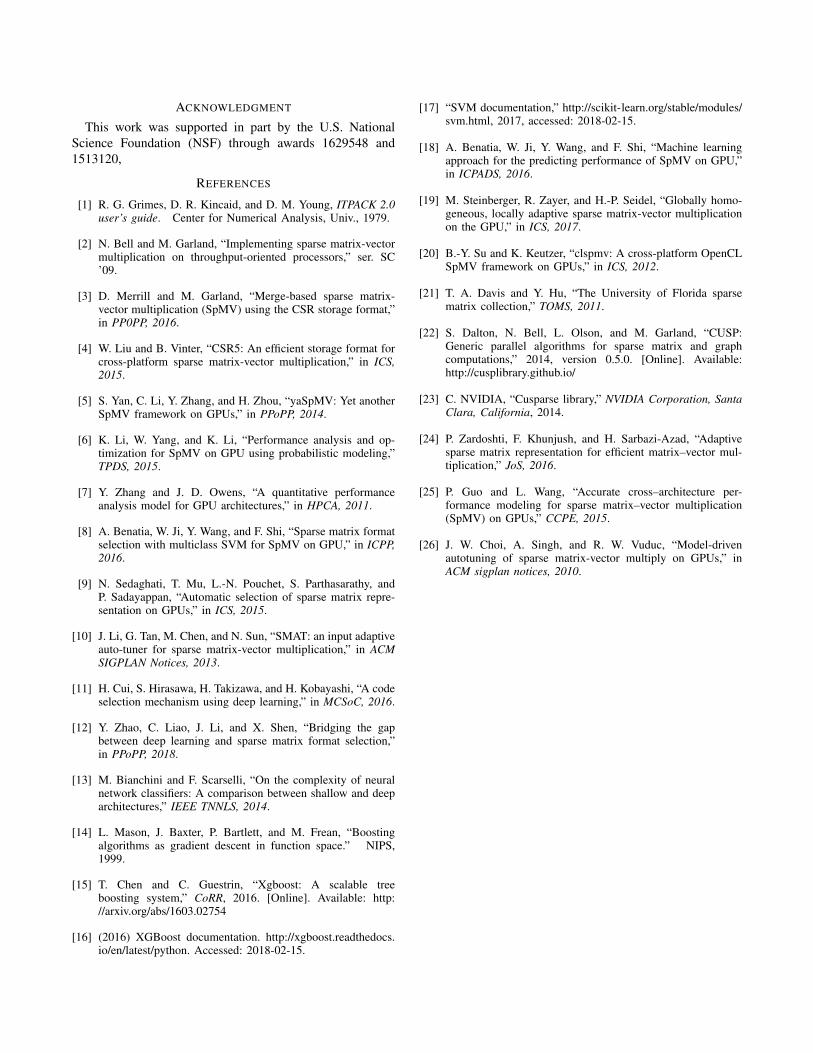
Resource Details
GPU 1Tesla K40c: 13 Kepler SMs, 192 cores/MP,12 GB Global Memory, 824 MHz, 1.5MB L2cache
GPU 2 Tesla P100: 56 Pascal SMs, 64 cores/MP, 16GB Global Memory, 1328 MHz, 4MB L2cache
Table III: Description of testbeds used in this paper
more coalesced (less cost) and the probability of the cachehits are higher.
Hence, we collect additional features (feature set ”3”) thatcapture this pattern. As an example, we count the number ofblocks that have continuous non-zeros in a row (tot blocks).Although prior efforts [9] have mentioned the use of similarfeatures, they were unable to demonstrate the importance ofthese features in their ML based model.
B. Methodology for label collection
We use the execution time of a matrix as the label forthe matrix. The execution time is collected by executingeach matrix multiple (50) times and then averaging theexecution time. We label the format with minimum exe-cution time (maximum GFLOPS) as the best format forthe format selection problem. For the classification problem,the input features and the best format is used as the input.For performance prediction, the input features and averageexecution time is used as the input. For both classificationand performance modeling, we use 5-fold cross validationand 80-20 splits of the train-test dataset.
C. Dataset and architectures explored
The SuiteSparse collection contains ≈ 2700 matrices fromreal applications in various domains. It covers a wide varietyof regularity, from structural engineering and computationalfluid dynamics to networks and graphs. In this work, weevaluate 2300 matrices out of 2700 matrices. We wereunable to use the remaining 400 matrices since they eitherdid not fit in the GPU memory or failed to execute for oneor more storage formats.
We used two machines to evaluate the performance ofthe dataset. The first machine contains an NVIDIA k80c(Kepler) GPU and is coupled with Intel Xeon(R) CPU E5-2680(28 core). The second machine consists of an NVIDIAP100 GPU with similar CPU configuration. Table III showsthe details of these machines.
D. Machine learning models
We use a wide set of ML algorithms for both formatselection and performance modeling. We use SVM anddecision-tree based models, as suggested by Benatia etal. [8], and Sedaghati et al. [9]. We supplement theseML models with multi-layer perceptrons, gradient boostingbased models (XGBoost) and ensembles of MLP.
The ML models have have their own set of hyper-parameters and the performance of each scheme is sensitive

to the tuning of the hyperparameters. For XGBoost, weexplore parameters like n estimators: number of trees used,max depth: maximum tree depth and learning rate [16].We tune these parameters using GridSearchCV , whichperforms an exhaustive search over a range of suppliedparameters and finds the best parameter set. In our set ofexperiments, the range of n estimator is {50, 100, 200,500} , max depth is {32, 64, 128} and learning rate is{.1, .01}. In SVM, like XGBoost using GridSearchCVthe best parameter set is chosen over the range of C {100,1000, 10000} and gamma of {.1, .01, .001}. C keeps abalance of correctness of training examples and simplicityof the decision surface and gamma defines the importanceof training examples [17]. The MLP model we use in thiswork consists of 3 hidden layer of 96, 48 and 16 neuronsrespectively with a mini-batch size of 16.
V. RESULTS: SPMV FORMAT SELECTION
In this section, we present an evaluation of machinelearning on the format selection problem. We begin with adiscussion of format selection, especially the COO format.
A. Discussion on COO format
We observed that the COO format outperforms otherformats (ELL, CSR, and HYB) in ≈ 10% cases. Similarly,when using 6 formats together, we observe that the COO for-mat rarely outperforms other formats. For double precisionin both K80c and P100 machine, there are no such casesand for single precision, there is one such case. We alsoobserved that when COO format is the best, the performanceof at least one of the other formats is similar. Hence, theperformance loss by excluding the COO format is minimal.Hence, we remove the cases where COO format is the bestformat. Similar observation is made by Benatia et al. [8],where they avoid the COO format in their study.
B. Comparison of ML models on ELL, CSR and HYBformats
To begin with, we compare the results using basic storageformats like ELL, CSR, and HYB. Tables IV, V and VIpresent the classification accuracy on 3 basic formats over2300 matrices from the SuiteSparse repository. We observethat XGBoost consistently outperforms decision tree, MLPand SVM on K80c and P100 for both single and doubleprecision data types. By using 11 and 17 features, theXGBoost achieves up to 91% classification accuracy. Wealso observe that by reducing the number of features – suchas shown in Table IV – MLP outperforms SVM in all cases,whereas with higher number of features like in Table V andVI, for single precision cases, SVM achieves equal or betteraccuracy than MLP across both machines. Table VI showsthat using extra features to capture the detailed vector accesspattern does not provide additional benefits.
Machine precision decs. tree SVM MLP XGBSTK80c single 69% 62% 68% 69%k80c double 69% 62% 68% 70%P100 single 72% 72% 75% 75%P100 double 72% 69% 73% 74%
Table IV: Classification accuracy on basic 3 formats: ELL,CSR, HYB using feature set 1 consisting of 5 features whichare computed in O(1) time. The best format(s) is shown inbold.
Machine precision decs. tree SVM MLP XGBSTK80c single 89% 88% 88% 91%k80c double 86% 87% 88% 89%P100 single 85% 89% 87% 88%P100 double 86% 87% 88% 89%
Table V: Classification accuracy on basic 3 formats: ELL,CSR, HYB using feature sets 1 and 2 consisting of 11features used in Sedaghati et el. [9]
Machine precision decs. tree SVM MLP XGBSTK80c single 87% 88% 87% 91%k80c double 84% 87% 86% 89%P100 single 86% 88% 86% 88%P100 double 87% 87% 89% 89%
Table VI: Classification accuracy on basic 3 formats: ELL,CSR, HYB using feature sets 1, 2 and 3 consisting of 17features
Machine precision decs. tree SVM MLP XGBSTK80c single 60% 62% 62% 67%k80c double 64% 63% 64% 68%P100 single 65% 65% 67% 69%P100 double 63% 65% 67% 69%
Table VII: Classification accuracy on 6 formats: COO, ELL,CSR, HYB, CSR5 and merged-based CSR using feature set1 consisting of 5 features which are computed in O(1) time
Machine precision decs. tree SVM MLP XGBSTK80c single 81% 83% 83% 85%k80c double 81% 85% 85% 88%P100 single 79% 83% 82% 84%P100 double 81% 83% 84% 86%
Table VIII: Classification accuracy on 6 formats: COO, ELL,CSR, HYB, CSR5 and merged-based CSR using feature sets1 and 2 consisting of 11 features used in Sedaghati et el. [9]
Machine precision decs. tree SVM MLP XGBSTK80c single 78% 83% 83% 85%k80c double 82% 85% 85% 88%P100 single 79% 83% 82% 84%P100 double 79% 83% 83% 85%
Table IX: Classification accuracy on 6 formats: COO, ELL,CSR, HYB, CSR5 and merged-based CSR using feature sets1, 2 and 3 consisting of 17 features

Machine precision decs. tree SVM MLP XGBSTK80c single 79% 85% 83% 85%k80c double 83% 87% 86% 88%P100 single 77% 83% 83% 84%P100 double 79% 84% 85% 86%
Table X: Classification accuracy on 6 formats: COO, ELL,CSR, HYB, CSR5 and merged-based CSR using the top 7(imp.) features according to XGBoost feature importance
C. Comparison of results on combined basic and advancedformats
In table VII, VIII, and IX, we present classification resultsby using six formats including advanced formats like CSR5and merged-based CSR. We also add the COO format togive a comprehensive view of the consistency of our models.We observe that XGBoost consistently provides the best(or similar to one or more ML algorithms) classificationaccuracy across both machines and both data types. We alsoobserve that by using additional 6 features, no improvementin accuracy is observed as shown in Table IX.
D. Insight
Figures 4 and 5 show the importance of each 17 featuresfrom the combined feature set 1, 2 and 3. This data iscollected for the XGBoost classifier. We observe that onboth machines and for both precisions (single and double),although the order of feature importance is different, the top7 important features are same. We refer to these featuresas imp. features for rest of the paper. More surprisingly,an advanced feature like nnzb tot is one of them which iscrucial for the vector access pattern by a matrix and belongsto feature set 3.
We use these imp. features to examine the accuracy ofour models. In Table X, we notice the accuracy achievedby using imp. features is equal or better than the previouslybest reported accuracy. This observation holds for XGBoostand other ML models. An exception is a single case fordecision tree on P100 for single precision data type. In both11 features and 7 features cases, the best achievable accuracyis 88% across all formats.
An important metric of a classification model is the aver-age performance slowdown caused by mispredicted formats.An ideal model delivers a low number of cases with largeslowdown as well as high classification accuracy. TablesXII, XI, XIII present the slowdown caused by mispredictedformats by using SVM, MLP and XGBoost, respectively.We observe that XGBoost outperforms all other formats inthis case too.
VI. RESULTS: SPMV PERFORMANCE MODELING
In this section, we present an evaluation of ML basedperformance modeling for SpMV. Recent studies such as[18] have explored the concept of using ML techniquessuch as multi-layer perceptron (MLP) and support vector
regression (SVR) to model SpMV performance. We drawinspiration from these studies and extend them by using anensemble of MLP for the performance modeling task. Weuse an MLP ensemble to predict the performance of all 6formats: COO, ELL, CSR, HYB, CSR5 and merge-basedCSR and compare with base MLP based prediction. Weuse relative mean error (RME) to compare the performancedifferent performance models. The RME metric can bedefined as an average of relative error between predictedand measured performance:
RME = 1/n
n∑i=1
|predi −measuredi|measuredi
A. RME of combined models
In Figure 6, we show the RME of different ML methodsusing double precision on Tesla K80c and P100 GPU. Weobserve that the MLP ensemble is able to achieve an RMEof 7% for CSR5 and merge based CSR. The result of usingdifferent ML methods using double precision on Tesla K80cand P100 GPU is shown in Figure 6.
We further tune the MLP and MLP ensemble regressorand achieve an average RME as low as 12% and 10% onP100 and K80c over 2300 matrices, respectively. A similarpattern is observed for the single precision evaluation. TheMLP ensemble regressor achieves 5.4% improvement overregular MLP regressor on P100 for the double precision datatype. On average across both machines and datatype, theMLP ensemble achieves an improvement of 3.5% in theoverall RME.
B. RME of individual models
We previously used an MLP and an MLP ensemble forperformance prediction on all 6 formats together. In thissection, we evaluate the models when the individual formatsare trained separately. We notice that the RME obtainedby each format – including the advanced format like CSR5and merge-based CSR – is low for both cases. This can beexplained as both formats are insensitive to the irregularityof the matrix structure. CSR5 has a RME ranging from 11- 13% for a double precision data type for Tesla K80c andP100 machine, respectively. For merge-based CSR the rangeis from 9 - 11%, respectively. The most widely used formatin real applications, CSR, achieves an RME of 8% and 11%on Tesla P100 and K80c machine by using MLP ensembleregressor for double precision data type. Figure 7 shows theaverage RME of each format for double precision data typeon Tesla K80c and P100 by using MLP ensemble regressor.We observe that the MLP ensemble regressor outperformsMLP in all the cases.
C. Indirect classification using regression
Previously, we observed that ensemble MLP techniqueachieves good performance prediction accuracy. This has animportant implication on the possibility of using regression

0 1000 2000 3000 4000 5000 6000 7000 8000F score
snzb_minnnzb_min
snzb_sigmannz_minsnzb_mu
snzb_maxnnzb_mu
nnzb_sigmannzb_max
n_colsnnz_mu
nnzb_totnnz_frac
nnz_sigmannz_tot
nnz_maxn_rows
Feat
ures
822927
146919231946
27842810
300330573080
33243339
47945101
58157143
7685
Feature importance
0 500 1000 1500 2000 2500F score
snzb_minnnzb_minnnz_min
snzb_sigmasnzb_mu
snzb_maxnnzb_max
nnzb_sigman_cols
nnzb_munnz_sigma
nnzb_totnnz_munnz_fracnnz_max
nnz_totn_rows
Feat
ures
217380
456617657
770893
98610781098
12751445
15181662
19371964
2283
Feature importance
Figure 4: Importance of features using XGBoost on Tesla K80c and Tesla P100 machine with single precision
0 2000 4000 6000 8000 10000 12000 14000 16000F score
snzb_minnnzb_minnnz_min
snzb_sigmasnzb_maxsnzb_mu
nnzb_maxnnzb_sigma
nnzb_mun_cols
nnzb_totnnz_mu
nnz_sigmannz_fracnnz_totn_rows
nnz_max
Feat
ures
15192555
29693851
419544694495
593370047089
75078980
985610781
1125913099
15290
Feature importance
0 1000 2000 3000 4000F score
snzb_minnnzb_minnnz_minsnzb_mu
snzb_sigmannzb_sigma
snzb_maxnnzb_maxnnzb_munnz_mu
nnz_sigman_cols
nnzb_totnnz_maxnnz_frac
n_rowsnnz_tot
Feat
ures
356439
8351344
14661721
18411902
20312435
26873064
33003819
39434132
4246
Feature importance
Figure 5: Importance of features using XGBoost on Tesla K80c and Tesla P100 machine with double precision
0
5
10
15
20
25
30
featureset1 featureset2 featureset3 Imp.Features
RME
MLPregressor MLPEnsembleRegressor
0
5
10
15
20
25
featureset1 featureset2 featureset3 Imp.Features
RME
MLPregressor MLPEnsembleRegressor
Figure 6: Average relative mean error (RME) of 6 formats using MLP and MLP ensemble regressor on Tesla K80c andTesla P100 GPU using double precision data type
for format selection. Specifically, the format with the best predicted performance format can be selected as the best

feature set no slowdown >1x slowdown(cumulative) >=1.2x Slowdown >=1.5x Slowdown >=2.0x Slowdown
1 285 175 89 61 252 444 16 12 3 13 447 13 10 2 1
Imp. Features 440 20 14 4 2
Table XI: Number of slowdown cases by using SVM on Tesla P100 machine for double precision data
feature set no slowdown >1x slowdown(cumulative) >=1.2x Slowdown >=1.5x Slowdown >=2.0x Slowdown
1 293 167 84 58 252 441 19 14 4 13 439 21 15 5 1
Imp. Features 446 14 10 3 1
Table XII: Number of slowdown cases by using MLP ensemble on Tesla P100 machine for double precision data
feature set no slowdown >1x slowdown(cumulative) >=1.2x Slowdown >=1.5x Slowdown >=2.0x Slowdown
1 274 186 92 65 292 446 14 10 3 13 446 14 10 3 1
Imp. Features 445 15 11 3 1
Table XIII: Number of slowdown cases by using XGBoost on Tesla P100 machine for double precision data
0
5
10
15
20
25
30
35
40
45
COO ELL CSR HYB CSR5 mergedCSR
RME
featureset1 featureset2 featureset3 Imp.features
0
5
10
15
20
25
30
35
40
45
COO ELL CSR HYB CSR5 mergedCSR
RME
featureset1 featureset2 featureset3 Imp.features
Figure 7: Relative mean error (RME) achieved by each 6 formats using MLP ensemble regressor on Tesla K80c and TeslaP100 GPU using double precision data type
storage format. The predicted format can then be comparedwith the actual best format (label) according to actualperformance. We implement this approach and refer to itas the indirect classification method. Table XIV shows theresult of using best direct classification technique – XGBoost– and indirect classification method.
For indirect classification, we define a tolerance parame-ter. Specifically, the regression predicts the SpMV executiontime, which is a continuous variable. The tolerance param-eter allows flexibility in selecting the best (or second/thirdbest formats) as long as the prediction time of the otherformats is within the tolerance. For example, under 5%tolerance, any format that has the performance within 5% ofthe best format would be considered as correctly classified.Naturally, a 0% tolerance is an extreme case.
In our evaluation, using 0% tolerance, we achieve a classi-
fication accuracy loss of 2% on K80c using double precisionin comparison to the XGBoost based model. However, forsingle precision the classification accuracy decreases by7%. On P100 machine, we observe a loss of 7% and 8%for single precision and double precision data, respectively.Using a tolerance of 5%, we can obtain a classificationmodel equal or better than the direct classification method.In Table XIV, we see for K80c machine, we achieve theaccuracy as 92% by using indirect classification.
VII. RELATED WORK
Several researchers have proposed compression formatsand associated algorithms with the compression formats. Ourobjective is to provide a brief overview of related researchin selection of these formats and performance prediction ofsparse matrices for these formats.

Machine precision XGBST MLP ens. MLP ens.5% tol.
K80c single 85% 78% 90%k80c double 88% 86% 92%P100 single 84% 77% 89%P100 double 86% 78% 87%
Table XIV: Classification accuracy achieved by XGBoost,MLP ensemble regressor and MLP ensemble regressor with5% tolerance using 6 formats: COO, ELL, CSR, HYB, CSRand mergedCSR
Several storage formats like [4], [3], [19], [5], [20] havebeen proposed by the researchers. Benatia et al. [8] haveproposed a classification technique using multi-class SupportVector Machine (SVM) classifier on manually extractedfeatures. It achieves up to 88% classification accuracy onthe four basic formats (COO, CSR, ELL, and HYB) with adataset of 555 matrices from SuiteSparse [21] on NVIDIAFermi and Maxwell GPUs. A popular machine learningtechniques for classification - Decision Tree has been usedin several recent studies [9], [10] etc. Like SVM classifier,Decision Tree also works on manually extracted features.
[9] used a dataset of 700 matrices and explored 5 storageformats including 4 basic formats and HYB mu on NVIDIATesla k20c and k40c. It achieves 81% format classificationaccuracy. On the other hand, [10] uses more than 2000matrices from the same ufl repository. On over 330 testmatrices it achieves 85% and 82% classification accuracyrespectively for single precision and double precision datawith 1% accuracy gap. The model maintains a confidencevalue for each test sample. If the confidence factor is morethan a threshold value, it executes the potential best formatsand takes the final decision. Recently, Zhao et al. [12]and Cui et al. [11] proposed techniques using deep neuralnetworks (DNNs) to solve the classification problem.
Zhao et al. [12] used a dataset of 9200 matrices (400GB)combined with real-world matrices collected from SuiteS-parse repository and synthetic matrices. The matrices arefirst converted to fixed size (128x128) image-like represen-tation and then used as an input into a convolutional neuralnetwork (CNN) model. It provides so far the best accuratemodel with 93% classification accuracy on CPU platformand 90% on GPU platform. On CPU it uses 4 formats:COO, ELL, CSR, and DIA. On GPU, the model can handlemore formats like CSR5, HYB, and BSR. While SVMand DT require identifying manual feature extraction, CNNinfers the features automatically. However, when comparedto SVM and DT, CNN incurs a high inference time.
Similar approaches using ML techniques have been ex-plored in the area of performance modeling. Benatia etal. [18] proposed to use multi-layer perceptron (MLP) andsupport vector regression (SVR) to predict the performancenumber of a SpMV operation. On average, it achieves lowprediction error of 7% to 14% on a dataset of 1800 matrices.
However, they de-activate the texture memory, which iscritical to GPU performance. In addition, they use NVIDIACUSP [22] library which is known to be sub-optimal,as better libraries such as cuSPARSE [23] have becomeprevalent. A unique analytical model based on probabilitymass function (PMF) is proposed by [6] to calculate the nonzero distribution pattern of the sparse matrix. Using basicformats like COO, ELL, CSR and HYB, an average relativemean error (RME) of less than 20% is achieved for over80% cases.
Zhang et al. [7] proposed a microbenchmark-based perfor-mance model by rigorous analysis of the underlying archi-tecture of the GPU. By using a model based on the GPU’snative instruction set, it predicts the performance within 5%-15% error range for blocked ELLPACK format. Zardoshti etal. [24] developed an adaptive run-time approach to identifythe best format among four basic formats. It executes a smallportion of the input matrix and tune it with GPU archi-tectural parameters and chooses the best performing matrixbased on the portion. Guo et al. [25] developed a inter-architecture analytical performance modeling tool using 4generation of GPUs. On a set of 14 matrices, the modelcan predict time within 3% to 7% error range on average.Several auto-tuning framework use performance model like[26] to guide the tuner for optimized performance.
VIII. CONCLUSIONS
In this paper, we have proposed Machine Learning (ML)based approaches for format selection and performancemodeling of SpMV kernel. We have used SuiteSparse datasetfor our evaluation and analyzed it under the metrics ofclassification accuracy, relative mean error (RME), aver-age slowdown and provided insight on results and criti-cal feature selection. We have used ML models such asSVM, decision tree, multi-layer perceptron and ensembles(XGBoost) for evaluating the classification and regressionproblems. We observe that: 1) ensembles provide upwardsof 88% classification accuracy on state-of-the-art formats,2) prediction RME is ≈ 10% which is highly attractivefor capacity planning purposes, 3) only seven features aresufficient for performance modeling and classification, 4)the same ML based model is the best for format selectionindependent of GPU architecture and precision used, and 5)indirect classification (using regression for format selection)while providing a maximum of 5% slowdown provides 92%classification accuracy – similar to the accuracy reported byusing a CNN based model. We conclude that using a smallset of features and relatively inexpensive ML algorithms, it ispossible to achieve state-of-the-art format selection accuracy,making our solution attractive for compute-constrained (suchas edge devices) practical deployments in general.
ACKNOWLEDGMENT
This work was supported in part by the U.S. NationalScience Foundation (NSF) through awards 1629548 and1513120,
REFERENCES
[1] R. G. Grimes, D. R. Kincaid, and D. M. Young, ITPACK 2.0user’s guide. Center for Numerical Analysis, Univ., 1979.
[2] N. Bell and M. Garland, “Implementing sparse matrix-vectormultiplication on throughput-oriented processors,” ser. SC’09.
[3] D. Merrill and M. Garland, “Merge-based sparse matrix-vector multiplication (SpMV) using the CSR storage format,”in PP0PP, 2016.
[4] W. Liu and B. Vinter, “CSR5: An efficient storage format forcross-platform sparse matrix-vector multiplication,” in ICS,2015.
[5] S. Yan, C. Li, Y. Zhang, and H. Zhou, “yaSpMV: Yet anotherSpMV framework on GPUs,” in PPoPP, 2014.
[6] K. Li, W. Yang, and K. Li, “Performance analysis and op-timization for SpMV on GPU using probabilistic modeling,”TPDS, 2015.
[7] Y. Zhang and J. D. Owens, “A quantitative performanceanalysis model for GPU architectures,” in HPCA, 2011.
[8] A. Benatia, W. Ji, Y. Wang, and F. Shi, “Sparse matrix formatselection with multiclass SVM for SpMV on GPU,” in ICPP,2016.
[9] N. Sedaghati, T. Mu, L.-N. Pouchet, S. Parthasarathy, andP. Sadayappan, “Automatic selection of sparse matrix repre-sentation on GPUs,” in ICS, 2015.
[10] J. Li, G. Tan, M. Chen, and N. Sun, “SMAT: an input adaptiveauto-tuner for sparse matrix-vector multiplication,” in ACMSIGPLAN Notices, 2013.
[11] H. Cui, S. Hirasawa, H. Takizawa, and H. Kobayashi, “A codeselection mechanism using deep learning,” in MCSoC, 2016.
[12] Y. Zhao, C. Liao, J. Li, and X. Shen, “Bridging the gapbetween deep learning and sparse matrix format selection,”in PPoPP, 2018.
[13] M. Bianchini and F. Scarselli, “On the complexity of neuralnetwork classifiers: A comparison between shallow and deeparchitectures,” IEEE TNNLS, 2014.
[14] L. Mason, J. Baxter, P. Bartlett, and M. Frean, “Boostingalgorithms as gradient descent in function space.” NIPS,1999.
[15] T. Chen and C. Guestrin, “Xgboost: A scalable treeboosting system,” CoRR, 2016. [Online]. Available: http://arxiv.org/abs/1603.02754
[16] (2016) XGBoost documentation. http://xgboost.readthedocs.io/en/latest/python. Accessed: 2018-02-15.
[17] “SVM documentation,” http://scikit-learn.org/stable/modules/svm.html, 2017, accessed: 2018-02-15.
[18] A. Benatia, W. Ji, Y. Wang, and F. Shi, “Machine learningapproach for the predicting performance of SpMV on GPU,”in ICPADS, 2016.
[19] M. Steinberger, R. Zayer, and H.-P. Seidel, “Globally homo-geneous, locally adaptive sparse matrix-vector multiplicationon the GPU,” in ICS, 2017.
[20] B.-Y. Su and K. Keutzer, “clspmv: A cross-platform OpenCLSpMV framework on GPUs,” in ICS, 2012.
[21] T. A. Davis and Y. Hu, “The University of Florida sparsematrix collection,” TOMS, 2011.
[22] S. Dalton, N. Bell, L. Olson, and M. Garland, “CUSP:Generic parallel algorithms for sparse matrix and graphcomputations,” 2014, version 0.5.0. [Online]. Available:http://cusplibrary.github.io/
[23] C. NVIDIA, “Cusparse library,” NVIDIA Corporation, SantaClara, California, 2014.
[24] P. Zardoshti, F. Khunjush, and H. Sarbazi-Azad, “Adaptivesparse matrix representation for efficient matrix–vector mul-tiplication,” JoS, 2016.
[25] P. Guo and L. Wang, “Accurate cross–architecture per-formance modeling for sparse matrix–vector multiplication(SpMV) on GPUs,” CCPE, 2015.
[26] J. W. Choi, A. Singh, and R. W. Vuduc, “Model-drivenautotuning of sparse matrix-vector multiply on GPUs,” inACM sigplan notices, 2010.