e-grocery home delivery impacts on food distribution
TRANSCRIPT

Portland State University Portland State University
PDXScholar PDXScholar
Civil and Environmental Engineering Faculty Publications and Presentations Civil and Environmental Engineering
10-2019
E-Grocery Home Delivery Impacts on Food E-Grocery Home Delivery Impacts on Food
Distribution, Access and Equity: a Portland Case Distribution, Access and Equity: a Portland Case
Study Study
Miguel Figliozzi Portland State University, [email protected]
Katherine Keeling Portland State University
Follow this and additional works at: https://pdxscholar.library.pdx.edu/cengin_fac
Part of the Engineering Commons
Let us know how access to this document benefits you.
Citation Details Citation Details Figliozzi, Miguel and Keeling, Katherine, "E-Grocery Home Delivery Impacts on Food Distribution, Access and Equity: a Portland Case Study" (2019). Civil and Environmental Engineering Faculty Publications and Presentations. 544. https://pdxscholar.library.pdx.edu/cengin_fac/544
This Post-Print is brought to you for free and open access. It has been accepted for inclusion in Civil and Environmental Engineering Faculty Publications and Presentations by an authorized administrator of PDXScholar. Please contact us if we can make this document more accessible: [email protected].

E-Grocery Home Delivery Impacts on Food Distribution, Access and Equity: a Portland Case Study Katherine L. Keeling Transportation Technology and People (TTP) Lab
Department of Civil and Environmental Engineering
Portland State University, PO Box 751—CEE, Portland, OR 97207-0751
Email: [email protected]
Miguel A. Figliozzi, Corresponding Author Director Transportation Technology and People (TTP) Lab
Department of Civil and Environmental Engineering
Portland State University, PO Box 751—CEE, Portland, OR 97207-0751
Email: [email protected]
Paper submitted to 2019 International Urban Freight Conference, October 15-18, 2019, Long
Beach, CA.
ABSTRACT
The adoption of e-grocery home delivery (HD) has the potential to change social norms of acquiring
household foods and sundries. This case study of Portland, OR reviews the new elements of distribution,
inclusion, exclusion, and value created by the service of four major e-grocery businesses: Shipt, Instacart,
Amazon Prime Now, and Walmart. These e-grocers are reviewed in terms of service areas, pricing, and
inventory choice, as these are key factors on consumer experience. New distribution services are not
confided or distributed around traditional industrial or wholesale land use areas. Coverage is extensive, in
the Portland metropolitan statistical area, 94% of residents were eligible for e-grocery HD from at least one
platform or retailer. In regards to equity, 91% of residents of a USDA-identified, low-income, low-access
(LILA) census tracts are eligible for HD from at least one platform/retailer. E-grocery home delivery is also
discussed with attention to vulnerable population groups that may experience barriers to adoption, as well
as vulnerable populations that may benefit.
Keywords: E-grocery, home delivery, land use, food distribution, food deserts, food access, food equity

Keeling and Figliozzi
2
INTRODUCTION
Grocery purchases are necessary, frequent, and repeatable; e-commerce continues to grow at double-digit
rates (U.S. Deparment of Commerce, 2019), and e-grocery is the one of the least saturated e-commerce
markets, with substantial potential for growth. E-grocery business models include online grocers with no
physical retail space, and retailers with brick-and-mortar stores. Online grocers without retail spaces
operate out of warehouses or provide grocery shopping services within brick-and-mortar stores. The
grocery businesses built from brick-and-mortar grocery stores seek to remain competitive by adding e-
grocery channels—namely, click-and-collect (CC) retailing, and home delivery (HD).
Grocery CC channels allow consumers to place grocery orders online and then pick up the
prepared orders at the store. Big box stores tend to first promote CC channels because the consumer
provides the last-mile transport of goods from the store to their final destination. CC channels require the
retailer to establish a system in which to receive, process, and organize orders, but most of this can be
handled within the retailer’s building. Grocery HD requires a more sophisticated system because the
addition of last-mile transportation logistics includes many operations beyond the retail building. For this
reason, most grocery retailers do not develop in-house delivery programs, but rather partner with
companies positioned as online platforms to connect retailers, consumers, in-store shoppers, and delivery
drivers.
The challenging logistics of last-mile grocery delivery make profitability difficult. On-demand
delivery turnaround times have shrunk from same-day, to 2-hour, to even 1-hour. Supermarket inventories
are in the tens of thousands. Commodities like produce, meats, and prepared foods are delicate and
temperature-sensitive. Because grocery trips are fairly commonplace, these logistical constraints may go
undervalued, and thus consumers want delivery fees to be as low as the commodities which are
nonperishable and higher margin. However, the grocery industry has historically operated on a “razor-
thin” margin.
For some population groups, attitudes about grocery shopping are changing; as retailers introduce
e-grocery conveniences, traditional grocery shopping strikes some as wasted time (Goethals, 2012). Thus
e-grocery has invoked the interest of major investors as grocers evolve their logistics, and logistics
companies add grocery to their service portfolios. Moreover, as big box/general merchandise stores
develop e-grocery HD systems, their entire inventories are poised to be available for on-demand delivery.
TRADITIONAL INDUSTRIAL/WHOLESALE LAND USE AND FOOD ACCESS
Traditionally, large bulk shipment facilities and food industrial processing plants and distribution centers
are located near areas with good water, rail, and/or freeway access. This is also the case in Portland, OR.
In Figure 1, the main industrial districts as well as access to rail, maritime, truck, and airport facilities
are shown.
However, there another part of the food business that caters to restaurants, small grocers, or
intermediate food processors and manufacturers. During the 20th century, many produce brokers would
operate warehouses clustered together in a central location to facilitate their distribution to retailers. Most
industrial areas were developed according to maritime, rail, or truck access, but in Portland the
traditionally-named “Produce Row” was in a central location (see Figure 1). Many of the older produce
wholesalers have adapted to include retail operations or to cater to restaurant clients. One of the most
expensive operating costs for a grocery store is refrigeration. Not only does large-format refrigeration
require consistent vigilance and temperature-checking, but certain produce arrives from packing facilities
“wet-packed” in ice (which thaws in refrigeration), and other commodities must stay dry (mushrooms,
herbs, peppers). Still other produce commodities ship from packing facilities while underripe (tomatoes,
peaches, avocado) and must be stored at room temperature to be ready for consumers. Moreover, the
natural variation in produce requires some level of manual checking. Thus e-grocers must weigh the
efficiencies of warehousing operations with the consumer expectations that produce will be chosen on
their behalf with attention to ripeness and condition.

Keeling and Figliozzi
3
As logistics, refrigeration, and real estate norms have shifted, more large grocers primarily source
produce out of their private distribution centers, and even independent produce brokerages operate out of
newer facilities outside of town. This is creating new food related distribution patterns and commercial
vehicle movements related to e-grocery businesses that operate outside the traditional areas.
Figure 1 Temperature-sensitive industries within greater industrial access network, Portland, OR
Traditional industrial and wholesale food services are now compared with low income and low access
areas (see Figure 2).
Figure 2 USDA-identified low income and low supermarket access areas, 2017

Keeling and Figliozzi
4
According to USDA’s 2017 Food Access Research Atlas data, a map was made to
identify census tracts that had both low income and low [supermarket/large grocery store] access,
as defined by 1 mile distance to the nearest grocery store for urban areas and 10 mile distance to
the nearest grocery store for rural areas The study area for this food accessibility analysis is the
metropolitan statistical area for Portland, defined by the US Office of Management and Budget to include
7 counties spanning northwest Oregon and SW Washington.
A comparison of Figure 1 and Figure 2 indicates that proximity to a wholesale food area does
not guarantee accessibility. Later sections will discuss how e-grocery services may decrease or increase
food accessibility.
E-GROCERY EVOLUTION
E-grocery is by no means a recent endeavor: with its launch in 1996, Peapod, the first e-grocery company,
was one of the earliest internet startups (Semuels, 2019). Although it has more longevity than any e-
grocer, its service area is limited to the Midwest and East regions of the US. Other e-grocery businesses
began operations in the 2010s, with major players such as AmazonFresh, Instacart, and Shipt entering the
market from 2007–2014. Target bought Shipt in 2017, but it operates as an independent subsidiary with
its original branding, and coordinates service with other retailers besides Target. Conversely, Walmart has
initiated home delivery by leveraging several third parties such as DoorDash, Point Pickup, Skipcart,
AxleHire, and Roadie (Bose, 2019). Consumers use Walmart’s website and app, which are exclusive to
Walmart purchasing.
Walmart is a uniquely-positioned e-grocery competitor because of its 1,600 store locations, which
gives it advantages in last-mile logistics. 90% of Americans live within 10 miles of a Walmart, and CEO
Doug McMillon says Walmart has plans to invest in autonomous car delivery (Sozzi, 2019). Walmart’s
biggest competitor, Amazon, initially ventured into grocery home delivery–without a network of public
storefronts–through the subsidiary AmazonFresh, which grew slowly and has already been discontinued
in many US service areas. In 2017, Amazon bought Whole Foods Market, acquiring about 450 Whole
Foods Market stores. Instacart had originally been a third-party grocery delivery platform for Whole
Foods, but a year after the acquisition, the partnership was discontinued. Whole Foods delivery now is
part of the member-exclusive Amazon Prime Now service. To meet the demands of same-day delivery,
Amazon is shifting last-mile trips from national package delivery companies to small delivery companies
(Matsakis, 2019) and its own AmazonFlex program, which hires freelance hourly-rate drivers directly
(Semuels, 2018).
The most successful e-grocery HD models in the US have typically operated with hired shoppers
to select produce from store displays, where produce quality can be most easily assessed. In effect, the
brick-and-mortar stores are simultaneously serving traditional shoppers and for-hire shoppers from the
same merchandizing displays.
E-GROCERS COVERAGE
E-grocery delivery services are studied utilizing a GIS analysis of census data and data from e-grocer
websites. The analysis includes the service areas of two independent e-grocery delivery platforms, as well
as the e-grocery delivery service areas of two general merchandise retailers Though their websites may
show a map of cities served at a national scale, currently there are not maps available to show the service
bounds within a city. Instacart, Shipt, and Amazon Prime Now define their service bounds based on zip
code areas, thus all zip codes were checked for eligibility. However Walmart does not define service
based on zip code level. Addresses were checked for HD eligibility until the bounds of the service areas
could be approximated (n=521).
Figure 3 shows the coverage area of Instacart, whose Oregon service area extends beyond the
map extent into Salem, Corvallis, Eugene, and a few coastal towns. Instacart not only has a large
geographic service area, but also have a wide range of retail choices. Though areas with low population
density may have only 1-3 retail choices, Portland’s urban core has as many as 13 retailer choices. Figure
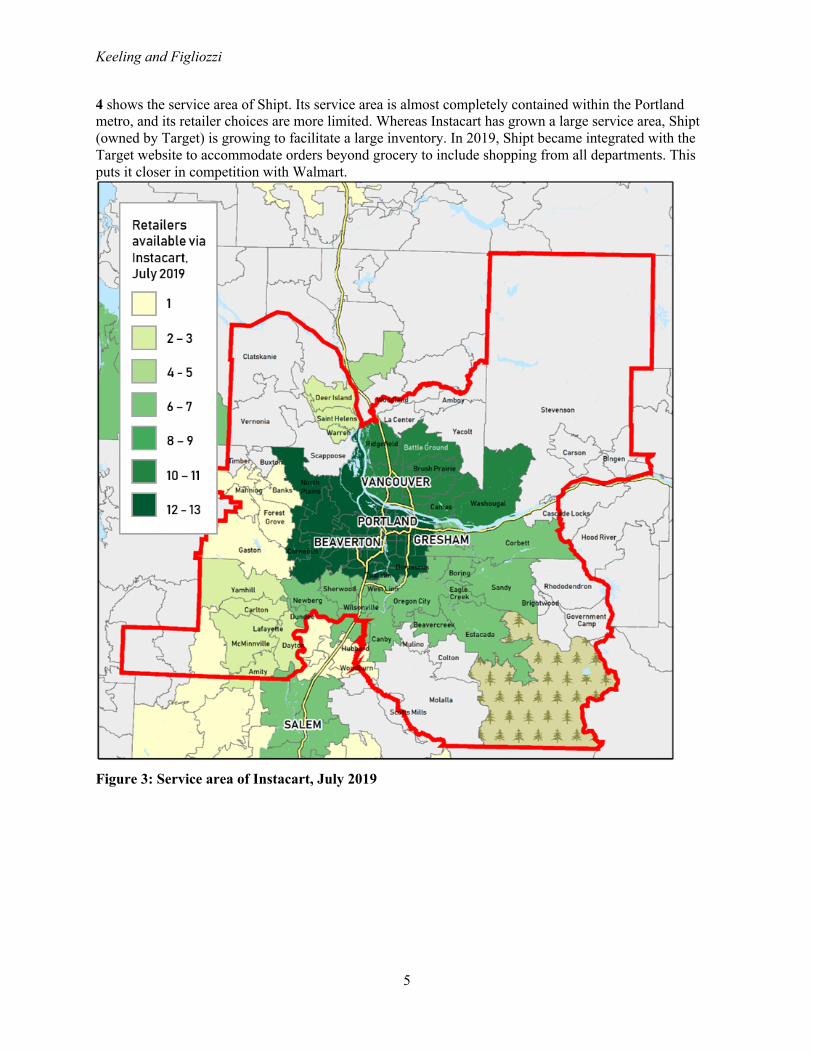
Keeling and Figliozzi
5
4 shows the service area of Shipt. Its service area is almost completely contained within the Portland
metro, and its retailer choices are more limited. Whereas Instacart has grown a large service area, Shipt
(owned by Target) is growing to facilitate a large inventory. In 2019, Shipt became integrated with the
Target website to accommodate orders beyond grocery to include shopping from all departments. This
puts it closer in competition with Walmart.
Figure 3: Service area of Instacart, July 2019

Keeling and Figliozzi
6
Figure 4 Service area of Shipt, July 2019
Unlike Amazon, Instacart and Shipt, Walmart’s service areas (Figure 5) are not defined by zip
code, and the exact metrics by which their boundaries are defined are unclear. However, service area is
related to store location. As of July 2019, 7 of the 16 Walmart Supercenters/Neighborhood Markers in the
NW Oregon/SW Washington are hubs for home delivery. The address query showed that the eligible
addresses are clumped in two regions, bisected by a central region ineligible for HD (as of March 2019).
The centrally-oriented addresses excluded from home delivery are likely due to the lack of Walmart
stores in central Portland. A total of 521 queries were used to delimit Walmart service areas.
In Portland, Amazon Prime Now offers both ordering from Amazon and Whole Foods Market
(which is owned by Amazon). However in the nearby metropolitan area of Seattle, WA, Prime Now also
offers delivery from retailers that compete with Whole Foods Market. It is unknown if Amazon will
continue to add grocery retailer options. Amazon’s service area is similar–but slightly smaller–than the
service area of Shipt.

Keeling and Figliozzi
7
Figure 5 Eligible and ineligible addresses for Walmart’s e-grocery home delivery
A comparison of Figure 1 to Figure 5 indicates that e-grocers coverage is fairly extensive and
includes urban low and low accessibility areas according to USDA’s 2017 Food Access Research Atlas
data. Hence new e-delivery services may bring about some positive changes. However, the problem of
food accessibility is multifaceted and discussed in detailed in the next sections.
EVOLUTION OF FOOD ACCESS RESEARCH
As early as the mid-2000s, the first longitudinal studies began challenging the idea that increasing
supermarket proximity would lead to an increase in healthy food choices. Longitudinal studies surveyed
the antecedent and subsequent food choices of consumers and found that the addition of a new
supermarket in a low supermarket-access area did not increase consumer’s fruit or vegetable nutritional
intake (Pearson, 2005). Researchers then began to look at the link between nutritional intake and their
access to all foods (Drewnowski, 2004). The concept of “food swamps” played off the food desert
metaphor but acknowledged competing draws of fast food, junk food, and healthy grocery. The relative

Keeling and Figliozzi
8
balance of fast food/junk food outlets was found to be a stronger indicator of obesity rates than absolute
measures of grocery stores (Cooksey-Stowers, 2017).
Fast food restaurants offer busy consumers the eponymous appeal of time savings, and to bolster
this competitive edge, in the mid-2000s, fast food companies expanded their ordering channels to include
call-in orders (Richtel, 2006). The following years saw the advent of mobile-app ordering. Meanwhile,
most grocery businesses lagged in their expansion of e-grocery.
As food desert research came under review, the methodologies to understand food access
expanded to involve additional factor, especially concerning transportation options and barriers. The first
queries for food deserts were based on straight-line distances from supermarkets, but researchers
subsequently improved these queries to be based on distance measurements along transportation
networks, with respect to driving, walking, or public transit modes (Jiao, 2012).
Federal Action to Remedy Food Deserts In the 1990s and early 2000s, public health researchers and leaders became interested in the link between
neighborhood food environments and health (Mikkelsen, 2007). In 2009, the USDA published a report on
“Access to Affordable and Nutritious Food: Measuring and Understanding Food Deserts and Their
Consequences.” A food desert is defined as a “low-income census tract where a substantial number or
share of residents has low access to a supermarket or large grocery store” (USDA, 2010). The report cited
not only geographical distance and grocery pricing as indicators of food access, but also the role of
transportation barriers. Improving food access was seen as a way to promote nutritional eating, so from
2011–2016, federal- and state-funded grant programs invested $500M in public-private partnerships
under the Healthy Food Financing Initiative (Ver Ploeg, 2016). This funding provided grocery retailers
one-time financial assistance to enter underserved neighborhoods lacking supermarkets. The program’s
vision was that the addition of full-service grocery stores would reduce grocery trip distances, increase
access to fresh foods, spur better nutritional choices, and ultimately, improve community health.
In acknowledgement of the transportation component of food access, government studied car
ownership as a metric for food vulnerability in demographic analysis; only 66% of Supplemental
Nutrition Assistance Program (SNAP) clients use their own vehicle for grocery trips, compared to 95% of
households above 185 percent of the federal poverty line (Ver Ploeg, 2015). Presumably, lower car access
rates among SNAP clients might constrain food choices to be governed by closest physical retailer, which
may be a convenience store with limited or no fresh produce inventory. The nutritional concerns of
households relying on convenience stores to meet their everyday food needs supported the investments in
promoting new supermarkets in food deserts.
From food deserts to food access: After the first wave of the Healthy Food Financing Initiative Though the addition of supermarkets reduced trip distances, follow-up studies found that geographic
proximity was not the primary determinant of primary grocery choice, even for SNAP recipients without
a car (Ver Ploeg, 2015). Additionally, a survey sample from Baltimore residents indicates that 45% of
shoppers do not primarily shop at the closest store, but rather a store of their preference (Huang, 2019).
Baltimore research is corroborated by research in Portland, Oregon–shoppers in vulnerable populations
will travel beyond their expected catchment zone for specialty items (such as ethnic/traditional
ingredients), or for the one-stop convenience offered by big-box general merchandise stores, such as
Walmart and Costco (Everett, 2011). A consumer’s access to choices in grocery is important, and will be
included in the following analysis of e-grocery service areas.
E-GROCERY COST METRICS AND FOOD ACCESS
Food access is also directly related to grocery costs. For low-income households, research found that
SNAP recipients are more sensitive to pricing than grocer proximity (Ver Ploeg, 2016) (Lin, 2014).
Authors have described the economic mismatch between high-price supermarkets and low-income
households as food mirages (Breyer, 2013). For all households, pricing trends since the 1980s have

Keeling and Figliozzi
9
disincentivized consumption of fresh fruits, vegetables, and nutrient-dense foods: market costs of produce
are rising, while market costs of processed foods are dropping (Todd, 2011). Because costs and inventory
options may have more value to shoppers than physical proximity, it has been suggested that the concept
“food deserts” be retired, as it has over-emphasized physical barriers and under-emphasized social and
cultural barriers (Widener, 2018). As shown in Figure 3 and Figure 4 Instacart and Shipt are major e-
grocery platforms in the Portland metro with extensive coverage; both have retail partnerships that offer
members a varying number of choices of retailers. For example, an Instacart member may choose
between a shopping order from Safeway (a national grocer), New Seasons (a regional grocer), or a local
food co-op. Walmart and Amazon Prime Now have also implemented e-grocery home delivery in the
study area.
The pricing and fee schedules (Table 1) of the different e-grocery companies vary considerably,
and thus can be hard for consumers to anticipate the best value for their needs. Some of the pricing
structures require out-of-pocket delivery costs, categorized as “per-trip fees;” others require fixed
membership costs, and still others add small price increases at the item level. The per-trip fees do not
include the fees for orders below delivery minimums; those are noted separately. Data from 2008 has
shown that households with annual incomes of $30,000 or less choose lower cost food options, while
households over $30,000 are willing to pay more for the same food options (USDA, 2010). If e-grocery
delivery is conceptualized as an added-value grocery cost, then only households making more than
$35,000 (inflation adjusted for 2019) are likely to consider paying extra fees for grocery costs.
Pricing and demographic facts about the four e-grocers and their services are compared in Table 1 following the Portland Bureau of Transportation (PBOT) Equity Matrix. PBOT looked at US best
practices to develop to help guide their work and investments. Their matrix is based on three demographic
variables: race, income, and Limited English Proficiency (LEP). LEP is particularly relevant to e-grocery
discussion, as American adults with LEP have only a 51% rate of internet use (Perrin, 2015). In many
cases low income, race, and LEP are strongly correlated and Portland is not an exception.
A spatial query identifies the extent to which current e-grocery HD service areas include USDA-
identified low-income, low-access (LILA) census tracts. E-grocery HD usually includes cities but is less
available in rural areas. Though, the service areas of private e-grocery enterprises are expanding into
increasingly rural areas but e-grocers can pull out of service areas that are not profitable. This is
especially concerning for LILA households in rural areas. In our Portland case study, as of July 2019,
access to at least one retailer via e-grocery HD included 22 LILA census tracts with 111,900 inhabitants,
or 91% of the study area’s LILA population. Only 3 LILA census tracts remain unserved, with 10,800
inhabitants, or 9% of the metro’s LILA population and 0.4% of the entire metro population. All unserved
LILA census tracts were in rural areas (Figure 6). Walmart is the only retailer whose service area
averages a lower household income than the study area average. With the exception of Walmart, HD
service areas tend to hub around densely populated urban centers. The further away from the urban core,
the less population density, and the less potential customers gained as e-grocers commit to larger and
farther-reaching areas.
According to the Federal Deposit Insurance Corporation (FDIC) National Survey of Unbanked
and Underbanked Households, 3.0% of households in the Portland metro study area are unbanked, and
15.5% are underbanked (2017). An underbanked account may have an account, but lack of access to a
debit or credit card will preclude e-grocery adoption. Until recently, SNAP recipients have not been able
to use the Electronic Benefit Transfer (EBT) card on e-grocery platforms. In April 2019, the USDA Food
and Nutrition Service launched an online purchasing pilot in conjunction with three retailers in the state of
New York: Amazon, ShopRite, and Walmart (USDA, 2019). SNAP benefits do not cover delivery fees or
other associated charges, but the EBT card can be used on the retailers’ websites to purchase eligible
foods. Both Oregon and Washington are anticipated to be included in subsequent pilots. An OR-WA pilot
that includes Amazon and Walmart would include 66% of all SNAP households in the study area. An
OR-WA pilot that includes Instacart or Shipt would include 94% and 88% of SNAP households,
respectively.

TABLE 1 Key metrics of pricing and service area demographics
*based on zip code resolution **The point-level data used in Walmart’s service area analysis is not robust enough to estimate the lowest population density.
PRICING, July 2019 DEMOGRAPHICS & EQUITY METRICS Per-trip fee
Member- ship fee
Fees in item price
Delivery min.
Auto tip
Inventory beyond grocery
Pop. in service area + % of metro
Lowest pop. dens. in service area*
% POC
Languagebesides English supported
Median hhold annual income (thous.)
% of pop. over 65
Instacart 5% order total + $3.99
NO NO $10 YES NO 2.29M (94%)
16 persons/ sq. mi.
27.5 NO $74.3 10.2
Instacart Express
$0 $99/yr or $10/mo
NO $10 YES NO
Shipt $0 $99/yr or $14/mo
YES, unless Target item
$35 NO YES 2.11M (86%)
65 persons/ sq. mi.
27.4 NO $74.9 10.1
Amazon Prime Now
$7.99 for 1 hr, $0 for 2 hr
$119/yr NO $35
NO YES 1.71M (70%)
19 persons/ sq. mi
28.2 Website: Yes, App: No
$77.2 9.9
Walmart Grocery
$9.95 NO NO $30 NO YES 1.12M (54%) (est.)
** 27.5 NO $71.4 10.0
Walmart Delivery Unlimited
$0 $98/yr or $13/mo
NO $30 NO YES
Study area total
N/A 2.43M (100%)
0.1 persons/ sq. mi
26.0 N/A $71.9 10.3

Figure 6 Service area coverage and population density
OTHER FACTORS RELATED TO FOOD ACCESS
Though the majority of the metro population is eligible for at least one e-grocery option, delivery eligibility is not the only barrier to adoption. Will e-grocery home delivery enrich food access for underserved populations, or will it further inequity? This section analyzes other aspects of e-grocery services that may increase or decrease food access for specific populations.
Additional potential losses in food equity The following discussion touches on some of the dimensions in which social equity and inclusion may suffer if some groups are excluded from the shifting trends towards e-grocery HD. Barriers of income, bounds of service areas, financial limitations, and banking access were already discussed. The following discussion includes potential problems such as the digital divide and social isolation. This should not be perceived as an exhaustive list.

Keeling and Figliozzi
12
Digital Divide A payment card is not the only tool required to take place an e-grocery order; a shopper must have internet service and a computer/tablet, or reliable connection and smartphone. Moreover, an understanding of how to navigate retailer websites/apps is not the simplest feat, especially as large as inventories may be. Initiatives in Georgia that provided free internet access and free basic computer literacy programs still found educational deficits remained in groups that had long-standing and pervasive social disadvantages (Kyasny, 2006). Segmentation of technological use in society can leave potential adopters without a social network with which to troubleshoot user challenges. Potential unintended consequences: Social isolation, lack of community and human contact A growing body of research has documented the unintended consequences that arise from technological changes that offer easy substitutes for other face to face interactions (Turkle, 2017). As a consequence, loneliness and social isolation may be growing rapidly; groups like elderly adults may be especially vulnerable (Gardiner et al., 2018). In-store grocery trips are a recurring errand that provide social activity, which has been linked to reduced mortality rates in gerontology studies (Tilvis, 2012). Though online or e-grocery solutions may be beneficial for some sectors of the population, an unintended consequence may be an increase in social isolation and loneliness. Potential Gains in food equity: E-grocery HD is expected to grow because consumers value the service. In particular, we can consider the ways which HD can accommodate groups that have historically experienced barriers in historic grocery shopping: consumers with disabilities, households with time poverty, and the non-driver/carless population. Opportunity to serve disabled communities Consumers with disabilities, including vision-impairment, may especially benefit from a grocery delivery service. Many visually impaired (VI) people rely on friends, relatives, volunteers or store employees when navigating supermarkets (Kulyukin, 2010). The American Council of the Blind recognizes the value of these services in helping VI people claim independence. On a smartphone, e-grocery apps may offer high-contrast display setting, or be designed with special regard to user experience through screen-reading tools, voice recognition, or touch-gesture user interfaces. Unfortunately, digital barriers remain for those with disabilities, and only 61 and 58 percent of adults with a disability have a computer or smartphone, respectively (Pew Research Center, 2017). Time poverty and gender disparities Although HD does have financial costs–and costs are a barrier for low income households–the convenience HD offers is particularly valuable in terms of time savings. Some households experience time poverty as well as economic poverty, particularly single-parent households (Harvey, 2007). In weighing the tradeoffs between time and money, if we assume an opportunity cost of $15/hr, then even the highest flat delivery fee (Walmart) is justified if the trip saves 40 minutes of time. LILA households spend an average of 19.5 minutes in travel to a grocery store; this is 30% longer than the national average, 15 minutes (USDA, 2009). Thus for the average LILA household, eliminating travel time saves about 40 minutes of time. Additional time savings include the time spent shopping store aisles, minus the time spent shopping online. Overall, e-grocery HD convenience may be particularly pronounced for shoppers who would otherwise rely on walking, bicycling, or public transportation, as do 13% of SNAP households (Ver Ploeg, 2015). Moreover, for shoppers without access to their own vehicle, delivery fees are easily less than the cost of ride-hail service or a taxi.
Related to time poverty, e-grocery HD may alleviate some gender disparity in household responsibilities. Women are more likely to make time-intensive, highly-complex, multi-purpose trips, and more likely to be accompanied by children (Turner, 2000). When time poverty is compounded by financial poverty, the integration of SNAP benefits into e-grocery delivery is a relevant way to support

Keeling and Figliozzi
13
low-income households. Critics of integrating this benefit may consider e-grocery HD to be too luxury a service to be integrated for SNAP clients. However, only a decade ago, a smartphone was a high luxury, and yet now it is arguably a necessity for social inclusion. Moreover, low-income households have limited means to pay for convenience, and yet the digital market has opened countless new discretionary services that serve to give their consumers the advantages of saving time. In their research note on gender and time poverty, Turner and Grieco posit that “it is important that new technologies not be used simply as a means of controlling the behavior of those on welfare, but rather to be used positively as a means of enabling and empowering those with low incomes, and consequently to produce greater equity in society” (2000). Non-driver populations As mentioned in the literature review, car ownership was used as a metric for population vulnerability. This implies that those who cannot drive to the grocery store in a car, at their own discretion are at a disadvantage, especially for spontaneous grocery trips. Groceries can be heavy, and cumbersome to carry on walk trips, bus trips (and associated walk trips) or by bicycle. Thus grocery shopping is less efficient overall; the physical effort required to transport groceries limits consumers to making smaller purchases and thus having to make more frequent trips. E-grocery allows consumers the ability to plan grocery shopping without the constraints of the weight of groceries. This may be one of the factors why e-grocery shoppers spend on average 30% more than in-store purchases (Onespace, 2017).
While attitudes about mobility are changing, many elderly adults find themselves unprepared to access groceries when facing driving cessation. In the US, life expectancy exceeds driving expectancy by 6-10 years (Silverstein, 2008), and older non-drivers make 59% fewer shopping and restaurant trips (Mason, 2013). E-grocery delivery may help elderly adults regularly or intermittently–after a permanent reduction in mobility, or during a temporary recovery. Although e-grocery HD may hold extra value for an elderly non-driver, technology barriers exist, as a 2015 survey found that only 58% of adults 65 years and older use the internet (Pew Research Center, 2015).
CONCLUSIONS
This research analyzed the impact of new e-grocery home delivery services on food access and food equity in the Portland metropolitan region. The services of four companies were carefully analyzed in terms of coverage and service characteristics. To the best of the authors’ knowledge, there has been no research examining e-grocery delivery service in connection with land use and food access.
The research shows that land use patterns related to food distribution, processing, and services are changing. Hence, e-grocery can be an interesting area to study how freight patterns and commercial movements are being impacted by e-commerce.
New e-grocery home delivery services do have some positive aspects in terms of population coverage and providing options for groups that have historically experienced barriers in grocery shopping: consumers with disabilities, households with time poverty, and the non-driver/carless population. However, there are also some groups that may suffer or be excluded from accessing the benefits of ecommerce and home deliveries. A list of the dimensions discussed in this research includes: low income, bounds of service areas, banking access, digital divides, and language barriers.
The distribution patterns and tradeoffs discussed in this research are likely to shift over time and perhaps even significantly in the short-term if e-commerce continues to grow at double-digit rates. Currently, e-grocery home delivery services provide additional access to more geographic areas, accommodate some disabled communities, and may expand retailer choice.
ACKNOWLEDGEMENTS
This research project was funded by the Freight Mobility Research Institute (FMRI), a U.S. DOT University Transportation Center.

Keeling and Figliozzi
14
REFERENCES
Bose, N., 2019. Why Walmart Farms Out Same-Day Grovery Deliveries to Low-Cost Freelance Drivers [Online]. Rueters. Available at: https://www.reuters.com/article/us-walmart-labor-outsource-focus/why-walmart-farms-out-same-day-grocery-deliveries-to-low-cost-freelance-drivers-idUSKCN1Q30JS (Accessed 24 July 2019).
Breyer, B. and Voss-Andreae, A., 2013. Food mirages: Geographic and economic barriers to healthful food access in Portland, Oregon. Health & Place, 24, pp.131-139.
Cooksey-Stowers, K., Schwartz, M. and Brownell, K., 2017. Food swamps predict obesity rates better than food deserts in the United States. International journal of environmental research and public health, 14(11), p.1366.
Drewnowski, A. and Specter, S.E., 2004. Poverty and obesity: the role of energy density and energy costs. The American journal of clinical nutrition, 79(1), pp.6-16.
Everett, M., 2011. Practicing anthropology on a community-based public health coalition: lessons from HEAL. Annals of Anthropological Practice, 35(2), pp.10-26.
Federal Deposit Insurance Corporation, 2017. National Survey of Unbanked and Underbanked Households [online]. Available at: https://economicinclusion.gov/surveys/ (Accessed 1 August 2017). Gardiner, C., Geldenhuys, G. and Gott, M., 2018. Interventions to reduce social isolation and loneliness among older people: an integrative review. Health & Social Care in the Community, 26(2), pp.147-157. Goethals, F., Leclercq-Vandelannoitte, A. and Tütüncü, Y., 2012. French consumers' perceptions of the unattended delivery model for e-grocery retailing. Journal of Retailing and Consumer Services, 19(1), pp.133-139.
Goldvale, C. Counting Everyone in the Digital Age: The Implications of Technology Use in the 2020 Decennial Census for the Count of Disadvantaged Groups [Online]. Available at: http://www.georgetownpoverty.org/wp-content/uploads/2017/10/LCEF_2020_Census_Poll_Report-Final-002.pdf (Accessed: 19 June 2015). Hargittai, E., 2018. The digital reproduction of inequality. In The Inequality Reader (pp. 660-670). Routledge.
Harvey, A.S. and Mukhopadhyay, A.K., 2007. When twenty-four hours is not enough: Time poverty of working parents. Social Indicators Research, 82(1), pp.57-77. Huang, A., 2019. Baltimore Food Policy Initiative. Washington DC, Transportation Research Board.
Jiao, J., Moudon, A.V., Ulmer, J., Hurvitz, P.M. and Drewnowski, A., 2012. How to identify food deserts: measuring physical and economic access to supermarkets in King County, Washington. American journal of public health, 102(10), pp.e32-e39.
Kohler, C., 2018. This Woman Makes $17.50 an Hour Grocery Shopping in Her Free Time [Online]. Pennyhoarder. Available at: https://www.thepennyhoarder.com/make-money/shipt-shopper (Accessed 9 July 2019).
Kulyukin, V. and Kutiyanawala, A., 2010. Accessible shopping systems for blind and visually impaired individuals: Design requirements and the state of the art. The Open Rehabilitation Journal, 3(1), pp.158-168.
Kvasny, L. and Keil, M., 2006. The challenges of redressing the digital divide: A tale of two US cities. Information systems journal, 16(1), pp.23-53. Lin, B.H., Ver Ploeg, M., Kasteridis, P. and Yen, S.T., 2014. The roles of food prices and food access in determining food purchases of low-income households. Journal of Policy Modeling, 36(5), pp.938-952.

Keeling and Figliozzi
15
Matsakis, L., 2019. Why Amazon is giving employees $10,000 to quit [Online]. Wired. Available at: https://www.wired.com/story/amazon-delivery-paying-employees-to-quit/ (Accessed 24 July 2019).
Mikkelsen, L. and Chehimi, S., 2007. The links between the neighborhood food environment and childhood nutrition.
Moroz, M. and Polkowski, Z., 2016. The last mile issue and urban logistics: choosing parcel machines in the context of the ecological attitudes of the Y generation consumers purchasing online. Transportation Research Procedia, 16, pp.378-393.
Onespace, 2018. Online Grocery & Food Shopping Statistics [Online]. Available at: https://www.onespace.com/blog/2018/08/online-grocery-food-shopping-statistics/ (Accessed 1 August 2019). Pearson, T., Russell, J., Campbell, M.J. and Barker, M.E., 2005. Do ‘food deserts’ influence fruit and vegetable consumption?—A cross-sectional study. Appetite, 45(2), pp.195-197.
Perrin A., Duggan, M., 2015. Americans’ Internet Access: 2000-2015. Pew Research Center. Pew Research Center, 2017. Disabled Americans are Less Likely to Use Technology. [Online] Available at: https://www.pewresearch.org/fact-tank/2017/04/07/disabled-americans-are-less-likely-to-use-technology/ (Accessed 22 July 2019).
Richtel, M., 2006. The long-distance journal of a fast-food order [Online]. New York Times. Available at: https://www.nytimes.com/2006/04/11/technology/the-longdistance-journey-of-a-fastfood-order.html (Accessed 29 July 2019). Saskia, S., Mareï, N. and Blanquart, C., 2016. Innovations in e-grocery and logistics solutions for cities. Transportation Research Procedia, 12, pp.825-835.
Semuels, A., 2018. I Delivered Packages for Amazon and It Was a Nightmare [Online]. The Atlantic. Available at: https://www.theatlantic.com/technology/archive/2018/06/amazon-flex-workers/563444/ (Accessed 24 July 2019).
Semuels, A., 2019. Why People Still Don't Buy Groceries Online [Online]. The Atlantic. Available at: https://www.theatlantic.com/technology/archive/2019/02/online-grocery-shopping-has-been-slow-catch/581911/ (Accessed 24 July 2019).
Sozzi, B., 2019. Walmart CEO: Autonomous-car delivery is Part of our Future. [Online] Yahoo. Available at: https://sports.yahoo.com/walmart-ceo-autonomouscar-delivery-is-part-of-our-future-125143113.html (Accessed 25 February 2019).
Tilvis, R.S., Routasalo, P., Karppinen, H., Strandberg, T.E., Kautiainen, H. and Pitkala, K.H., 2012. Social isolation, social activity and loneliness as survival indicators in old age; a nationwide survey with a 7-year follow-up. European Geriatric Medicine, 3(1), pp.18-22.
Turkle, S., 2017. Alone together: Why we expect more from technology and less from each other. Hachette UK.
Turner, J. and Grieco, M., 2000. Gender and time poverty: the neglected social policy implications of gendered time, transport and travel. Time & Society, 9(1), pp.129-136.
Todd, J.E., Leibtag, E. and Penberthy, C., 2011. Geographic differences in the relative price of healthy foods (No. 78). Diane Publishing.
U.S. Deparment of Commerce, 2019. Quarterly Retail E-Commerce Sales: 1st Quarter 2019, United States Census Bureau: Washington DC.
USDA-Food and Nutrition Service, 2019. USDA Launches SNAP Online Purchasing Pilot [Online]. Available at: https://www.fns.usda.gov/pressrelease/2019/fns-000319 (Accessed 23 July 2019).

Keeling and Figliozzi
16
Ver Ploeg, M. ed., 2010. Access to affordable and nutritious food: measuring and understanding food deserts and their consequences: report to Congress. USDA: Washington DC.
Ver Ploeg, M., Mancino, L., Todd, J.E., Clay, D.M. and Scharadin, B., 2015. Where do Americans usually shop for food and how do they travel to get there? Initial findings from the National Household Food Acquisition and Purchase Survey (No. 1476-2017-3882).
Ver Ploeg, M. and Rahkovsky, I., 2016. Recent evidence on the effects of food store access on food choice and diet quality (No. 1490-2016-128407).
Visser, J., Nemoto, T., & Browne, M. (2014). Home delivery and the impacts on urban freight transport: A review. Procedia-social and behavioral sciences, 125, 15-27.
Widener, M.J., 2018. Spatial access to food: Retiring the food desert metaphor. Physiology & behavior, 193, pp.257-260.