e grocery industry digital media strategy
TRANSCRIPT

E-GROCERY INDUSTRY
DIGITAL MEDIA STRATEGY
OVERVIEW OF THE INDUSTRY• The reason for the relatively slower growth in the spread of e-grocers is because
storage of perishable items is more expensive than the storage of non-perishable items, which is why most players operate in cities and have not yet expanded to even an entire state.
• However, urban India’s increasing shortage of time is fuelling the growth of online grocery and in 2015 at least 20 metropolises are expected to be fully covered by e-grocers.
• Also, the online grocery space in India has reached new heights in the past few months with investors pouring millions into this space and big corporates like Tata and Reliance and Ecommerce giants like Flipkart, Amazon & Snapdeal foraying to capture this multi billion dollar market.

63% Males Buy Groceries Online
Biscuits and Cookies make up for 20% of the sales by
volume
Staples make up for 21% of sales by value
61% female shoppers are 36-45 in age

India is the 6th largest grocery market in the worldOnline Grocery Business
To Grow at a Rate of 25-30 %
In Major Cities of India.

INTERESTING FACTS
Women between the
ages of 35-45 are the largest adopters
Most orders are placed
between 10pm and 12pm
Institutional clients make up
29% of the orders

RISE OF SOCIAL MEDIA
74% of consumers rely on
social media to guide their purchases

Expected Growth
In the Next 3 Years In the Next Year
158%
76%67%
35%
ExecutivesConsumers
Expected Growth in Food, Beverage, Household
Consumables and Personal Care Items in E-Commerce
Channels

According to studies, Social Referral (social following to drive engagement, social amplification of promotions or brand offers,
social shopping, referral and recruitment of talent) is important in influencing customer behaviour by 79%
The increase in expected investment in this area is 70%

CUSTOMER BEHAVIOUR ON SOCIAL MEDIA
Seeking Information
Sharing Information
Tracking Information
Broadcasting Information
Social Media

SOCIAL MEDIA GUIDEBuild brand awareness, reply to customer queries and promote
seasonal sales
Drive fan engagement and create sharable hashtags
Provide exclusive merchandise and organise previews
Share visual content, integrate shopping cart to see, use for multi
media content and use images that inspire
Create short, quirky videos and give a face to your brand

COMPETITIVE ANALYSIS

MAJOR PLAYERS

OVERVIEW• Publicly available information on the Web is captured and analysed to create a
comprehensive report about a brands Social Media presence and online activities.
• The intent is to help a company better understand the performance of and reaction towards the brand on Digital Media and turn social media into strategic insights to help them develop operational intelligence and situational awareness.
• The brands’ online behaviour is mapped and classified based on:
• Presence on Social Networks
• Engagement level on social media
• Impact on their sphere of influence
• Popularity and reach
• Activity Patterns
• Sentiments associated with the conversations

SOCIAL MEDIA QUOTIENT (SMQ)
• ‘Social Media Quotient’ measures a brands’ performance on social channels. It is calculated on the analysis of ‘Presence & Performance’ of various social media assets; it takes into account- connections/ followers/ public posts, engagement level, influence, technology adoption etc.
• The following channels have been covered under SMQ Analysis

Competitor Channel Analysis

Big Basket Grofers Local Banya Zop Now Pepper Tap
19.1
12.8
29.331
28
Big Basket Grofers Local Banya Zop Now Pepper Tap
41.1
26.4
35.9
41.7
22.7
Relative Performance
Grofers has the highest twitter score and is closely followed by
Local Banya and Big Basket. Growers needs to improve on the number of re-tweets and replies
on its posts to have an even higher score.
Grofers again leads the way on Facebook and is closely followed by PepperTap and Local Banya.
Growers has 6857 likes on the last 7 posts on its page which is much higher than any other competitor.

Best Practices
Pepper Tap has interesting tweets which allows its customers to connect with the brand.
ZopNow and others display their promotional activities on Facebook to get more views.

Website
Big Basket Grofers Local Banya Zop Now Pepper Tap
20
30303030Blog
Big Basket Grofers Local Banya Zop Now Pepper Tap
40
32
40
31
0
Relative Performance
All 5 competitors have very good websites that are customer
friendly. All social plug-ins are synchronised. Pepper Tap is behind
the others because it does not have a social plug in apart from
Facebook and Twitter.
Local Banya here tops the list with more than 11 blogs each month.
The posts are interesting and have good creatives to capture interest. Big Basket needs to start a blog.

Best Practices
Local banya has a really good blog and writes about topics
currently in trend. Growers has an interesting website and they sell custom baskets for people
who are in a rush.

You Tube
Big Basket Grofers Local Banya Zop Now Pepper Tap0
20.9
10.6
14.9
24.6
Big Basket Grofers Local Banya Zop Now Pepper Tap
22.9
16.918.7
30
19.4
Relative Performance
Big Basket leads the list here because it has the highest number
of subscribers which is 71. This however, isn't a very impressive number and can be improved
through better videos.
Grofers tops the LinkedIn list because it has the maximum
number of employees on the site as well as the largest following of
4078 individuals.

SMQ
Big Basket Grofers Local Banya Zop Now Pepper Tap
21.76
30.4428.51
23.49 24.34
Social Media Quotient
• SMQ is affected by a company’s social media prac7ces, engagement level, content, popularity and reach against industry’s benchmark.
• Social Media plays a pivotal role in ‘E-‐commerce’ & ‘Brand Building’ • Grofers leads the way with an SMQ of 30.44 as it is the leader in all channels. However it could concentrate on its YouTube channel to get a higher score.
• Big Basket lags behind because it does not have a dedicated blog, and its engagement is rela7ve less on Facebook. It needs to up its game, fast.

WAY FORWARD
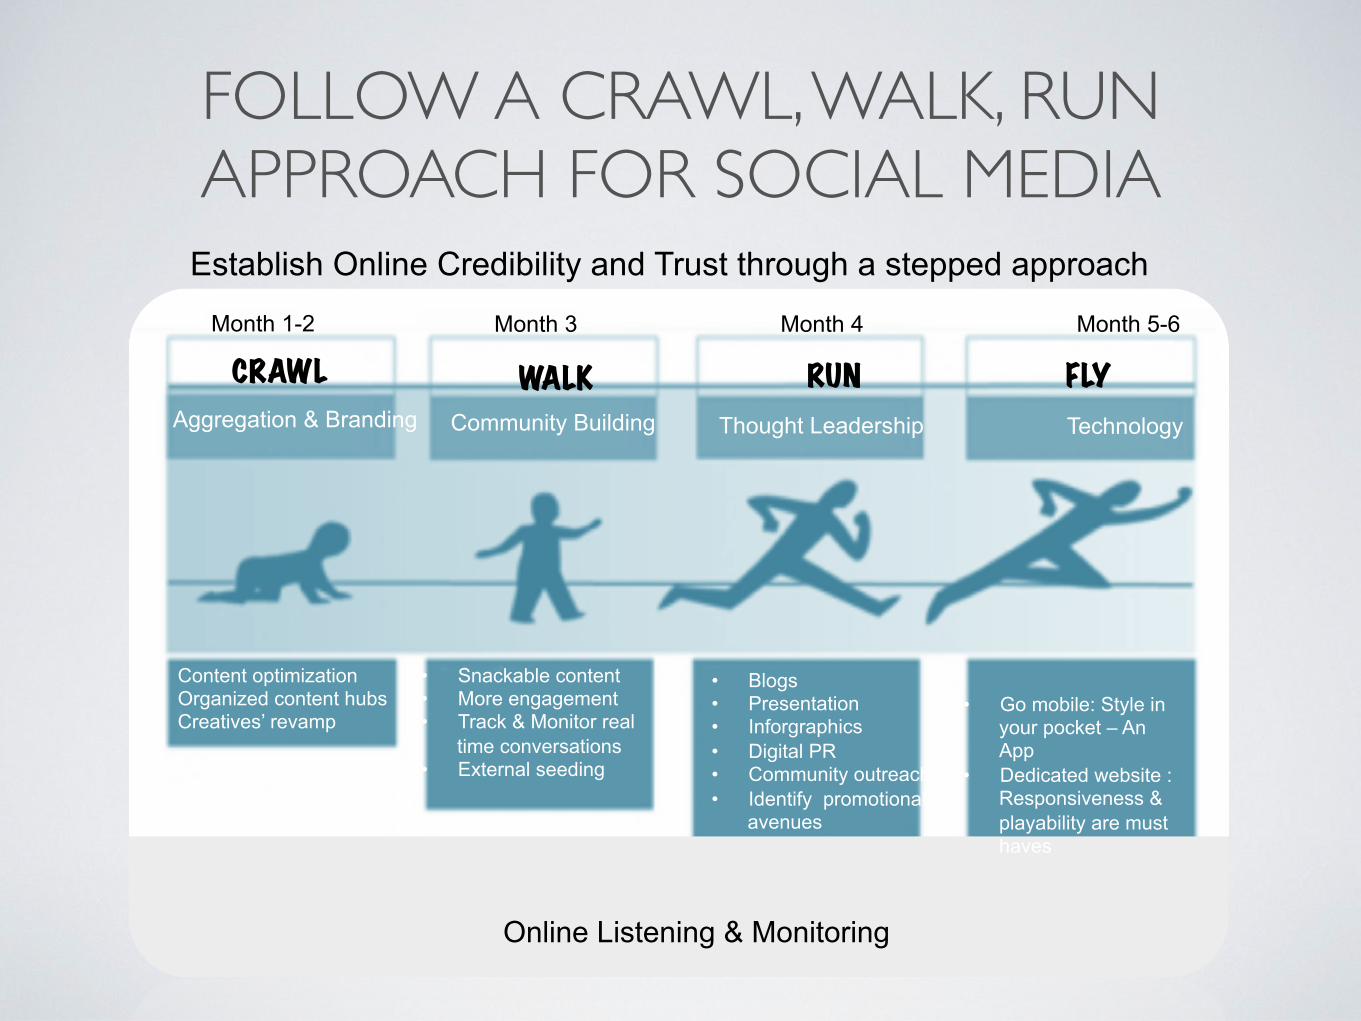
FOLLOW A CRAWL, WALK, RUN APPROACH FOR SOCIAL MEDIA
CRAWL WALK RUN FLY Aggregation & Branding Community Building Thought Leadership Technology
Online Listening & Monitoring
Establish Online Credibility and Trust through a stepped approach
• Content optimization • Organized content hubs • Creatives’ revamp
• Snackable content • More engagement • Track & Monitor real
time conversations • External seeding
• Go mobile: Style in your pocket – An App
• Dedicated website : Responsiveness & playability are must haves
Month 1-2 Month 3 Month 4 Month 5-6
• Blogs • Presentation • Inforgraphics • Digital PR • Community outreach • Identify promotional
avenues
We will Follow The Crawl, Walk, Run Methodology for Social Media

SOCIAL MEDIA IMPLEMENTATION PLAN
Intelligence Content VenuePromotional Platforms KPIs
Your BrandsYour Competition
Industry Trends
Listen for
Listen in
Twitter, Facebook, Blogs, News, Forums,
Suggestion Sites
Market Research,Public Relations,
Customer Service,Branding
Digital Marketing,Public Relations
Digital Marketing :Community Building
which can be leveraged for several functions
Social Enterprise Metrics : CEO – CFO –
CMO ‘s Office
• Size of the community
• Level of Engagement
• Number of App downloads
• Number of queries resolved
• Content Curated

SEO & SEM

SEARCH ENGINE OPTIMISATIONKeyword Research
On Page SEO Off Page SEO
Create Blog PostsCreate Presentations Create Videos
Create content using researched keywords for websites like slideshare, YouTube etc. These sites have highest page ranks and thus help your website show up on the 1st page of search engines
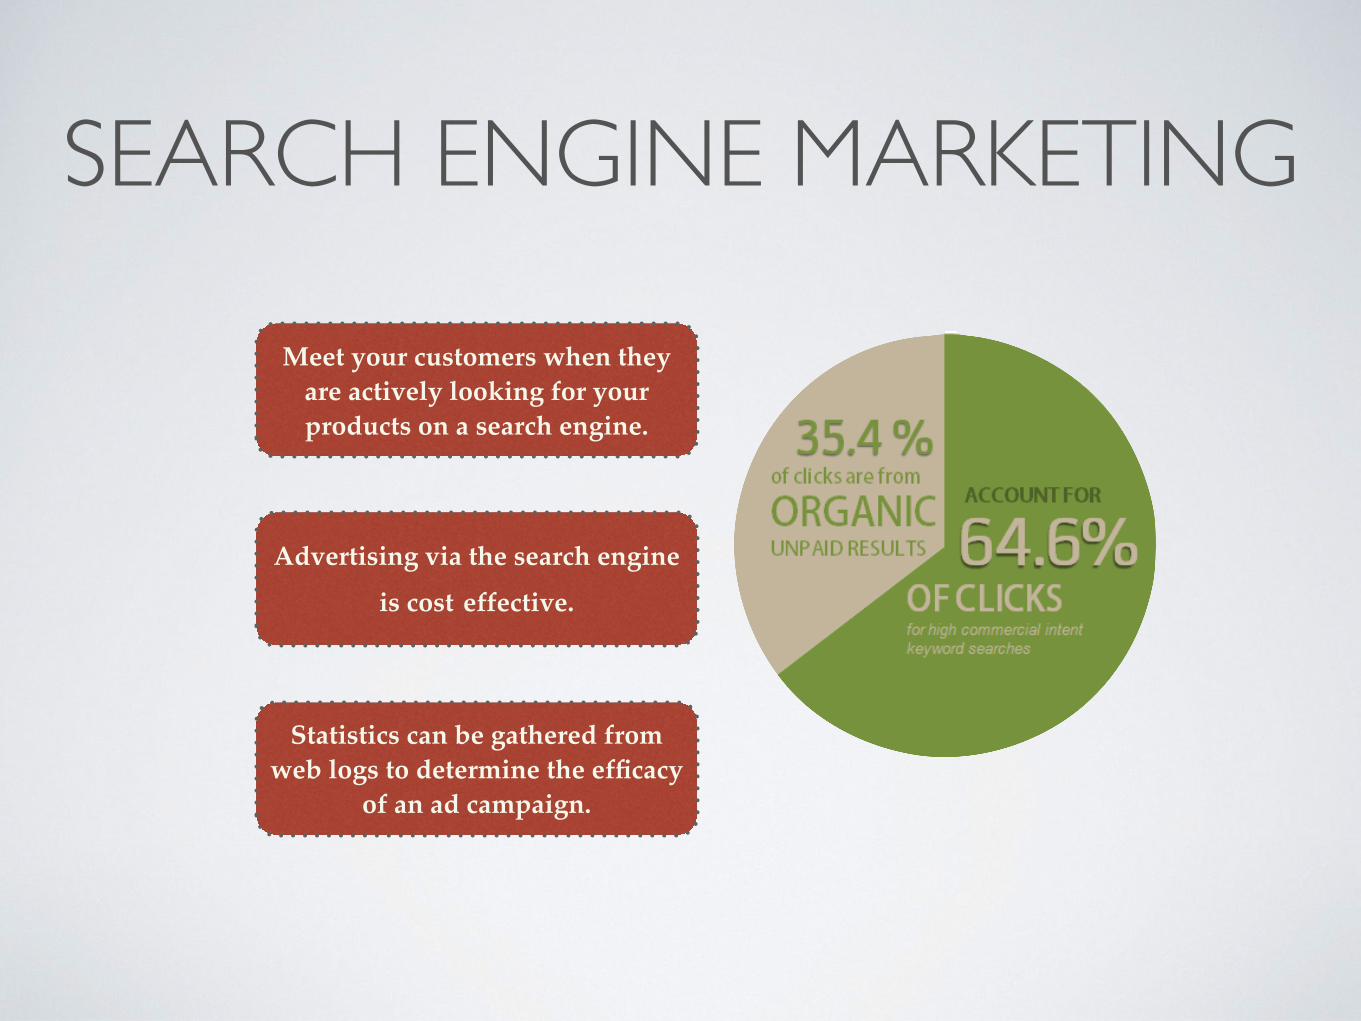
SEARCH ENGINE MARKETING
Meet your customers when they are actively looking for your products on a search engine.
Advertising via the search engine
is cost effective.
Statistics can be gathered from web logs to determine the efficacy
of an ad campaign.

ABOUT ITTISA

WHO ARE WE? Founded in June of 2014, we are the first ever only girls Digital Media Agency.
The name Ittisa in Sanskrit means 'The Ruler' and we aim to rule the creative world with our highly creative and passionate team..
At Ittisa, we are a unique captivating mix of innovative ideas, diligence and the right sprinkle of creativity!
We love the work we do here because one - we adore the Digital world and two - we know that our ideas & strategy make a difference.
Our objective is simple - To make our clients create a mark in the Digital space with crisp strategy, excellent designs & great content.
Super glad to announce that we have recently partnered with LeanIn.org and look forward to changing the trajectory of women workers and create a better world for everyone.

WHAT DO WE DO?

WHAT WE CAN DO FOR YOU!
BRAND BUILDING &
SOCIAL MEDIA MARKETING
SEARCH ENGINE OPTIMISATION
SEM
BIG DATA ANALYTICSORM
SOCIAL CRM
UI & UX Design

HAPPY CLIENTS

Thank You
Connect With Us