e ink holdings inc. e ink holdings inc. 2014 … ink holdings inc. 2014 annual report no.3, lixing...
TRANSCRIPT

E INK
HO
LDIN
GS IN
C. 2
01
4 A
nn
ua
l Rep
ort
No.3, Lixing 1st Rd., Hsinchu Science Park, Hsinchu 300, Taiwan Tel: 886 3 5798599 Fax: 886 3 5788339 http://www.einkgroup.com
E INK HOLDINGS INC. 2014 Annual Report
• EIH: 8069• Taiwan Stock Exchang Market Observation Post System: http://mops.twse.com.tw • EIH annual report is available at http://www.einkgroup.com • Printed on April 11, 2015
Copyrights of some images used in this report belong to Amazon、Kobo、Sony、Vikaura、Visionect and Yota Devices. "JoAn" is a registered trademark of Visionect. " Kindle Paperwhite " is a registered trademark of Amazon.com, Inc. "Kobo Aura HD" is a registered trademark of Rakuten Kobo Inc. "SmartBand Talk" is a registered trademark of Sony. "Vikaura" is a registered trademark of Vikaura. "YotaPhone" is a registered trademark of Yota Devices.
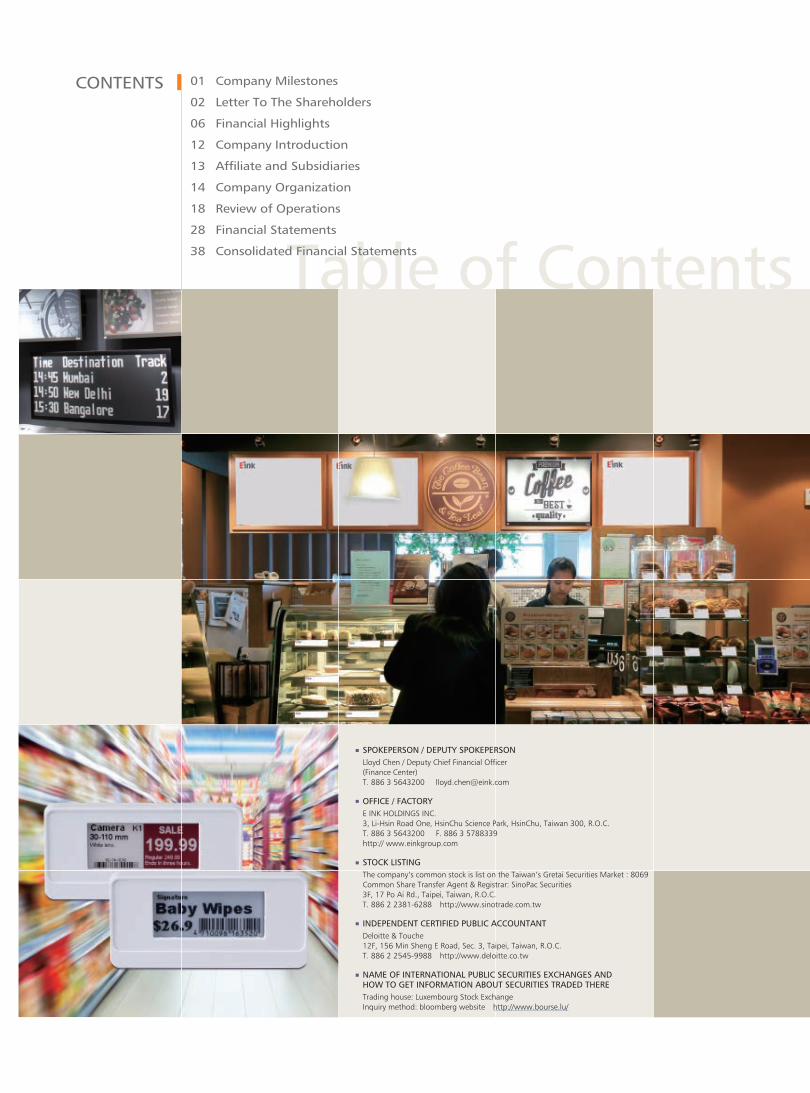
Table of Contents
CONTENTS
SPOKEPERSON / DEPUTY SPOKEPERSONLloyd Chen / Deputy Chief Financial Officer(Finance Center)T. 886 3 5643200 [email protected]
OFFICE / FACTORYE INK HOLDINGS INC.3, Li-Hsin Road One, HsinChu Science Park, HsinChu, Taiwan 300, R.O.C.T. 886 3 5643200 F. 886 3 5788339http:// www.einkgroup.com
STOCK LISTINGThe company‘s common stock is list on the Taiwan’s Gretai Securities Market : 8069Common Share Transfer Agent & Registrar: SinoPac Securities3F, 17 Po Ai Rd., Taipei, Taiwan, R.O.C.T. 886 2 2381-6288 http://www.sinotrade.com.tw
INDEPENDENT CERTIFIED PUBLIC ACCOUNTANTDeloitte & Touche12F, 156 Min Sheng E Road, Sec. 3, Taipei, Taiwan, R.O.C.T. 886 2 2545-9988 http://www.deloitte.co.tw
NAME OF INTERNATIONAL PUBLIC SECURITIES EXCHANGES ANDHOW TO GET INFORMATION ABOUT SECURITIES TRADED THERETrading house: Luxembourg Stock ExchangeInquiry method: bloomberg website http://www.bourse.lu/
01 Company Milestones
02 Letter To The Shareholders
06 Financial Highlights
12 Company Introduction
13 AffiliateandSubsidiaries
14 Company Organization
18 Review of Operations
28 Financial Statements
38 Consolidated Financial Statements
01
Table of Contents
COMPANY MILESTONES
Date of Establishment : June 16th, 1992
Milestones in the Company’s History:Sept 2000 Monthly production capacity reached 18,000 substratesOct 2000 Securities & Futures Information Center issued authorization for public offeringSept 2001 Expanded its monthly production capacity to 36,000 substratesOct 2001 Acquired ISO 9001 certificationApr 2002 Taiwan’s Investment Commission approved the company’s plan to set up a PRCsubsidiary, Transcend Optronics (Yangzhou) Co Ltd, through
a third region investment entityJul 2002 Acquired QS-9000 Certification for product quality, ISO 14001 Certification for environmental standards, and OHSAS 1800 Certification for
occupational health and safety management systemsFeb 2003 Listed its shares on Taiwan’s Emerging Stock MarketOct 2003 Applied for its shares to be listed on Taiwan’s GreTai Securities Market (GTSM)Jan 2004 GTSM approved the company’s application for its shares to be listedMar 2004 Commenced trading on the GTSM on March 30, 2004Nov 2004 Taiwan’s Investment Commission approved the company’s application for indirect investment in Rich Optronics (Yangzhou) Co Ltd in PRC
through a third region investment entityMay 2005 Partnered with Philips in EPD (Electronic Paper Display) businessMay 2006 Executed the 1st treasury stock repurchase and retired 296,000 issued sharesOct 2006 Established US subsidiary to expand sales network in the AmericaNov 2007 Signed a merger memorandum with BOE Hydis Technology of South KoreaJul 2008 Officially acquired share ownership of Hydis TechnologiesJun 2009 Signed agreement to acquire 100% share ownership of E Ink Corporation (EIC) USASept 2009 Signed amended agreement for the 100% share transfer with EIC and shareholder representatives to obtain 100% share ownership of EIC,
effective December 23rd, 2009Dec 2009 Hydis Technologies signed corporate bond purchase agreement, guarantee agreement, investment agreement and cross-licensing agreement
with LG Display of KoreaMay 2010 Taiwan’s Investment Commission approved the company’s application to establish Transyang Electronics (Yangzhou) Ltd through a third
region investment entityNov 2010 The company’s latest EPD product, E Ink PearlTM , won the Popular Science award for “Best of What’s New 2010”Dec 2010 Won Printed Electronics Awards at The 4th IDTechEx, USAMar 2011 The company’s Board of Directors passed a resolution for a second treasury stock repurchase to be used for employee motivation programsJun 2010 Changed English name of the company to “E Ink Holdings Inc.”.Jan 2011 Approved by the Investment Commission to invest in the Chuanyuan Electronics (Yangzhou) Co., Ltd. in Mainland China through a third-
location investment vehicle.May 2011 The E Ink TritonTM EPD was awarded by the SID as the Best Display Component of Year 2011.Jul 2011 Partnered with Chunghwa Picture Tubes Ltd. by subscribing to the unsecured convertible bonds from its non-public offering after approved
by the board of directors.Oct 2011 The E Ink TritonTM EPD won 2011 Technology Innovation Award issued by Wall Street Journal, USA.Nov 2011 The E Ink PearlTM EPD won 2011 Innovation Awards for Electronics issued by IET, UK.Nov 2011 Terminated the joint investment in Hydis with LG Display under a mutual agreement. Hydis redeemed its corporate bonds held by LG Display
and relieved all the guarantee contracts related with said bonds.Jun 2012 The next generation E Ink high performance EPD won the Fifteenth Excellent Optical Product Prize from the Photonics Industry & Technology
Association.Jun 2012 The high contrast E Ink PearlTM EPD won the Eleventh Surface Display Component Product Technology Prize’s Excellent Component from the
Image Display Industry Advancement Office, Industrial Development Bureau of the Ministry of Economic Affairs.Jul 2012 E Ink Holdings Inc. and its Korean subsidiary, Hydis Technologies Co., Ltd entered patents cross-licensing agreement with Sharp Corporation.Oct 2012 E Ink Holdings Inc. and its Korean subsidiary, Hydis Technologies Co., Ltd entered patents cross-licensing agreement with AU Optronics Corp.Nov 2012 E Ink Holdings Inc completed the purchase of SiPix Technology, Inc. and its wholly owned subsidiary SiPix Imaging, Inc. (USA)Dec 2012 E Ink Holdings Inc. and its Korean subsidiary, Hydis Technologies Co., Ltd entered patents cross-licensing agreement with Chunghwa Picture
Tubes Ltd.Jan 2013 E Ink Holdings Inc. bought facilities and equipments from its subsidiary, Sipix at Linkou, to integrate production capacity in Taiwan and to
improve assets utilization.May 2013 E Ink Holdings won the Best in Show award for 2013 from the Society of Information Display (SID) of the United States.May 2013 E Ink Spectra released. Spectra is the world’s only electronic paper display capable of displaying three colors of red, black, and white.June 2013 E Ink Triton, the all-functional color EPD, received the 16th Outstanding Optical Electronic Product Award from the Photonics Industry and
Technology Development Association (PIDA).Nov 2013 Our company’s Korean subsidiary Hydis Technologies Co., Ltd. signed a patent exchange authorization agreement with Innolux Corporation.April 2014 Our company’s Korean subsidiary Hydis Technologies Co., Ltd. signed a patent exchange authorization agreement with BOE Technology
Group Co., Ltd.Jun 2014 The E Ink Spectra three-pigment EPD won the 17th Outstanding Optoelectronic Product Award from the Photonics Industry & Technology
Development Association (PIDA).Dec 2014 Won the SEMI Standards Contribution Award from SEMI Taiwan.Jan 2015 Launched the world’s first programmable color and pattern EPD technology: E Ink Prism.

02
Letter to Shareholders
Letter to Shareholders

03
Dear Shareholders,The outlines for the 2014 business report of E Ink Holdings Inc., as well as operation highlights in
2015 are as below.
2014 Business Report
For E Ink, 2014 was a year of continuing challenges and a transition during which the Company
completed its adjustment in the management corporate structure to better align with the markets
we do business in and set the foundation for longer term growth by diverting more resources to
new markets. Despite the fact that the new management team has made the efforts and hard
work, we have been unable to make rewarding accomplishments for the year. In 2014, E Ink had a
combined revenue of NT$ 14.6 billion, a gross profit of NT$ 1.57 billion with a gross profit margin
at 11% and a net income after tax of NT$ 13 million. The earnings per share (EPS) for 2014 are NT$
0.01.
The EPD business continues to be a difficult manufacturing and production environment due to
market demand and our customers’ repeated requests for new product capabilities and designs.
Despite these challenges, the hard work of our staff continued to push up the overall shipment of
eReader displays. We continued to see new product announcements from all of our major eReader
customers. As reported last year, the electronic shelf label (ESL) business continues to grow. ESL
using E Ink EPDs are being deployed in Europe, Asia and the United States. Thanks to the number
of existing engagements and evaluations, we expect to see continued growth in 2015. Beyond
these more established markets, during 2014 we adoption of EPDs in mobile phones, wearable
devices and health and fitness products. These applications will bring increased business to the
company as these markets continue to grow and mature.
For the LCD market, E Ink has chosen not to directly engage in the highly competitive, price cutting
LCD business for the consumer market. We continue to focus on niche markets that have special
needs, as well as by licensing Fringe Field Switching (FFS) technology.
We have completed the organizational reengineering plan in 2014. The establishment of functional
organizations and business units is complete and our global operations are fully integrated enabling
E Ink to better serve existing customers and focus on developing new businesses, with an ultimate
goal of a diversified portfolio in the EPD market.
With the introduction of a number of new E Ink products, 2014 was the year where these products
were adopted by our customers for their end products. E Ink Carta has been adopted by the major
eReader suppliers and continues to see significant demand. E Ink Spectra and Aurora have been
adopted by our leading ESL partners as part of their products and will be seeing deployment in
2015. E Ink Mobius has been adopted by our leading mobile and wearable product customers and
will be seeing a significant growth in 2015.
Operation Highlights in 2015
With the increasing popularity of EPD in various applications such as ESL, mobile phones, smart
watches and electronic signage, together with a comprehensive eco-system we have created with
our business partners, and driven by the growth of eReader devices in Europe, Japan and other
emerging markets, we are convinced the EPD markets will continue to grow in 2015. To achieve
our performance objectives, we will implement the following operation strategies in 2015:
Letter to Shareholders

04
(1) Strengthen the integration of production and R&D to decrease the defect rate
With the spirit of “developing forward-looking technologies”, E Ink continues our quest and R&D efforts for critical technologies in EPD. We have
had breakthroughs in areas such as front light, touch, flexible and color EPD, which have been introduced for various market applications. As the
product applications continue to diversify, our clients have more diversified product designs and specifications requirements, which translates
into more challenges in our production. In response, E Ink will strive to strengthen our organizational integration through organizational
reengineering and bring the manufacturing and R&D units closer to each other so as to overcome the difficulties we may encounter in the
production process, effectively reduce the defect rate in a meaningful sense, and meet the client’s products requirements.
(2)Optimizeenvironmental,manufacturingprocessandimprovelaborforceefficiency
E Ink continues to optimize our manufacturing process and the environment of our factory campus, while working hard to improve our labor
efficiency. Starting in 2013 we have significantly committed to the optimization and automation of our production lines to improve product
quality, shorten manufacturing time, and cut down the labor force required per unit output. Meanwhile, we are taking various measures to
improve the working environment and quality of life to strengthen our employees’ loyalty to the Company. We have seen encouraging results
and this endeavor will continue this year.
(3) Revitalize idle assets
For those production lines that need operational efficiency and idle assets, E Ink has adopted a number of projects to reduce the operational
burdens and enhance efficiency. We are looking for making major accomplishments in 2015.
(4) Actively establish the EPD ecosystem
While striving to develop EPD, E Ink is also working hard to form a strategic alliance with suppliers in the upstream, downstream and peripheral
sectors, and engage in technology cooperation with our major component suppliers to build a complete EPD market with an ultimate goal of
pushing up our revenues and profits. Also, E Ink is collaborating with chip suppliers in a joint effort to develop new chip designs to make our EPD
products more price competitive and functionally more powerful.
(5) Continue to promote new products and application markets
E Ink has broad and in-depth technologies for e-paper devices. We have also had a number of advances in the development of new technologies
and new applications, such as digital signage and architecture applications. In the future, E Ink will continue to offer clients more options
through the collaboration with leading brands, channels, and designers so as to become our main driving forces to advance our operation
performance.
Prospect
We have seen some preliminary accomplishments since our transformation efforts starting in 2012. With the ever growing popularity of the
Internet of Things and portable devices, energy saving and lightweight/thinness/high efficiency have become an unstoppable trend into the
future. We are optimistic about the broad applications of E Ink’s e-paper products in sectors other than eReader devices, such as ESL, mobile
phones and wrist watches for their characteristics such as paper-like, extra-low power consumption, durability, lightweight/thinness and sunlight
readability. This will eventually turn a lot of conceptual product designs into real end-user products. We expect in the near future the new
applications will continue to become more popular, which in turn will bring more advantages to our business operation.
The management team will strive to enhance operation efficiency and allocate more R&D resources. We will continue our efforts in product
innovation and help create values for our customers. We are sincerely thankful for our staff’s long-term contribution to the Company, and all the
support and recognition from our clients, partners, suppliers, shareholders and the public. We will do everything we can to lead all our staff to
move along the set track and pragmatically implement the growth strategies we created to accomplish our goals.
E Ink Holding Inc.
Frank Ko
Chairman & CEO

05

06
Financial HighlightsFinancial Highlights

07
Financial Highlights
Condensed Balance SheetUnconsolidated
Unit:NT$ thousands
YearItem 2010 2011 2012 2013 2014 31/03/2015
Item
Not applicable
13,944,015 12,999,748 7,906,308
Not applicable
Property, plant and equipment 1,498,249 2,064,620 1,994,224Intangible assets 49,790 45,038 106,479Other Assets 29,132,178 27,551,124 28,533,208Total Assets 44,624,232 42,660,530 38,540,219
CurrentLiabilities
BeforeDistribution
16,235,979 12,957,305 10,039,589
AfterDistribution
16,235,979 12,957,305 (Note)
Noncurrent Liabilities 4,545,900 3,934,138 1,867,104
Total Liabilities
BeforeDistribution
20,781,879 16,891,443 11,906,693
AfterDistribution
20,781,879 16,891,443 (Note)
Equity Attributable to Shareholders of the Parent
23,842,353 25,769,087 26,633,526
Capital Stock 10,809,897 11,409,897 11,404,677Capital Surplus 9,686,700 10,073,700 10,071,578
Retained Earnings
BeforeDistribution
3,855,157 3,669,033 3,616,465
AfterDistribution
3,855,157 3,669,033 (Note)
Other equity (483,507) 642,351 1,540,806Treasury shares (25,894) (25,894) -Non-Controlling Interests - - -
Total Equity
BeforeDistribution
23,842,353 25,769,087 26,633,526
AfterDistribution
23,842,353 25,769,087 (Note)
Note: Pending for shareholders’ meeting resolution
ConsolidatedUnit:NT$ thousands
YearItem 2010 2011 2012 2013 2014 31/03/2015
Current Assets
Not applicable
18,520,690 14,216,444 15,882,253 13,805,656Property, plant and equipment 10,194,178 9,835,142 9,041,082 8,616,091Intangible assets 10,267,299 9,797,804 9,675,994 9,541,863Other Assets 6,933,453 6,235,705 4,354,523 3,890,375Total Assets 45,915,620 40,085,095 38,953,852 35,853,985
CurrentLiabilities
BeforeDistribution
14,945,285 8,561,571 9,112,824 8,078,336
AfterDistribution
14,945,285 8,561,571 (Note) (Note)
Noncurrent Liabilities 7,187,691 5,971,409 3,328,026 2,794,281
Total Liabilities
BeforeDistribution
22,132,976 14,532,980 12,440,850 10,872,617
AfterDistribution
22,132,976 14,532,980 (Note) (Note)
Equity Attributable to Shareholders of the Parent
23,842,353 25,769,087 26,633,526 25,143,376
Capital Stock 10,809,897 11,409,897 11,404,677 11,404,677Capital Surplus 9,686,700 10,073,700 10,071,578 10,071,578
Retained Earnings
BeforeDistribution
3,855,157 3,669,033 3,616,465 2,487,689
AfterDistribution
3,855,157 3,669,033 (Note) (Note)
Other equity (483,507) 642,351 1,540,806 1,179,432Treasury shares (25,894) (25,894) - -Non-Controlling Interests (59,709) (216,972) (120,524) (162,008)
Total Equity
BeforeDistribution
23,782,644 25,552,115 26,513,002 24,981,368
AfterDistribution
23,782,644 25,552,115 (Note) (Note)
Note:Pending for shareholders’ meeting resolution

08
Condensed Statement of Income
Unconsolidated
Unit: NT$ thousands (Except EPS: NT$)
YearItem 2010 2011 2012 2013 2014
For the Year Ended 31/03/2015
Net Sales
Not applicable
13,359,855 14,427,628 12,461,581
Not applicable
Gross Profit 1,124,952 1,293,885 919,055
Income from Operations 1,489 59,302 (486,906)
Non-operating Income and Expenses (568,143) (16,413) 458,895
Profit (Loss) Before Income Tax (566,654) 42,889 (28,011)
Net Income (Loss) (748,222) 29,303 13,476
Other comprehensive income (loss), net of income tax
(143,924) 1,131,137 939,451
Total Comprehensive Income (Loss) (892,146) 1,160,440 952,927
Earnings (Loss) Per Share(Note) (0.69) 0.03 0.01
Note:Based on weighted average shares outstanding in each year
Consolidated
Unit: NT$ thousands (Except EPS: NT$)
YearItem 2010 2011 2012 2013 2014
For the Year Ended 31/03/2015
Net Sales
Not applicable
26,704,782 18,905,129 14,571,205 2,708,785
Gross Profit 2,819,788 3,018,681 1,570,754 633,308
Income from Operations (1,448,408) (1,648,317) (3,234,911) (478,196)
Non-operating Income and Expenses 813,411 1,436,827 2,913,156 411,696
Profit (Loss) Before Income Tax (634,997) (211,490) (321,755) (66,500)
Net Income (Loss) From Continuing Operations
(1,082,407) (36,009) 54,209 (209,447)
Net Income (Loss) From Discontinued Operations
- - - (962,357)
Net Income (Loss) (1,082,407) (36,009) 54,209 (1,171,804)
Other comprehensive income (loss) ,net of income tax
(140,248) 1,117,883 934,274 (359,830)
Total Comprehensive Income (Loss) (1,222,655) 1,081,874 988,483 (1,531,634)
Total Net Income Attributable to Shareholders of the Parent
(748,222) 29,303 13,476 (1,129,090)
Total Net Income Attributable to Shareholders of the non-controlling interests
(334,185) (65,312) 40,733 (42,714)
Total Comprehensive Income Attributable to Shareholders of the Parent
(892,146) 1,160,440 952,927 (1,490,150)
Total Comprehensive Income Attributable to Shareholders of the non-controlling interests
(330,509) (78,566) 35,556 (41,484)
Earnings (Loss) Per Share(Note) (0.69) 0.03 0.01 (0.99)
Note:Based on weighted average shares outstanding in each year

09
Auditors’ Opinions from 2010 to 2014
Year CPA Firm CPA Audit Opinon
2010 Deloitte & Touche Chih-Ming Shao, Shu-Wan Lin A Modified Unqualified Opinions
2011 Deloitte & Touche Chih-Ming Shao, Shu-Wan Lin A Modified Unqualified Opinions
2012 Deloitte & Touche Shu-Wan Lin, Cheng Hung Kuo A Modified Unqualified Opinions
2013 Deloitte & Touche Shu-Wan Lin, Ya Ling Wong A Modified Unqualified Opinions
2014 Deloitte & Touche Shu-Wan Lin, Ya Ling Wong A Modified Unqualified Opinions
Financial Analysis
Unconsolidated
YearItem 2010 2011 2012 2013 2014 31/03/2015
Capital StructureAnalysis (%)
Debt Ratio
Not applicable
46.57 39.60 30.89
Not applicable
Long-term Fund to Fixed Assets Ratio
1,894.76 1,438.68 1,429.16
Liquidity Analysis
Current Ratio (%) 85.88 100.33 78.75
Quick Ratio (%) 81.22 88.60 68.36
Times Interest Earned (5.37) 1.33 0.73
Operating PerformanceAnalysis
Average Collection Turnover 1.84 1.90 2.33
Days Sales Outstanding 198 191 157
Average Inventory Turnover 10.00 12.41 9.63
Average Inventory Turnover Days 1.14 1.16 1.41
Average Payment Turnover 36 29 38
Property, Plant and Equipment Turnover
8.92 6.99 6.25
Total Assets Turnover 0.30 0.33 0.31
ProfitabilityAnalysis
Return on Total Assets (%) (1.53) 0.26 0.25
Return on Equity Attributable to Shareholders of the Parent (%)
(2.89) 0.12 0.05
Pre-tax Income to Paid-in Capital Ratio (%)
(5.24) 0.38 (0.25)
Net Margin (%) (5.60) 0.20 0.11
Earnings Per Share (0.69) 0.03 0.01
Cash Flow (%)
Cash Flow Ratio 18.79 (14.58) (1.54)
Cash Flow Adequacy Ratio 139.38 103.84 93.66
Cash Flow Reinvestment Ratio (0.51) (4.91) (0.42)
LeverageOperating Leverage 197.27 5.91 0.38
Financial Leverage (0.02) (1.50) 0.82

10
Consolidated
YearItem 2010 2011 2012 2013 2014 31/03/2015
Capital StructureAnalysis(%)
Debt Ratio
Not applicable
48.20 36.26 31.94 30.32
Long-term Fund to Fixed Assets Ratio
304.39 322.73 331.39 324.25
Liquidity Analysis (%)
Current Ratio 123.92 166.05 174.28 170.90
Quick Ratio 97.35 125.12 149.10 140.65
Times Interest Earned (0.62) 0.15 (1.43) (42.50)
OperatingPerformanceAnalysis
Average Collection Turnover 3.23 3.65 4.87 5.28
Days Sales Outstanding 112 99 75 70
Average Inventory Turnover 5.21 4.82 5.01 3.99
Average Inventory Turnover Days 4.44 4.10 6.36 5.50
Average Payment Turnover 70 75 73 92
Property, Plant and Equipment Turnover
2.67 1.89 1.54 1.23
Total Assets Turnover 0.58 0.44 0.37 0.29
ProfitabilityAnalysis
Return on Total Assets (1.27) 0.41 0.36 (2.96)
Return on Equity Attributable to Shareholders of the Parent
(2.89) 0.12 0.05 (4.36)
Pre-tax Income to Paid-in Capital Ratio
(2.78) (1.28) (3.18) (8.65)
Net Margin (2.80) 0.16 0.09 (41.68)
Earnings Per Share (0.69) 0.03 0.01 (0.99)
Cash Flow (%)
Cash Flow Ratio 35.52 34.14 46.10 (2.52)
Cash Flow Adequacy Ratio 87.97 113.14 145.39 137.34
Cash Flow Reinvestment Ratio 4.08 5.55 8.07 (0.41)
LeverageOperating Leverage (0.42) (0.25) 0.39 0.06
Financial Leverage 0.88 0.90 0.95 0.95
1. Capital Structure Analysis
(1) Debt Ratio = Total Liabilities / Total Assets
(2) Long-term Fund to Property, Plant and Equipment Ratio = (Shareholders’ Equity + Noncurrent Liabilities) / Net Property, Plant and
Equipment
2. Liquidity Analysis
(1) Current Ratio = Current Assets / Current Liabilities
(2) Quick Ratio = (Current Assets - Inventories - Prepaid Expenses) / Current Liabilities
(3) Times Interest Earned = Earnings before Interest and Taxes / Interest Expenses
3. Operating Performance Analysis
(1) Average Collection Turnover = Net Sales / Average Trade Receivables
(2) Days Sales Outstanding = 365 / Average Collection Turnover
(3) Average Inventory Turnover = Cost of Sales / Average Inventory
(4) Average Inventory Turnover Days = 365 / Average Inventory Turnover
(5) Average Payment Turnover = Cost of Sales / Average Trade Payables
(6) Property, Plant and Equipment Turnover = Net Sales / Average Net Property, Plant and Equipment
(7) Total Assets Turnover = Net Sales / Average Total Assets

11
4. Profitability Analysis
(1) Return on Total Assets = (Net Income + Interest Expenses * (1 - Effective Tax Rate)) / Average Total Assets
(2) Return on Equity attributable to Shareholders of the Parent = Net Income Attributable to Shareholders of the Parent / Average Equity
Attributable to Shareholders of the Parent
(3) Pre-tax Income to Paid-in Capital Ratio = Income before Tax / Paid-in Capital
(4) Net Margin = Net Income / Net Sales
(5) Earnings Per Share = (Net income attributable to Shareholders of the Parent - Preferred Stock Dividend) / Weighted Average Number of
Shares Outstanding
5. Cash Flow
(1) Cash Flow Ratio = Net Cash Provided by Operating Activities / Current Liabilities
(2) Cash Flow Adequacy Ratio = Five-year Sum of Cash from Operations / Five-year Sum of Capital Expenditures, Inventory Additions, and Cash
Dividend
(3) Cash Flow Reinvestment Ratio = (Cash Provided by Operating Activities - Cash Dividends) / (Gross Property, Plant and Equipment +
Longterm Investments + Other Noncurrent Assets + Working Capital)
6. Leverage
(1) Operating Leverage = (Net Sales - Variable Cost) / Income from Operations
(2) Financial Leverage = Income from Operations / (Income from Operations - Interest Expenses)

12
COMPANY INTRODUCTION
E Ink Holdings Inc. started in 1992 and manufactures Electronic Paper (ePaper based on Electrophoretic technology) and TFT LCD (Thin Film
Transistor based Liquid Crystal Display). E Ink is the world leader in the global ePaper industry and one of the High-Tech Subsidiaries of the YFY
Group.
The YFY Group includes the largest professional paper manufacturing company in Taiwan, and was the first in the Greater China region to
establish an R&D center for paper manufacturing.
The founding of E Ink Holdings began with the YFY Group’s rich history in paper manufacturing and the ancient Chinese history of paper
inventions. In the early 1990’s, Mr. SC Ho, the founder of YFY group, realized that digital publishing was an inevitable trend and that paper and
printing might eventually be replaced by paperless electronic devices. He tasked his team to find new technologies to bridge the gap between the
printed page and digital content and delivery methods. This led to investments by the YFY Group in LCD technology and the continued research
into future display technologies that could realize this vision.
In 1992 E Ink Holdings Inc. (formerly Prime View International) was established as the first TFT LCD company in Taiwan, focusing on high quality
small-to-medium-sized TFT LCDs. In 2002 E Ink Holdings established Transcend Optronics in YangZhou, China in order to match the increasing
demand in the TFT LCD industry.
In 1997, E Ink Corporation was spun out of the MIT Media Lab to commercialize electronic ink and ePaper technology using TFTs from Philips
Electronics. Seeing the potential of this new display medium, in 2005 E Ink Holdings acquired the ePaper business unit from Philips, and together
with E Ink Corporation, launched the first EPD eBooks into the market. To increase capacity as the eReader market expanded, E Ink Holdings
merged with the Korean TFT LCD company, Hydis Technologies, in 2008. In 2009, YFY Group authorized the acquisition of E Ink Corporation by
E Ink Holdings to further integrate and expand the ePaper supply chain.
The demand for ePaper has increased dramatically thanks to the booming eReader industry. With the leading ePaper technology, high quality
products and outstanding supply chain, E Ink Holdings is now the world’s leading supplier of ePaper modules to global top tier eReader brand
names like Amazon, Sony, Hanvon, Barnes & Noble, and has a global market share of 90+%.
E Ink Holdings’corporate philosophy aims to deliver revolutionary products, excellent user experiences, and environmental benefits through
advanced technology development.
With new products like color, flexible, and touch-enabled ePaper, E Ink Holdings will lead the ePaper industry into a new era.

13
AFFILIATES AND SUBSIDIARIES
Yangzhou Qifu Electronics
Corp.
Transmart Electronics (Yangzhou)
Transyork Technology
Yangzhou Ltd
Yangzhou Qidi Electronics
Corp.
Effect Media International Investment
Corp
Yangzhou Aurac-tech Co.,
Limited
Rich Optronics (Yangzhou)
Co., Ltd.
Transcend Optronics
(Yangzhou) Co., Ltd.
E InkCalifomia, LLC (Note)
Kai Yu Investment Co., Ltd.
SiPix Technology,
Inc.
E Ink Japan Inc.
Ruby Lustre Ltd.
PVIInternational
Corp.
Dream PacificInternational
Corp.
Hydis Technologies
Co., Ltd.
Lucky JoyHoldings Ltd.
LeadingConceptLimited
MobilioLimited
Hydis JapanCo., Ltd.
HydisShenzhen Ltd.
Hydis Taiwan Inc.
Tech Smart Logistics Ltd.
PVIGlobal Corp.
Hot Tracks International
Ltd.
Prime View Communications
Ltd.
Yuen Yu Investment Co., Ltd.
New Field e-Paper Co., Ltd.
E Ink Corporation
DreamUniverse Ltd.
TransYang Electronics (Yangzhou)
E Ink Holdings Inc.
100.00%
100.00%
100.00%
100.00%
100.00%
100.00%
100.00% 100.00% 100.00%
100.00%100.00%
44.39%
55.61%
41.79%
29.38%
41.74%29.45%
28.81%
28.83%
75.81%
100.00%
100.00%
94.73%
100.00%
41.81%
24.23%
0.09%
99.91%
66.66%
100.00% 100.00% 100.00% 100.00% 100.00%
12.88%
100.00%100.00%
45.31%
100.00% 100.00%
Note: Corporate name, "Sipix Imaging Inc", has been changed into "E Ink California,LLC" since July, 2014.

14
Company OrganizationCOMPANY ORGANIZATION

15
OFFICE AND FUNCTIONS● Chairman&CEO’sOfficeandPresident’sOffice(includingLegalDivisionandHRDivision)
Planning and implementation of corporate strategy and internal controls; planning and
implementation of public affairs management and services; planning and implementation of
industrial safety and environmental protection; legal affairs administration; and planning and
management of document control.
● R&D Center
Patent deployment planning; product technology R&D, implementation of mass production,
problem feedback and analysis, design improvement and development, technology design and
development of project products, and development of EPD system products.
●Operation Center
Planning and implementation of process analysis and production management, procurement
planning and implementation of raw materials, equipment and projects; raw material demand
planning; bonded product and logistics management; quality and reliability assurance of raw
materials and products; management and implementation of production plans; planning and
implementation of process analysis and production management of in-process products.
● Finance Center
Finance, accounting, IT planning and new IT Implementation, planning and implementation of
business administration.
● Strategy Integration Center
New product verification, product management and planning, and implementation of the
product management platforms of all business units.
● Project Center
Discussion of requirements and contents of the sales kit for individual customers with PM
personnel; communication with outsourced market survey companies; defining the market survey
direction for business operations and product strategies; cost and yield rate control after new
product development.
● Corp. Mkt. Center
Planning and implementation of corporate marketing and public relations affairs.
Company Organization
Board of Directors
Chairman & CEO
President
LCD BUCE BU ESI BU MD BU China Branch
Japan Branch
America Sales Division
Remuneration Committee
Audit Committee
AuditorOffice
Legal Div.
HR Div.
Corp. Mkt. Center
R&D Center
Finance Center
Operation Center
Strategy Integration Center
Project Center
2014.12.31

16
● CE BU
E-reader sales; problem solving and analysis of customer projects; discussion of technical documents; production and submission of samples
for confirmation; preparation and provision of jig BD tests.
● LCD BU
LCD sales; customer and business cultivation, operation, and supervision; support of mass production verification and product development for
customers.
● ESI BU
R&D, design, manufacture, and sale of ESL, smart card, and industrial products.
●MD BU
Contact and cultivation of new and current accounts and potential customers, SF.com, and resolving quality anomalies.
MANAGEMENT TEAM
TITLE / OFFICE NAME On-board Date (Note)
Chairman & CEO Frank Ko 02-12-2013
President Johnson Lee 01-03-2008
Chief R&D Center C. C. Tsai 01-08-2014
Vice President (R&D Center) James Hong 15-03-2010
Vice President (R&D Center) Yung-Sheng Chang 01-02-1996
Vice President (Audit office) Mico Yu 06-02-2012
Assistant Vice President (Operating Center) Mano Lo 09-12-2013
Assistant Vice President (Product Development Div.) Tung-Liang Lin 25-05-1995
Assistant Vice President (Oversea Project) Jason Lin 07-10-2009
Assistant Vice President (Oversea Project) Luke Chen 01-10-2010
Assistant Vice President (Finance Center) Lloyd Chen 15-01-2010
Assistant Vice President (CE BU) Jeff Chang 07-06-2011
Lead Of Accounting (Finance Center) Jason CC Lin 26-03-2012
Note: On-board date means the official date joining EIH.

17
1. Chairman & CEO / Frank Ko
2. President / Johnson Lee
3. Chief R&D Center / CC Tsai
12 3
DIRECTORS AND SUPERVISORS
TITLE NAME Date Elected
Chairman & CEO Representatives of YFY Inc.Frank Ko
18-06-2014
Director Representatives of Aidatek Electorics Inc.Johnson Lee
18-06-2014
Director Representatives of Aidatek Electorics Inc.Shou-Chung Ho
18-06-2014
Director Representatives of Aidatek Electorics Inc.Felix Ho
18-06-2014
Director Representatives of YFY Inc. Chuang-Chuang Tsai
18-06-2014
Director Representatives of YFY Inc.Ching-Yuan Chang
18-06-2014
Independent Director Ten-Chung Chen 18-06-2014
Independent Director Biing-Seng Wu 18-06-2014
Independent Director Chao-Tung Wen 18-06-2014

18
Operations OverviewREVIEW OF OPERATIONS

19
BUSINESS DESCRIPTION
Main Business
E Ink Holdings’ main business is the research, development, manufacture and sale of electronic
displays using thin film transistors systems, and all processes associated with TFTs, particularly
electronic paper displays (ePaper display, EPD), and the Thin Film Transistor Liquid Crystal Displays
(TFT-LCD).
Sales from display product sales accounted for 91.18% of company revenue in 2014, with ESL and
other products accounting for 8.82% of revenue.
Main Products
E Ink Holdings has two main product categories. One category is ePaper display products which
are mainly used for eReaders, electronic shelf labels (ESL), mobile phones, and watches. The second
category is small and medium size TFT-LCD panels and modules under 12.1 inches. Main usages for
TFT-LCDs are for niche market applications, such as vehicles and entertainment systems, ship and
air navigation, security monitoring systems, medical instruments, video phones, cameras, portable
DVDs, digital photo frames, pachinko, industrial instruments and POS.
New Product Development
E Ink Holdings is focusing on four main areas of R&D:
(1) Development of new EPD and TFT-LCD modules aimed at meeting customer requirements in
existing markets and required to expand into new market applications.
(2) Product development for special market applications such as industrial, marine, and automotive
displays.
(3) Development of new manufacturing processes and use of new materials to improve the features
of existing products to satisfy market trends and enhance product competitiveness.
(4) Strengthening of international cooperation in manufacturing, resources and technology to
develop a new generation of low-cost, low-power display technologies in order to lay the basis
for sustainable development.
E Ink Holdings will continue to supply new products to customers in the existing market, and will
use integrated marketing, design and manufacturing capabilities to develop technologies to enter
new markets.
E Ink Holdings is committed to provide on-site technology services in major markets, such
as America, China, Japan and Europe. This enables us to provide a higher level of customer
satisfaction by responding more effectively and quickly and to assist customers in developing new
applications. This also allows E Ink to evaluate market requirements across regions and develop new
product solutions through keen observation, innovative strategic thinking, and suitable product
developments.
Operations Overview

20
Upstream
Equipment Material Components
1. Lithography / etching 2. PECVD 3. Sputter 4. LCD equipments 5. Assembly equipments 6. Inspection / testing equipments
1. Liquid crystal 2. Glass substrate 3. Polarizer 4. Chemical material used in production
1. Driver IC 2. Control PCB 3. Backlight module 4. TAB / COG
MidstreamTFT-LCD production
Production of substrate glass array Cell or panel production Module assembling
Downstream
Consumer applications
Computer Consumer device Commercial Industrial CommunicationAutomotive
transportation
Source: IT IS Project, ERSO and the Economy and Trading Center, ITRI
INDUSTRY OVERVIEW
Electronic Paper Display (EPD) Industry
Electronic paper was developed in the early 1970s. The basic electrophoretic technology, now known as electronic ink, was established at the
Massachusetts Institute of Technology in 1969 when tackling the dying particle condensation problem with “micro capsulation technology”.
E Ink Corporation was founded in 1997 to commercialize electrophoretic ink. After several years of R&D, sample development and small scale
production, electronic paper technology entered mass production in 2008.
As thin as ordinary paper and with a wide viewing angle, the electronic paper display (EPD) is extremely energy saving and bistable and can be
viewed under strong light. Applications successfully developed with the EPD include e-readers, smart cards, electronic tags, clocks, phone button
displays, advertising billboards and a diverse range of applications. In addition to e-readers, the potential of other EPD applications has won
increasing market recognition. For example, the continuous growth of electronic shelf labels has led to the gradual acceptance of European and
US retailers. As electronic shelf labels can correspond to the Internet of Things (IoT) in the long run, their future growth is promising. Other EPD
applications include the SONY Digital Paper for the e-commerce and education markets, the world’s first mass-produced dual-screen YotaPhone,
the Tomoon smartwatch linking with smartphone apps, the electronic shelf label integrating with system server for real-time price update, the
Navit reader used at hospitals for medical record display, the fashionable Kisai Rorschach and Epson Smart Canvas EPD wristwatches, and the
unique ClockOne home wall clocks.
Thirty-two-inch large-size B/W and color EPDs are basically used for electronic billboards and information walls. Besides replacing LCD and LED
panels, they are also solutions for green display technology. Apart from maintaining technological leadership, expanding patent deployment,
and cultivating the e-paper industry, after integrating the personnel, technology, and resources of EIC and SiPix, our e-paper market deployment
will be more complete. Upon the steady growth in the e-reader market, we will continue our transformation toward the diversification and
development of EPD applications, so as to become the leader of the global EPD industry.
Status and development of the small and medium sized TFT LCD product
Mobile phone panels will continue to drive the growth of small- and medium-sized display market as the functional segmentation between
smartphones and other devices is increasingly unclear. The demand for automotive displays will become the highlight of the display industry.
After automotive displays become a standard feature, demand will increase to drive automotive panel growth. While smartphones have shared
the sales of other small- and medium-sized panels and the sales amount of automotive displays in 2014 increased significantly, the latter has
become the second largest application of small- and medium-sized panels. In addition, high-resolution, wide-angle products will be the focus of
automotive display. Compared to 2013, the shipping quantity in 2014 of panels for mobile phone panels increased by 10%, small- and medium-
sized panels for tablets increased by 7%, and panels for automobile displays increased significantly by 33% to about 87.3 million pieces.
Upstream, Midstream and Downstream Flows in the Industry
For electronic paper display production, E Ink Holdings relies on its own TFT production facilities, but it also outsources manufacturing to G5/
G6 production lines. The electronic paper supply chain is composed of the upstream industry for electronic ink suppliers, midstream industry for
module manufacturers, and the downstream industry for brand owners. E Ink Holdings takes on the role of upstream supplier as well as midstream
manufacturer of panels and modules.

21
Product Development Trends
1. Electronic Paper Display (EPD)
Major e-reader customers launch new models every year, including Amazon, Rakuten, SONY, and Barnes & Noble. The brand new Paperwhite
from Amazon using the E Ink Carta technology was even praised as “the best ever e-Reader in history” by CNN Money. In addition, major e-reader
markets have made aggressive deployment in markets outside of the USA, such as Japan, China, and other emerging markets. For example, after
Rakuten’s aggressive international channel deployment, Kobo e-readers are now available in countries like the Philippines, Italy, India, and Ireland.
Therefore, we will continue to cultivate the e-reader market to maintain our global EPD technology and market leadership.
2. TFT-LCD
Marketing strategies of the global TFT-LCD panel industry are aimed at entering every available application market. Those offered by E Ink Holdings
are targeted at special application markets. See below for competition and development status of these markets:
For consumer electronic products, E Ink Holdings will serve the tablet application as an OEM and keep its own capacity for meeting niche market
demands from specific long term customers. Customers in the niche markets of TFT-LCD closely monitor their suppliers’ capacity in product
development, technical support, customization, and long term cooperation for military instrument panel, car navigation or entertainment system,
ship and aviation navigation or digital display board, security and surveillance systems, medical equipment, and automotive and industrial dashboard.
3. Electronic Shelf Label
Shelf labels made using electronic paper are lightweight and energy saving. These labels provide usability features matching that of ordinary paper,
while allowing users to dynamically update prices from any location in a retail store. Through the use of a computer network, users are able to
accurately update pricing instantaneously. The use of electronic paper labels also corresponds to the trend of goods management automation in
large supermarkets and warehouses. Using electronic paper in labels will reduce the risks of wrong pricing and labeling, allow the store managers
to instantly respond and update the promotion prices right from the floor, and facilitate price tag replacement over the network. In this highly
competitive market, electronic labels effectively cut down the labor cost from manual label management. The use of computer networks for pricing
updates can also reduce the amount of manpower required for manual updates. The ability to quickly update pricing provides brick and mortar
stores to more effectively compete with online retailers by being able to rapidly respond to price changes and different merchandizing techniques
used by online retailers. Bistability, one of the most important characteristics of electronic paper displays, means that electronic paper displays
(EPDs) only consume electricity when reading and writing data. So long as the information on the EPD is unchanged, no energy is consumed. This
helps satisfy the current trend for energy saving and greatly decrease the cost for electronic labels in supermarkets. Additionally, when compared
to other displays, data on EPDs can still be seen at viewing angles that approach 180-degrees, allowing information to be seen further away or at
slanted viewing angles. For example, during the Double 11 Festival (November 11, literally Bachelor’s Day) of China, a leading home electrical chain
needs to finish updating a total of 15 million price tags within three days. In addition to the high error rate and low efficiency of manual work, the
waste of paper price tags will bring a huge environmental impact. With the electronic shelf label, however, they can update all price tags in real time
and more accurately. In order to meet the demand for electronic labels, we have also developed low temperature electronic paper for goods stored
in fridges or freezers as well as black, white and red electronic paper that can be used demarcate special pricing or sales promotions in addition
to conventional black and white labels. In the near future, we will launch low-voltage-operated e-paper for the electronic shelf label. Compared to
the supermarket chains using wireless transmission, this battery-free solution will be more suitable for smaller shops and needs no remodeling or
additional hardware. All it needs is a NFC-supported mobile phone to update shelf label contents at any time.
4. Smart Display Card
The EPD has been used on smart display cards for years, particularly in Europe and the USA, such as the bank OTP card for issuing VISA and MASTER
cards. In addition, Union Pay International of China has voluntarily used the smart display card in recent years. As increasing businesses are joining
the line of issuers, the market potential of smart display cards is promising. As e-paper is bistable, slim, lightweight, and pressure-resistant, by
embedding it in the IC chip of a smart display card, after passing ISO7816 certification, it can be used to display OTP, balance amount, and bonus
points and in consumption, financial, and secure transaction certificates. Therefore, smart display cards have been used on fiscal cards and stored
value tickets for public transport. Examples include the Bank SinoPac’s MII card, the smart stored value ticket of KRTC, I-Pass, and Taiwan Smart
Card. The EPD is also used on the dynamic card verification value (dCVV) of credit cards as an anti-fraud means worldwide. Apart from VISA and
MASTER planning to use the EPD for CVV display, American Express (AMEX) will follow suit. With the continual advancement of EPD technology,
ISO7816-compliant matrix displays will be developed to meet the demand for diversifying smart cards, such as the integrating of discount barcode
reader, public transport tickets, and credit cards, so as to expand the scope of product uses and enhance the market visibility of EPD products.
5. Luggage/Logistic Tag
With its bistability, reflectivity, low energy consumption, wide viewing angle near 180°, sunlight readability, flexibility, and pressure resistance

22
characteristics, the EPD has gradually become the total solution of luggage and logistic tags for European, US, and Japanese air transportation and
logistics industries. Take the air transportation industry for example. As over three billion people are traveling by air across the world, airlines need to
spend billions of dollars to compensate for the luggage loss of passengers each year. Therefore, how to effectively trace luggage and reduce labor,
resource, and paper expenses have become an issue needed urgent solution of the air transportation industry. System solutions can combine EPDs
and wireless transmission technology such as Bluetooth or NFC to transmit and receive the ID code and information of the corresponding flight
and display the passenger and flight information on the tag to ensure luggage traceability. In the logistics industry, as over billions of paper tags
are used every year for logistics, to save labor, resources, and paper consumption and improve the performance of environmental protection, many
logistics companies are figuring out a total solution replacing paper logistics tags with the EPD and combine EPD tags with wireless transmission for
central control and monitoring of cargo delivery status. Given luggage/logistics EPD tags can save paper and resource consumption, reduce labor on
paper tag replacement, and enhance luggage and cargo traceability and tractability to significantly reduce overall travel/logistics time and monetary
cost and thereby speed up travel/logistics, EPDs will become an unavoidable trend in the future of air transportation and logistics industries.
6. Smart Home
The smart home has become a global technology advancement trend! After acquiring NEST at US$3.2 billion (approx. NT$96 billion) last year,
Google immediately initiated the “Works with NEST” program. In the same year, Apple announced the Apple HomeKit to start a cross-industry
(electronics, energy, and security) and cross-brand solution that integrates system electronics and appliances, blends mobile and convenient smart
functions, links with the internet, and saves energy, so as to bring technology to a new level, thereby creating a revolution in modern technology
and modern life.
This new revolution even urges the evolution of traditional home appliances with new technology to make life more convenient, effectively save
energy, and realize life with technology together.
Unlike conventional displays, the EPD is perfect for the new technology trend in modern times for its unique visual feeling, high contrast view, and
unlimited viewing angle to provide an ideal information display for new technology.
EPD’s outstanding bistability characteristic fulfills the energy conservation needs of a smart home. Its near paper visual effect can make viewing
more comfortable at home.
According to Business Insider, the smart home is a fast-growing market with a compound annual growth rate of up to 52%. Its global market
scale will increase from US$6.1 billion (approx. 400 million households) in 2015 to US$4.09 trillion (approx. 1.8 billion households) in 2019. From
the smartphone onward, new technology has changed lifestyles in all aspects. The big data transfer era has come as the network infrastructure
improves. Along with the global concern about energy conservation, all aspects are increasingly popular and mature and conditions are ready.
With its eco-friendly and energy-saving characteristics, the EPD has earned increasing recognition of smart home customers, and we will build new
technology and a new lifestyle for this bustling, new era together with the EPD.
7. Internet of Things (IoT)
The Internet of Things (IoT) was officially proposed in 1999 by the MIT Auto-ID researching RFID applications. Today, over five billion devices,
including mobiles and PCs, are used by over 6.7 billion people across the world. It is estimated that 0.1 trillion devices will be linked together by the
internet within the next decade. This also generates huge business opportunities for the IoT. By 2020 it is expected that the market scale of IoT will
fall between US$0.15 trillion and US$ 0.2 trillion. Therefore, every business is preparing to make a share from this market.
For its bistability and energy-saving characteristics, the EPD provides the best solution for power unavailability or high power-consumption
applications and creates opportunities for cultivating brand new business models under the existing internet framework among businesses. For
example, this year Finnish coffee company Paulig launched its Muki mug which uses the thermoelectric effect to obtain adequate electricity to
power an EPD, and the Muki is more than just an ordinary coffee mug. With a smartphone app and wireless transfer, users can display a personal
photo on the coffee mug. In addition to innovation, there lies a potential business model and new form of data collection that can bring more
to owners and consumers. In addition, Aichi Prefecture Hospital in Japan launched the e-registration service last summer with the IoT. Besides
keeping track off their own registration information, patients can receive information regarding promotional activities of nearby stores through the
wireless network and sensors. Apart from enhancing medical consultation satisfaction, the hospital increased income from non-medical practice.
Thanks to the energy-saving EPD, the problem of charging thousands of registration cards at the same time was solved, and system realization
was completed.
We believe that as relevant industry chains and technologies mature, including wireless charging, NFC, (optoelectric) thermoelectric conversion, and
energy harvesting technologies, and service platforms popularize, and along with the bistability and energy saving characteristics of EPD, more new
applications (such as smart home and luggage/logistics tags) and new business models will be created. Apart from the ubiquity of IoT, the EPD can

23
be ubiquitous as well to create more business opportunities on the market and make human life more convenient.
8. Mobile Device
With advantages in power-saving, full viewing angle, sunlight readability and easy-on-eyes, the potential of EPD has received high market
recognition.
The emerging wearable market keeps drawing attention from consumers all of the world. The continual technology improvement has enabled
EPD into wider application such as mobile phones, activity trackers, healthcare and gaming devices by providing innovative features and new user
experience. Leading companies including Apple, Samsung, Sony, Lenovo and Yota have launched various products in mobile phones, tablets, smart
watches, activity trackers by connecting healthcare, internet community, real-time communication and smart functions to provide new use-cases
and values. By exploring EPD’s growing potential, we have launched new generation Yotaphone2 and Sony Smartband Talk, and both products
have received favorable reviews from both industry and consumers.
Competition and Positioning
In terms of EPD products, as mass production already began in 2005, we are already ahead of competitors in production technology, product yield
rate, and new technology development (such as flexible EPDs and color EPDs). In the e-reader market, our products have commanded over 95% of
the market, with key accounts including Amazon and KOBO. In addition, we have successfully launched the dual-screen YotaPhone with Yota. With
a first-class R&D team, we have absolute competitive strength in technology R&D and product development in the future.
In terms of TFT-LCD products, with years of field experience, we are capable of providing customers with special application products and custom
products. As there are different kinds of similar products of small volume, powerful integration, design, and development capabilities are required.
After years of cultivation, we have already developed excellent competitive strengths in these fields.
RESEARCH AND DEVELOPMENT OVERVIEW
In 2014 we continued to develop EPD-related products and technologies. Besides unremittingly optimized B/W EPD modules, we began aggressive
commoditization of color EPDs by applying them to electronic labels, soft EPDs, flexible EPDs, and touch EPDs, and our new products received great
market feedback. In addition, we expanded capacity to secure leadership in the EPD market. In TFT-LCD products, we continued to the R&D of
various touch technologies, fringe-field switching (FFS) technology, and high-standard displays (military grade/automobile grade). By fulfilling the
special product needs of niche customers, we could maintain sustained and leading development in the extremely competitive display industry. In
2014 and Q1 2015, we invested consolidated R&D expenses of about NT$1.75 billion and NT$364 million in relevant R&D projects.
Electronic Ink Technology
E Ink CartaTM is the newest generation of mass produced electronic ink products, and has the highest surface reflection to date with a 50%
improvement in contrast ratio and 22% improvement in reflection when compared with the last generation of E Ink products. Texts and images are
displayed in a crisp and detailed manner, allowing users to peruse the contents as comfortably as they would reading off printed paper.
Carta is lightweight, environmentally friendly, and may be comfortably read for extended periods of time, making it suitable for eReaders, digital
dictionaries, reference books, magazines and other future products to replace printed paper. Carta allows readers to enjoy the convenience of
digital products without sacrificing the comfort provided by printed materials.
Color Electronic Paper - E Ink TritonTM
Electronic paper displays are not limited to black and white with gray scale. E Ink’s Triton display merges all the benefits found in the black and
white product with a color filter array to offers a color EPD product with 4096 colors and 16 levels of gray scale. Triton EPD can support the color
requirements for graphs, maps, photos, comics, and advertisements. In addition, the use of touch and pen input allows color EPD products to
meet consumers’ needs for browsing web pages, clicking menu items, making notations, and viewing simple animations. Triton also has market
applications for large area signage and industrial applications. To improve the contrast of Triton displays, E Ink Holdings also offers a front light
option.

24
Three-color E Ink technology
E Ink SpectraTM is the newest generation of mass produced multi-colored E Ink product. In addition to black and white color pigments, Spectra
includes an additional red color pigment that makes it suitable for electronic labels and advertising panels. Retailers can easily make use of electronic
labels to accurately replace product pricing and draw the attention of potential customers. Electronic labels with red backgrounds can draw
consumer attention to achieve sales objectives and greatly improve product marketability.
Flexible electronic paper
Features of plastic-based soft EPDs are almost unbreakable, much lighter and much thinner than glass-based versions. Therefore, they are
exceptionally important to large-sized EPD modules. Currently, plastic-based soft EPDs are mostly used on mobile devices and consumer electronics.
Plastic-based TFTs allow the end product to be substantially lighter and thinner than products using glass-based TFTs. Glass-based TFTs can be
fragile while plastic-based TFTs can result in a more rugged end product with less breakage in the electronics due to drops or stress tension.We
have developed flexible electronic paper, E Ink MobiusTM, that has similar applications to glass backed electronic paper for mobile devices and
consumer electronics.
The weight savings with plastic TFTs can make a significant difference in an end products’ specifications: a product with a 10.7” LCD-baseddisplay
weighs an average of 1.44 pounds; a product with an 11.4” E Ink display with a plastic TFT and similar internal components can weigh only 17
ounces. As product designers consider utilizing larger displays for eTextbooks and eNewspapers, this weight savings can allow for larger devices to
be held easily in one hand and will make a big difference in the weight of a student’s backpack.
E Ink Holdings is now providing flexible electronic paper display modules to a leading brand for development of a large size electronic reader
product. E Ink Holdings is now working extensively with multinational companies in plastic backed flexible electronic paper displays and modules
for the development and mass production of larger electronic readers. Since its release, E Ink is now working closely with several renowned
multinational companies to develop and manufacture plastic-backed Mobius electronic paper display modules, and this product has been received
with overwhelming responses in the market.
Flexible EPDs
Our flexible EPDs are designed upon organic TFTs with flexible base technology by integrating with the flip-chip technology and the stress of plastic
materials. Based on these features, we developed full-plastic EPDs that are light, shatter-resistant, almost unbreakable, and easy to carry to fulfill
the demand for lightness and shatter-proof. Currently our flexible EPDs are mainly used on consumer electronics and mobile devices, and mass
production has begun.
Touchable Electronic Paper Display
In addition to commonly adopted capacitive touch control technology, E Ink Holdings is actively working with other technology companies to
develop e-touch for electronic paper displays. These new modules not only maintain the visual benefits of EPD but also offer many other design
benefits to facilitate more possibilities in new product developments. E Ink Holdings continues to fund research and development in this area.
Super High Resolution EPD products
Although resolution at 150-200ppi (pixel per inch) is good enough for general e-readers, a higher resolution at 300+ppi is always demanded
for advanced, special applications, such as “paperless offices”. Thus we launched the super-high resolution B/W EDP modules at 300ppi in two
sizes, 9.7 inch and 11.5 inch in 2011, for customers to start terminal product design-in. Furthermore in 2014, we completed and started the mass
production of the 6-inch model for users to read in greater detail and more comfortably.
Front light EPDs
Reading comfortably in dim environments is always a requisite of e-books. Apart from making comfortable reading in dim environments a reality
for consumers to enjoy more the convenience of e-reader technology, our new front-light EPDs have further diversified the application of EPDs.
Fringe Field Switching (FFS) technology
FFS offers the widest viewing angle available currently for LCD technologies. Its bright and wide viewing angle characteristics are made possible
by rotating the interior electrode surface of almost uniformly aligned liquid crystal molecules with boundary electric fields. It combines features of
horizontal and vertical wide viewing angles to offer up to 180 degrees viewing angle. Reflection components in the array create a bright display
even under strong ambient lighting. This makes our FFS technology a perfect combination of low power consumption, high transmittance rate,
high brightness, fast response, and high color reproduction. FFS LCDs are now the main display panels for smartphones. FFS is currently used in
smartphones, tablets, and automotive electronics. With continuous improvements, it may be adopted in the industrial applications as well.
25
BUSINESS DEVELOPMENT OBJECTIVES
Short-Term Business Development Objectives
1. Follow product trends to provide customers with upgraded new products, support customers during their product design life cycle, effectively
share initial development costs, and diversify the applications using E Ink displays.
2. Improve product quality for adoption and acceptance by more leading global companies.
3. Enhance manufacturing yield and production capacity at panel and module plants.
4. Establish local support services for the United States, Europe, China and Japan, and strengthen distribution channels in these markets.
5. Continue to penetrate new application markets.
Long-Term Business Development Objectives
1. Seek international cooperation to develop advanced display technologies and associated applications. Continued development and improvement
of advanced technology to ensure E Ink’s leading role in the technology supply chain.
2. Develop long term and effective marketing channels for smooth interactions between production and technology units to effectively support
overall and individual growth and to create win-win developments.
3. Maintain a leading position in product development.
Market and Sales Overview
Electronic Paper Display Market Analysis
The market for ePaper displays is growing beyond eReaders. ePaper displays have been used in product other than eReaders for long time. E Ink
began a focused effort in diversifying into different markets starting in 2013. Where we saw some growth in 2013, we have seen even bigger
adoption in 2014. E Ink used to be recognized as the company that made eReaders possible. It is now recognized as the company that makes
many different products possible. The special properties of low power, readability, lightweight and ruggedness are driving the expansion of ePaper
displays into many different markets. The market portfolio is becoming very diversified with many major products now using ePaper displays to
deliver unique features to the customer.
eReader Applications
The market for eReader continues to be a strong and stable. There is no longer a debate about whether tablets were going to replace ePaper
eReaders. This position is supported by activities by our customers and market surveys. E Ink’s major customers continued to launch new eReader
products in 2014.
The strength of the eReader market is supported by market data as well. Recent surveys from the Pew Research center show that the eReader is
still the most popular form for Americans to read eBooks. eReader ownership amongst Americans is also increasing. One-third of adults now own
an eReader.
E Ink continues to be optimistic about the eReader market going into 2015 with the market size expected to continue to be in the range of 12-15
million units are reported by market research firms such as IHS.
Electronic Shelf Labels Applications
Building on the success in the eReader market, E Ink products are also seeing success in other markets as well. The Electronic Shelf Label (ESL)
market is one application where we continued to see significant growth in 2104 and expect this to continue into 2015 where we are expecting to
again see 100% growth over 2014.
Only a small part of the retail market has adopted ESL tags with most retail stores still using paper. This is changing and the adoption is expected
to accelerate. The largest adoption is presently happening in Europe followed by Asia and then North America. The driving reasons behind this
adoption is partly due to regulations on pricing accuracy and also as retailers try to remain more competitive versus online retailers which change
prices quickly to react to different market conditions. With ESL tags, retailers can guarantee pricing accuracy and can also quickly change prices to
match online prices.

26
Other Markets
Starting in 2013, E Ink started a program focused on diversifying into many other markets besides eReaders. In 2014 we continued to show the
positive results of that effort with numerous design wins using E Ink displays in products in markets never thought of before.
E Ink displays are in products from markets such Smartphones, wearable technology, medical, travel industry and digital signage.
Other Markets: Mobile
The smartphone market is one area that can become quite large for E Ink. The first product in this market has received and continues to receive a
lot of attention from the market and the media. The YotaPhone from Yota Devices has been labeled as the biggest innovation in the mobile phone
market since the introduction of the iPhone. The first generation YotaPhone went into production in 2013 with availability in 5 markets in Eastern
and Western Europe. Yota announced the second generation YotaPhone at the Mobile World Congress in February 2014 and continues to get the
same level of attention. Yotaphone 2 is now in production and is expanding into markets around the world and they announced their first entry
into the North American Market starting in mid-2015.
Other Markets: Transportation
E Ink continued to get new design wins 2014 with such new products as the Electronic Luggage Tag announced by Vanguard ID, which is presently
being evaluated by the different airline companies. The luggage tags would replace the paper tags now in use and would enable the airlines to
track passenger’s luggage in an effort to eliminate lost luggage.
Other Markets: Heath and Fitness
E Ink displays are also used in the newest glucose meter from a major global pharmaceutical company. The device was released in Europe in 2013
Q4 and will be distributed worldwide in 2014. The health and medical device markets are two markets that market analysts HIS and other market
research firms agree have major growth potential going forward. This is terms of both number of devices and the total dollar value of the market.
Other Markets: Large Area Signage
A market that E Ink just started exploring is also showing some early signs of adoption. E Ink displays are ideal for large area signs because they are
extremely low power, very light weight and readable under bright lights. There is a lot of interest in using E Ink displays for large information signs.
A great example of this is the information display sign that was installed in the North Delegate Lounge in the United Nations building in New York
City. The sign is made up of 231 separate displays and is about 6 meters long by 1 meter tall. This is a market that has very large potential because
it includes information kiosks, information signage, billboards, and many more. This is a market that is just starting to develop for E Ink and we
expect to see greater progress in 2015 through 2016.
Other Markets: Summary
E Ink’s efforts to diversify the business are producing results. The design wins so far are expected to generate order volume in 2014 and future
years. More important, by diversifying the application market it reduces the risk of the business to any changes in one specific market and set the
foundation for growth going forward.
E Ink is no longer viewed as just the company that provides displays for eReaders. It is recognized as the world leader there. But now it is also
recognized as providing displays to many more applications. This is clear from the analysis of the sales leads coming into E Ink. As is shown by the
chart below, E Ink now receives leads distributed across many different industries.
Mobile Device 10%Other 35%
Indoor Signage 9%
Shelf Labels 8%
Information Display/Kiosk 8%
Watches & Clocks 6%Health & Medical Device 4%
Outdoor Signage 5%Home Automation System 5%
eReader 5%Outdoor Information Display 5%
Areas of interest and applications for potential customers of E Ink Holdings.
27
Small and medium size TFT LCD monitor market
E Ink Hydis LCD division refocused in 2013 to become more efficient and profitable. Hydis has a number of patents that protect the Fast Fringe
Field (FFS) technology used in many high end LCDs. Hydis refocused its product strategy to address primarily the small and medium sized TFT LCD
market. Specifically to focus on market applications such as medical, automotive and marine where the margins are highest and the FFS technology
is a clear value.
Competitiveness
E Ink is in a unique competitive position with its products and technology. It has a very strong customer portfolio in electrophoretic displays. In
addition, licensing position regarding our FFS technology also puts E Ink in a unique position where we can benefit from the LCD market without
having to invest significant capital in LCD manufacturing facilities. The FFS LCD display provide wide angle viewing, lower power consumption and
better sunlight readability compared to other LCDs. E Ink also understands the markets for our customer products. It continues to develop display
products to better meet our customer needs and rapidly introduce those products to market.
Factors for and against development and coping strategies
(1) Favorable factors
A. In terms of the technical perspective, we have acquired E Ink Corporation in 2009, and SiPix Technologies in 2012, allowing E Ink Holdings
to secure patent protection for electrophoretic EPD technologies. We have further integrated upstream and midstream supply chain elements
for EPD products to reduce cost and maintain our leading position in the industry.
B. For EPD product business strategies, in addition to our focus on eReaders, electronic shelf labels, we have also began to concentrate on
developing other product applications that include mobile devices, wearables, and medical applications.
(2) Unfavorable factors and coping strategies
A. The market for eReaders is under competitive pressure from tablets, which may further restrict shipping volume and profitability for E Ink
Holdings products.
Response: work with customer from other fields to develop EPDs for different applications and expand the market for EPDs.
B. Various display manufacturers have begun producing small- and medium-sized displays. Market supply has grown, which would strain the
market prices for E Ink Holdings products.
Response: E Ink Holdings has abandoned the cost competition approach. Instead, we choose to develop niche markets to maintain gross
margins and FFS licensing as our main strategies.

28
E Ink Holdings Inc.
Financial report

29
Financial Statements for theYears Ended December 31, 2014 and 2013 andIndependent Auditors’ Report
CONTENTS
30 INDEPENDENT AUDITORS' REPORT
31 BALANCE SHEETS
33 STATEMENTS OF COMPREHENSIVE INCOME
34 STATEMENTS OF CHANGES IN EQUITY
36 STATEMENTS OF CASH FLOWS
Financial report

30
INDEPENDENT AUDITORS’ REPORT
The Board of Directors and the Shareholders
E Ink Holdings Inc.
We have audited the accompanying balance sheets of E Ink Holdings Inc. (the “Corporation”) as of December 31, 2014 and 2013, and the
related statements of comprehensive income, changes in equity and cash flows for the years ended December 31, 2014 and 2013. These
financial statements are the responsibility of the Corporation’s management. Our responsibility is to express an opinion on these financial
statements based on our audits. We did not audit the financial statements of BOE Mobile Display Technology Co., Ltd., as of December 31,
2013, the investments in which the Corporation had equity-method investments by Hydis Technologies Co., Ltd. The investments amounted to
NT$175,316 thousand as of December 31, 2013, which accounted for about 0.4% of the Corporation’s total assets as of the above date. The
Corporation’s equity of NT$12,577 thousand in their comprehensive income in 2013 were about 1.1% of the Corporation’s total comprehensive
income. The investee’s financial statements were audited by other auditors whose reports have been furnished to us, and, our opinion, insofar as
it relates to the amounts included for the investee, is based solely on the reports of the other auditors.
We conducted our audits in accordance with the Regulations Governing Auditing and Attestation of Financial Statements by Certified Public
Accountants and auditing standards generally accepted in the Republic of China. Those rules and standards require that we plan and perform
the audit to obtain reasonable assurance about whether the financial statements are free of material misstatement. An audit includes examining,
on a test basis, evidence supporting the amounts and disclosures in the financial statements. An audit also includes assessing the accounting
principles used and significant estimates made by management, as well as evaluating the overall financial statement presentation. We believe
that our audits and the reports of the other auditors provide a reasonable basis for our opinion.
In our opinion, based on our audits and the reports of the other auditors, the financial statements referred to above present fairly, in all material
respects, the financial position of E Ink Holdings Inc. as of December 31, 2014 and 2013, and the financial performance and its cash flows for
the years ended December 31, 2014 and 2013, in conformity with the Guidelines Governing the Preparation of Financial Reports by Securities
Issuers.
March 13, 2015
Notice to Readers
The accompanying financial statements are intended only to present the financial position, financial performance and cash flows in accordance
with accounting principles and practices generally accepted in the Republic of China and not those of any other jurisdictions. The standards,
procedures and practices to audit such financial statements are those generally accepted and applied in the Republic of China.
For the convenience of readers, the independent auditors’ report and the accompanying financial statements have been translated into English
from the original Chinese version prepared and used in the Republic of China. If there is any conflict between the English version and the original
Chinese version or any difference in the interpretation of the two versions, the Chinese-language independent auditors’ report and financial
statements shall prevail.

31
E INK HOLDINGS INC.
BALANCE SHEETSDECEMBER 31, 2014 AND 2013
(In Thousands of New Taiwan Dollars)
ASSETS2014 2013
Amount % Amount %
CURRENT ASSETSCash and cash equivalents (Notes 4 and 6) $ 791,496 2 $ 1,767,590 4Financial assets at fair value through profit or loss (Notes 4 and 7) 58,813 - 1,498,361 4Debt investments with no active market (Notes 4 and 9) 600,000 2 - -Accounts receivable (Note 4) 402,446 1 205,661 -Accounts receivable from related parties (Notes 4 and 23) 2,996,556 8 7,108,474 17Other receivables from related parties (Note 23) 1,925,469 5 825,473 2Inventories (Notes 4 and 10) 962,025 3 1,434,873 3Prepayments 81,527 - 84,267 -Other current assets (Notes 4, 17 and 24) 87,976 - 75,049 -
Total current assets 7,906,308 21 12,999,748 30
NON-CURRENT ASSETSAvailable-for-sale financial assets (Note 4 ) 851,785 2 766,310 2Financial assets measured at cost (Notes 4 and 8) 22,305 - 77,601 -Debt investments with no active market (Notes 4 and 9) 600,000 2 - -Investments accounted for using equity method (Notes 4 and 11) 26,692,398 69 26,453,736 62Property, plant and equipment (Notes 4, 12 and 23) 1,994,224 5 2,064,620 5Other intangible assets (Note 4 ) 106,479 - 45,038 -Deferred tax assets (Notes 4 and 17) 338,397 1 209,144 1Other non-current assets 28,323 - 44,333 -
Total non-current assets 30,633,911 79 29,660,782 70
TOTAL $ 38,540,219 100 $ 42,660,530 100
LIABILITIES AND STOCKHOLDERS’ EQUITYCURRENT LIABILITIES
Short-term borrowings (Note 13) $ 1,132,325 3 $ 149,025 1Accounts payable 513,658 1 1,257,374 3Accounts payable to related parties (Note 23) 5,505,527 14 9,045,728 21Other payables (Note 20) 490,729 1 412,017 1Other payable to related parties (Notes 20 and 23) 61,147 - - -Current tax liabilities (Notes 4 and 17) 81,850 - 32,429 -Receipts in advance (Note 23) 132,531 1 248,031 1Current portion of long-term borrowings (Note 13) 2,089,715 6 1,780,629 4Other current liabilities (Note 23) 32,107 - 32,072 -
Total current liabilities 10,039,589 26 12,957,305 31
NON-CURRENT LIABILITIESLong-term borrowings (Note 13) 1,812,857 5 3,870,943 9Other non-current liabilities (Notes 4, 11, 14, 17 and 23) 54,247 - 63,195 -
Total non-current liabilities 1,867,104 5 3,934,138 9
Total liabilities 11,906,693 31 16,891,443 40
(Continued)
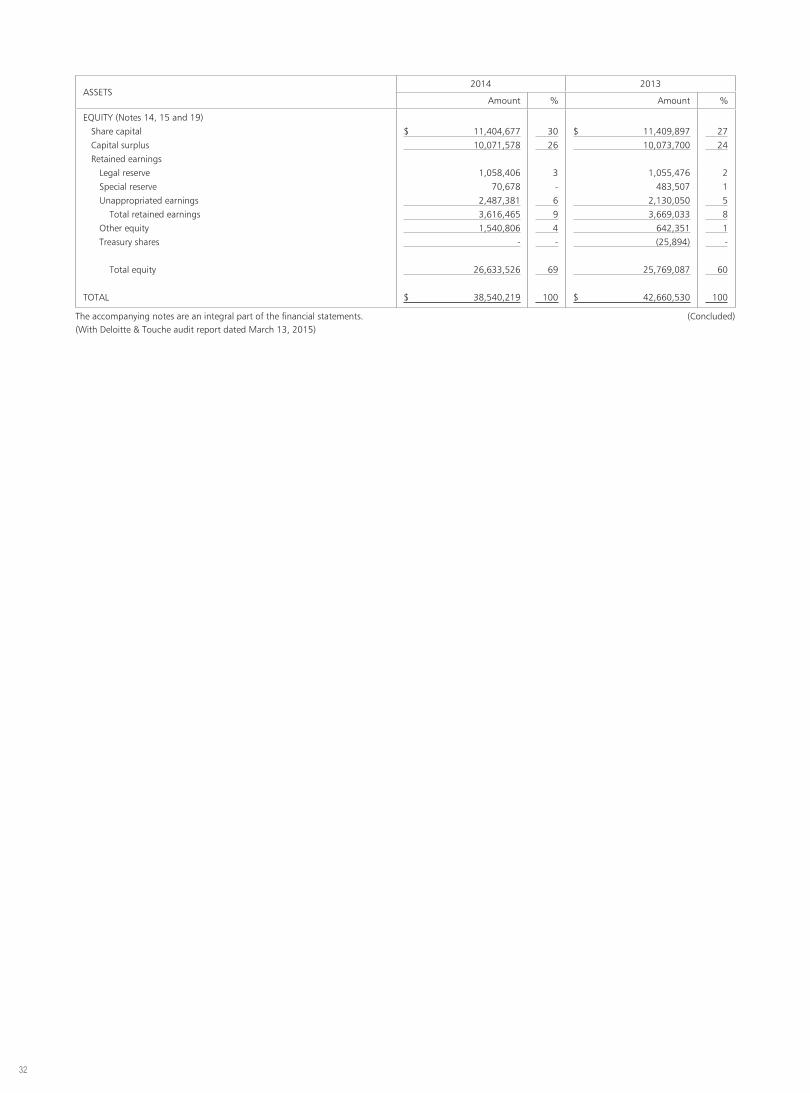
32
ASSETS2014 2013
Amount % Amount %
EQUITY (Notes 14, 15 and 19)Share capital $ 11,404,677 30 $ 11,409,897 27Capital surplus 10,071,578 26 10,073,700 24Retained earnings
Legal reserve 1,058,406 3 1,055,476 2Special reserve 70,678 - 483,507 1Unappropriated earnings 2,487,381 6 2,130,050 5
Total retained earnings 3,616,465 9 3,669,033 8Other equity 1,540,806 4 642,351 1Treasury shares - - (25,894) -
Total equity 26,633,526 69 25,769,087 60
TOTAL $ 38,540,219 100 $ 42,660,530 100
The accompanying notes are an integral part of the financial statements. (Concluded)(With Deloitte & Touche audit report dated March 13, 2015)

33
E INK HOLDINGS INC.
STATEMENTS OF COMPREHENSIVE INCOMEFOR THE YEARS ENDED DECEMBER 31, 2014 AND 2013
(In Thousands of New Taiwan Dollars, Except Earnings Per Share)
2014 2013
Amount % Amount %
OPERATING REVENUE (Notes 4 and 23) $ 12,461,581 100 $ 14,427,628 100
OPERATING COSTS (Notes 10, 14, 16 and 23) 11,542,526 93 13,133,743 91
GROSS PROFIT 919,055 7 1,293,885 9
OPERATING EXPENSES (Notes 14, 16 and 23)Selling and marketing expenses 154,728 1 121,963 1General and administrative expenses 702,895 6 589,765 4Research and development expenses 548,338 4 522,855 4
Total operating expenses 1,405,961 11 1,234,583 9
INCOME (LOSS) FROM OPERATIONS (486,906) (4) 59,302 -
NON-OPERATING INCOME AND EXPENSESInterest income (Notes 4 and 23) 29,115 - 35,116 -Royalty income (Notes 4 and 23) 30,716 - 30,716 -Other income (Note 4) 36,984 - 95,592 1Interest expense (Note 12) (105,267) (1) (98,912) (1)Share of profit or loss of subsidiaries and associates 443,162 4 (175,617) (1)Net gain on foreign currency exchange - - 38,803 -Net gain on fair value change of financial assets at fair value through
profit or loss 60,452 1 67,211 1Net loss on foreign currency exchange (30,971) - - -Impairment loss (Notes 4, 5, 8 and 11) (5,296) - (9,322) -
Total non-operating income and expenses 458,895 4 (16,413) -
INCOME (LOSS) BEFORE INCOME TAX (28,011) - 42,889 -
INCOME TAX BENEFIT (EXPENSE) (Notes 4 and 17) 41,487 - (13,586) -
NET INCOME FOR THE YEAR 13,476 - 29,303 -
OTHER COMPREHENSIVE INCOMEUnrealized gain on available-for-sale financial assets 9,805 - 151,866 1Actuarial loss arising from defined benefit plans (Notes 4 and 14) (14,159) - (10,449) -Share of other comprehensive income of subsidiaries 941,398 8 987,944 7Income tax relating to components of other comprehensive income
(Notes 4, 14 and 17) 2,407 - 1,776 -
Other comprehensive income for the year, net of income tax 939,451 8 1,131,137 8
TOTAL COMPREHENSIVE INCOME FOR THE YEAR $ 952,927 8 $ 1,160,440 8
EARNINGS PER SHARE (Note 18)Basic $ 0.01 $ 0.03
The accompanying notes are an integral part of the financial statements.(With Deloitte & Touche audit report dated March 13, 2015)

34
E INK HOLDINGS INC.
STATEMENTS OF CHANGES IN EQUITYFOR THE YEARS ENDED DECEMBER 31, 2014 AND 2013
(In Thousands of New Taiwan Dollars)
Share Capital
Capital Surplus
Retained Earnings Other Equity
Treasury Shares Total EquityShares (In Thousands)
Amount Legal Reserve Special ReserveUnappropriated
Earnings
Exchange Differences on Translating Foreign
Operations
Unrealized Gain (Loss) on Available-for- sale
Financial Assets
BALANCE AT JANUARY 1, 2013 1,080,990 $ 10,809,897 $ 9,686,700 $ 1,055,476 $ 271,435 $ 2,528,246 $ (559,205) $ 75,698 $ (25,894) $ 23,842,353
Special reserve under Rule No. 1010012865 issued by the FSC - - - - 70,678 (70,678) - - - -
Special reserve - - - - 141,394 (141,394) - - - -
Net income for the year ended December 31, 2013 - - - - - 29,303 - - - 29,303
Other comprehensive income for the year ended
December 31, 2013, net of income tax - - - - - 5,279 620,774 505,084 - 1,131,137
Total comprehensive income for the year ended December 31, 2013 - - - - - 34,582 620,774 505,084 - 1,160,440
Private issuance of ordinary shares for cash - July 60,000 600,000 387,000 - - - - - - 987,000
Change in equity from investments in associates
accounted for by using equity method - - - - - (25,705) - - - (25,705)
Partial acquisition of interests in subsidiaries - - - - - (195,001) - - - (195,001)
BALANCE AT DECEMBER 31, 2013 1,140,990 11,409,897 10,073,700 1,055,476 483,507 2,130,050 61,569 580,782 (25,894) 25,769,087
Legal reserve - - - 2,930 - (2,930) - - - -
Reversal of special reserve - - - - (412,829) 412,829 - - - -
Net income for the year ended December 31, 2014 - - - - - 13,476 - - - 13,476
Other comprehensive income for the year ended December 31, 2014, net of income tax - - - - - 40,996 1,020,437 (121,982) - 939,451
Total comprehensive income for the year ended December 31, 2014 - - - - - 54,472 1,020,437 (121,982) - 952,927
Retirement of treasury stock (522) (5,220) (4,346) - - (16,328) - - 25,894 -
Partial acquisition of interests in subsidiaries - - 2,224 - - (90,712) - - - (88,488)
BALANCE AT DECEMBER 31, 2014 1,140,468 $ 11,404,677 $ 10,071,578 $ 1,058,406 $ 70,678 $ 2,487,381 $ 1,082,006 $ 458,800 $ - $ 26,633,526
The accompanying notes are an integral part of the financial statements.(With Deloitte & Touche audit report dated March 13, 2015)

35
E INK HOLDINGS INC.
STATEMENTS OF CHANGES IN EQUITYFOR THE YEARS ENDED DECEMBER 31, 2014 AND 2013
(In Thousands of New Taiwan Dollars)
Share Capital
Capital Surplus
Retained Earnings Other Equity
Treasury Shares Total EquityShares (In Thousands)
Amount Legal Reserve Special ReserveUnappropriated
Earnings
Exchange Differences on Translating Foreign
Operations
Unrealized Gain (Loss) on Available-for- sale
Financial Assets
BALANCE AT JANUARY 1, 2013 1,080,990 $ 10,809,897 $ 9,686,700 $ 1,055,476 $ 271,435 $ 2,528,246 $ (559,205) $ 75,698 $ (25,894) $ 23,842,353
Special reserve under Rule No. 1010012865 issued by the FSC - - - - 70,678 (70,678) - - - -
Special reserve - - - - 141,394 (141,394) - - - -
Net income for the year ended December 31, 2013 - - - - - 29,303 - - - 29,303
Other comprehensive income for the year ended
December 31, 2013, net of income tax - - - - - 5,279 620,774 505,084 - 1,131,137
Total comprehensive income for the year ended December 31, 2013 - - - - - 34,582 620,774 505,084 - 1,160,440
Private issuance of ordinary shares for cash - July 60,000 600,000 387,000 - - - - - - 987,000
Change in equity from investments in associates
accounted for by using equity method - - - - - (25,705) - - - (25,705)
Partial acquisition of interests in subsidiaries - - - - - (195,001) - - - (195,001)
BALANCE AT DECEMBER 31, 2013 1,140,990 11,409,897 10,073,700 1,055,476 483,507 2,130,050 61,569 580,782 (25,894) 25,769,087
Legal reserve - - - 2,930 - (2,930) - - - -
Reversal of special reserve - - - - (412,829) 412,829 - - - -
Net income for the year ended December 31, 2014 - - - - - 13,476 - - - 13,476
Other comprehensive income for the year ended December 31, 2014, net of income tax - - - - - 40,996 1,020,437 (121,982) - 939,451
Total comprehensive income for the year ended December 31, 2014 - - - - - 54,472 1,020,437 (121,982) - 952,927
Retirement of treasury stock (522) (5,220) (4,346) - - (16,328) - - 25,894 -
Partial acquisition of interests in subsidiaries - - 2,224 - - (90,712) - - - (88,488)
BALANCE AT DECEMBER 31, 2014 1,140,468 $ 11,404,677 $ 10,071,578 $ 1,058,406 $ 70,678 $ 2,487,381 $ 1,082,006 $ 458,800 $ - $ 26,633,526
The accompanying notes are an integral part of the financial statements.(With Deloitte & Touche audit report dated March 13, 2015)

36
E INK HOLDINGS INC.
STATEMENTS OF CASH FLOWS FOR THE YEARS ENDED DECEMBER 31, 2014 AND 2013
(In Thousands of New Taiwan Dollars)
2014 2013
CASH FLOWS FROM OPERATING ACTIVITIESIncome (loss) before income tax $ (28,011) $ 42,889Adjustments for:
Depreciation expenses 267,555 257,580Amortization expenses 34,248 33,744Net gain on fair value change of financial assets at fair value through profit or loss (60,452) (67,211)Interest expense 105,267 98,912Interest income (29,115) (35,116)Dividend income (18,976) (16,639)Share of profit or loss of subsidiaries and associates (443,162) 175,617Net gain on disposal of property, plant and equipment (2,946) -Net gain on disposal of investments (359) -Impairment loss recognized on financial assets 5,296 -Impairment loss recognized on non-financial assets - 9,322Write-down of inventories 312,000 77,000Unrealized net loss on foreign currency exchange 122,977 80,359Royalty income (30,716) (30,716)
Changes in operating assets and liabilitiesAccounts receivable (188,803) 209,299Accounts receivable from related parties 4,172,964 406,482Inventories 160,848 (829,514)Prepayments 2,740 (32,106)Other current assets (722) (31,077)Accounts payable (745,670) (1,246,661)Accounts payable to related parties (3,702,396) (943,015)Other payables 60,412 (61,942)Receipts in advance (115,500) 200,969Other current liabilities (4,812) 16,176
Cash used in operations (127,333) (1,685,648)Income tax paid (27,341) (203,992)
Net cash used in operating activities (154,674) (1,889,640)
CASH FLOWS FROM INVESTING ACTIVITIESProceeds on sale of financial assets at fair value through profit or loss 1,500,000 -Purchase of available-for-sale financial assets (28,120) -Proceeds on sale of available-for-sale financial assets 2,809 -Purchase of debt investments with no active market (1,500,000) -Proceeds on sale of debt investments with no active market - 885,720Proceeds from redemption of debt investments with no active market 300,000 -Payments for property, plant and equipment (121,576) (823,913)Proceeds from disposal of property, plant and equipment 3,592 -Decrease in other receivables from related parties 797,240 1,234,133Payments for intangible assets (80,046) (22,888)Decrease (increase) in other non-current assets 367 (1,953)Interest received 18,371 34,989Dividend received 51,040 33,368
Net cash generated from investing activities 943,677 1,339,456
(Continued)

37
2014 2013
CASH FLOWS FROM FINANCING ACTIVITIESIncrease (decrease) in short-term borrowings $ 982,015 $ (1,242,000)Proceeds from long-term borrowings - 1,200,000Repayments of long-term borrowings (1,769,542) (1,769,542)Increase in other payables to related parties 444 -Increase (decrease) in other non-current liabilities 1,712 (2)Proceeds from issuance of ordinary shares - 987,000Payments for acquisition of interests in subsidiaries (873,908) (7,024)Interest paid (105,818) (106,303)
Net cash used in financing activities (1,765,097) (937,871)
NET DECREASE IN CASH AND CASH EQUIVALENTS (976,094) (1,488,055)
CASH AND CASH EQUIVALENTS AT THE BEGINNING OF THE YEAR 1,767,590 3,255,645
CASH AND CASH EQUIVALENTS AT THE END OF THE YEAR $ 791,496 $ 1,767,590
The accompanying notes are an integral part of the financial statements. (Concluded)(With Deloitte & Touche audit report dated March 13, 2015)

38
E Ink Holdings Inc. and SubsidiariesConsolidated Financial Statements for the Years Ended December 31, 2014 and 2013 andIndependent Auditors’ Report
CONTENTS
39 INDEPENDENT AUDITORS' REPORT
40 CONSOLIDATED BALANCE SHEETS
42 CONSOLIDATED STATEMENTS OF COMPREHENSIVE INCOME
44 CONSOLIDATED STATEMENTS OF CHANGES IN EQUITY
46 CONSOLIDATED STATEMENTS OF CASH FLOWS

39
INDEPENDENT AUDITORS’ REPORT
The Board of Directors and the Shareholders
E Ink Holdings Inc.
We have audited the accompanying consolidated balance sheets of E Ink Holdings Inc. and subsidiaries (the “Corporation”) as of December
31, 2014 and 2013, and the related consolidated statements of comprehensive income, changes in equity and cash flows for the years
ended December 31, 2014 and 2013. These consolidated financial statements are the responsibility of the Corporation’s management. Our
responsibility is to express an opinion on these consolidated financial statements based on our audits. We did not audit the financial statements
of BOE Mobile Display Technology Co., Ltd., as of December 31, 2013. The investments amounted to NT$175,316 thousand as of December 31,
2013, which accounted for about 0.4% of the Corporation’s total assets as of the above date. The Corporation’s equity of NT$12,577 thousand
in their comprehensive income in 2013 were about 1.2% of the Corporation’s total comprehensive income. The investee’s financial statements
were audited by other auditors whose reports have been furnished to us, and, our opinion, insofar as it relates to the amounts included for the
investee, is based solely on the reports of the other auditors.
We conducted our audits in accordance with the Regulations Governing Auditing and Attestation of Financial Statements by Certified Public
Accountants and auditing standards generally accepted in the Republic of China. Those rules and standards require that we plan and perform the
audit to obtain reasonable assurance about whether the consolidated financial statements are free of material misstatement. An audit includes
examining, on a test basis, evidence supporting the amounts and disclosures in the consolidated financial statements. An audit also includes
assessing the accounting principles used and significant estimates made by management, as well as evaluating the overall consolidated financial
statement presentation. We believe that our audits and the reports of the other auditors provide a reasonable basis for our opinion.
In our opinion, based on our audits and the reports of the other auditors, the consolidated financial statements referred to above present fairly,
in all material respects, the consolidated financial position of E Ink Holdings Inc. and subsidiaries as of December 31, 2014 and 2013, and the
consolidated financial performance and their consolidated cash flows for the years ended December 31, 2014 and 2013, in conformity with the
Guidelines Governing the Preparation of Financial Reports by Securities Issuers, the International Financial Reporting Standards, International
Accounting Standards, interpretations as well as related guidance translated by Accounting Research and Development Foundation endorsed by
the Financial Supervisory Commission of the Republic of China.
We have also audited the parent company only financial statements of E Ink Holdings Inc. as of and for the years ended December 31, 2014 and
2013 on which we have issued an unqualified and a modified unqualified opinion, respectively.
March 13, 2015
Notice to Readers
The accompanying consolidated financial statements are intended only to present the consolidated financial position, financial performance
and cash flows in accordance with accounting principles and practices generally accepted in the Republic of China and not those of any other
jurisdictions. The standards, procedures and practices to audit such consolidated financial statements are those generally accepted and applied in
the Republic of China.
For the convenience of readers, the independent auditors’ report and the accompanying consolidated financial statements have been translated
into English from the original Chinese version prepared and used in the Republic of China. If there is any conflict between the English version and
the original Chinese version or any difference in the interpretation of the two versions, the Chinese-language independent auditors’ report and
consolidated financial statements shall prevail.

40
E INK HOLDINGS INC. AND SUBSIDIARIES
CONSOLIDATED BALANCE SHEETSDECEMBER 31, 2014 AND 2013
(In Thousands of New Taiwan Dollars)
ASSETS2014 2013
Amount % Amount %
CURRENT ASSETSCash and cash equivalents (Notes 4 and 6) $ 8,124,294 21 $ 4,664,263 12Financial assets at fair value through profit or loss (Notes 4, 7 and 28) 173,358 - 1,586,260 4Debt investments with no active market (Notes 4 and 10) 600,000 2 - -Notes and accounts receivable (Notes 4 and 11) 2,391,938 6 3,499,785 9Accounts receivable from related parties (Notes 4 and 27) 64,162 - 27,776 -Other receivables (Notes 4 and 9) 1,397,268 4 191,023 -Current tax assets (Notes 4 and 20) 637,923 2 131,833 -Inventories (Notes 4 and 12) 1,989,398 5 3,197,831 8Prepayments 305,555 1 306,778 1Other current assets (Note 28) 198,357 - 610,895 1
Total current assets 15,882,253 41 14,216,444 35
NON-CURRENT ASSETSFinancial assets at fair value through profit or loss (Notes 4 and 7) 282,799 1 259,929 1Available-for-sale financial assets (Notes 4 and 8) 2,043,268 5 2,044,551 5Financial assets measured at cost (Notes 4 and 9) 125,924 - 2,833,107 7Debt investments with no active market (Notes 4 and 10) 600,000 1 - -Investments accounted for using equity method (Notes 4 and 9) 49,745 - 237,271 1Property, plant and equipment (Notes 4 and 13) 9,041,082 23 9,835,142 24Goodwill (Notes 4 and 14) 6,858,206 18 6,761,078 17Other intangible assets (Notes 4 and 14) 2,817,788 7 3,036,726 8Deferred tax assets (Notes 4 and 20) 1,023,992 3 604,725 1Other non-current assets (Notes 27 and 28) 228,795 1 256,122 1
Total non-current assets 23,071,599 59 25,868,651 65
TOTAL $ 38,953,852 100 $ 40,085,095 100
LIABILITIES AND EQUITYCURRENT LIABILITIES
Short-term borrowings (Note 15) $ 1,796,975 5 $ 894,150 2Accounts payable 1,508,379 4 2,478,235 6Accounts payable to related parties (Note 27) 38,106 - 66,420 -Other payables (Note 16) 1,272,817 3 1,416,847 4Current tax liabilities (Notes 4 and 20) 112,455 - 38,074 -Receipts in advance 878,721 2 992,165 3Current portion of long-term borrowings (Note 15) 2,894,548 7 2,419,308 6Current portion of long-term payables to related parties (Notes 15 and 27) - - 118,171 -Other current liabilities 610,823 2 138,201 -
Total current liabilities 9,112,824 23 8,561,571 21
NON-CURRENT LIABILITIESLong-term borrowings (Note 15) 2,566,020 7 4,877,848 12Long-term payables to related parties (Notes 15 and 27) - - 452,360 1Accrued pension liabilities (Notes 4 and 17) 422,643 1 397,056 1Other non-current liabilities (Notes 4, 15 and 20) 339,363 1 244,145 1
Total non-current liabilities 3,328,026 9 5,971,409 15
Total liabilities 12,440,850 32 14,532,980 36
(Continued)

41
ASSETS2014 2013
Amount % Amount %
EQUITY ATTRIBUTABLE TO OWNERS OF THE CORPORATION (Notes 17, 18, 22 and 23)Share capital $ 11,404,677 29 $ 11,409,897 28Capital surplus 10,071,578 26 10,073,700 25Retained earnings
Legal reserve 1,058,406 3 1,055,476 3Special reserve 70,678 - 483,507 1Unappropriated earnings 2,487,381 6 2,130,050 5
Total retained earnings 3,616,465 9 3,669,033 9Other equity 1,540,806 4 642,351 2Treasury shares - - (25,894) -
Total equity attributable to owners of the Corporation 26,633,526 68 25,769,087 64
NON-CONTROLLING INTERESTS (Notes 18 and 23) (120,524) - (216,972) -
Total equity 26,513,002 68 25,552,115 64
TOTAL $ 38,953,852 100 $ 40,085,095 100
The accompanying notes are an integral part of the consolidated financial statements. (Concluded)(With Deloitte & Touche audit report dated March 13, 2015)

42
E INK HOLDINGS INC. AND SUBSIDIARIES
CONSOLIDATED STATEMENTS OF COMPREHENSIVE INCOMEFOR THE YEARS ENDED DECEMBER 31, 2014 AND 2013
(In Thousands of New Taiwan Dollars, Except Earnings Per Share)
2014 2013
Amount % Amount %
OPERATING REVENUE (Notes 4 and 27) $ 14,571,205 100 $ 18,905,129 100
OPERATING COSTS (Notes 12, 17, 19 and 27) 13,000,451 89 15,886,448 84
GROSS PROFIT 1,570,754 11 3,018,681 16
OPERATING EXPENSES (Notes 17, 19 and 27)Selling and marketing expenses 576,458 4 453,723 3General and administrative expenses 2,482,941 17 2,641,962 14Research and development expenses 1,746,266 12 1,571,313 8
Total operating expenses 4,805,665 33 4,666,998 25
LOSS FROM OPERATIONS (3,234,911) (22) (1,648,317) (9)
NON-OPERATING INCOME AND EXPENSESInterest income (Note 4) 148,145 1 152,255 1Royalty income (Note 4) 3,561,145 24 1,610,262 9Dividend income (Notes 4 and 27) 86,019 1 62,161 -Other income (Note 27) 244,618 2 255,609 1Interest expense (Note 13) (153,031) (1) (176,668) (1)Net gain on foreign currency exchange 76,927 - 142,446 1Loss on disposal of investments (Note 9) (892,569) (6) - -Impairment loss (Notes 4, 5, 9, 13 and 14) (120,389) (1) (59,212) -Other expenses (Note 17) (37,709) - (550,026) (3)
Total non-operating income and expenses 2,913,156 20 1,436,827 8
LOSS BEFORE INCOME TAX (321,755) (2) (211,490) (1)
INCOME TAX BENEFIT (Notes 4 and 20) 375,964 2 175,481 1
NET INCOME (LOSS) FOR THE YEAR 54,209 - (36,009) -
OTHER COMPREHENSIVE INCOMEExchange differences on translating foreign operations 1,014,257 7 607,206 3Unrealized gain (loss) on available-for-sale financial assets (121,982) (1) 505,084 3Actuarial gain arising from defined benefit plans (Notes 4 and 17) 41,523 1 8,405 -Share of other comprehensive loss of associates (1,931) - (4,588) -Income tax relating to components of other comprehensive income
(Notes 4, 17 and 20) 2,407 - 1,776 -
Other comprehensive income for the year, net of income tax 934,274 7 1,117,883 6
(Continued)

43
2014 2013
Amount % Amount %
TOTAL COMPREHENSIVE INCOME FOR THE YEAR $ 988,483 7 $ 1,081,874 6
NET INCOME (LOSS) ATTRIBUTABLE TO:Owners of the Corporation $ 13,476 - $29,303 -Non-controlling interests 40,733 - (65,312) -
$ 54,209 - $ (36,009) -
TOTAL COMPREHENSIVE INCOME (LOSS) ATTRIBUTABLE TO:Owners of the Corporation $ 952,927 7 $ 1,160,440 6Non-controlling interests 35,556 - (78,566) -
$ 988,483 7 $ 1,081,874 6
EARNINGS PER SHARE (Note 21)Basic $ 0.01 $ 0.03
The accompanying notes are an integral part of the consolidated financial statements. (Concluded)(With Deloitte & Touche audit report dated March 13, 2015)

44
E INK HOLDINGS INC. AND SUBSIDIARIES
CONSOLIDATED STATEMENTS OF CHANGES IN EQUITYFOR THE YEARS ENDED DECEMBER 31, 2014 AND 2013
(In Thousands of New Taiwan Dollars)
Equity Attributable to Owners of the Corporation
Non-controllingInterests
Total EquityShare Capital
Capital Surplus
Retained Earnings Other Equity
Treasury Shares TotalShares(In Thousands)
Amount Legal Reserve Special ReserveUnappropriated
Earnings
Exchange Differences on Translating Foreign
Operations
Unrealized Gain (Loss) on Available-for-sale
Financial Assets
BALANCE AT JANUARY 1, 2013 1,080,990 $ 10,809,897 $ 9,686,700 $ 1,055,476 $ 271,435 $ 2,528,246 $ (559,205) $ 75,698 $ (25,894) $ 23,842,353 $ (59,709) $ 23,782,644
Special reserve under Rule No. 1010012865 issued by the FSC - - - - 70,678 (70,678) - - - - - -
Special reserve - - - - 141,394 (141,394) - - - - - -
Net income (loss) for the year ended December 31, 2013 - - - - - 29,303 - - - 29,303 (65,312) (36,009)
Other comprehensive income (loss) for the year endedDecember 31, 2013, net of income tax - - - - - 5,279 620,774 505,084 - 1,131,137 (13,254) 1,117,883
Total comprehensive income (loss) for the year endedDecember 31, 2013 - - - - - 34,582 620,774 505,084 - 1,160,440 (78,566) 1,081,874
Private issuance of ordinary shares for cash - July 60,000 600,000 387,000 - - - - - - 987,000 - 987,000
Change in equity from investments in associates accounted for by using equity method - - - - - (25,705) - - - (25,705) - (25,705)
Partial acquisition of interests in subsidiaries - - - - - (195,001) - - - (195,001) (78,697) (273,698)
BALANCE AT DECEMBER 31, 2013 1,140,990 11,409,897 10,073,700 1,055,476 483,507 2,130,050 61,569 580,782 (25,894) 25,769,087 (216,972) 25,552,115
Legal reserve - - - 2,930 - (2,930) - - - - - -
Reversal of special reserve - - - - (412,829) 412,829 - - - - - -
Net income for the year ended December 31, 2014 - - - - - 13,476 - - - 13,476 40,733 54,209
Other comprehensive income (loss) for the year endedDecember 31, 2014, net of income tax - - - - - 40,996 1,020,437 (121,982) - 939,451 (5,177) 934,274
Total comprehensive income for the year ended December 31,2014 - - - - - 54,472 1,020,437 (121,982) - 952,927 35,556 988,483
Retirement of treasury stock (522) (5,220) (4,346) - - (16,328) - - 25,894 - - -
Partial acquisition of interests in subsidiaries - - 2,224 - - (90,712) - - - (88,488) 60,892 (27,596)
BALANCE AT DECEMBER 31, 2014 1,140,468 $ 11,404,677 $ 10,071,578 $ 1,058,406 $ 70,678 $ 2,487,381 $ 1,082,006 $ 458,800 $ - $ 26,633,526 $ (120,524) $ 26,513,002
The accompanying notes are an integral part of the consolidated financial statements.(With Deloitte & Touche audit report dated March 13, 2015)

45
E INK HOLDINGS INC. AND SUBSIDIARIES
CONSOLIDATED STATEMENTS OF CHANGES IN EQUITYFOR THE YEARS ENDED DECEMBER 31, 2014 AND 2013
(In Thousands of New Taiwan Dollars)
Equity Attributable to Owners of the Corporation
Non-controllingInterests
Total EquityShare Capital
Capital Surplus
Retained Earnings Other Equity
Treasury Shares TotalShares(In Thousands)
Amount Legal Reserve Special ReserveUnappropriated
Earnings
Exchange Differences on Translating Foreign
Operations
Unrealized Gain (Loss) on Available-for-sale
Financial Assets
BALANCE AT JANUARY 1, 2013 1,080,990 $ 10,809,897 $ 9,686,700 $ 1,055,476 $ 271,435 $ 2,528,246 $ (559,205) $ 75,698 $ (25,894) $ 23,842,353 $ (59,709) $ 23,782,644
Special reserve under Rule No. 1010012865 issued by the FSC - - - - 70,678 (70,678) - - - - - -
Special reserve - - - - 141,394 (141,394) - - - - - -
Net income (loss) for the year ended December 31, 2013 - - - - - 29,303 - - - 29,303 (65,312) (36,009)
Other comprehensive income (loss) for the year endedDecember 31, 2013, net of income tax - - - - - 5,279 620,774 505,084 - 1,131,137 (13,254) 1,117,883
Total comprehensive income (loss) for the year endedDecember 31, 2013 - - - - - 34,582 620,774 505,084 - 1,160,440 (78,566) 1,081,874
Private issuance of ordinary shares for cash - July 60,000 600,000 387,000 - - - - - - 987,000 - 987,000
Change in equity from investments in associates accounted for by using equity method - - - - - (25,705) - - - (25,705) - (25,705)
Partial acquisition of interests in subsidiaries - - - - - (195,001) - - - (195,001) (78,697) (273,698)
BALANCE AT DECEMBER 31, 2013 1,140,990 11,409,897 10,073,700 1,055,476 483,507 2,130,050 61,569 580,782 (25,894) 25,769,087 (216,972) 25,552,115
Legal reserve - - - 2,930 - (2,930) - - - - - -
Reversal of special reserve - - - - (412,829) 412,829 - - - - - -
Net income for the year ended December 31, 2014 - - - - - 13,476 - - - 13,476 40,733 54,209
Other comprehensive income (loss) for the year endedDecember 31, 2014, net of income tax - - - - - 40,996 1,020,437 (121,982) - 939,451 (5,177) 934,274
Total comprehensive income for the year ended December 31,2014 - - - - - 54,472 1,020,437 (121,982) - 952,927 35,556 988,483
Retirement of treasury stock (522) (5,220) (4,346) - - (16,328) - - 25,894 - - -
Partial acquisition of interests in subsidiaries - - 2,224 - - (90,712) - - - (88,488) 60,892 (27,596)
BALANCE AT DECEMBER 31, 2014 1,140,468 $ 11,404,677 $ 10,071,578 $ 1,058,406 $ 70,678 $ 2,487,381 $ 1,082,006 $ 458,800 $ - $ 26,633,526 $ (120,524) $ 26,513,002
The accompanying notes are an integral part of the consolidated financial statements.(With Deloitte & Touche audit report dated March 13, 2015)

46
E INK HOLDINGS INC. AND SUBSIDIARIES
CONSOLIDATED STATEMENTS OF CASH FLOWSFOR THE YEARS ENDED DECEMBER 31, 2014 AND 2013
(In Thousands of New Taiwan Dollars)
2014 2013
CASH FLOWS FROM OPERATING ACTIVITIESLoss before income tax $ (321,755) $ (211,490)Adjustments for:
Depreciation expenses 1,529,110 1,597,401Amortization expenses 433,575 460,916Impairment loss recognized (reversal of impairment loss) on notes and accounts
receivable 1,773 (10,063)Net gain on fair value change of financial assets at fair value through profit or loss (67,472) (69,337)Interest expense 153,031 176,668Interest income (148,145) (152,255)Dividend income (86,019) (62,161)Share of profit or loss of associates 9,998 (1,105)Net loss (gain) on disposal of property, plant and equipment (248) 13,428Net loss (gain) on disposal of investments 892,569 (10,312)Impairment loss recognized on financial assets 5,296 -Impairment loss recognized on non-financial assets 115,093 59,212Write-down (reversal) of inventories 373,095 (779,069)Unrealized net loss on foreign currency exchange 108,250 27,317
Changes in operating assets and liabilitiesFinancial assets held for trading (26,000) 81,000Notes and accounts receivable 1,238,140 3,403,086Accounts receivable from related parties (36,386) 15,678Other receivables (100,859) (95,569)Inventories 1,001,440 1,101,181Prepayments 14,167 221,374Other current assets 430,291 223,219Accounts payable (1,011,606) (2,743,718)Accounts payable to related parties (28,314) 42,492Other payables (107,530) (168,102)Receipts in advance (252,914) 258,976Other current liabilities 476,266 6,314Accrued pension liabilities 57,674 (377,044)
Cash generated from operations 4,652,520 3,008,037Income tax paid (451,057) (85,250)
Net cash generated from operating activities 4,201,463 2,922,787
CASH FLOWS FROM INVESTING ACTIVITIESProceeds on sale of financial assets at fair value through profit or loss 1,500,000 -Purchase of available-for-sale financial assets (67,729) -Proceeds on sale of available-for-sale financial assets 3,440 -Purchase of debt investments with no active market (1,500,000) -Proceeds from redemption of debt investments with no active market 300,000 -Proceeds on sale of financial assets measured at cost 849,182 -Proceeds on sale of associates 84,918 -Payments for acquisition of associates - (4,302)Payments for property, plant and equipment (552,611) (1,095,298)Proceeds from disposal of property, plant and equipment 9,911 15,946
(Continued)

47
2014 2013
Payments for intangible assets $ (131,224) $ (32,273)Decrease in other financial assets - 45,752Decrease in other non-current assets 19,662 38,737Interest received 129,901 154,262Dividend received 86,019 62,161
Net cash generated from (used in) investing activities 731,469 (815,015)
CASH FLOWS FROM FINANCING ACTIVITIESIncrease (decrease) in short-term borrowings 862,078 (3,012,590)Repayments of bonds payable - (624,938)Proceeds from long-term borrowings - 1,200,000Repayments of long-term borrowings (2,556,966) (2,617,975)Increase (decrease) in other non-current liabilities 70,616 (43,164)Proceeds from issuance of ordinary shares - 987,000Interest paid (146,074) (197,834)Changes in non-controlling interests (27,596) (168,769)
Net cash used in financing activities (1,797,942) (4,478,270)
EFFECTS OF EXCHANGE RATE CHANGES ON THE BALANCE OF CASH AND CASH EQUIVALENTS HELD IN FOREIGN CURRENCIES 325,041 144,399
NET INCREASE (DECREASE) IN CASH AND CASH EQUIVALENTS 3,460,031 (2,226,099)
CASH AND CASH EQUIVALENTS AT THE BEGINNING OF THE YEAR 4,664,263 6,890,362
CASH AND CASH EQUIVALENTS AT THE END OF THE YEAR $ 8,124,294 $ 4,664,263
The accompanying notes are an integral part of the consolidated financial statements. (Concluded)(With Deloitte & Touche audit report dated March 13, 2015)

E INK
HO
LDIN
GS IN
C. 2
01
4 A
nn
ua
l Rep
ort
No.3, Lixing 1st Rd., Hsinchu Science Park, Hsinchu 300, Taiwan Tel: 886 3 5643200 Fax: 886 3 5788339 http://www.einkgroup.com
E INK HOLDINGS INC. 2014 Annual Report
• EIH: 8069• Taiwan Stock Exchang Market Observation Post System: http://mops.twse.com.tw • EIH annual report is available at http://www.einkgroup.com • Printed on April 11, 2015
Copyrights of some images used in this report belong to Amazon、Kobo、Sony、Vikaura、Visionect and Yota Devices. "JoAn" is a registered trademark of Visionect. " Kindle Paperwhite " is a registered trademark of Amazon.com, Inc. "Kobo Aura HD" is a registered trademark of Rakuten Kobo Inc. "SmartBand Talk" is a registered trademark of Sony. "Vikaura" is a registered trademark of Vikaura. "YotaPhone" is a registered trademark of Yota Devices.