e-journal of tourism
TRANSCRIPT


ii
E-Journal of Tourism
p-ISSN 2541-0857, e-ISSN 2407-392X Volume 07, Nomor 01, March 2020
EDITOR IN CHIEF
Prof. Dr. I Komang Gde Bendesa, M.A.D.E.
EDITORIAL BOARD
Prof. Dr. I Wayan Ardika, M.A. Prof. Dr. Ir. Made
Antara, MS Prof. Dr. Made Budiarsa, MA.
Prof. Dr. I Nyoman Darma Putra, M.Litt.
Ir. A.A.P. Agung Suryawan Wiranatha, MSc., PhD.
MANAGING EDITOR
Dr. Ir. I Gusti Ayu Oka Suryawardani, M.Mgt., PhD.
PEER REVIEWERS
Prof. Dr. Terry de Lacy Dr. Myra Gunawan
Prof. Geoffrey Lipman Prof. Christine Petr
Prof. Patrick Legoherel
PUBLISHED BY
Program Studi Doktor Pariwisata
In Collaboration With
Pusat Unggulan Pariwisata
Universitas Udayana
ADDRESS
Gedung Pascasarjana Universitas Udayana Lantai II (R2.8)
Jalan P.B. Sudirman Denpasar Bali 80232
Telepon Faksimile: (0361) 9604270 081237771041
Email: [email protected]; [email protected]
Website: https: ojs.unud.ac.id index.php eot
iii
Table of Contents
Farmers’ Capacity for Jatiluwih Agrotourism Management and Its Effects on Tourists’
Satisfaction and Intention to Revisit
Tien Cathy Patricia, I Gusti Ayu Oka Suryawardani, I Ketut Suamba
and Agung Suryawan Wiranatha ~ 1 - 15
The Roles of Farmers in the Development of Belimbing Village Agrotourism
and Its Effect on Satisfaction and Loyalty of Tourists
Ni Nyoman Widari, I Gusti Ayu Oka Suryawardani , I Ketut Rantau and Agung Suryawan Wiranatha ~ 16 - 26
Millennial Tourists in Bali: Motivation, Satisfaction and Revisit Intention
Dewa Ayu Nyoman Aridayanti, I Gusti Ayu Oka Suryawardani
and Agung Suryawan Wiranatha ~ 27 - 36
The Economic Impact of Man-Made Tourism Development Towards Local Community in Kota
Batu East Java (Case Study: Pasar Parkiran Jatim Park I)
Tomi Agfianto, A Faidlal Rahman ~ 37 - 54
Sport Tourism Event of Tour De Singkarak to Support Destination Management in West
Sumatera, Indonesia
Bet El Silisna, Retnaningtyas Susanti ~ 55 - 72
Eco-Marine-Tourism Development Towards The Renewal of Coastal Communities in Gerokgak District, Bali
Cening Kardi, I Wayan Wiasta ~ 73 - 87
Coffee Tourism: from Home Products to Attractions
Vincent Leewellyn, Santi Palupi ~ 88 - 100
Spatial-Based Management of Van den Bosch Fortress to Revitalize Historical Assets and Develop Unique Cultural Tourism
Rara Sugiarti, Warto Warto, Supariadi Supariadi ~ 101-113

iv
Loyalty of Green Tourist : Mediating Role of Satisfaction
Nining Yuniati, Sony Heru Priyanto, Lieli Suharti, Linda Kusuma ~ 114-125
Analysis of Perceived Factors Affecting Tourist Satisfaction in Mountain Tourism: A Study
in Mount Papandayan, Indonesia
Afina Putri Vindiana, Santi Novani, Lidia Mayangsari, Dini Turipanam Alamanda ~ 126-137
Who Are The Tourists?
Christine PETR ~ 138-156
Analysis of Suitability and Carrying Capacity of Mangrove Ecotourism in Sedari Village,
Karawang District
Wildan Dhya Ulhaq Hidayat, Indah Riyantini, Wahyuniar Pamungkas ~
157-167
Digital Surveillance of Health and Safety Hazards at Tourist Attractions in Bali: First
Preliminary Evidence
I Md Ady Wirawan, Wayan Citra Wulan Sucipta Putri, Ngurah Agus Sanjaya ER, Made Agus Hendrayana, Ni Made Dian Kurniasari, Ketut Hari Mulyawan ~ 157-167
E-Journal of Tourism Vol.7. No.1. (2020): 27-36
http://ojs.unud.ac.id/index.php/eot 27 e-ISSN: 2407-392X. p-ISSN: 2541-0857
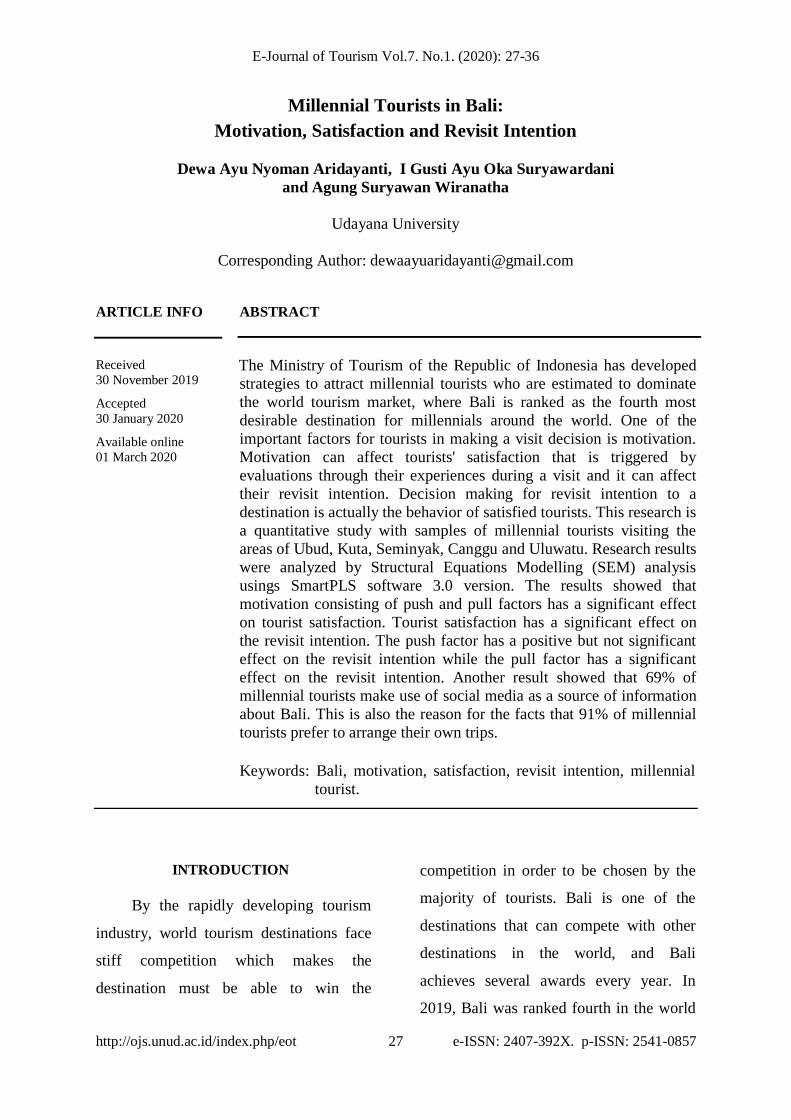
Millennial Tourists in Bali:
Motivation, Satisfaction and Revisit Intention
Dewa Ayu Nyoman Aridayanti, I Gusti Ayu Oka Suryawardani
and Agung Suryawan Wiranatha
Udayana University
Corresponding Author: [email protected]
ARTICLE INFO
Received
30 November 2019
Accepted
30 January 2020
Available online
01 March 2020
ABSTRACT
The Ministry of Tourism of the Republic of Indonesia has developed
strategies to attract millennial tourists who are estimated to dominate
the world tourism market, where Bali is ranked as the fourth most
desirable destination for millennials around the world. One of the
important factors for tourists in making a visit decision is motivation.
Motivation can affect tourists' satisfaction that is triggered by
evaluations through their experiences during a visit and it can affect
their revisit intention. Decision making for revisit intention to a
destination is actually the behavior of satisfied tourists. This research is
a quantitative study with samples of millennial tourists visiting the
areas of Ubud, Kuta, Seminyak, Canggu and Uluwatu. Research results
were analyzed by Structural Equations Modelling (SEM) analysis
usings SmartPLS software 3.0 version. The results showed that
motivation consisting of push and pull factors has a significant effect
on tourist satisfaction. Tourist satisfaction has a significant effect on
the revisit intention. The push factor has a positive but not significant
effect on the revisit intention while the pull factor has a significant
effect on the revisit intention. Another result showed that 69% of
millennial tourists make use of social media as a source of information
about Bali. This is also the reason for the facts that 91% of millennial
tourists prefer to arrange their own trips.
Keywords: Bali, motivation, satisfaction, revisit intention, millennial
tourist.
INTRODUCTION
By the rapidly developing tourism
industry, world tourism destinations face
stiff competition which makes the
destination must be able to win the
competition in order to be chosen by the
majority of tourists. Bali is one of the
destinations that can compete with other
destinations in the world, and Bali
achieves several awards every year. In
2019, Bali was ranked fourth in the world
E-Journal of Tourism Vol.7. No.1. (2020): 27-36
http://ojs.unud.ac.id/index.php/eot 28 e-ISSN: 2407-392X. p-ISSN: 2541-0857
as the most popular destination for
millennial around the world by the Hopper
ticket booking application company. This
list is obtained from the most popular, the
most searched for, and the most monitored
destination data by millennial tourists. In
line with the Republic of Indonesia's
Ministry of Tourism strategies to attract
millennial tourists, Bali's ranking has
opened up opportunities for Indonesia to
target the Millennial Market. Millennial
generation is driving big changes in the
travel industry. Millennials are more likely
to travel than other generations and tend to
be motivated by the desire to adventure
and explore something new. The tour
process begins with the motivation that
plays a role in making decisions about the
destination to be visited. Push and pull
factors in motivation may affect tourist
satisfaction. Motivation triggers every
evaluation that tourists can do about a
destination through their experiences
during their visit. The decision to make a
repeat visit to a destination is a result of
satisfied tourist behavior.
LITERATURE REVIEW
This research reviewed 14 previous
studies as references sourced from national
and international journals that have a
common topic with tourist motivation,
tourist satisfaction, revisit intention and
millennial tourists or travelers. The studies
include (1) The Effect of Travel Motivation
on Satisfaction: The Case of Older Tourist
by Vigolo, et.al (2018); (2) The Effect of
Motivation, Satisfaction and Perceived
Value on Tourist Recommendation by
Huang, et.al (2015); (3) Travel Motives,
Perceptions and Satisfaction of Millennial
Travelers: A Study in the East Coast of Sri
Lanka by Gnanapala, et.al (2017).
Research by Vigolo, et.al (2018)
investigate the effect of tourist travel
motivation on satisfaction; Huang, et.al
(2015) analyze the effect of motivation,
satisfaction and perceived value on tourist
recommendations; and Gnanapala, et.al
(2017) explore travel motivations,
perceptions, satisfaction, and other
behavioral characteristics of millennial
tourists visiting the East Coast of Sri
Lanka.
The research resulted in several
findings including: (1) Vigolo, et.al (2018)
found that motivation influences
satisfaction but varies greatly depending
on the age of the respondent; (2) Huang,
et.al (2015) found that there was an
influence of the three (motivation,
satisfaction and perceived value) on tourist
recommendations. The effect of perceived
value and satisfaction on recommendations
is greater than motivation. Motivation can
be a predictor of recommendations; (3)
Gnanapala, et.al (2017) research findings

E-Journal of Tourism Vol.7. No.1. (2020): 27-36
http://ojs.unud.ac.id/index.php/eot 29 e-ISSN: 2407-392X. p-ISSN: 2541-0857
show that push and pull factors motivate
millennial tourists to visit the remote areas
of Sri Lanka. Whereas tourist satisfaction
is influenced by accommodation,
infrastructure, service quality and tourist
attractions.
This research refers to theories of
tourism, generation, and tourist behavior
and the concepts of motivation,
satisfaction and revisit intention.
RESEARCH METHODS
Research was conducted to analyze
and test causal relationships between
constructs or latent variables. The cause of
causal relationships is called exogenous
latent constructs or variables X which
consists of Push Factors as (X1) and Pull
Factors as (X2), while the constructs that
are affected are called endogenous latent
namely Y variable consisting of Tourist
Satisfaction (Y1) and Revisit Intention
(Y2). To analyze and test the causal
relationship between variables, a partial
least square (PLS) statistical analysis tool
was used, i.e. one of the structural
equation modeling (SEM) statistical
methods or variant-based structural
equation models with smart PLS version
3.0 software.
The research population was
millennial tourists coming to Bali, taken
using cluster random sampling techniques
in the areas of Ubud, Kuta, Seminyak,
Canggu and Uluwatu of 100 millennial
tourists respondents with a quota sampling
of 50 foreign tourists and 50 domestic
tourists. The number of samples is in
accordance with the number of sample
eligibility criteria for a variant-based or
Partial Least Square (PLS) Structural
Equation Modeling (SEM) analysis, which
is a minimum of 30 and a maximum of
100 samples. In addition to using
structural equation modeling (SEM)
analysis with SmartPLS software version
3.0, the research findings were also
analyzed descriptively and qualitatively to
describe the characteristics of respondents,
interpret the SEM analysis results and the
results of hypothesis testing.
In the analysis of PLS-SEM (Partial
Least Square-Structural Equation
Modeling) the validity and reliability tests
were carried out by focusing a few. In the
validity test conducted with convergent
validity criteria with outer loading value>
0.5 and discriminant validity with AVE
value> 0.5. While reliability is indicated
by Cronbach's Alpha value> 0.6 and
composite reliability value> 0.6.
The structural equation model
consists of measurement and structural
models. Measurement model aims to
determine the role of indicators in
reflecting variables, while the structural
model aims to examine the relationship

E-Journal of Tourism Vol.7. No.1. (2020): 27-36
http://ojs.unud.ac.id/index.php/eot 30 e-ISSN: 2407-392X. p-ISSN: 2541-0857
between other variables, both direct and
indirect relationships and total effects.
Later, after analyzing the data a structural
equation model will be generated which
will be evaluated both from the
Measurement model and the Structural
model. Evaluation of the Measurement
model is done to assess the validity and
reliability of the model, while the
structural model or structural model
evaluation is to evaluate the value of R2,
Effect size, and GoF (Goodness of FIT).
RESULTS AND DISCUSSION
Tourist Characteristics
The results show several
characteristics of millennial tourists
coming to Bali, including: 1) 64% of
millennial tourists were dominated by
female tourists; 2) 44% of millennial
tourists came from Europe with allocentric
type; 3) 59% of millennial tourists are
students; 4) 97% of the purpose of visiting
is for a vacation; 5) 50% of visits with
friends; 6) 69% used social media as a
source of information about Bali; 7) 91%
arrange their own visits.
Influence between Variables
Confirmative analysis in this
research is intended to draw inference
related to the influence of push and pull
factors on satisfaction and revisit intention.
Therefore, this research model involves 4
(four) latent variables, namely the push
factor variable is reflected through 6 (six)
indicators, the pull factor variable is
reflected by 5 (five) indicators, the
satisfaction variable is reflected by 6 (six)
indicators and the revisit intention variable
reflected by 5 (five) indicators. The
structural equation model that is
performed after going through the
bootstrapping process can be seen in
Figure 1 below.
1. Measurement model (outer model)
Source: Smart PLS Analysis Output 3.0, 2019.
Figure 1. Structural Output Model
Testing the validity of the research
variables was conducted by convergent
validity and discriminant validity with the
outer loading and AVE criteria> 0.5. The
results of the validity test can be seen in
Table 1.

E-Journal of Tourism Vol.7. No.1. (2020): 27-36
http://ojs.unud.ac.id/index.php/eot 31 e-ISSN: 2407-392X. p-ISSN: 2541-0857
Table 1
Research Variable Validity Test
Results
Variable Indicat
or
Validity
Converg
ent
Discriminant/√A
VE AVE
Push
Factors
PUS1 0.705
0.786 0.617
PUS2 0.860
PUS3 0.831
PUS4 0.641
PUS5 0.740
PUS6 0.905
Pull
Factors
PUL1 0.910
0.858 0.736
PUL2 0.821
PUL3 0.932
PUL4 0.784
PUL5 0.835
Satisfactio
n
SAT1 0.878
0.811
0.722
SAT2 0.885
SAT3 0.889
SAT4 0.786
SAT5 0.721
SAT6 0.923
Revisit
Intention
REV1 0.774
0.850 0.657
REV2 0.781
REV3 0.780
REV4 0.884
REV5 0.828
It can be seen in Table 1 that all
indicators have an outer loading value and
AVE> 0.5 thus, that all indicators are said
to be valid.
Table 2
Research Variability Test Results
Variable
Reliability
Cronbach’s
Alpha
Composite
Reliability
Push Factors 0.878 0.905
Pull Factors 0.909 0.933
Satisfaction 0.921 0.939
Revisit Intention 0.869 0.905
Table 2 shows that all variables meet
the reliable criteria because they have
Cronbach's Alpha and Composite
Reliability values above 0.6.
2. Structural model (inner model)
The structural model was evaluated
using R-square for endogenous latent
variables, F2 (effect size) and estimated
path coefficients (Ghozali, 2014). The
results of the evaluation of the three
criteria are as follows:
Table 3
Value of Effect Size for Research
Variables
PULL PUSH REV SAT
PULL 0.220 0.103
PUSH 0.026 0.060
REV
SAT 0.283
The value of the effect size of the
push factors on the tourist revisit intention
is 0.026 with a small influence category of
the latent predictor variable, while the
value of the effect size of the pull factors
on the tourist revisit intention of 0.22 is
categorized as the medium influence of the
latent variable predictor. The effect size
value of tourist satisfaction with revisit
intention is 0.283 that is considered as the
medium influence of the latent variable
predictor.

E-Journal of Tourism Vol.7. No.1. (2020): 27-36
http://ojs.unud.ac.id/index.php/eot 32 e-ISSN: 2407-392X. p-ISSN: 2541-0857
Table 4
Statistical Value of Feasibility of
Research Variables
Variable Variabl
e Type
Com
posit
e
Relia
bility
AVE R2
Push Factor Exogen
ous 0.905 0.617 NA
Pull Factor Exogen
ous 0.933 0.736 NA
Satisfaction
Exogen
ous/
Endoge
nous
0.939 0.722 0.540
Revisit
Intention
Endoge
nous 0.905 0.657 0.229
Average 0.683
0.385
Source: Primary Data, 2019.
Based on Table 4, it can be explained
that the satisfaction variable R2 value is
0.540, which indicates that the model is in
the moderate category. Through this
model, 54% of the variance of satisfaction
variables can be explained by the push and
pull factors. While the R square value of
the revisit intention variable is 0.229,
which indicates that the endogenous revisit
intention model is in the weak category.
The model shows that the 22.9% variance
of the revisit intention variable can be
explained by the tourist satisfaction
variable.
The feasibility of a whole structural
equation model or calculating the
Goodness of Fit (GoF) value of the model
can be done by referring to the formula
introduced by Tanenhaus, et.al (2015) in
Suryawardani (2018) as follows:
GoF = √ Communality x R2 = √AVE x R
2
If referring to Table 4 for the above
equation, AVE is the weighted average
value with the weight obtained from the
number of indicators for each variable.
Using this formula, the GoF value from
the model is obtained at 0.513 that is a
measure that exceeds the threshold value
of 0.50. With these calculations, the model
can be accepted and interpreted.
The GoF (Goodness of Fit) test of
the PLS model can also be tested through
the SRMR (Standarized Roots Mean
Square Residual) model value. The model
will be categorized as fulfilling the GoF
criteria if the SRMR value is <0.10 and it
will be perfect fit if the SRMR value
<0.80. The results of the GoF (Goodness
of Fit) equation model are presented in
Table 5 below.
Table 5
Goodness of Fit Research Model Test
Results
Saturated Model Estimated Model
SRMR 0.096 0.096
NFI 0.589 0.589
Source: Primary Data, 2019.
Based on the test results in Table 5, it
can be seen that the results of the
Goodness of Fit (GoF) equation model is
valued at 0.096 which indicates that the
model is feasible and meets the GoF value
criteria. In addition to the GoF value,
E-Journal of Tourism Vol.7. No.1. (2020): 27-36
http://ojs.unud.ac.id/index.php/eot 33 e-ISSN: 2407-392X. p-ISSN: 2541-0857
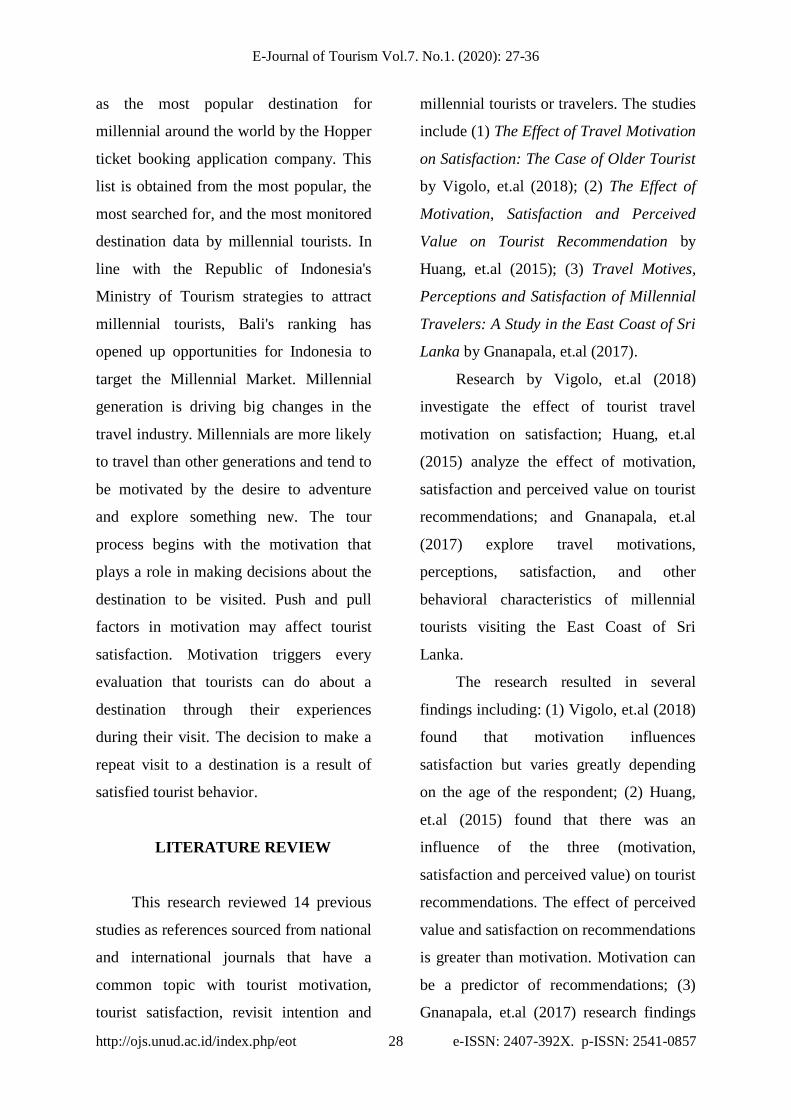
Table 5 also shows the value of the
Normal Fit Index (NFI) of 0.589, which
indicates that the structural model is
categorized as feasible because the value
has a range of values> 0.5. Therefore, it
can be concluded that the research model
is feasible to use to test the research
hypothesis.
Table 6
Indirect Effect of Research Variables
Exogenous
Variables ->
Endogenous
Var
Original
Sample
Standard
of
Deviation
P
Value
s
Sig
PUSH ->
SAT 0.242 0.122 0.048 **
PULL -> SAT 0.317 0.121 0.009 **
SAT -> REV 0.411 0.087 0.000 **
PUSH ->
REV 0.126 0.088 0.153 Ns
PULL ->
REV 0.375 0.091 0.000 **
Source: Primary Data (data processed), 2019.
Description:
Ns : not significant
** : significant
Based on Table 6, it can be seen that
the indirect effect of exogenous variables
on endogenous variables with a
significance level of 5% results in that of
the five direct effects, there is only one
insignificant effect, namely the influence
of the push factor on the revisit intention.
Push and pull factors significantly
influence the satisfaction of millennial
tourists who come to Bali with p value
<0.05 and the original sample value is
positive. This indicates that the push and
pull factors of millennial tourists to visit
Bali are in line with the tourists'
expectations. Significant influence is
shown by the satisfaction variable on
revisit intention with the original sample
value of 0.411 and p value of 0.000.
Previous travel experience will affect the
attitude of tourists to revisit to a
destination. If on a previous visit tourists
were satisfied, then the tourists would
intend to revisit and vice versa.
This research supports the findings
of Vigolo, et.al (2018), Gnapala (2017),
Wiranatha (2018), Sultan (2012), Dayaour
(2015), Baniya (2017), Khuong, et.al.
(2014).
Table 7
Indirect Effect of Research Variables
Exogenous
Variables ->
Mediation ->
Endogenous
Original
Sample
Standard
of
Deviation
P
Valu
es
Sig
PUSH ->
SAT -> REV 0.099 0.063 0.114 Ns
PULL -> SAT
-> REV 0.13 0.053 0.015 **
Source: Primary Data (data processed), 2019.
Description:
Ns : not significant
** : significant
The indirect effect is the influence of
exogenous variables on endogenous
variables which are correlated through
mediating variables. The indirect effects of
this research are 1) the effect of push
factors on revisit intention through
satisfaction mediation; 2) the influence of

E-Journal of Tourism Vol.7. No.1. (2020): 27-36
http://ojs.unud.ac.id/index.php/eot 34 e-ISSN: 2407-392X. p-ISSN: 2541-0857
pull factors on revisit intention through
satisfaction mediation. The results of the
significance of the indirect effect test show
that push factors do not affect the intention
to revisit if mediated by satisfaction. The
driving factor still does not have a
significant effect on the intention to revisit
directly or indirectly.
Table 8
The Total Effect of Exogenous Latent
on Endogenous Latent
Exogenous
Variations
->
Endogenous
Original
Sample
Standard
of
Deviation
P
Value
s
Sig
PUSH ->
SAT 0.242 0.122 0.048 **
PULL ->
SAT 0.317 0.121 0.009 **
SAT ->
REV 0.411 0.087 0.000 **
PUSH ->
REV 0.225 0.087 0.010 **
PULL ->
REV 0.505 0.101 0.000 **
Source: Primary Data (data processed), 2019.
Description:
Ns : not significant
** : significant
Total influence is formed from a
combination of direct and indirect
influences. The total effect test results
presented in Table 8 can be seen that all
influences are positive and significant.
CLOSING
Conclusion
Push and pull factors have a
significant effect on the satisfaction of
millennial tourists visiting Bali. Tourist
satisfaction has a significant effect on
revisit intention. The push factor does not
have a significant effect on the revisit
intention of millennial tourists to Bali even
though it is mediated by satisfaction, while
the pull factor has a significant effect on
revisit intention.
Suggestion
Seeing the important role of social
media in the journey of millennial tourists,
it is suggested that the government through
the Bali Provincial Tourism Office should
collaborate with experts in the field of
digital marketing to create an informative
social media account that contains
interesting content and is able to provide
complete information related to all
attractions tours in Bali to attract
millennial tourists visiting Bali.
Improvement of destination quality must
be done so that it is not monotonous,
because millennial tourists have the
characteristics of exploring something
new.

E-Journal of Tourism Vol.7. No.1. (2020): 27-36
http://ojs.unud.ac.id/index.php/eot 35 e-ISSN: 2407-392X. p-ISSN: 2541-0857
Acknowledgments
The author would like to thank Dr.
Ir. I Gusti Ayu Oka Suryawardani,
M.Mgt., Ph.D as the first supervisor as
well as the Coordinator of the Tourism
Study Program at Udayana University
who, with full attention and patience, gave
me encouragement, enthusiasm and
guidance in completing this thesis. I also
thank Ir. Anak Agung Putu Agung
Suryawan Wiranatha, M.Sc., Ph.D as the
second supervisor with full attention and
patience has provided guidance and
suggestions to me. I also thank Prof. Dr. Ir.
Syamsul Alam Paturusi, MSP as an
academic supervisor and thesis examiner
for the opportunities and guidance
provided during lectures to date. I also
thank Dr. I Nyoman Sudiarta, SE., M.Par
and Dr. I Ketut Surya Diarta, SP., MA as
the examiners who provide many inputs,
suggestions and corrections so that this
thesis can be completed. Thank you also to
all the lecturers in the Tourism Study
Program at Udayana University who have
provided a lot of knowledge, insight and
guidance as well as administrative staff
who have helped the writer while
attending lectures. Thank you to my
beloved family who never stopped
encouraging me to complete my master's
program.
REFERENCES
Vigolo, V., F. Simeoni., F. Cassia. And
M.M. Ugolini. 2018. The Effect of
Travel Motivation on Satisfaction :
The Case of Older Tourist.
International Journal of Business
and Social Science Volume 9.
Huang,S., Y. Shen., C. Choi. 2015. The
Effect of Motivation, Satisfaction
and Perceived Value on Tourist
Recommendation. Travel and
Tourism Research Association:
Advancing Tourism Research
Globally
Gnanapala,W.K.A.C.,A.M.J.A.Dharmasiri
and J.A.R.C. Sandaruwani. 2017.
Travel Motives, Perception And
Satisfaction Of Millennial Travellers:
A Study In East Coast Of Sri Lanka.
Proceeding 7th
International Borneo
Business Conference. Page 524-536.
Malaysia : Universitas Malaysia
Sabah.
Ghozali, I. 2014. Structural Equation
Modelling Metode Alternatif dengan
Partial Least Square Aplikasi.
Cetakan ke empat. Semarang :
Universitas Diponegoro
Wiranatha, A.S., I.G.A.O. Suryawardani, I
K.G. Bendesa. 2018. Model of
Foreign tourist's Loyalty in Cultural
and Heritage Tourism. Journal of
Global Stochastics Analysis.
Sultan, M.A., T. Haryono, B. Haryanto,
A.L. Riani. 2012. Proses
Pembentukan Perilaku Niat
Wisatawan Berkunjung Kembali.
Jurnal Siasat Bisnis Vol 16.

E-Journal of Tourism Vol.7. No.1. (2020): 27-36
http://ojs.unud.ac.id/index.php/eot 36 e-ISSN: 2407-392X. p-ISSN: 2541-0857
Dayaour, F., & Adongo, C.A. 2015. Why
They Go There : International
Tourists' Motivation and Revisit
Intention to Northern Ghana.
American Journal of Tourism
Management, 4 (1) : pp 7-17.
Baniya, R., Ghimire, S., & Phuyal, S.
2017. Push and pull factors and their
effect on international tourists' revisit
intention to Nepal. The Gaze :
Journal of Tourism and Hospitality,
8 : pp 20-39.
Khuong, M.N. & Ha H.t.t. 2014. The
Influences of Push and Pull Factors
on the International Leisure Tourist
Return To Ho Chi Minh City,
Vietnam – Mediation Analysis of
Destination Satisfaction.
International Journal of Trade,
Economies and Finance, 5 (6) : pp
490-496.