e sedimentation in irrigation schemes
TRANSCRIPT

water
Article
Effect of Gate Selection on the Non-CohesiveSedimentation in Irrigation Schemes
Shaimaa Theol 1,*, Bert Jagers 2 , Jigyasha Rai Yangkhurung 3, F. X. Suryadi 1
and Charlotte de Fraiture 1,4
1 Land and Water Development for Food Security, Water Science Engineering, IHE Delft Institute for WaterEducation, 2611 AX Delft, The Netherlands; [email protected] (F.X.S.);[email protected] or [email protected] (C.d.F.)
2 Applied Morphodynamics, Marine and Coastal Systems, Deltares, 2629 HV Delft, The Netherlands;[email protected]
3 Department of Irrigation, Ministry of Energy, Water Resources and Irrigation, 44600 Singhdurbar,Kathmandu, Nepal; [email protected]
4 Department of Environmental Sciences, Water Resources Management,Wageningen University and Research, 6708 PB Wageningen, The Netherlands
* Correspondence: [email protected] or [email protected]
Received: 29 July 2020; Accepted: 1 October 2020; Published: 4 October 2020�����������������
Abstract: In order to cover the crop water requirements, flow control structures such as gates andweirs are used to transfer the desired amount of water from the canals to the field canals. This paperexamines the impact of gate operation and the selection of gates on the deposition of non-cohesivesediment. The Delft3D model is used to simulate the effects of different scenarios regarding gateoperation and the location of the gate that is opened. The model results showed that the gate selectionaffects not only hydraulic parameters but also morphological parameters. It was found that openingthe gates closer to the offtake resulted in less sediment deposition at the entrance of the branch canalwhen compared to opening the gates further away. Gate selection can be used as a tool in sedimentmanagement. By alternating the opening of different gates sediments that are already deposited afteropening one gate can be eroded when another gate is operated, thus minimizing the additional costof sediment removal. The use of Delft3D proved beneficial as the selection of different gates leads toasymmetric sediment deposition patterns which would be missed when using a 1D model.
Keywords: non-cohesive sediment deposition and erosion; sediment transport; gate operation;gate selection; Delft3D model
1. Introduction
1.1. Background
Water flows in irrigation canals tend to change depending on the amount of water demanded bycrops or the supply of water in the irrigation system. This change in flow is assured by the operationof flow control structures such as gates and weirs. Canal operation results in unsteadiness of flowwhich is contrasting the steady and gradually uniform flow as is typically assumed in canal design [1].A minor variation in the flow characteristics may result in a major effect in the sediment transportpatterns, leading to erosion and/or sediment deposition in canals and around hydraulic structuresin case of sediment-laden water. To keep a canal sediment-free, the sediment transport capacity ofthe canal should be maintained as foreseen in the design criteria. However, heavy sediment load,badly designed canals and poor canal operation and management may result in undesirable erosionand sediment deposition. Deposition of sediment causes raising the bed levels which leads to disrupt
Water 2020, 12, 2765; doi:10.3390/w12102765 www.mdpi.com/journal/water
Water 2020, 12, 2765 2 of 21
the water distribution by raising the water level in the upstream part of the canal and lowering waterlevel in downstream of the canals. This will lead to unfair water allocation; upstream outlets will getmore water than their quota and downstream outlets will get less water.
Canal operation is a crucial issue in sediment transport in irrigation systems, with gates beingopened in varying heights and duration [2,3]. This paper investigates how different gate operationscenarios can be used for minimizing undesirable sedimentation in irrigation canals, especially in thevicinity of flow control structures.
1.2. Previous Studies
Sediment transport affects the hydrodynamic patterns, and a study was carried by Dal Sasso etal. [4] to illustrate the impact of landslides and debris flows on the river network and its mass transportprocesses, and how they determine the modifications of the river pattern with consequent effects onthe hydrodynamic phenomena, alterations of the existing morphologies and possible interferenceswith anthropic works. They found that the modifications of the cross-section geometry and channelslope may produce changes in the sediment budget, with consequent repercussions on the streamevolutionary dynamics and its equilibrium configuration, leading to a new river branch arrangement.Different studies regarding sediment transport in irrigation canals showed the relationship betweensediment problems and canal operation and management. A review carried by Shimizu [5] of recentadvances in computational morphodynamics modeling of coupled flow–bed–sediment systems for10 applications, where each of these applications is drawn from solvers included in the public domainInternational River Interface Cooperative (iRIC) software package. Shimizu [5] believe that thecontinued development of scientific interaction among morphologists and a similar commitment tosharing computational code and interface tools, as exemplified by the iRIC project, are both fundamentalparts of the continued development of this field.
Depeweg et al. [6] by employing different scenarios of canal operation, show that sedimentproblems in the Sunsari Morang Irrigation System in Nepal could be avoided or minimized by adaptinggate operation plans. This finding was later confirmed by Paudel [7]. Observations by Munir [3]confirmed that hydraulic efficiencies of canals that are operated based on the supply had not beenaffected by the sediment transport. Sediment depositions accumulated when canals that run withlow discharge can be flushed away during times of peak flow by regulating the operation (Munir [3]).To reduce the deposition on high concentrated sediment periods, Munir [3] recommended operatingthe canals in a supply-based operation. From these studies, it is clear that canal operation and theoperating method have an effect on sediment transport. Theol et al. [8] found that proper location ofweirs and proper adjusting of the branch canal’s gate can substantially reduce sedimentation problemswhile ensuring sufficient water delivery to crops.
Previous studies were done using 1D models which simulate the patterns of the sediment erosionand deposition in the longitudinal direction of the canal, assuming that the sediments are distributedjust like water in the longitudinal direction. However, because of unsteady and variable flow dueto canal operation, sediment depositions are unequally distributed, especially near off-takes andstructures. The effect of unequal distribution might be neglected when using 1D models. To betterrepresent the sedimentation patterns along and across irrigation canals, 2D or even 3D models areneeded [9].
Many numerical shallow water models have been developed for the analysis of sediment behaviorin rivers, estuaries and lakes; some support only depth averaged (2D) mode, such as: MIKE21C [10],BASEMENT [11] and XBeach [12], whereas other can be run in both 2D and 3D mode, such asTelemac [13] and Delft3D [14,15]. Far fewer models were developed for simulating sediments inirrigation systems and most of them are limited because of being 1D and considering sediment transportin the equilibrium condition only, while very few use a 3D model. In this research, the well-establishedDelft3D model was selected because it can be run in both 2D and 3D mode both for the hydrodynamicsas well as for the suspended load transport.

Water 2020, 12, 2765 3 of 21
The other benefit of Delft3D is its ability to simulate the operation of gates with real-time control toshow the morphological changes in canal beds. This paper uses the Delft3D model to analyze the impactof gate selection on the deposition and distribution within the cross section of non-cohesive sedimentin the Sunsari Morang Irrigation system in Nepal; it builds on earlier work by Yangkhurung [16] andPaudel [7].
2. Materials and Methods
2.1. Data
The main canal and Sukhasaina secondary canal (S1) of the Sunsari Morang Irrigation System(SMIS) were selected for this study (Figure 1), as this is the first major branch canal that includes properwater regulating structures. The S1 has its offtake at chainage 9.4 km of the main canal and irrigatesabout 8146 ha with a discharge of 5.7 m3/s [17]. The authors took the canal layout from Google Earth,while the canal geometry was taken from various documents and later verified with the staff of SMIS(Table 1).
Water 2020, 12, x FOR PEER REVIEW 3 of 21
The other benefit of Delft3D is its ability to simulate the operation of gates with real-time control
to show the morphological changes in canal beds. This paper uses the Delft3D model to analyze the
impact of gate selection on the deposition and distribution within the cross section of non-cohesive
sediment in the Sunsari Morang Irrigation system in Nepal; it builds on earlier work by Yangkhurung
[16] and Paudel [7].
2. Materials and Methods
2.1. Data
The main canal and Sukhasaina secondary canal (S1) of the Sunsari Morang Irrigation System
(SMIS) were selected for this study (Figure 1), as this is the first major branch canal that includes
proper water regulating structures. The S1 has its offtake at chainage 9.4 km of the main canal and
irrigates about 8146 ha with a discharge of 5.7 m3/s [17]. The authors took the canal layout from
Google Earth, while the canal geometry was taken from various documents and later verified with
the staff of SMIS (Table 1).
Figure 1. Location and layout of the Sunsari Morang Irrigation System (SMIS) [18].
Table 1. Canal Geometry of the study area
Main Canal Branch Canal
Bed Width, b (m) 18 6
Canal Depth, H (m) 6 4
Side Slope, z 1.5 1.5
Canal Slope, S 0.00014 0.00014
2.1.1. Bathymetry
The main characteristics of the main and the branch canals as the canal geometry are listed in
Table 1. These data are the most important to estimate the discharge and to know the canal capacity.
2.1.2. Roughness
According to Chow [19], the Manning’s roughness (n) for an earthen canal, meandered with
grass and some weeds is estimated at 0.03 s/m1/3. This characterization is close to the existing canals
in the system, and therefore the value of n for the main canal is taken as 0.03 s/m1/3.
2.1.3. Sediment Data
The sediments entering SMIS are mostly fine sediments with median diameter (d50) of less than
200 µm [7]. The median diameter of 100 µm is used for representing the sediment size of the Sitagunj
Figure 1. Location and layout of the Sunsari Morang Irrigation System (SMIS) [18].
Table 1. Canal Geometry of the study area.
Main Canal Branch Canal
Bed Width, b (m) 18 6Canal Depth, H (m) 6 4
Side Slope, z 1.5 1.5Canal Slope, S 0.00014 0.00014
2.1.1. Bathymetry
The main characteristics of the main and the branch canals as the canal geometry are listed inTable 1. These data are the most important to estimate the discharge and to know the canal capacity.
2.1.2. Roughness
According to Chow [19], the Manning’s roughness (n) for an earthen canal, meandered with grassand some weeds is estimated at 0.03 s/m1/3. This characterization is close to the existing canals in thesystem, and therefore the value of n for the main canal is taken as 0.03 s/m1/3.
2.1.3. Sediment Data
The sediments entering SMIS are mostly fine sediments with median diameter (d50) of less than200 µm [7]. The median diameter of 100 µm is used for representing the sediment size of the Sitagunj

Water 2020, 12, 2765 4 of 21
canal (S9) of SMIS by Paudel [7] which is downstream of S1. For this reason, the median diameter of100 µm is used to represent sediment size of the S1 canal, with a specific density of 2650 kg/m3.
The concentration of sediment in the river changes according to the time of year. In the winter,the concentration is less than 0.2 g/L, while in monsoon season the concentrations are peaking to morethan 3 g/L.
The gate just after the pre-settling basin is closed if the sediment concentration exceeds 0.3 g/L [7].Therefore, the sediment concentration of 0.3 g/L with a median diameter of 100 µm is selected forthe simulation.
2.1.4. Gates
For most offtakes, the water levels at CMC are usually controlled by cross regulators, while inthe branch canal this is done by manually operated vertical steel gates [17,20]. The cross regulator(CR) in the main canal consists of a total of eight gates with 4 gate panels, each of 1.5 m wide in 2 bays.The head regulator (HR) is similar but has 4 gates and 2 gate panels. For simplicity, 4 gates and 2 gatesare considered in the simulation for CR and HR, respectively, each being 3 m wide.
2.2. Delft3D Model
Delft3D model is a multi-dimensional model developed by Deltares [14]. It calculates thenon-steady flow and sediment transport phenomena in 2D or 3D mode depending on the model inputsettings. The sediment component was developed and validated by Lesser et al. [15] The Delft3Dmodel has been chosen for this study in order to (1) represent the effects of gate selection on thenon-cohesive sediments behaviour, (2) show the settling basin effect on the deposition of non-cohesivesediments, (3) clarify the non-uniform flows around structures and offtakes, and (4) better simulatelongitudinal and cross-sectional deposition patterns. The Delft3D model mostly has been used forrivers [21–23] and for estuaries [24–28]. Recently, the model was also applied for irrigation canals [29].For the application in this paper the real-time control (RTC) module is used, which permits to changethe gate height during the simulating period [14].
2.2.1. Governing Equations
Delft3D solves the shallow equations [30,31] either in depth averaged (2D) mode or in a hydrostatic3D mode using terrain-following σ-coordinates [32]. These equations are discretized and solved usinga cyclic alternating direction implicit method on a curvilinear Arakawa C-grid [33]. Because of thelarge differences in horizontal and vertical scales typical for environmental applications, the modeluses an anisotropic viscosity. For the horizontal direction a constant viscosity was applied, and for thevertical direction (only in 3D mode obviously) the viscosity is derived from a set of k-ε equations [34].In 2D mode, secondary flow is included via parametrization [35]. The advection–diffusion equation issolved iteratively using a red-black Jacobi method; the 3D σ-mode includes a correction for the steepslopes [36]. More details can be found in the Delft3D-FLOW user manual [14].
Concerning the sediment transport, Delft3D follows the approach developed by Van Rijn [37] thatsplits sediment transport into bedload and suspended load to understand the characterization of thebehavior of non-cohesive sediments. A reference height (a) is used to differentiate between these loads;the sediments which move below this reference height are treated as bedload transport and aboveit as suspended load transport. In the Delft3D model, the layer situated directly above the Van Rijnreference height is called the kmx-layer. The source and sink terms for the interaction of the watercolumn and the bed are located in this layer.
The direction of the bedload transport is in first order equal to the direction of the depth-averagedvelocity in a 2D simulation and equal to the direction of the velocity at the reference height (a) in a 3Dsimulation [38]; secondary flow correction is applied in 2D simulations, and adjustments due to bedslope are applied in both 2D and 3D simulations. Running the model in 2D mode is to ensure betterrepresentation of the sediment processes and the large scale behavior with an acceptable simulation

Water 2020, 12, 2765 5 of 21
time period [8]. Running the model in 3D mode (5 layers) provides information about flow andsediment parameters in the vertical direction and gives more details near structures [39]. The resultsof the 2D and 3D simulations look identical; however, in this paper, the graphs are based on the3D simulations.
The advection–diffusion equation solves the sink term implicitly, whereas the source term issolved explicitly. The concentration and concentration gradient at the bottom of the kmx-layer needs tobe approximated, in order to determine the sink and source terms. A standard Rouse profile betweenthe reference height (a) and the center of the kmx-layer was assumed. Sink and source terms of thekmx-layer are calculated as follows:
Cl = Cal[
a(h− z)z(h− a)
]Al
(1)
The reference height can be represented as:
a = min [max (f * ks, 0.01 h), 0.2 h] (2)
where;Al: Rouse number [-]a: Van Rijn’s reference height [m];C l: concentration of sediment fraction l [kg/m3];Ca
l: reference concentration of sediment fraction l [kg/m3];f: user defined proportionality factor [-] (equals to 1);h: water depth [m];ks: roughness height [m];z: elevation above the bed [m].Erosion formula:
E(l) =α2
lεslCl
a
∆z−α2
lεslCl
kmx
∆z(3)
Deposition formula:D = α1
lClkmxws
l (4)
where:Cl
a: Reference concentration of sediment fraction l [kg/m3];Cl
kmx: Average concentration of the kmx cell of sediment fraction l [kg/m3];ws
l: Settling velocity [m/s];∆z: Difference in elevation between the center of the kmx cell, Van Rijn’s reference height:
∆z = zkmx − a [m];α1
l: First correction factor for sediment concentration [-];α2
l: Second correction factor for sediment concentration [-];εs
l: Sediment diffusion coefficient evaluated at the bottom of the kmx cell of sediment fraction l [-].
2.2.2. Model Setup
For validation purposes, the grid of this case is built based on the layout and the dimensions of theentire main canal and branch canal, including the settling basin. For the simulations of the scenarios,the results are analyzed zooming into the section around the weir and outlet to the branch canal,excluding the settling basin. The bathymetry is developed based on the canal dimensions, the bed levelof a known point, and canal bed slope. The discharge is the upstream boundary condition in the maincanal, which is kept constant during the simulation period. The Q-h relationship is the downstreamboundary of the main canal. The flow resistance due to a barrier is dependent on the blocked flowby the gate, where the gate prevents the flow located in the top grid cells. Depending on the water

Water 2020, 12, 2765 6 of 21
elevation and the gate level, the number of blocked layers will be specified. The depth-averagedanalysis shows that the energy loss coefficient (Closs) depends on the gate contraction, where it becomeszero when the gate is fully open. In the Delft3D model the appropriate energy loss coefficient (Closs)for each gate must be specified [14]. However, the energy loss coefficient for the gates is not known; itis assumed to be 0.9, the default value, for all the gates in the model [16]. The Real-time control toolsimulates the gate operation.
The difference between the sediments flowing in and out of the system determines the changes inthe canal morphology. This change is computed for each cell using the sediment transport formula ofnon-cohesive sediments developed by Van Rijn et al. (2000). The method developed by Van Rijn [37] isused to calculate the settling velocity depending on the suspended sediment size [14].
The initial conditions are set as water level of 109 m + MSL with initial sediment concentrationfor each type of sediments of 0 kg/m3. The initial sediment layer in the unlined section of the canalis assumed as 50 cm, whereas in the lined sections and near structures the initial sediment layer isassumed zero since they are considered non-erodible.
The designed discharge is 51.3 m3/s; however, it is observed that some parts of the canal areoften overflowing during canal operation Renault et al. [20], implied that the canal capacity is actuallysmaller than the design discharge. For this reason, a smaller discharge is used to avoid overflowing [17].A discharge of 30 m3/s is assumed.
The upstream boundary condition is the constant discharge of 30 m3/s with a sedimentconcentration of 0.3 kg/m3. The discharge, sediment particle size and concentration are kept constantthroughout the simulation. The Q-h relationship based on the canal geometry is taken as a downstreamboundary condition at the end of the main canal as the inflow is changing due to the water extraction atthe outlets. At the end of the branch canal the boundary condition is the water level, fixed at 104.97 m,because the branch canal is flowing into paddy rice fields with a wide undefined outflow.
2.3. Study Area
One of the biggest schemes in Nepal is the Sunsari Morang Irrigation System (SMIS), which wasconstructed by the Government of India under the bilateral agreement between Nepal and India in1954 and was handed over to Nepal only after two years of trial operation [40]. The project aimed toirrigate 68,000 ha of Sunsari and Morang districts of the Eastern Terai region of Nepal [16]. The KoshiRiver is the source of this system (Figure 1). Figure 1 shows the location of the SMIS and its layout;the Koshi River is highly sediment loaded [7]. Figure 2 displays the schematization of the case study.The average monthly flow carried by the river ranges between 500 and 6000 m3/s while the annual flooddischarge reaches 7000 m3/s [41]. Various measures such as a pre-settling basin (Figure 1; Figure 2)with a flushing arrangement and desilting basin with two dredgers have been applied to diminish thesediment problem in the system [7].
Though the sediment problem has been reduced, the undesirable erosion and deposition are stillevident from the raised canal bed, as well as clogged structures and the high investment requirementsto remove sediment from the system. This may be because, during the design of the system, the selectedsilt factor was small or the criteria of the sediment transport might have been ignored [7]. Furthermore,the canals in SMIS are unlined which makes the system more vulnerable to sediment-related problems.
Due to the high demand in peak season and low flow in the source during the off-peak season,there was insufficient discharge in the Chatara Main Canal (CMC), leading to deviations in thedeveloped cropping calendar. In order to supply a constant discharge, the canals are operated inrotation. The rotation duration for each canal depends on the water availability in the system. The wateravailability depends on the sediment concentration and on the river flow, which in turn depends onthe rainfall [42]. In addition, most of the canals in the system do not have or follow canal operationplans. Canal and gate operation seem ad hoc and are not documented. Therefore, SMIS was selectedfor the study because of its vulnerability to the sediment problem and its potential to provide efficientand effective irrigation to a large agricultural area.

Water 2020, 12, 2765 7 of 21
Water 2020, 12, x FOR PEER REVIEW 6 of 21
it becomes zero when the gate is fully open. In the Delft3D model the appropriate energy loss
coefficient (Closs) for each gate must be specified [14]. However, the energy loss coefficient for the
gates is not known; it is assumed to be 0.9, the default value, for all the gates in the model [16]. The
Real-time control tool simulates the gate operation.
The difference between the sediments flowing in and out of the system determines the changes
in the canal morphology. This change is computed for each cell using the sediment transport formula
of non-cohesive sediments developed by Van Rijn et al. (2000). The method developed by Van Rijn
[37] is used to calculate the settling velocity depending on the suspended sediment size [14].
The initial conditions are set as water level of 109 m + MSL with initial sediment concentration
for each type of sediments of 0 kg/m3. The initial sediment layer in the unlined section of the canal is
assumed as 50 cm, whereas in the lined sections and near structures the initial sediment layer is
assumed zero since they are considered non-erodible.
The designed discharge is 51.3 m3/s; however, it is observed that some parts of the canal are often
overflowing during canal operation Renault et al. [20], implied that the canal capacity is actually
smaller than the design discharge. For this reason, a smaller discharge is used to avoid overflowing
[17]. A discharge of 30 m3/s is assumed.
The upstream boundary condition is the constant discharge of 30 m3/s with a sediment
concentration of 0.3 kg/m3. The discharge, sediment particle size and concentration are kept constant
throughout the simulation. The Q-h relationship based on the canal geometry is taken as a
downstream boundary condition at the end of the main canal as the inflow is changing due to the
water extraction at the outlets. At the end of the branch canal the boundary condition is the water
level, fixed at 104.97 m, because the branch canal is flowing into paddy rice fields with a wide
undefined outflow.
2.3. Study Area
One of the biggest schemes in Nepal is the Sunsari Morang Irrigation System (SMIS), which was
constructed by the Government of India under the bilateral agreement between Nepal and India in
1954 and was handed over to Nepal only after two years of trial operation [40]. The project aimed to
irrigate 68,000 ha of Sunsari and Morang districts of the Eastern Terai region of Nepal [16]. The Koshi
River is the source of this system (Figures 1). Figure 1 shows the location of the SMIS and its layout;
the Koshi River is highly sediment loaded [7]. Figure 2 displays the schematization of the case study.
The average monthly flow carried by the river ranges between 500 and 6000 m3/s while the annual
flood discharge reaches 7000 m3/s [41]. Various measures such as a pre-settling basin (Figure 1; Figure
2) with a flushing arrangement and desilting basin with two dredgers have been applied to diminish
the sediment problem in the system [7].
Figure 2. Case study schematization. Figure 2. Case study schematization.
2.4. Validation
2.4.1. Hydrodynamic Validation
In order to validate the model and ensure it provides reasonable hydrodynamic results, the maincanal and branch canal have been separated and simulation results have been compared with theboundary conditions for each model. The upstream boundary condition is the constant discharge;the downstream boundary condition for each model is the Q-H relationship. Table 2 compares thecalculated and the simulated water heights (H) for a range of discharges (Q) in the main canal atobservation point 1 (OP1) and the branch canal in observation point 1 (B-OP1), and these points areshown in Figure 6.
Table 2. Calculated and Simulated water depth for specific discharges for Main and Branch Canal.
Main Canal Branch Canal
Q [m3/s]Calculated H,
(m)
Simulated H,(m)
Q [m3/s]Calculated H
(m)
Simulated H,(m)
By Delft3D By Delft3D
7.2 1 1 2.5 1 123.3 2 2 5.2 1.5 1.530 2.3 2.3 6.3 1.7 1.7
46.9 3 3 8.7 2 2
From Table 2, we can see that for the provided boundary conditions the simulated and calculatedwater depths are equal. Therefore, the hydrodynamics of the main and the branch domain areconsidered reliable as a basis for the next step in the simulation.
Consequent to the above verification, the main and the branch canals are combined by using thedomain decomposition tool and the new combined domain is run. The model results are checked withfield data and with the results from another hydrodynamic model, DUFLOW (Table 3). DUFLOW is a1D program which can simulate unsteady flow. From the field data, for a certain discharge, the gaugereading of one point in CMC is known. The water level at this site was compared with the simulatedwater level.

Water 2020, 12, 2765 8 of 21
Table 3. Water level obtained from various sources at an observation point.
Flow (m3/s)Water Level
(m)% Variation fromDesign Discharge
Designed discharge 51.3 2.98DUFLOW Model 51.3 2.97 0.0064
Delft3D Model 51.3 2.91 −2.18
The results show that the simulated water levels of both models are comparable. DUFLOW slightlyovervalues the water level at the observation point while Delft3D has slightly underrated it.The DUFLOW results seem to be nearer to the actual value than Delft3D’s results. However, the knownobservation point may provide a different value of the water level since DUFLOW does not calculatethe water level for a certain point; it calculates it for the whole section. The Delft3D model, on the otherhand, calculates the water level at the center of each cell causing a staggered effect which increases thesectional area, resulting in a lower water level. Delft3D considers many parameters that are ignored byDUFLOW, such as the side slopes and roughness. However, the results are both fairly close to the fielddata as shown in Table 3. It can, therefore, be said that the model is able to satisfactorily mimic the realsituation from the hydrodynamic point of view.
2.4.2. Morphological Validation
The morphological model was prepared based on the model setup and the actual field conditions.Compared with real field conditions for the entire main canal including the settling basin to
validate the sediment deposition and erosion, the simulation results of the main canal including thesettling basin (Figure 2) are compared with real field conditions. The simulation shows how thesediments start to rapidly deposit in the upstream part of the main canal (Figure 3). This increases thebed level and leads to raising the water level upstream the main canal. Some sediments move forwardand settle at the beginning of the settling basin raising the bed on the right side. After the settlingbasin, there is erosion due to the abrupt contraction in the canal.
Water 2020, 12, x FOR PEER REVIEW 8 of 21
Table 3. Water level obtained from various sources at an observation point.
Flow (m3/s) Water Level (m) % Variation from Design Discharge
Designed discharge 51.3 2.98
DUFLOW Model 51.3 2.97 0.0064
Delft3D Model 51.3 2.91 −2.18
The results show that the simulated water levels of both models are comparable. DUFLOW
slightly overvalues the water level at the observation point while Delft3D has slightly underrated it.
The DUFLOW results seem to be nearer to the actual value than Delft3D’s results. However, the
known observation point may provide a different value of the water level since DUFLOW does not
calculate the water level for a certain point; it calculates it for the whole section. The Delft3D model,
on the other hand, calculates the water level at the center of each cell causing a staggered effect which
increases the sectional area, resulting in a lower water level. Delft3D considers many parameters that
are ignored by DUFLOW, such as the side slopes and roughness. However, the results are both fairly
close to the field data as shown in Table 3. It can, therefore, be said that the model is able to
satisfactorily mimic the real situation from the hydrodynamic point of view.
2.4.2. Morphological Validation
The morphological model was prepared based on the model setup and the actual field
conditions.
Compared with real field conditions for the entire main canal including the settling basin to
validate the sediment deposition and erosion, the simulation results of the main canal including the
settling basin (Figure 2) are compared with real field conditions. The simulation shows how the
sediments start to rapidly deposit in the upstream part of the main canal (Figure 3). This increases
the bed level and leads to raising the water level upstream the main canal. Some sediments move
forward and settle at the beginning of the settling basin raising the bed on the right side. After the
settling basin, there is erosion due to the abrupt contraction in the canal.
Figure 3. Bed level and water level in the main canal including the settling basin.
The measurement line is along the computational grid line that follows the center lines of the
canals and passes through the eastern side of the settling basin.
The velocity is reduced along the main canal especially in the settling basin, where it reaches
zero in the right bank, which leads to sediment deposition (Figure 4). After the settling basin, the
velocity reaches 0.6 m/s.
Figure 4 clearly illustrates how rapidly the deposition of the sediment can affect the water level.
Additionally, it displays the role of the settling basin in trapping the non-cohesive sediment. Figure
4 shows the results after one month. Running the same case for a longer period leads to more
sediments trapped and accumulated in the settling basin.
Figure 3. Bed level and water level in the main canal including the settling basin.
The measurement line is along the computational grid line that follows the center lines of thecanals and passes through the eastern side of the settling basin.
The velocity is reduced along the main canal especially in the settling basin, where it reaches zeroin the right bank, which leads to sediment deposition (Figure 4). After the settling basin, the velocityreaches 0.6 m/s.

Water 2020, 12, 2765 9 of 21
Water 2020, 12, x FOR PEER REVIEW 9 of 21
Figure 4. The relationship between velocity and the accumulated sediment in the settling basin.
Figure 4 presents the relationship between the velocity and the accumulation of sediment. When
velocity decreases, sediment deposition occurs. Oppositely, if the velocity increases, deposition is
reduced.
Comparing the simulation results with actual situation as captured from Google Earth (Figure
5), shows the similarity of the sedimentation pattern in the settling basin, where the deposition occurs
at the right side of the settling basin.
Figure 5. The similarity between Delft3D results and the actual situation captured from Google Earth
(A) Delft3D results, (B) the actual case in 2004, (C) the actual case in 2005, (D) the actual case in 2016.
From Figure 5 we can see that Delft3D is able to satisfactorily represent the actual situation from
a morphological point of view. The shape of the thalweg, i.e., the planform of the insized channel, is
indeed different between the simulation in 5A and the observation in 5C. The exact shape and
position depends on detailed processes not resolved by the model, but the overall characteristics of
the deposits (over the full width of the settling basin with a narrow channel remaining) are captured
by the physics in the numerical model.
Figure 4. The relationship between velocity and the accumulated sediment in the settling basin.
Figure 4 clearly illustrates how rapidly the deposition of the sediment can affect the water level.Additionally, it displays the role of the settling basin in trapping the non-cohesive sediment. Figure 4shows the results after one month. Running the same case for a longer period leads to more sedimentstrapped and accumulated in the settling basin.
Figure 4 presents the relationship between the velocity and the accumulation of sediment.When velocity decreases, sediment deposition occurs. Oppositely, if the velocity increases,deposition is reduced.
Comparing the simulation results with actual situation as captured from Google Earth (Figure 5),shows the similarity of the sedimentation pattern in the settling basin, where the deposition occurs atthe right side of the settling basin.
Water 2020, 12, x FOR PEER REVIEW 9 of 21
Figure 4. The relationship between velocity and the accumulated sediment in the settling basin.
Figure 4 presents the relationship between the velocity and the accumulation of sediment. When
velocity decreases, sediment deposition occurs. Oppositely, if the velocity increases, deposition is
reduced.
Comparing the simulation results with actual situation as captured from Google Earth (Figure
5), shows the similarity of the sedimentation pattern in the settling basin, where the deposition occurs
at the right side of the settling basin.
Figure 5. The similarity between Delft3D results and the actual situation captured from Google Earth
(A) Delft3D results, (B) the actual case in 2004, (C) the actual case in 2005, (D) the actual case in 2016.
From Figure 5 we can see that Delft3D is able to satisfactorily represent the actual situation from
a morphological point of view. The shape of the thalweg, i.e., the planform of the insized channel, is
indeed different between the simulation in 5A and the observation in 5C. The exact shape and
position depends on detailed processes not resolved by the model, but the overall characteristics of
the deposits (over the full width of the settling basin with a narrow channel remaining) are captured
by the physics in the numerical model.
Figure 5. The similarity between Delft3D results and the actual situation captured from Google Earth(A) Delft3D results, (B) the actual case in 2004, (C) the actual case in 2005, (D) the actual case in 2016.
From Figure 5 we can see that Delft3D is able to satisfactorily represent the actual situation froma morphological point of view. The shape of the thalweg, i.e., the planform of the insized channel,is indeed different between the simulation in 5A and the observation in 5C. The exact shape andposition depends on detailed processes not resolved by the model, but the overall characteristics of thedeposits (over the full width of the settling basin with a narrow channel remaining) are captured bythe physics in the numerical model.

Water 2020, 12, 2765 10 of 21
2.5. Scenarios
Different scenarios are tested using the Real-time Control (RTC) module. The RTC permitschanging the status of the gate (opening partially, fully or closing the gate) during the simulationperiod. All the Cross-Regulator (CR) gates are left fully open for half month, then the gates are fullyopened or closed for a month, depending on the scenario (Table 4). Hydraulic input and sediment aremaintained constant for all scenarios, changing only the opening of the gate. Scenario names are givenas Scenario for Gate Operation (SGO) followed by a number. The analysis focuses on the area within1.15 km upstream of the offtake to the downstream end of the main canal (Figure 6), excluding thedesilting basin. This is done only for the gates of the Cross-Regulator (CR) while the gates of the HeadRegulator are left fully open for all scenarios (Figure 7).
Table 4. Gate operation scenarios.
SimulationTime 0.5 Month 1 Month
Gates Scenarioname
All gatesopen
Gate a Gate b Gate c Gate d
(left bank) (middle left) (middleright) (right bank)
All GatesOpen SGO1 Open Open Open Open
Two gatesopen
SGO2 (AB) Open Open Closed ClosedSGO3 (BC) Closed Open Open ClosedSGO4 (CD) Closed Closed Open OpenSGO5 (AD) Open Closed Closed Open
One gateopen
SGO6 (A) Open Closed Closed ClosedSGO7 (B) Closed Open Closed ClosedSGO8 (C) Closed Closed Open ClosedDGO9 (D) Closed Closed Closed Open
Additional scenarios covering the multiple operations of different gates at the same time are included in theSupplementary Materials.
Water 2020, 12, x FOR PEER REVIEW 10 of 21
2.5. Scenarios
Different scenarios are tested using the Real-time Control (RTC) module. The RTC permits
changing the status of the gate (opening partially, fully or closing the gate) during the simulation
period. All the Cross-Regulator (CR) gates are left fully open for half month, then the gates are fully
opened or closed for a month, depending on the scenario (Table 4). Hydraulic input and sediment
are maintained constant for all scenarios, changing only the opening of the gate. Scenario names are
given as Scenario for Gate Operation (SGO) followed by a number. The analysis focuses on the area
within 1.15 km upstream of the offtake to the downstream end of the main canal (Figure 6), excluding
the desilting basin. This is done only for the gates of the Cross-Regulator (CR) while the gates of the
Head Regulator are left fully open for all scenarios (Figure 7).
Figure 6. The selected area.
Figure 7. The location of Gates in the Canals in the model (left) and as seen in Google Earth (right).
Figure 6. The selected area.

Water 2020, 12, 2765 11 of 21
Water 2020, 12, x FOR PEER REVIEW 10 of 21
2.5. Scenarios
Different scenarios are tested using the Real-time Control (RTC) module. The RTC permits
changing the status of the gate (opening partially, fully or closing the gate) during the simulation
period. All the Cross-Regulator (CR) gates are left fully open for half month, then the gates are fully
opened or closed for a month, depending on the scenario (Table 4). Hydraulic input and sediment
are maintained constant for all scenarios, changing only the opening of the gate. Scenario names are
given as Scenario for Gate Operation (SGO) followed by a number. The analysis focuses on the area
within 1.15 km upstream of the offtake to the downstream end of the main canal (Figure 6), excluding
the desilting basin. This is done only for the gates of the Cross-Regulator (CR) while the gates of the
Head Regulator are left fully open for all scenarios (Figure 7).
Figure 6. The selected area.
Figure 7. The location of Gates in the Canals in the model (left) and as seen in Google Earth (right).
Figure 7. The location of Gates in the Canals in the model (left) and as seen in Google Earth (right).
3. Results
3.1. Scenario 1 Reference Case (SGO1) all Gates Open
For the reference case and the following scenarios, after excluding the settling basin as shown inFigure 6, the model simulates a duration of 1.5 months. From Km 0 to Km 1.15, sediments start todeposit rapidly upstream and increase with time. This increase in the bed level again leads to raisingthe water level upstream of the main canal. Sediments move forward along the main canal due to thesufficient velocity and transport capacity to convey the sediments. The deposition of the sedimentsin km 1.15 is less than the upstream location, where it reaches 0.4 m. After Km 1.15, the depositionincreases as in this vicinity the water is diverted to the branch canal. Less water leads to less velocity,hence an increase in deposition. After the diversion to the branch canal, there is a contraction in themain canal, leading to increased velocity and reduced deposition in that location, and thereafter moredeposition upstream the gates. Unlike the previous case, there is no erosion (Figure 8).
Water 2020, 12, x FOR PEER REVIEW 11 of 21
Table 4. Gate operation scenarios.
Simulation
Time 0.5 Month 1 Month
Gates Scenario
name
All gates
open
Gate a Gate b Gate c Gate d
(left
bank)
(middle
left)
(middle
right)
(right
bank)
All Gates Open SGO1 Open Open Open Open
Two gates
open
SGO2 (AB) Open Open Closed Closed
SGO3 (BC) Closed Open Open Closed
SGO4 (CD) Closed Closed Open Open
SGO5 (AD) Open Closed Closed Open
One gate open
SGO6 (A) Open Closed Closed Closed
SGO7 (B) Closed Open Closed Closed
SGO8 (C) Closed Closed Open Closed
DGO9 (D) Closed Closed Closed Open
Additional scenarios covering the multiple operations of different gates at the same time are included
in the supplementary material.
3. Results
3.1. Scenario 1 Reference Case (SGO1) All Gates Open
For the reference case and the following scenarios, after excluding the settling basin as shown in
Figure 6, the model simulates a duration of 1.5 months. From Km 0 to Km 1.15, sediments start to
deposit rapidly upstream and increase with time. This increase in the bed level again leads to raising
the water level upstream of the main canal. Sediments move forward along the main canal due to the
sufficient velocity and transport capacity to convey the sediments. The deposition of the sediments
in km 1.15 is less than the upstream location, where it reaches 0.4 m. After Km 1.15, the deposition
increases as in this vicinity the water is diverted to the branch canal. Less water leads to less velocity,
hence an increase in deposition. After the diversion to the branch canal, there is a contraction in the
main canal, leading to increased velocity and reduced deposition in that location, and thereafter more
deposition upstream the gates. Unlike the previous case, there is no erosion (Figure 8).
Figure 8. Bed level and water level updating in the main canal without the settling basin. Figure 8. Bed level and water level updating in the main canal without the settling basin.
The velocity reduces along the main canal especially at the location of the diversion, which leadsto high sediment deposition (Figure 9). After the diversion, due to the contraction in the main canal atKm 1.17, the velocity increases and the sediment deposition decreases. After the contraction velocitydecreases and sediment accumulation increases (Figure 9).

Water 2020, 12, 2765 12 of 21
Water 2020, 12, x FOR PEER REVIEW 12 of 21
The velocity reduces along the main canal especially at the location of the diversion, which leads
to high sediment deposition (Figure 9). After the diversion, due to the contraction in the main canal
at Km 1.17, the velocity increases and the sediment deposition decreases. After the contraction
velocity decreases and sediment accumulation increases (Figure 9).
Figure 9. Relationship between velocity and the accumulated sediment in the main canal.
Figure 9 presents a clear relationship between the velocity and the accumulation of sediment.
When velocity decreases, the sediment deposition occurs and increases, when the velocity increases,
the deposition will be lower.
3.2. Scenario 2 Gate Operation
In this scenario, the gates are operated during the simulation period by fully closing and fully
opening for a certain time. The simulation consisted of half month during which all gates were fully
open, followed by one month during which the gates were fully closed expect the selected gates
remain fully open.
3.2.1. Operating Two Gates
Gate a and b (SGO2)
The scenario considers opening the gates for a half month, then closing the gates, except for the
ones on the right side near the diversion (gate a and gate b in Figure 7) that remain open for an
additional month. The sedimentation in this scenario is higher than in the reference case (SGO1) from
the beginning of the main canal till the location of gates, where the deposition is much higher (Figure
10). In this scenario, compared to the reference scenario the bed level is higher on the right side and
lower on the left side of the canal (Figure 11). Downstream of the gates, the velocity is higher because
of closing two gates, causing erosion. Therefore, compared to the reference case, the bed level directly
downstream of the gates is lower on the right and left sides and higher in the middle of the canal
(Figure 11). In the branch canal, the deposition is slightly less than in the reference case.
Figure 9. Relationship between velocity and the accumulated sediment in the main canal.
Figure 9 presents a clear relationship between the velocity and the accumulation of sediment.When velocity decreases, the sediment deposition occurs and increases, when the velocity increases,the deposition will be lower.
3.2. Scenario 2 Gate Operation
In this scenario, the gates are operated during the simulation period by fully closing and fullyopening for a certain time. The simulation consisted of half month during which all gates were fullyopen, followed by one month during which the gates were fully closed expect the selected gates remainfully open.
3.2.1. Operating Two Gates
Gate a and b (SGO2)
The scenario considers opening the gates for a half month, then closing the gates, except forthe ones on the right side near the diversion (gate a and gate b in Figure 7) that remain open for anadditional month. The sedimentation in this scenario is higher than in the reference case (SGO1)from the beginning of the main canal till the location of gates, where the deposition is much higher(Figure 10). In this scenario, compared to the reference scenario the bed level is higher on the right sideand lower on the left side of the canal (Figure 11). Downstream of the gates, the velocity is higherbecause of closing two gates, causing erosion. Therefore, compared to the reference case, the bed leveldirectly downstream of the gates is lower on the right and left sides and higher in the middle of thecanal (Figure 11). In the branch canal, the deposition is slightly less than in the reference case.

Water 2020, 12, 2765 13 of 21Water 2020, 12, x FOR PEER REVIEW 13 of 21
Figure 10. The bed level in scenarios with two gates opened.
Figure 11. The bed level within different cross-sections in scenarios with two open gates.
Gate b and c (SGO3)
Similar to scenario SGO2, the gates in this scenario are opened for half month; thereafter the
gates are closed, except the middle gates (b and c), which stay open for one month. The deposition in
this scenario is also higher than the reference case. From the beginning of the main canal till the
location of gates, the deposition is much higher (Figure 10) because of the reduction in velocity. The
deposition upstream the gates on the right side is higher than in Scenario SGO1 and is lower on the
left side, while downstream the gates the opposite occurs (Figure 11). The deposition in scenario
SGO3 is lower than in Scenario SGO2.
Gates c and d (SGO4)
Gates c and d are opened for one month after closing the other gates. The deposition in this
scenario is lower on the right side than the deposition in the previous scenarios, and higher at the left
side for the whole main canal (Figure 11) except at the downstream, where the deposition is higher
on both sides and erosion occurs in the middle due to the high velocity. Deposition is less because of
the high amount of water transferred to the branch canal in this scenario. In the branch canal, the
deposition is almost the same with the reference case (Figure 10).
Figure 10. The bed level in scenarios with two gates opened.
Water 2020, 12, x FOR PEER REVIEW 13 of 21
Figure 10. The bed level in scenarios with two gates opened.
Figure 11. The bed level within different cross-sections in scenarios with two open gates.
Gate b and c (SGO3)
Similar to scenario SGO2, the gates in this scenario are opened for half month; thereafter the
gates are closed, except the middle gates (b and c), which stay open for one month. The deposition in
this scenario is also higher than the reference case. From the beginning of the main canal till the
location of gates, the deposition is much higher (Figure 10) because of the reduction in velocity. The
deposition upstream the gates on the right side is higher than in Scenario SGO1 and is lower on the
left side, while downstream the gates the opposite occurs (Figure 11). The deposition in scenario
SGO3 is lower than in Scenario SGO2.
Gates c and d (SGO4)
Gates c and d are opened for one month after closing the other gates. The deposition in this
scenario is lower on the right side than the deposition in the previous scenarios, and higher at the left
side for the whole main canal (Figure 11) except at the downstream, where the deposition is higher
on both sides and erosion occurs in the middle due to the high velocity. Deposition is less because of
the high amount of water transferred to the branch canal in this scenario. In the branch canal, the
deposition is almost the same with the reference case (Figure 10).
Figure 11. The bed level within different cross-sections in scenarios with two open gates.
Gate b and c (SGO3)
Similar to scenario SGO2, the gates in this scenario are opened for half month; thereafter the gatesare closed, except the middle gates (b and c), which stay open for one month. The deposition in thisscenario is also higher than the reference case. From the beginning of the main canal till the location ofgates, the deposition is much higher (Figure 10) because of the reduction in velocity. The depositionupstream the gates on the right side is higher than in Scenario SGO1 and is lower on the left side,while downstream the gates the opposite occurs (Figure 11). The deposition in scenario SGO3 is lowerthan in Scenario SGO2.
Gates c and d (SGO4)
Gates c and d are opened for one month after closing the other gates. The deposition in thisscenario is lower on the right side than the deposition in the previous scenarios, and higher at the leftside for the whole main canal (Figure 11) except at the downstream, where the deposition is higheron both sides and erosion occurs in the middle due to the high velocity. Deposition is less becauseof the high amount of water transferred to the branch canal in this scenario. In the branch canal,the deposition is almost the same with the reference case (Figure 10).

Water 2020, 12, 2765 14 of 21
Gate a and d (SGO5)
Gates a and d stay open for one month after closing the other gates. The deposition in this scenariois higher than the reference case and SGO4 (Figure 10), and lower than in scenarios SGO2 and SGO3from the beginning of the main canal till the location of gates, where the deposition is lower in bothsides compared to other scenarios and higher in the middle (Figure 11). Downstream in the maincanal, the deposition is higher than the reference case (SGO2) and SGO3 but lower than scenariosSGO1 and SGO4.
In these scenarios, opening only two gates from the total number of gates has an actual impact onthe sediment transport, flow parameters and the bed of the canal. Figure 10 shows that by using 1Drepresentation, it is hard to tell the difference between the scenarios. However, when presenting theresults in cross sections (Figure 11) and plan view (Figure 12) differences between these scenarios canbe seen, as well as the position of erosion and accumulation of sediments.
Water 2020, 12, x FOR PEER REVIEW 14 of 21
Gate a and d (SGO5)
Gates a and d stay open for one month after closing the other gates. The deposition in this
scenario is higher than the reference case and SGO4 (Figure 10), and lower than in scenarios SGO2
and SGO3 from the beginning of the main canal till the location of gates, where the deposition is
lower in both sides compared to other scenarios and higher in the middle (Figure 11). Downstream
in the main canal, the deposition is higher than the reference case (SGO2) and SGO3 but lower than
scenarios SGO1 and SGO4.
In these scenarios, opening only two gates from the total number of gates has an actual impact
on the sediment transport, flow parameters and the bed of the canal. Figure 10 shows that by using
1D representation, it is hard to tell the difference between the scenarios. However, when presenting
the results in cross sections (Figure 11) and plan view (Figure 12) differences between these scenarios
can be seen, as well as the position of erosion and accumulation of sediments.
Figure 12. Cumulative erosion/sedimentation by opening two gates compared to the reference case.
The velocity has a major impact on the sediment deposition and erosion patterns along the
vicinity of the gate structure in the canal, as discussed previously and shown in Figure 9. The
deposition is observable upstream of the gate due to lower velocity, while erosion is visible
downstream of the gate due to the higher velocity there. At scenario SGO1 the deposition occurs only
on the canal sides due to the lower velocities. However, the deposition is mainly concentrated near
the gates that are closed during the simulation.
In scenario SGO2 there is erosion at the left side of the canal and in the middle. In scenario SGO3
erosion occurs in the middle of the canal. In the main canal a significant deposition occurs, especially
in the sides where the velocity is low for all scenarios. In scenario SGO4 there is erosion on the right
side and in the middle of the canal even attempting to erode the sides of the canal, while sediment is
deposited in the region near the diversion due to lower velocities. Furthermore, high sediment
deposition before the offtake is observed in this scenario compared to others. In scenario SGO5 there
is no erosion, and only deposition in the middle occurs (Figure 12).
3.2.2. Operating One Gate
Gate a (SGO6)
In this scenario, gate a on the side of the diversion is opened for one month after closing all other
gates. Deposition in this scenario is higher than deposition in the reference case along the main canal
except downstream of the gates until the end of the main canal (Figure 13). In the branch canal,
deposition is less than in the reference case, because due to the closing of three gates in the main
canal, a large amount of water is diverted to the branch canal, leading to an increased transport
capacity and reduced deposition from the start of the branch canal up to 400 m (Figure 13). After 400
m to the end of the branch canal, erosion will occur due to the increase in the velocity. Within the
cross-section the deposition downstream the gate and in the middle of the branch canal for case SGO6
is lower on both sides than the reference case, and is equal in the middle while downstream the
Figure 12. Cumulative erosion/sedimentation by opening two gates compared to the reference case.
The velocity has a major impact on the sediment deposition and erosion patterns along the vicinityof the gate structure in the canal, as discussed previously and shown in Figure 9. The deposition isobservable upstream of the gate due to lower velocity, while erosion is visible downstream of the gatedue to the higher velocity there. At scenario SGO1 the deposition occurs only on the canal sides due tothe lower velocities. However, the deposition is mainly concentrated near the gates that are closedduring the simulation.
In scenario SGO2 there is erosion at the left side of the canal and in the middle. In scenario SGO3erosion occurs in the middle of the canal. In the main canal a significant deposition occurs, especially inthe sides where the velocity is low for all scenarios. In scenario SGO4 there is erosion on the rightside and in the middle of the canal even attempting to erode the sides of the canal, while sedimentis deposited in the region near the diversion due to lower velocities. Furthermore, high sedimentdeposition before the offtake is observed in this scenario compared to others. In scenario SGO5 there isno erosion, and only deposition in the middle occurs (Figure 12).
3.2.2. Operating One Gate
Gate a (SGO6)
In this scenario, gate a on the side of the diversion is opened for one month after closing allother gates. Deposition in this scenario is higher than deposition in the reference case along the maincanal except downstream of the gates until the end of the main canal (Figure 13). In the branch canal,deposition is less than in the reference case, because due to the closing of three gates in the main canal,a large amount of water is diverted to the branch canal, leading to an increased transport capacityand reduced deposition from the start of the branch canal up to 400 m (Figure 13). After 400 m to theend of the branch canal, erosion will occur due to the increase in the velocity. Within the cross-sectionthe deposition downstream the gate and in the middle of the branch canal for case SGO6 is lower on

Water 2020, 12, 2765 15 of 21
both sides than the reference case, and is equal in the middle while downstream the branch canal thedeposition is few millimeters higher on both sides than the reference case, small erosion in the middleof the cross-section (Figure 14).
Water 2020, 12, x FOR PEER REVIEW 15 of 21
branch canal the deposition is few millimeters higher on both sides than the reference case, small
erosion in the middle of the cross-section (Figure 14).
Figure 13. The bed level in scenarios with one gate opened.
Figure 14. The bed level within cross-section in different scenarios.
Gate b (SGO7)
Gate b is opened for one month after closing all other gates. Deposition is similar as in scenario
SGO6 in the main canal, branch canal and in the cross-sections (Figures 13 and 14).
Gate c (SGO8)
Gate c is opened for one month after closing all other gates. The deposition is similar to SGO6
and SGO7 (Figures 13 and 14).
Gate d (SGO9)
Gate d, on the other side from the diversion side, is opened for one month, after closing all other
gates. The deposition is similar to SGO6, SGO7 and SGO8 (Figures 13 and 14).
Figure 14 shows that the effect of opening one gate on sedimentation is different from that of
opening two gates. Opening one gate provides less deposition downstream of the gate compared to
the deposition in the reference case and in the case of opening two gates. Additionally, opening one
gate produces less deposition in the middle of the branch canal on both sides than opening two gates
and the reference case.
Opening gate a only leads to small sediment deposition upstream part the branch canal as
compared to scenarios SGO7, SGO8 and SGO9. In the main canal, downstream of the gate, deposition
occurs at the side far from the diversion and erosion occurs at the side close to the diversion due to
high velocity. Thereafter, erosion exists in the middle of the canal while deposition occurs at both
sides of the bed due to low velocities (Figure 15). Opening gate b leads to erosion in the middle of the
Figure 13. The bed level in scenarios with one gate opened.
Water 2020, 12, x FOR PEER REVIEW 15 of 21
branch canal the deposition is few millimeters higher on both sides than the reference case, small
erosion in the middle of the cross-section (Figure 14).
Figure 13. The bed level in scenarios with one gate opened.
Figure 14. The bed level within cross-section in different scenarios.
Gate b (SGO7)
Gate b is opened for one month after closing all other gates. Deposition is similar as in scenario
SGO6 in the main canal, branch canal and in the cross-sections (Figures 13 and 14).
Gate c (SGO8)
Gate c is opened for one month after closing all other gates. The deposition is similar to SGO6
and SGO7 (Figures 13 and 14).
Gate d (SGO9)
Gate d, on the other side from the diversion side, is opened for one month, after closing all other
gates. The deposition is similar to SGO6, SGO7 and SGO8 (Figures 13 and 14).
Figure 14 shows that the effect of opening one gate on sedimentation is different from that of
opening two gates. Opening one gate provides less deposition downstream of the gate compared to
the deposition in the reference case and in the case of opening two gates. Additionally, opening one
gate produces less deposition in the middle of the branch canal on both sides than opening two gates
and the reference case.
Opening gate a only leads to small sediment deposition upstream part the branch canal as
compared to scenarios SGO7, SGO8 and SGO9. In the main canal, downstream of the gate, deposition
occurs at the side far from the diversion and erosion occurs at the side close to the diversion due to
high velocity. Thereafter, erosion exists in the middle of the canal while deposition occurs at both
sides of the bed due to low velocities (Figure 15). Opening gate b leads to erosion in the middle of the
Figure 14. The bed level within cross-section in different scenarios.
Gate b (SGO7)
Gate b is opened for one month after closing all other gates. Deposition is similar as in scenarioSGO6 in the main canal, branch canal and in the cross-sections (Figures 13 and 14).
Gate c (SGO8)
Gate c is opened for one month after closing all other gates. The deposition is similar to SGO6and SGO7 (Figures 13 and 14).
Gate d (SGO9)
Gate d, on the other side from the diversion side, is opened for one month, after closing all othergates. The deposition is similar to SGO6, SGO7 and SGO8 (Figures 13 and 14).
Figure 14 shows that the effect of opening one gate on sedimentation is different from that ofopening two gates. Opening one gate provides less deposition downstream of the gate compared tothe deposition in the reference case and in the case of opening two gates. Additionally, opening onegate produces less deposition in the middle of the branch canal on both sides than opening two gatesand the reference case.
Opening gate a only leads to small sediment deposition upstream part the branch canal as comparedto scenarios SGO7, SGO8 and SGO9. In the main canal, downstream of the gate, deposition occurs
Water 2020, 12, 2765 16 of 21
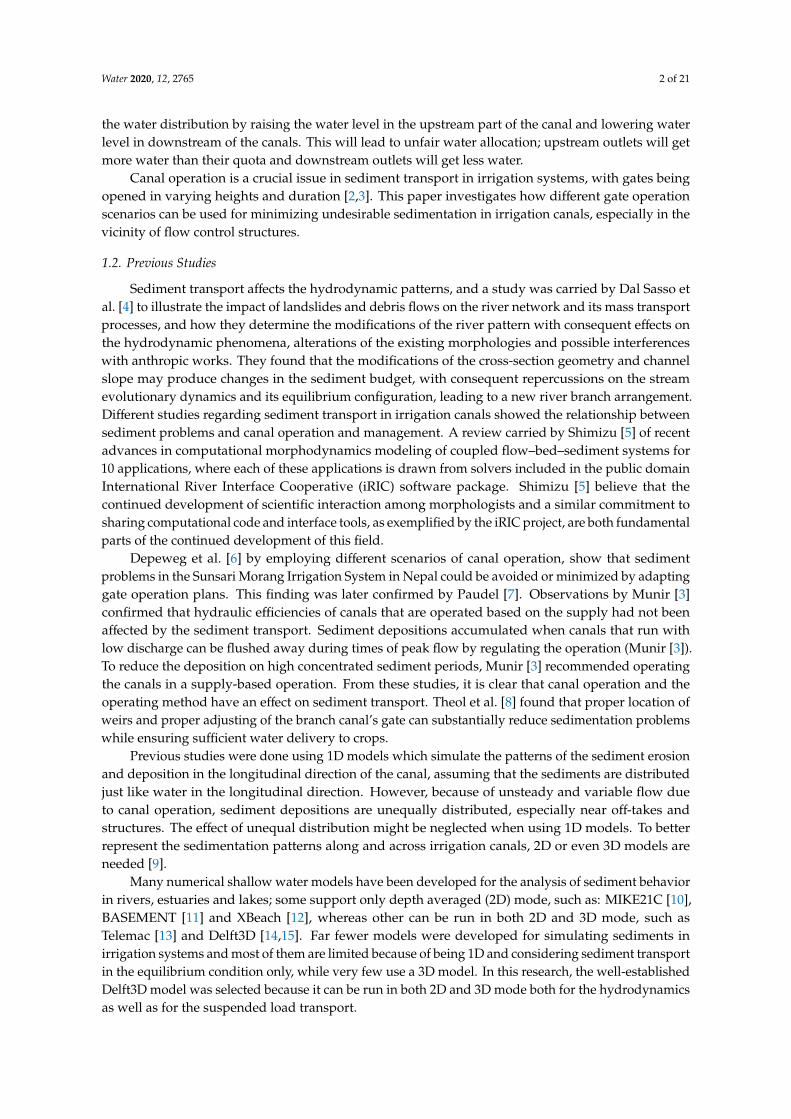
at the side far from the diversion and erosion occurs at the side close to the diversion due to highvelocity. Thereafter, erosion exists in the middle of the canal while deposition occurs at both sides ofthe bed due to low velocities (Figure 15). Opening gate b leads to erosion in the middle of the maincanal, which moves to the side far from the diversion. Opening gate c in scenario SGO8 leads to moredeposition upstream of the branch canal and deposition upstream the gate. Downstream of the gate,erosion exists in the side far from the diversion due to the high velocity and in the middle thereafterand deposition in both sides. Opening gate (d) has similar deposition and erosion patterns as theopening of gate c but with more erosion.
Water 2020, 12, x FOR PEER REVIEW 16 of 21
main canal, which moves to the side far from the diversion. Opening gate c in scenario SGO8 leads
to more deposition upstream of the branch canal and deposition upstream the gate. Downstream of
the gate, erosion exists in the side far from the diversion due to the high velocity and in the middle
thereafter and deposition in both sides. Opening gate (d) has similar deposition and erosion patterns
as the opening of gate c but with more erosion.
Figure 15. Cumulative erosion/sedimentation by opening one gate compared to the reference case.
Since purely 1D models cannot predict lateral variations in erosion rates, the results in Figures
14 and 15 are a benefit of using multi-dimensional models to represent the difference in bed level
within the cross-section under different scenarios. Knowing these differences can help decision-
makers to choose the optimal canal operation by selecting the suitable gate to minimize deposition,
while at the same time ensuring the required amount of water for crops is delivered. From these two
scenarios. Opening only one gate from the total number of gates has a greater influence on the
sediment transport, flow criteria and the morphology for the canal bed than opening two gates.
4. Discussion
The basic function of the regulating structures is to convey the required amount of water to
where it is needed, for example to the offtakes to the branch canals, and maintain a certain water level
there. The reference scenario (SGO1) with all gates open diverts 29% of water to the branch canal. As
expected, after closing two or three gates in the regulator, more water enters the branch canal at the
first time-steps. Scenarios with two open gates divert 7% to 8% more water to the branch canal as
compared to the reference case. Scenarios with one open gate, divert about 19% to 21% more water
to the branch canal as compared to the reference case (Table 5).
Table 5. Percentage of diverted discharge to the main and branch canals.
% of Discharge
Diverted SGO1 SGO2 SGO3 SGO4 SGO5 SGO6 SGO7 SGO8 SGO9
Main Canal 71 64 64 63 63 51 52 52 50
Branch Canal 29 36 36 37 37 49 48 48 50
Scenario SGO5 diverts less water than scenarios SGO2, SGO3 and similarly SGO4 because in this
scenario gates a and d are open, which are at the sides of the main canal where the flow velocity is
less than in the middle because of wall friction. Opening gate b or c located in the middle of the main
canal (scenarios SGO7 and SGO8, respectively), results in less water diverted to the branch canal than
in scenarios SGO6 and SGO9.
Comparing the different gate operation scenarios with one or two gates open, it is clear that not
only the number but also the location of the selected gate(s) has an impact on sediment deposition.
Opening the gate which is at the side of the offtake leads to less sediment deposition at the upstream
of the regulating gates (Table 6). Opening the farther gate leads to higher sediment deposition at the
intake. This deposition will not only alter the hydrodynamic characteristics but also morphologic
Figure 15. Cumulative erosion/sedimentation by opening one gate compared to the reference case.
Since purely 1D models cannot predict lateral variations in erosion rates, the results in Figures 14and 15 are a benefit of using multi-dimensional models to represent the difference in bed level withinthe cross-section under different scenarios. Knowing these differences can help decision-makers tochoose the optimal canal operation by selecting the suitable gate to minimize deposition, while at thesame time ensuring the required amount of water for crops is delivered. From these two scenarios.Opening only one gate from the total number of gates has a greater influence on the sediment transport,flow criteria and the morphology for the canal bed than opening two gates.
4. Discussion
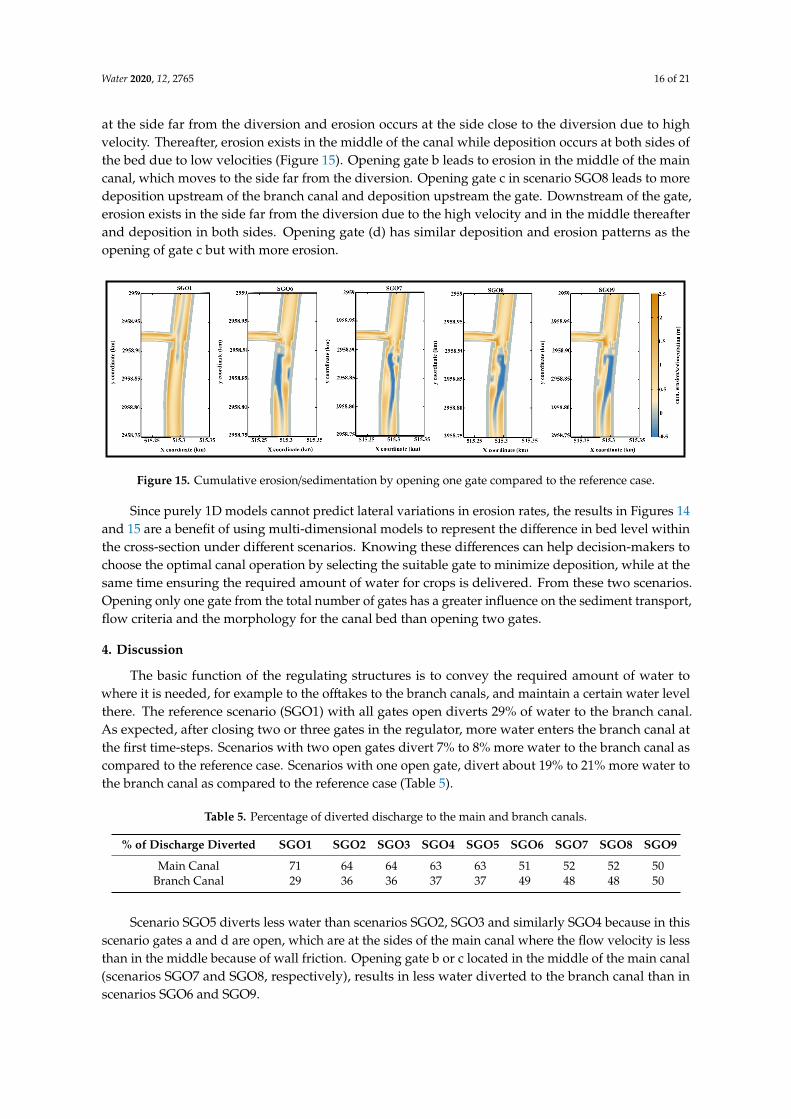
The basic function of the regulating structures is to convey the required amount of water towhere it is needed, for example to the offtakes to the branch canals, and maintain a certain water levelthere. The reference scenario (SGO1) with all gates open diverts 29% of water to the branch canal.As expected, after closing two or three gates in the regulator, more water enters the branch canal atthe first time-steps. Scenarios with two open gates divert 7% to 8% more water to the branch canal ascompared to the reference case. Scenarios with one open gate, divert about 19% to 21% more water tothe branch canal as compared to the reference case (Table 5).
Table 5. Percentage of diverted discharge to the main and branch canals.
% of Discharge Diverted SGO1 SGO2 SGO3 SGO4 SGO5 SGO6 SGO7 SGO8 SGO9
Main Canal 71 64 64 63 63 51 52 52 50Branch Canal 29 36 36 37 37 49 48 48 50
Scenario SGO5 diverts less water than scenarios SGO2, SGO3 and similarly SGO4 because in thisscenario gates a and d are open, which are at the sides of the main canal where the flow velocity is lessthan in the middle because of wall friction. Opening gate b or c located in the middle of the main canal(scenarios SGO7 and SGO8, respectively), results in less water diverted to the branch canal than inscenarios SGO6 and SGO9.

Water 2020, 12, 2765 17 of 21
Comparing the different gate operation scenarios with one or two gates open, it is clear that notonly the number but also the location of the selected gate(s) has an impact on sediment deposition.Opening the gate which is at the side of the offtake leads to less sediment deposition at the upstream ofthe regulating gates (Table 6). Opening the farther gate leads to higher sediment deposition at theintake. This deposition will not only alter the hydrodynamic characteristics but also morphologiccharacteristics of the canal, which can result in system inefficiencies as regulating gates are of crucialimportance. The sediment depositions around structures are harder to remove and manage.
Table 6. Percentage of sediment diverted and stored at the main and branch canals for different scenarios.
At the Main Canal
% of sediment SGO1 SGO2 SGO3 SGO4 SGO5 SGO6 SGO7 SGO8 SGO9
Deposited along the maincanal before the diversion 79 81 80 80 81 84 84 84 84
Diverted to branch canal 6 8 8 7 8 7 8 8 7Stored at u/s of the gate 2 0 0 0 0 0 0 0 0Deposited along the maincanal d/s the diversion 14 12 12 13 11 9 8 8 9
Total % 100 100 100 100 100 100 100 100 100
At the branch canal
Deposited at branch canal 78 94 95 94 94 92 92 93 93Transported out of thebranch canal 22 6 5 6 6 8 8 7 7
Total % 100 100 100 100 100 100 100 100 100
The results in Table 6 show that when one gate is opened, the amount of deposited sediments in theupstream part of the main canal is higher than in scenarios with two open gates and the reference case,because in the latter scenarios more water, and hence more sediments, flow towards downstream ofthe main canal. Opening gates at the diversion side convert more water and sediments to downstreamof main canal than when opening gates at the opposite side. Gates on the opposite side leads tohaving less sediment transport capacity and consequently higher deposition which is transported tothe branch. The sediment stored at the branch canal is around 2% in the reference scenario while anegligible amount is stored in the other scenarios.
Among the scenarios with one open gate, the location of the gate has a small impact on theamount of sediment diverted to the branch canal. In scenarios SGO6 and SGO9 the sediment is slightlyless compared to other scenarios. Although the difference is small, it is worth mentioning that gateoperation does have an impact on the sedimentation and erosion of the branch canal.
Additionally, in scenarios of two open gates, the amount of water transferred to the branch canalin the case of SGO4 is more than the reference case, SGO2 and SGO3 and similar to SGO5 as shown inTable 5. On the other hand, the amount of sediment transferred to the branch canal in the case of SGO4is less than other scenarios of two open gates, as shown in Table 6.
In scenarios of one gate open, the amount of water transferred to the branch canal in the case ofSGO9 is more than other scenarios as shown in Table 5. On the other hand, the amount of sedimenttransferred to the branch canal in the case of SGO9 is less than SGO7, SGO8 and similar to SGO6 asshown in Table 6.
In practice, usually, it is preferred for gate operations to have less effect on the canal shape, in thiscase, the operation of the gate SGO4 seems a better choice among the scenarios with two open gates.The operation of the gate SGO9 seems a better choice among the scenarios with one open gate. This hasensured delivering a higher amount of water to the branch canal with fewer sediments.
A slight change in hydrodynamic characteristics changes the sediment transport mechanism andthus the canal morphology, which in turn changes the water flow features in the canal [3]. The resultsshow that because of gate operation the change in the flow characteristics alters the amount of sediment
Water 2020, 12, 2765 18 of 21
passing through each cross-section different for each scenario. This means that gate operation has asignificant effect on the hydrodynamic as well as the morphologic parameters in an irrigation system [3].Gate operation can be used as not only the as diverting the water but also as a sediment managementtechnique. The incoming flow through time can erode the accumulated sediment and flush it away.This is because of the change in the canal properties and the hydraulics of the canal. For this reason,it can be said that there is constant sediment erosion and deposition until the equilibrium state isreached, which can occur only in the case of non-cohesive sediments.
Operating the gate at the side of the offtake can minimize the sediment deposition at the entranceof the offtake; however, if the same gates are regularly opened, the canal geometry will be permanentlyaltered due to the deposition and erosion resulted from this gate operation, which is not appropriatefor equitable water distribution and for the proper system functioning. Additionally, the depositedsediments during one gate operation can be removed during the other [16].
The results from comparison of the scenarios show that the number of gates opened as wellas their location has an impact on sedimentation and erosion patterns in the both the main andbranch canal. Not only the amount of sediment deposition but also the location in the cross sectionof the canal depends on the gate selection. Therefore, a canal operation plan along with the gateoperation schedules can help to increase the canal efficiency and to reduce sediment removal costs.Alternating the gates to be opened during the irrigation period can help to reduce the sedimentsaround the flow control structures, while at the same time delivering sufficient water to the branchcanals. Sediment depositions can be eroded with the help of the canal operation itself, by alternatingthe gate to be opened, without investing extra money and labor for the cleaning process.
This paper considers non-cohesive sediments only. In reality, many irrigation systems take waterfrom rivers which contain a mix of cohesive and non-cohesive sediments. This shall be considered infuture research.
5. Conclusions
The study confirms that gate operations have a significant impact on the overall hydrodynamicand morphologic behavior of the irrigation system [43]. The simulations using a multi-dimensionalnumerical showed that opening the gate on the side of offtake resulted in less deposition of sediment atthe entrance of the offtake than when the gate on the other side of the offtake was opened. This meansthat the selection of gates to be opened for delivering a certain amount of water has a major impacton the spatial sediment erosion and deposition patterns, and it shows the benefit of using suchmulti-dimensional simulation models. An analysis using merely a 1D model, as has been the de factostandard until this date, would have missed such asymmetric channel developments.
Furthermore, the simulations showed that the gate selection did not only impact the main canal,but it also extended to the branch canal. Although a primarily one-dimensional morphological responsewas observed both upstream and downstream of the closed gates, those erosion and deposition patternsinclude a secondary asymmetric distribution along the canal and within the cross-section. Again,this supports the need for using multi-dimensional models for such situations in order to obtain abetter estimate of the maintenance costs under various scenarios. While 1D models provide insight inthe mean depositional pattern in the longitudinal direction of irrigation canals, asymmetric depositionpatterns can only be resolved by including the second spatial dimension in the simulation.
All simulations reported in this paper were carried out in both depth-averaged (2D) and 3Dhydrostatic mode using five layers. While the 3D mode provides a slightly better description of thephysics involved, the running times are quite long for large irrigation canal networks. Compared to1D models, the use of Delft3D run in 2D mode has a clear benefit by providing an estimate of theasymmetric development of the hydraulics and morphology, while avoiding the long simulation timesof 3D models [43]. However, for the simulations considered here the extra simulation time of the 3Dmodels has not shown a significant benefit for this type of application.

Water 2020, 12, 2765 19 of 21
Supplementary Materials: The following are available online at http://www.mdpi.com/2073-4441/12/10/2765/s1. Other helpful scenarios results are available online at: https://drive.google.com/open?id=1OJcf0Oueq1ZDENKaSWitifs0riPvR1HQ.
Author Contributions: S.T. carried out this research, conceived ideas and wrote the paper and revised it. B.J.took part in the implementation, analysis, guiding of the ideas. J.R.Y. participated in writing the first draft of thepaper and in constructing the grid for the case study. F.X.S. participated in guiding the ideas. C.d.F. supervised andtook part in the implementation, analysis, guiding the ideas and in the revising process. All authors have readand agreed to the published version of the manuscript.
Funding: This research received no external funding.
Acknowledgments: The authors show their appreciation K.P. Paudel and SMIS for their field data and reportsthat have other data helpful for this research. The technical support from Deltares is really appreciated,especially Edward Melger.
Conflicts of Interest: The authors declare no conflict of interest.
References
1. Depeweg, H.; Paudel, K.P.; Méndez, N. Sediment Transport in Irrigation Canals: A New Approach;CRC Press/Balkema: Leiden, The Netherlands, 2014.
2. Osman, I.S.; Schultz, B.; Osman, A.; Suryadi, F. Simulation of fine sediment transport in irrigation canals ofthe gezira scheme with the numerical model FSEDT. J. Irrig. Drain. Eng. 2016, 142. [CrossRef]
3. Munir, S. Role of Sediment Transport in Operation and Maintenance of Supply and Demand Based Irrigation Canals:Application to Machai Maira Branch Canals: UNESCO-IHE; CRC Press/Balkema: Leiden, The Netherlands, 2011.
4. Dal Sasso, S.F.; Sole, A.; Pinzón, A.B.; Medina, V.; Mirauda, D.; Plantamura, A.V.; Giosa, L.; Guariglia, A.Analysis of river bed dynamic evolution following a landslide dam. La Houille Blanche 2015, 88–95. [CrossRef]
5. Shimizu, Y.; Nelson, J.; Arnez Ferrel, K.; Asahi, K.; Giri, S.; Inoue, T.; Iwasaki, T.; Jang, C.L.; Kang, T.; Kimura, I.Advances in computational morphodynamics using the International River Interface Cooperative (iRIC)software. Earth Surf. Process. Landf. 2020, 45, 11–37. [CrossRef]
6. Depeweg, H.; Paudel, K. Sediment transport problems in Nepal evaluated by the SETRIC model. Irrig. Drain.2003, 52, 247–260. [CrossRef]
7. Paudel, K.P. Role of Sediment in the Design and Management of Irrigation Canals: Sunsari Morang IrrigationScheme, Nepal: UNESCO-IHE; CRC Press/Balkema: Leiden, The Netherlands, 2010.
8. Theol, S.; Jagers, B.; Suryadi, F.; De Fraiture, C. The role of operation in reducing problems with cohesive andnon-cohesive sediments in irrigation canals. Water 2019, 11, 2572. [CrossRef]
9. Theol, S.; Jagers, B.; Suryadi, F.; De Fraiture, C. The use of 2D/3D models to show the differencesbetween cohesive and non-cohesive sediments in irrigation systems. Am. J. Irrig. Drain. Eng. (ASCE)2020. forthcoming.
10. Acuña, G.J.; Ávila, H.; Canales, F.A. River model calibration based on design of experiments theory. A casestudy: Meta River, Colombia. Water 2019, 11, 1382. [CrossRef]
11. Berchtold, T.; Weitbrecht, V.; Vetsch, D.; BOES, R. Numerical modelling of bed level evolution in a channelenlargement. In Proceedings of the RCEM 2011: Proceedings of the 7th IAHR Symposium of River,Coastal and Estuarine Morphodynamics, Beijing, China, 6–8 September 2011; pp. 1425–1435.
12. Roelvink, D.; Reniers, A.; Van Dongeren, A.; De Vries, J.V.T.; McCall, R.; Lescinski, J. Modelling storm impactson beaches, dunes and barrier islands. Coast. Eng. 2009, 56, 1133–1152. [CrossRef]
13. Villaret, C.; Hervouet, J.-M.; Kopmann, R.; Merkel, U.; Davies, A.G. Morphodynamic modeling using theTelemac finite-element system. Comput. Geosci. 2013, 53, 105–113. [CrossRef]
14. Deltares. Delft3D-Flow User Manual; Deltares: Delft, The Netherlands. Available online: https://oss.deltares.nl/documents/183920/185723/Delft3D-FLOW_User_Manual.pdf (accessed on 17 September 2020).
15. Lesser, G.R.; Roelvink, J.v.; Van Kester, J.; Stelling, G. Development and validation of a three-dimensionalmorphological model. Coast. Eng. 2004, 51, 883–915. [CrossRef]
16. Yangkhurung, J.R. Effect of Canal Operation on Sedimentation and Erosion in Irrigation Canals: A Case Study inSunsari Morang Irrigation System, Nepal; UNESCO-IHE: Delft, The Netherlands, 2018.
17. Mishra, S.K. Draft Report On Main Irrigation Canal Operation Plan For Crops In Sitagunj Secondary Canal (S9)Irrigation System; Department of Irrigation-IWRMP: Katmandu, Nepal, 2016.

Water 2020, 12, 2765 20 of 21
18. Department of Irrigation. Design Report Vol-I, Main Report and Appendices; Prepared by NEDECO forSunsari Morang Irrigation Project Stage III (Phase-I), Department of Irrigation, Ministry of Water Resources:Katmandu, Nepal, 2003.
19. Chow, T.V. Open-Channel Hydraulics; McGraw-Hill: New York, NY, USA, 1959; Volume 1.20. Renault, D.; Wahaj, R. MASSCOT: A Methodology to Modernize Irrigation Services and Operation in Canal Systems.
Applications to Two Systems in Nepal Terai: Sunsari Morang Irrigation System and Narayani Irrigation System;FAO: Rome, Italy, 2006; pp. 1–42.
21. Javernick, L.; Hicks, D.; Measures, R.; Caruso, B.; Brasington, J. Numerical modelling of braided rivers withstructure-from-motion-derived terrain models. River Res. Appl. 2016, 32, 1071–1081. [CrossRef]
22. Flokstra, C. Modelling of submerged vanes. J. Hydraul. Res. 2006, 44, 591–602. [CrossRef]23. Parsapour-Moghaddam, P.; Rennie, C.D. Hydrostatic versus nonhydrostatic hydrodynamic modelling of
secondary flow in a tortuously meandering river: Application of Delft3D. River Res. Appl. 2017, 33, 1400–1410.[CrossRef]
24. Lesser, G.R. An Approach to Medium-Term Coastal Morphological Modelling: UNESCO-IHE; CRC Press/ Balkema:Leiden, The Netherlands, 2009; p. 255.
25. Roelvink, J.; Van Banning, G. Design and development of DELFT3D and application to coastalmorphodynamics. Oceanogr. Lit. Rev. 1995, 11, 925.
26. Elias, E.; Walstra, D.; Roelvink, J.; Stive, M.; Klein, M. Hydrodynamic validation of Delft3D with fieldmeasurements at Egmond. In Proceedings of the 27th International Conference on Coastal Engineering(ICCE), Sydney, Australia, 16–21 July 2000; pp. 2714–2727.
27. Van der Wegen, M.; Jaffe, B.; Roelvink, J. Process-based, morphodynamic hindcast of decadal depositionpatterns in San Pablo Bay, California. J. Geophys. Res. Earth Surf. 2011, 116, 1856–1887. [CrossRef]
28. Gebrehiwot, K.A.; Haile, A.M.; De Fraiture, C.; Chukalla, A.D.; Tesfa-alem, G.E. Optimizing flood andsediment management of spate irrigation in Aba’ala Plains. Water Resour. Manag. 2015, 29, 833–847.[CrossRef]
29. Theol, A.S.; Jagers, B.; Suryadi, F.; de Fraiture, C. The use of Delft3D for irrigation systems simulations.Irrig. Drain. 2019, 68, 318–331. [CrossRef]
30. De St Venant, B. Theorie du mouvement non-permanent des eaux avec application aux crues des rivers et al’introduntion des Marees dans leur lit. Acad. de Sci. Comptes Redus 1871, 73, 148–154.
31. De SAINT-VENANT, B. AJC (1871b). Théorie et Equations Générales du Mouvement Non Permanent desEaux, avec Application aux Crues des Rivières et à l’Introduction des Marées dans leur Lit (2ème Note).Comptes Rendus des Séances de l’Académie des Sci. 1871, 73, 237–240.
32. Phillips, N.A. A coordinate system having some special advantages for numerical forecasting. J. Meteorol.1957, 14, 184–185. [CrossRef]
33. Stelling, G.S.; Leendertse, J.J. Approximation of convective processes by cyclic AOI methods. In Proceedingsof the Estuarine and Coastal Modeling, Tampa, FL, USA, 13–15 November 1992; pp. 771–782.
34. Postma, L.; Stelling, G.S.; Boon, J. 3-dimensional water quality and hydrodynamic modelling in Hong KongIII. Stratification and water quality. In Proceedings of the Second International Symposium on EnvironmentalHydraulics, Hong Kong, China, 16–18 December 1998; Lee, J.H.W., Jayawardena, Q.W., Wang, Z.Y., Eds.;Balkema: Rotterdam, The Netherlands, 1999; pp. 43–49.
35. Rozovskiı̆, I.L.V. Flow of Water in Bends of Open Channels; Academy of Sciences of the Ukrainian SSR: Kiev,Ukraine, 1957.
36. Stelling, G.S.; Van Kester, J.A.T.M. On the approximation of horizontal gradients in sigma co-ordinates forbathymetry with steep bottom slopes. Int. J. Numer. Methods Fluids 1994, 18, 915–935. [CrossRef]
37. Van Rijn, L.C. Principles of Sediment Transport in Rivers, Estuaries and Coastal Seas; Aqua Publications:Amsterdam, The Netherlands, 1993.
38. Soulsby, R. Dynamics of Marine Sands: A Manual for Practical Applications; Thomas Telford: London, UK, 1997.39. De Goede, E.D. Historical overview of 2D and 3D hydrodynamic modelling of shallow water flows in the
Netherlands. Ocean Dyn. 2020, 70, 521–539. [CrossRef]40. Nippon, K. Project Operation Plan; Sunsari Morang Irrigation Project; Ministry of Water Resources, Singhdurbar:
Kathmandu, Nepal, 1995.41. Devkota, L.; Crosato, A.; Giri, S. Effect of the barrage and embankments on flooding and channel avulsion
case study Koshi River, Nepal. Rural Infrastruct. 2012, 3, 124–132.

Water 2020, 12, 2765 21 of 21
42. DFID, M.M. Equity, Irrigation and Poverty, Guidelines for Sustainable Water Management; CambridgeCB1 2RS UK: Final Report; 2006. Available online: https://assets.publishing.service.gov.uk/media/57a08c17ed915d3cfd001172/R8338EIP_Final_Report_Appendices_Jan2007.pdf (accessed on20 September 2020).
43. Theol, S.A.A.-A. The Use of Delft3D to Simulate the Deposition of Cohesive and Non-Cohesive Sediments in IrrigationSystems; CRC Press: Boca Raton, FL, USA, 2020.
© 2020 by the authors. Licensee MDPI, Basel, Switzerland. This article is an open accessarticle distributed under the terms and conditions of the Creative Commons Attribution(CC BY) license (http://creativecommons.org/licenses/by/4.0/).