e0017 r.i.t.e. rice improvement through technology and ... · rice improvement through technology...
TRANSCRIPT

R.I.T.E.
Program supported byMississippi Rice Promotion Board
andMississippi State University Extension Service
R.I.T.E.Rice Improvement Through Technology and Education
Annual Report2006
Program

R.I.T.E. Program2006 Annual Report
Program SupportMississippi Rice Promotion Board
Mississippi State University Extension Service
Program CoordinatorNathan Buehring
Program CooperatorsSteve Martin, Economic Analysis
Tim Walker, Soil FertilityJim Thomas, Irrigation
Other CooperatorsKeith CrouseJim Robbins
Gabe Sciumbato
Area AgentsJerry Singleton
Art Smith
Participating CountiesBolivarLeflore
SunflowerTunica
Washington
1

Contents
2007 R.I.T.E. Proposal . . . . . . . . . . . . . . . . . . . . . . . . . . . . . . . . . . . . . . . . . . . . . . . . . . . . . . . . . . . . . 3
2006 Rice Verification Program Summary . . . . . . . . . . . . . . . . . . . . . . . . . . . . . . . . . . . . . . . . . . . . . . . . 4
2006 Year-End R.I.T.E. Program Summary . . . . . . . . . . . . . . . . . . . . . . . . . . . . . . . . . . . . . . . . . . . . . . . . 5
Annual Economic Summaries of R.I.T.E. Fields. . . . . . . . . . . . . . . . . . . . . . . . . . . . . . . . . . . . . . . . . . . . . . 6
Inputs, Costs, and Returns for 2006 R.I.T.E. Fields. . . . . . . . . . . . . . . . . . . . . . . . . . . . . . . . . . . . . . . . . . . 8
2006 R.I.T.E. Program Rice Demonstrations . . . . . . . . . . . . . . . . . . . . . . . . . . . . . . . . . . . . . . . . . . . . . . 25
2006 R.I.T.E. Program Disease Monitoring Plots . . . . . . . . . . . . . . . . . . . . . . . . . . . . . . . . . . . . . . . . . . . 27
Bolivar County 1 . . . . . . . . . . . . . . . . . . . . . . . . . . . . . . . . . . . . . . . . . . . . . . . . . . . . . . . 28Bolivar County 2 . . . . . . . . . . . . . . . . . . . . . . . . . . . . . . . . . . . . . . . . . . . . . . . . . . . . . . . 30CL151 Fungicide Rate and Timing . . . . . . . . . . . . . . . . . . . . . . . . . . . . . . . . . . . . . . . . . . . 32
2

2007 R.I.T.E. ProposalThe R.I.T.E. Program (Rice Improvement ThroughTechnology and Education) was initiated in 2005 to helprefine our current recommendations for rice production inMississippi. This program helps educate rice producersabout our current recommendations and allows them tosee how they perform on their farms. This program alsoserves as a tool to test new production technologies andideas to increase the profitability in rice production. Thespecific objectives of this program include the following:
1. Increase the awareness of our current productionrecommendations to increase profits for Mississippirice producers.
2. Refine our current production recommendations basedon findings within the program.
3. Evaluate new production technologies and ideas in aproduction setting to increase profits.
4. Take information and new innovative ideas fromresearch to the field.
5. Identify production problems that need to be furtherinvestigated by researchers.
6. Develop an on-farm economic database to helpimprove our current economic analysis procedures.
JustificationIn recent years, the cost of inputs in rice has steadilyincreased, mainly due to increased fuel and fertilizer costs.With the increased cost of production, there is a need forreducing input costs while maximizing profits.
ApproachFor each field within the program, the producer is asked tocarry out the most economical recommendation given tothem by the program coordinator. Every recommendation isbased on the specific needs of each individual field enrolledin the program. The following production practices are imple-mented within the program:
1. Representative soil sampling helps to determine fertilityneeds and possibly to identify problematic areas with-in a field before planting.
2. Variety selection for the producer is determined usingthe state variety trial information, along with informa-tion about the producer’s needs and past experiences.
3. Weed control recommendations are based on historicweed problems and weeds present throughout thegrowing season.
4. Disease control recommendations are based on vari-ety/hybrid susceptibility and presence of key diseaseswithin the field.
5. Insect control recommendations are based on historicinsect problems and insects present throughout thegrowing season.
6. Water conservation is advised to help reduce theinput cost associated with irrigation.
7. Yields of the program field are determined and com-pared to on-farm and state averages.
8. Returns from each program field are calculated tobecome a major emphasis within this program.
Producers will participate in the program for twoyears unless an increase in production and profit can beobtained. Participating area agents continue to be activein this program.
3

2006 Rice Verification Program SummaryTitleRice Improvement Through Technology and Education (R.I.T.E.)
Project CoordinatorNathan Buehring
Technical SummaryThis was the second year for the R.I.T.E. program to be conducted. Eightproduction fields, from Tunica to Washington counties, were included inthe program in 2006. These fields varied not only in location, but also intillage systems, rotation patterns, and varieties. Each field was managedas a total program approach, from variety selection to harvest. The recom-mendations were based on the specific in-field needs to increase the pro-ducer’s profits. These fields were scouted at a minimum of once a weekthroughout the growing season. Producers contacted scouts if any prob-lems arose between weekly scouting dates. The ultimate goal of this pro-gram was to increase Mississippi rice yields and profits. The averageyield for the R.I.T.E. program was 182 bu/acre. Two R.I.T.E fields wereplanted to CL131, which averaged 173 bu/acre. The remaining sixfields were planted to Cocodrie, Cheniere, XP710, and Hidalgo, andeach of these averaged 185 bu/acre.
Comparison of Average R.I.T.E. Yields with State Average Yields
2006 2006 2006 CL131 Conventional
State Average Yield 156
R.I.T.E. Average Yield 182 173 185
Number of R.I.T.E. Fields 8 2 6
R.I.T.E. Average Yield Increase 26 17 29Over 2005 State Average
(bu/A)
4

2006 Year-End R.I.T.E. Program SummaryDue to timely rainfall and warm temperatures early in thespring, rice stands were very uniform with a good standdensity. The R.I.T.E. fields were flushed on average lessthan one time.
Glyphosate drift did affect three of the R.I.T.E. fields in2006. On two of the fields, yield did not appear to beaffected by the glyphosate drift. However, it did requireadditional expenses in herbicides and flushing. On thefield (Tunica XP710) that was affected the most,glyphosate drift did appear to affect the rice yields due tostand reduction. Our disease-monitoring plot at this loca-tion had to be abandoned due to total stand loss withsome varieties.
Different weed control programs were used on eachR.I.T.E. field this year. Each weed control programdepended on weed spectrum and size. Weed control in2006 was easier due to timely rainfalls. Clincher wasused on some fields to clean up any escaped grass thatcould reduce rice yields.
Five fields within the R.I.T.E. program were treatedwith a fungicide. All fields (two CL131, one Cocodrie,one Cheniere, and one Hidalgo) were treated for sheathblight and kernel smut prevention. The recommended fun-gicide treatment was based on the target disease andprice of the fungicide.
Rice water weevils were generally not a problem in2006. Only one field (Tunica XP710) was affected byrice water weevils. This problem stemmed from a thinstand due to glyphosate drift.
Rice stinkbug pressure this year was relatively light.An insecticide application was required on only oneR.I.T.E. field.
The average daytime and nighttime temperatureswere above normal in 2006. At Stoneville, the averagedaytime temperature during heading was comparable
to 2005 (about 93.4 °F). However, the average night-time temperature was approximately 1.2 °F cooler thanin 2005 at heading. Some kernel blanking wasobserved in 2006; however, it was not to the extentobserved in 2005.
Harvesting conditions in 2006 were excellent. Onlyone R.I.T.E. field had lodging problems (Bolivar CountyHidalgo) due to a severe thunderstorm. Also, Hidalgo his-torically has had a lodging problem.
This year was an excellent year for rice grain yields.The current U.S. Department of Agriculture projectionshave Mississippi setting a record yield at 156 bu/acre.The R.I.T.E. fields in 2006 averaged 182 bu/acre, whichis 26 bu/acre better than the current state average.Following a timely management plan and having anexcellent rice-growing environment helped boost riceyields and returns in 2006.
The average total direct expenses for the R.I.T.E. fieldsthis year were $443.83/acre. The average total directexpenses in 2006 increased approximately $45.53/acrefrom 2005, mainly due to an increase in diesel fuel cost.
Even though the input costs increased in 2006, higherrice yields and prices helped offset these costs. The aver-age return above total specified expenses in 2006 was$209.23/acre. When looking at CL131 alone, the aver-age return above total specified expenses was$122.50/acre. When looking at conventional vari-eties/hybrids (excluding Hidalgo), the average returnabove total specified expenses was $205.66/acre.
In addition to the eight verification fields, one on-farmdemonstration and two disease-monitoring trialswere con-ducted. The results from the demonstration and diseasemonitoring trials are included in this booklet and can befound starting on page 25.
5

Annual Economic Summaries of R.I.T.E. Fields

Table 1. 2006 R.I.T.E. Fields
CCoouunnttyy VVaarriieettyy RRoottaattiioonn11 TTiillllaaggee22 bbuu//AA TTDDEE33 TTFFEE44 TTSSEE55 RRAATTSSEE66
Bolivar CL131 SR Stale-Seedbed 172 468.86 106.27 575.13 112.87
Bolivar Cocodrie SR Conventional 170 406.94 100.60 507.54 172.46
Bolivar Hidalgo SR No-till 176 452.55 106.10 558.65 400.55
Leflore Cocodrie SSR Stale-Seedbed 204 474.71 102.40 577.11 238.89
Sunflower Cheniere RR Conventional 197 472.28 119.50 591.78 196.22
Tunica Cocodrie SR Stale-Seedbed 184 370.39 101.62 472.01 263.99
Tunica XP710 RR Conventional 178 448.65 106.61 555.26 156.74
Washington CL131 SR Stale-Seedbed 174 456.29 107.58 563.87 132.13
Price per bushel for all economic analysis is $4/bu except for Hildago in Bolivar County, where $1.45/bu premium was added.
1(Rotation) SR: Soybean/Rice (1:1), SSR: Soybean/Soybean/Rice (2:1), RR: Rice/Rice (1:1)2(TDE) Total Direct Expenses3(TFE) Total Fixed Expenses4(TSE) Total Specified Expenses5(RATSE) Returns Above Total Specified Expenses
Table 2. 2005 R.I.T.E. Fields
CCoouunnttyy VVaarriieettyy RRoottaattiioonn11 TTiillllaaggee22 bbuu//AA TTDDEE33 TTFFEE44 TTSSEE55 RRAATTSSEE66
Bolivar CL161 SR Stale-Seedbed 140 434.73 76.98 511.71 –45.51
Bolivar CL161 SR Conventional 147 396.52 76.04 472.56 16.95
Leflore Cocodrie SSR Stale-Seedbed 165 414.94 73.20 488.14 61.31
Tunica Cocodrie RR Conventional 154 378.10 71.54 449.64 63.18
Washington Cocodrie SR No-till 141 367.21 66.29 433.5 36.03
Price per bushel for all economic analysis is $3.33/bu.
1(Rotation) SR: Soybean/Rice (1:1), SSR: Soybean/Soybean/Rice (2:1), RR: Rice/Rice (1:1)2(TDE) Total Direct Expenses3(TFE) Total Fixed Expenses4(TSE) Total Specified Expenses5(RATSE) Returns Above Total Specified Expenses
7

Inputs, Costs, and Returns for 2006 R.I.T.E. Fields

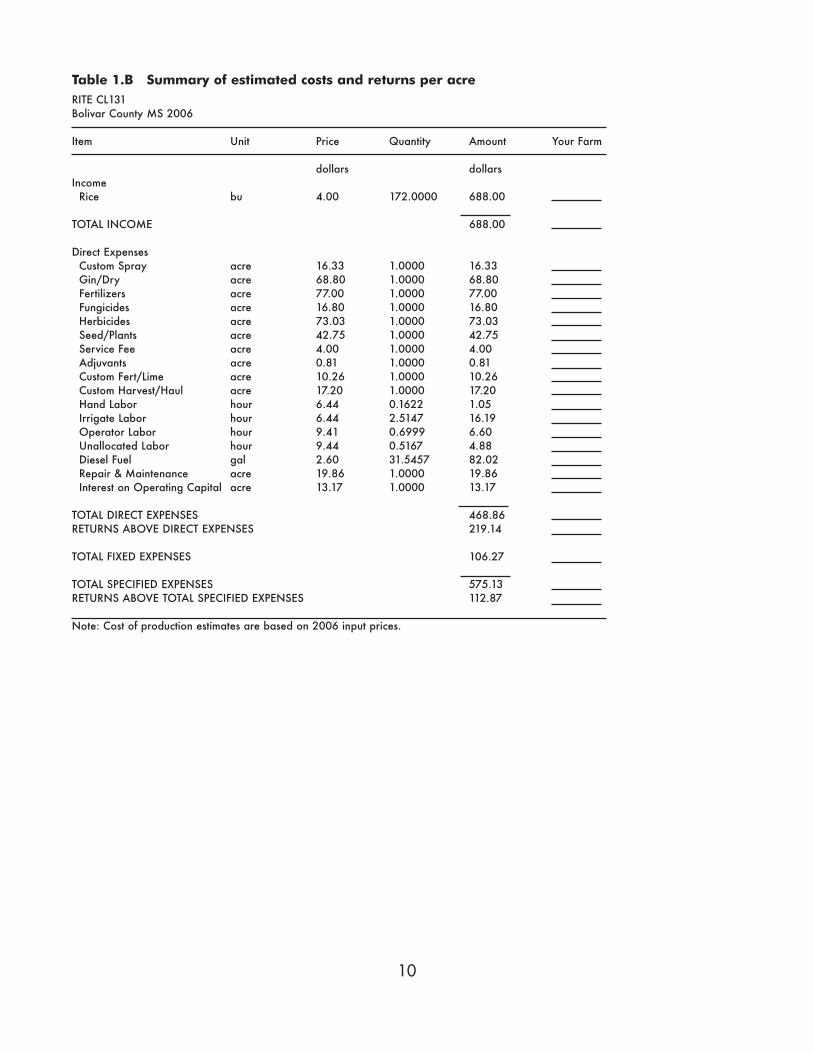
Table 1.B Summary of estimated costs and returns per acreRITE CL131 Bolivar County MS 2006
Item Unit Price Quantity Amount Your Farm
dollars dollars Income
Rice bu 4.00 172.0000 688.00
TOTAL INCOME 688.00
Direct Expenses Custom Spray acre 16.33 1.0000 16.33 Gin/Dry acre 68.80 1.0000 68.80 Fertilizers acre 77.00 1.0000 77.00 Fungicides acre 16.80 1.0000 16.80 Herbicides acre 73.03 1.0000 73.03 Seed/Plants acre 42.75 1.0000 42.75 Service Fee acre 4.00 1.0000 4.00Adjuvants acre 0.81 1.0000 0.81Custom Fert/Lime acre 10.26 1.0000 10.26Custom Harvest/Haul acre 17.20 1.0000 17.20Hand Labor hour 6.44 0.1622 1.05Irrigate Labor hour 6.44 2.5147 16.19Operator Labor hour 9.41 0.6999 6.60Unallocated Labor hour 9.44 0.5167 4.88Diesel Fuel gal 2.60 31.5457 82.02Repair & Maintenance acre 19.86 1.0000 19.86Interest on Operating Capital acre 13.17 1.0000 13.17
TOTAL DIRECT EXPENSES 468.86 RETURNS ABOVE DIRECT EXPENSES 219.14
TOTAL FIXED EXPENSES 106.27
TOTAL SPECIFIED EXPENSES 575.13 RETURNS ABOVE TOTAL SPECIFIED EXPENSES 112.87
Note: Cost of production estimates are based on 2006 input prices.
10


Table 2.B Summary of estimated costs and returns per acreRITE Cocodrie Bolivar County MS 2006
Item Unit Price Quantity Amount Your Farm
dollars dollars Income
Rice bu 4.00 170.0000 680.00
TOTAL INCOME 680.00
Direct Expenses Custom Spray acre 6.63 1.0000 6.63 Gin/Dry acre 68.00 1.0000 68.00 Fertilizers acre 70.75 1.0000 70.75 Herbicides acre 71.23 1.0000 71.23 Seed/Plants acre 21.00 1.0000 21.00 Service Fee acre 2.00 1.0000 2.00Adjuvants acre 0.18 1.0000 0.18Custom Fert/Lime acre 25.65 1.0000 25.65Custom Harvest/Haul acre 17.00 1.0000 17.00Hand Labor hour 6.44 0.0853 0.54Irrigate Labor hour 6.44 2.3750 15.29Operator Labor hour 9.41 0.6326 5.95Unallocated Labor hour 9.42 0.4625 4.36Diesel Fuel gal 2.60 29.4877 76.66Repair & Maintenance acre 18.97 1.0000 18.97Interest on Operating Capital acre 2.73 1.0000 2.73
TOTAL DIRECT EXPENSES 406.94 RETURNS ABOVE DIRECT EXPENSES 273.06
TOTAL FIXED EXPENSES 100.60
TOTAL SPECIFIED EXPENSES 507.54 RETURNS ABOVE TOTAL SPECIFIED EXPENSES 172.46
Note: Cost of production estimates are based on 2006 input prices.
12


Table 3.B Summary of estimated costs and returns per acreRITE Hidalgo Bolivar County MS 2006
Item Unit Price Quantity Amount Your Farm
dollars dollars Income
Rice bu 5.45 176.0000 959.20
TOTAL INCOME 959.20
Direct Expenses Custom Spray acre 11.15 1.0000 11.15 Gin/Dry acre 70.40 1.0000 70.40 Fertilizers acre 68.50 1.0000 68.50 Fungicides acre 16.87 1.0000 16.87Herbicides acre 88.82 1.0000 88.82 Seed/Plants acre 21.00 1.0000 21.00 Service Fee acre 4.00 1.0000 4.00Adjuvants acre 0.41 1.0000 0.41Custom Fert/Lime acre 25.65 1.0000 25.65Custom Harvest/Haul acre 17.60 1.0000 17.60Hand Labor hour 6.44 0.0898 0.58Irrigate Labor hour 6.44 2.5147 16.19Operator Labor hour 9.41 0.5368 5.06Unallocated Labor hour 9.43 0.3700 3.49Diesel Fuel gal 2.60 29.4143 76.47Repair & Maintenance acre 17.53 1.0000 17.53Interest on Operating Capital acre 10.72 1.0000 10.72
TOTAL DIRECT EXPENSES 452.55 RETURNS ABOVE DIRECT EXPENSES 506.65
TOTAL FIXED EXPENSES 106.10
TOTAL SPECIFIED EXPENSES 558.65 RETURNS ABOVE TOTAL SPECIFIED EXPENSES 400.55
Note: Cost of production estimates are based on 2006 input prices.
14


Table 4.B Summary of estimated costs and returns per acreRITE Cocodrie Leflore County MS 2006
Item Unit Price Quantity Amount Your Farm
dollars dollars Income
Rice bu 4.00 204.0000 816.00
TOTAL INCOME 816.00
Direct Expenses Custom Spray acre 26.03 1.0000 26.03 Gin/Dry acre 81.60 1.0000 81.60 Fertilizers acre 54.00 1.0000 54.00 Fungicides acre 14.51 1.0000 14.51Herbicides acre 96.39 1.0000 96.39 Seed/Plants acre 21.00 1.0000 21.00 Service Fee acre 2.00 1.0000 2.00Adjuvants acre 0.45 1.0000 0.45Custom Fert/Lime acre 20.52 1.0000 20.52Custom Harvest/Haul acre 20.40 1.0000 20.40Hand Labor hour 6.44 0.1042 0.67Irrigate Labor hour 6.44 2.3750 15.29Operator Labor hour 9.41 0.7230 6.81Unallocated Labor hour 9.43 0.5438 5.13Diesel Fuel gal 2.60 29.9227 77.80Gasoline gal 2.87 0.0200 0.06Repair & Maintenance acre 19.06 1.0000 19.06Interest on Operating Capital acre 12.99 1.0000 12.99
TOTAL DIRECT EXPENSES 474.71 RETURNS ABOVE DIRECT EXPENSES 341.29
TOTAL FIXED EXPENSES 102.40
TOTAL SPECIFIED EXPENSES 577.11 RETURNS ABOVE TOTAL SPECIFIED EXPENSES 238.89
Note: Cost of production estimates are based on 2006 input prices.
16
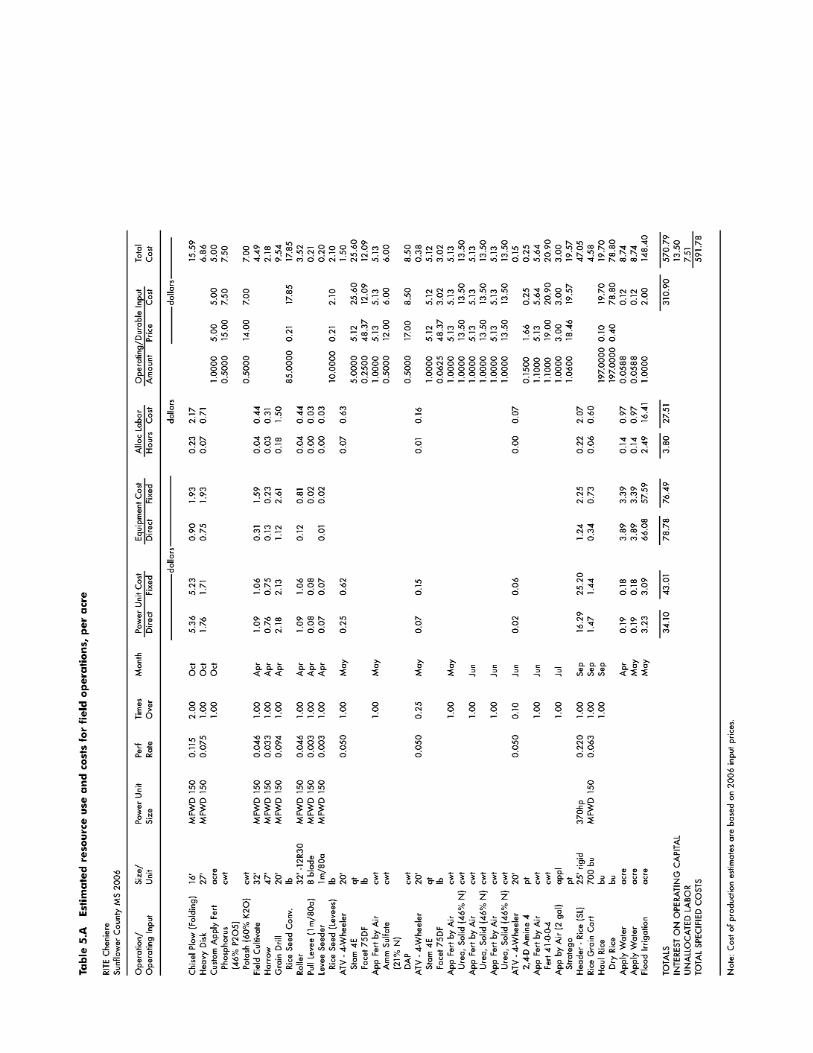

Table 5.B Summary of estimated costs and returns per acreRITE Cheniere Sunflower County MS 2006
Item Unit Price Quantity Amount Your Farm
dollars dollars Income
Rice bu 4.00 197.0000 788.00
TOTAL INCOME 788.00
Direct Expenses Custom Spray acre 3.00 1.0000 3.00 Gin/Dry acre 78.80 1.0000 78.80 Fertilizers acre 90.40 1.0000 90.40 Fungicides acre 19.57 1.0000 19.57Herbicides acre 46.08 1.0000 46.08 Seed/Plants acre 19.95 1.0000 19.95 Service Fee acre 6.00 1.0000 6.00Custom Fert/Lime acre 31.16 1.0000 31.16Custom Harvest/Haul acre 19.70 1.0000 19.70Hand Labor hour 6.44 0.1280 0.83Irrigate Labor hour 6.44 2.6544 17.09Operator Labor hour 9.41 1.0176 9.59Unallocated Labor hour 9.42 0.7964 7.51Diesel Fuel gal 2.60 34.5993 89.96Gasoline gal 2.87 0.0675 0.19Repair & Maintenance acre 22.73 1.0000 22.73Interest on Operating Capital acre 13.50 1.0000 13.50
TOTAL DIRECT EXPENSES 472.28 RETURNS ABOVE DIRECT EXPENSES 315.72
TOTAL FIXED EXPENSES 119.50
TOTAL SPECIFIED EXPENSES 591.78 RETURNS ABOVE TOTAL SPECIFIED EXPENSES 196.22
Note: Cost of production estimates are based on 2006 input prices.
18


Table 6.B Summary of estimated costs and returns per acreRITE XP710 Tunica County MS 2006
Item Unit Price Quantity Amount Your Farm
dollars dollars Income
Rice bu 4.00 184.0000 736.00
TOTAL INCOME 736.00
Direct Expenses Custom Spray acre 4.20 1.0000 4.20 Gin/Dry acre 73.60 1.0000 73.60 Fertilizers acre 54.00 1.0000 54.00 Herbicides acre 41.35 1.0000 41.35 Seed/Plants acre 21.00 1.0000 21.00 Service Fee acre 4.00 1.0000 4.00Adjuvants acre 0.18 1.0000 0.18 Custom Fert/Lime acre 20.52 1.0000 20.52Custom Harvest/Haul acre 18.40 1.0000 18.40Hand Labor hour 6.44 0.0844 0.55Irrigate Labor hour 6.44 2.5147 16.19Operator Labor hour 9.41 0.6312 5.95Unallocated Labor hour 9.45 0.4549 4.30Diesel Fuel gal 2.60 30.9848 80.57Repair & Maintenance acre 18.55 1.0000 18.55Interest on Operating Capital acre 8.92 1.0000 8.92
TOTAL DIRECT EXPENSES 370.39 RETURNS ABOVE DIRECT EXPENSES 365.61
TOTAL FIXED EXPENSES 101.62
TOTAL SPECIFIED EXPENSES 472.01 RETURNS ABOVE TOTAL SPECIFIED EXPENSES 263.99
Note: Cost of production estimates are based on 2006 input prices.
20


Table 7.B Summary of estimated costs and returns per acreRITE XP710 Tunica County MS 2006
Item Unit Price Quantity Amount Your Farm
dollars dollars Income
Rice bu 4.00 178.0000 712.00
TOTAL INCOME 712.00
Direct Expenses Custom Spray acre 9.70 1.0000 9.70 Gin/Dry acre 71.20 1.0000 71.20 Fertilizers acre 55.35 1.0000 55.35 Herbicides acre 62.46 1.0000 62.46Insecticides acre 4.80 1.0000 4.80 Seed/Plants acre 60.00 1.0000 60.00 Service Fee acre 2.00 1.0000 2.00Adjuvants acre 0.18 1.0000 0.18Custom Fert/Lime acre 21.03 1.0000 21.03Custom Harvest/Haul acre 17.80 1.0000 17.80Hand Labor hour 6.44 0.1031 0.67Irrigate Labor hour 6.44 2.3750 15.29Operator Labor hour 9.41 0.7754 7.31Unallocated Labor hour 9.42 0.5910 5.57Diesel Fuel gal 2.60 30.8787 80.29Repair & Maintenance acre 20.58 1.0000 20.58Interest on Operating Capital acre 14.42 1.0000 14.42
TOTAL DIRECT EXPENSES 448.65 RETURNS ABOVE DIRECT EXPENSES 263.35
TOTAL FIXED EXPENSES 106.61
TOTAL SPECIFIED EXPENSES 555.26 RETURNS ABOVE TOTAL SPECIFIED EXPENSES 156.74
Note: Cost of production estimates are based on 2006 input prices.
22


Table 8.B Summary of estimated costs and returns per acreRITE CL131 Washington County MS 2006
Item Unit Price Quantity Amount Your Farm
dollars dollars Income
Rice bu 4.00 174.0000 696.00
TOTAL INCOME 696.00
Direct Expenses Custom Spray acre 25.20 1.0000 25.20 Gin/Dry acre 69.60 1.0000 69.60 Fertilizers acre 54.00 1.0000 54.00 Fungicides acre 24.44 1.0000 24.44Herbicides acre 53.07 1.0000 53.07 Seed/Plants acre 43.65 1.0000 43.65 Service Fee acre 4.00 1.0000 4.00Adjuvants acre 0.36 1.0000 0.36Custom Fert/Lime acre 20.52 1.0000 20.52Custom Harvest/Haul acre 17.40 1.0000 17.40Hand Labor hour 6.44 0.0817 0.53Irrigate Labor hour 6.44 2.5147 16.19Operator Labor hour 9.41 0.7545 7.11Unallocated Labor hour 9.43 0.5659 5.34Diesel Fuel gal 2.60 31.9172 83.01Repair & Maintenance acre 20.41 1.0000 20.41Interest on Operating Capital acre 13.35 1.0000 13.35
TOTAL DIRECT EXPENSES 456.29 RETURNS ABOVE DIRECT EXPENSES 239.71
TOTAL FIXED EXPENSES 107.58
TOTAL SPECIFIED EXPENSES 563.87 RETURNS ABOVE TOTAL SPECIFIED EXPENSES 132.13
Note: Cost of production estimates are based on 2006 input prices.
24

2006 R.I.T.E Program Rice Demonstrations
Demonstrations Supported byMississippi Rice Promotion Board
Mississippi State University Extension Serviceand
Cooperating Companies

Dynasty Seed Treatment Demonstration CooperatorsNolen Cannon, Phil Rizzo, and Gibb Steele
Experimental DesignThree locations (Bolivar, Tunica, and Washington counties)Standard fungicide treatment (Apron plus Maxim) was compared to Dynasty Rice PakOne replication per location
DataStand counts (plants/ft2) and plant heights (inches) were taken before the flood.
LLooccaattiioonn SSttaannddaarrdd ((AApprroonn pplluuss MMaaxxiimm)) DDyynnaassttyy RRiiccee PPaakk
(average plants/ft2)
Tunica 22.3 20.6
Pace 22.5 25.4
Hollandale 24.5 20.7
Average 23.1 22.2
(average plant height)
Tunica 3.2" 3.4"
Pace 5.4" 5.4"
Hollandale 4.9" 5.1"
Average 4.5" 4.6"
These demonstrations showed there was no advantage to using Dynasty Rice Pak asa seed treatment. However, the weather conditions (warm temperatures and adequaterainfall) were excellent for establishing rice stands in 2006. Therefore, these demonstra-tions cannot adequately determine if there is a benefit to using Dynasty Rice Pak.
26

2006 R.I.T.E Program Disease Monitoring Trials
Demonstrations Supported byMississippi Rice Promotion Board
Mississippi State University Extension Serviceand
Cooperating Companies

31/Jan/2007 (2406) Site Description Page 1 of 1
Delta Branch Experiment Station
DDiisseeaassee MMoonniittoorriinnggTrial ID: 2406 Study Director: Dr. Nathan BuehringLocation: Bolivar County - 1 Investigator: Dr. Nathan Buehring
GGeenneerraall TTrriiaall IInnffoorrmmaattiioonnStudy Director: Dr. Nathan Buehring Title: Extension Rice SpecialistInvestigator: Dr. Nathan Buehring Title: Extension Rice Specialist
Trial Location: Bolivar CountyBlanket Treatment Cost: ____________Conducted Under GLP (Y/N): N Conducted Under GEP (Y/N): NGuidelines: __________ Guideline Description: ____________________________
ObjectiveThis study was designed to evaluate current and upcoming varieties for disease resistance. Another objective was to determine ifthere is an economic benefit to applying a foliar fungicide to popular varieties grown in Mississippi. Quilt was applied on July 11,2006, at 21 fl oz/acre. This application was made at the boot split timing. Sheath blight severity was rated visually on a scale from 0to 10 and was light to moderate at this location. Kernel smut was rated on a scale of 0 to 10 and was light at this location. There wasno lodging at this location and very little shattering.
ConclusionsSee means table for average yields. XL723, Cocodrie, Cheniere, CL131, Priscilla, and Wells were the only hybrids/varieties thatreceived a fungicide application. Cheniere and CL131 were the only varieties that resulted in a return on the investment of fungicide.Cheniere resulted in a return of $1/acre and CL131 resulted in a return of $11/acre. Sheath blight pressure was light to moderate;therefore, a foliar fungicide will not always result in a return on the investment unless it is a highly susceptible variety such as CL131.Always scout and monitor your crop closely and base a fungicide application on disease pressure and variety susceptibility.
CCrroopp aanndd PPeesstt DDeessccrriippttiioonnCrop 1: Orysa Rice Variety: MultiplePlanting Date: April 14, 2006 Planting Method: DrilledRate: 80 pounds Depth: 1 inch Perennial Age: ____ _____Row Spacing: 8 inches Spacing Within Row: ____ _____ Seed Bed: FineSoil Temperature: ____ Soil Moisture: Slightly dry Emergence Date: April 21, 2006
SSiittee aanndd DDeessiiggnnPlot Width, Unit: 10 feet Plot Length, Unit: 40 feet Reps: 4Site Type: FieldTillage Type: Conventional-till Study Design: Randomized complete block
Trial Initiation Comments: Quilt at 21 fl oz/acre was applied on July 11, 2006.
Trt No Treatment Application Comment15 Quilt at 21 fl oz/A was applied on July 11, 2006.16 Quilt at 21 fl oz/A was applied on July 11, 2006.17 Quilt at 21 fl oz/A was applied on July 11, 2006.18 Quilt at 21 fl oz/A was applied on July 11, 2006.19 Quilt at 21 fl oz/A was applied on July 11, 2006.20 Quilt at 21 fl oz/A was applied on July 11, 2006.
28

DDiisseeaassee MMoonniittoorriinnggTrial ID: 2406 Study Director: Dr. Nathan BuehringLocation: Bolivar County - 1 Investigator: Dr. Nathan Buehring
Character Rated S. Blight K. Smut Yield Milling MillingRating Data Type Severity Severity Yield Total WholeRating Unit 0-10 0-10 bu % %Rating Date 31/Aug/2006 31/Aug/2006 5/Sep/2006 5/Sep/2006 5/Sep/2006Assessed By Nathan NathanARM Action Codes T1 T2Trt TreatmentNo. Name 1 2 5 7 91 CL XL730 1 cd 3 def 180 a 70 c-g 59 b-f2 CL XP729 1 cd 3 efg 176 ab 70 c-g 58 c-f3 CL161 7 a 4 bcd 153 def 69 g 59 b-f4 CL131 6 ab 6 a 139 f 71 a-e 60 bcd5 CL171 2 c 3 def 151 def 71 a-d 59 b-f6 Priscilla 1 cd 3 efg 165 a-e 70 c-g 61 abc7 XL723 2 c 3 def 180 ab 70 c-g 61 abc8 Cocodrie 6 ab 5 abc 175 abc 70 b-g 60 abc9 Cheniere 5 b 5 abc 176 ab 71 a-d 60 b-e10 Wells 2 cd 3 efg 166 a-d 71 a-f 56 ef11 Trenasse 6 ab 5 abc 148 def 70 d-g 56 f12 Sabine 4 b 5 ab 153 def 70 c-g 60 bcd13 Priscilla 1 cd 4 cde 157 c-f 69 fg 59 b-f14 XL723 - Fungicide Spray 0 d 1 h 177 ab 72 a 62 ab15 Cocodrie - Fungicide Spray 0 cd 2 fgh 179 ab 72 a 64 a16 Cheniere - Fungicide Spray 1 cd 3 def 182 a 71 a-f 62 ab17 CL131 - Fungicide Spray 1 cd 3 efg 147 ef 72 abc 61 abc18 Priscilla - Fungicide Spray 0 d 1 h 162 b-e 69 efg 57 def19 Wells - Fungicide Spray 0 d 1 gh 163 a-e 72 ab 57 c-fLSD (P=.05) 1.8 1.5 18.4 1.8 3.9Standard Deviation 1.3 1.0 13.0 1.1 2.3CV 55.77 33.65 7.92 1.55 3.93Grand Mean 2.3 3.07 164.57 70.61 59.47Bartlett's X2 24.066 19.274 28.067 15.223 15.262P(Bartlett's X2) 0.045* 0.375 0.061 0.647 0.644
Replicate F 1.859 0.870 1.628 1.057 0.355Replicate Prob(F) 0.1475 0.4626 0.1937 0.3580 0.7033Treatment F 13.333 7.330 4.237 2.402 2.791Treatment Prob(F) 0.0001 0.0001 0.0001 0.0124 0.0043
31/Jan/2007 (2406) AOV Means Table Page 1 of 1
Delta Branch Experiment Station
Means followed by same letter do not significantly differ (P=.05, LSD)Mean comparisons performed only when AOV Treatment P(F) is significant at mean comparison OSLColumn 4: T1 = ([6]/125)*100Column 5: T2 = ([8]/125)*100
29

31/Jan/2007 (2506) Site Description Page 1 of 1
Delta Branch Experiment Station
DDiisseeaassee MMoonniittoorriinnggTrial ID: 2506 Study Director: Dr. Nathan BuehringLocation: Bolivar County - 2 Investigator: Dr. Nathan Buehring
GGeenneerraall TTrriiaall IInnffoorrmmaattiioonnStudy Director: Dr. Nathan Buehring Title: Extension Rice SpecialistInvestigator: Dr. Nathan Buehring Title: Extension Rice Specialist
Trial Location: Bolivar CountyBlanket Treatment Cost: ____________Conducted Under GLP (Y/N): N Conducted Under GEP (Y/N): NGuidelines: __________ Guideline Description: ____________________________
ObjectiveThis study was designed to evaluate current and upcoming varieties for disease resistance. Another objective was to determine ifthere is an economic benefit to applying a foliar fungicide to popular varieties grown in Mississippi. Quadris was applied on July 13,2006, (midseason) at 6 fl oz/acre to CL131 fungicide spray treatment due to the early presence of sheath blight. All of the fungicidespray treatments received an application of Quilt at 21 fl oz/acre on August 1, 2006, (boot split), which made the CL131 receiveQuadris at 6 fl oz/acre (midseason) plus Quilt at 21 fl oz/acre (boot split). All of the other fungicide spray treatments only receivedQuilt at 21 fl oz/acre at boot split. Sheath blight severity was rated visually on a scale from 0 to 10 and was severe at this location.Kernel smut was rated on a scale of 0 to 10 and was light to moderate at this location. There was significant lodging and shatteringwith some varieties and hybrids at this location.
ConclusionsSee means table for average disease severity, lodging, yield, and shattering. XL723, Cocodrie, Cheniere, CL131, Priscilla, and Wellswere the only hybrids/varieties that received a fungicide application. All varieties and hybrids tested resulted in a return on the invest-ment of fungicide. The average return on the investment of a foliar fungicide is listed per each variety/hybrid below:
XL723: $22.60/acreCocodrie: $131.80/acreCheniere: $32.20/acreCL131: $162.40/acrePriscilla: $17.00/acreWells: $144.20/acre
Sheath blight pressure was severe; therefore, a foliar fungicide application resulted in a return on the investment. However,these results will not occur in every situation. Always scout and monitor your crop closely and base a fungicide application on diseasepressure and variety susceptibility.
CCrroopp aanndd PPeesstt DDeessccrriippttiioonnCrop 1: Orysa Rice Variety: MultiplePlanting Date: April 28, 2006 Planting Method: DrilledRate: 80 pounds Depth: 1 inch Perennial Age: ____ _____Row Spacing: 8 inches Spacing Within Row: ____ _____ Seed Bed: MediumSoil Temperature: ____ Soil Moisture: Slightly wet Emergence Date: ______________
SSiittee aanndd DDeessiiggnnPlot Width, Unit: 10 feet Plot Length, Unit: 40 feet Reps: 4Site Type: FieldTillage Type: No-till Study Design: Randomized complete block
MMaaiinntteennaanncceeField Prep/Maintenance: July 13, 2006 - Quadris was applied at 6 fl oz/acre to the CL131 fungicide spray treatment only.
August 1, 2006 - Quilt was applied at 21 fl oz/acre to all of the fungicide spray treatments, including CL131.
30

DDiisseeaassee MMoonniittoorriinnggTrial ID: 2506 Study Director: Dr. Nathan BuehringLocation: Bolivar County - 2 Investigator: Dr. Nathan Buehring
Character Rated S. Blight K. Smut Lodging Shatter Yield Milling MillingRating Data Type Severity Severity Lodging Yield Total WholeRating Unit 0-10 0-10 1-100 0-10 bu % %Rating Date 31/Aug/06 31/Aug/06 15/Sep/06 15/Sep/06 15/Sep/06 10/Oct/06 10/Oct/06Assessed By Nathan Nathan Nathan Nathan NathanARM Action Codes TY1 T2 T3# Subsamples, Dec. 1Trt TreatmentNo. Name 1 2 3 7 6 9 111 CL XL730 1 de 4 def 90 a 7 b 206.3 b-e 68 d 53 ef2 CL XP729 2 d 4 def 95 a 10 a 177.6 gh 64 g 48 g3 CL161 9 a 5 bc 95 a 1 efg 140.2 j 64 g 53 ef4 CL131 10 a 6 ab 41 b 1 efg 153.5 ij 65 efg 54 def5 CL171 6 bc 4 cde 34 b 4 cd 168.6 hi 68 de 56 cde6 CL151 9 a 7 a 91 a 2 def 148.8 ij 64 fg 50 fg7 XL723 1 de 3 ef 80 a 8 b 204.8 b-e 67 def 56 cde8 Cocodrie 6 b 6 ab 28 bc 1 fg 184.6 fgh 68 cd 58 cd9 Cheniere 6 b 5 bcd 18 bcd 1 fg 187.2 e-h 67 de 58 bcd10 Wells 5 c 3f g 36 b 4 c 190.0 d-g 71 abc 55 de11 Trenasse 9 a 6 ab 96 a 1 efg 146.0 j 63 g 43 h12 Sabine 6 b 5 abc 39 b 3 cde 177.6 gh 67 de 57 cde13 Priscilla 2 d 4 c-f 6 cd 1 efg 198.6 c-f 69 bcd 53 ef14 XL723-Fung Spray 0 ef 2 g 98 a 10 a 216.2 abc 68 de 55 def15 Cocodrie-Fung Spray 1 def 2 g 0 d 0 g 223.3 ab 70 a-d 60 bc16 Cheniere-Fung Spray 1 def 1 g 0 d 1 efg 201.0 c-f 71 ab 64 a17 CL 131-Fung Spray 2 d 2 g 0 d 2 def 203.8 b-f 69 bcd 62 ab18 Priscilla-Fung Spray 0 f 2 g 0 d 2 efg 208.6 bcd 69 bcd 57 cde19 Wells-Fung Spray 0 f 2 g 0 d 0 g 231.8 a 72 a 58 bcdLSD (P=.05) 1.1 1.5 25.0 1.9 20.21 2.8 4.4Standard Deviation 0.8 1.0 17.7 1.3 14.29 1.7 2.7CV 19.19 28.66 39.64 43.62 7.61 2.49 4.83Grand Mean 3.94 3.64 44.54 3.01 187.82 67.66 55.38Bartlett's X2 14.001 17.536 44.135 35.749 13.912 16.145 17.616P(Bartlett's X2) 0.525 0.487 0.001* 0.003* 0.735 0.582 0.481
Replicate F 2.737 0.374 1.838 1.348 10.661 2.823 1.437Replicate Prob(F) 0.0523 0.7720 0.1512 0.2684 0.0001 0.0726 0.2509Treatment F 84.253 11.616 20.465 23.055 14.042 7.543 10.143Treatment Prob(F) 0.0001 0.0001 0.0001 0.0001 0.0001 0.0001 0.0001
31/Jan/2007 (2506) AOV Means Table Page 1 of 1
Delta Branch Experiment Station
31
Means followed by same letter do not significantly differ (P=.05, LSD)Mean comparisons performed only when AOV Treatment P(F) is significant at mean comparison OSLColumn 5: TY1 = 12.10757*[C4]*(100-[C5])/88Column 6: T2 = ([8]/125)*100Column 7: T3 = ([10]/125)*100

31/Jan/2007 (NB-06-06) Site Description Page 1 of 2
Delta Branch Experiment Station
CCLL115511 FFuunnggiicciiddee RRaattee aanndd TTiimmiinnggTrial ID: NB-06-06 Study Director: Dr. Nathan BuehringLocation: Bolivar County Investigator: Dr. Nathan Buehring
GGeenneerraall TTrriiaall IInnffoorrmmaattiioonnStudy Director: Dr. Nathan Buehring Title: Extension Rice SpecialistInvestigator: Dr. Nathan Buehring Title: Extension Rice Specialist
Trial Location: Bolivar CountyBlanket Treatment Cost: ____________Conducted Under GLP (Y/N): __ Conducted Under GEP (Y/N): __Guidelines: __________ Guideline Description: ____________________________
ObjectiveCL151 is a new Clearfield rice variety that will be available for large-scale production in 2008. Very little information is available onthe benefit of using a foliar fungicide with this variety. This study was developed to see if a foliar fungicide will be necessary to maxi-mize the yield potential with CL151.
ConclusionsSheath blight severity was the lowest when Quadris (6 fl oz/acre) was applied at 14 days after panicle differentiation (PD + 14D) fol-lowed by Quilt (14 fl oz/acre) at boot. All of the other fungicide treatments had higher sheath blight severity ratings. However, thesetreatments had lower sheath blight severity ratings than the untreated. Kernel smut ratings with all of the fungicide treatments werelower than the untreated. All of the fungicide treatments had significantly higher rough rice yields than the untreated. Quadris (6 floz/acre) followed by Quilt (14 fl oz/acre) had the highest numerical yield. Total and whole milling yields with all of the fungicidetreatments were higher than the untreated. This study indicates that if sheath blight is present at high levels, it is better to apply a fun-gicide early (PD + 14D) and make a repeat application (boot) to reduce sheath severity in CL151. Also, rough rice yield, total, andwhole grain milling yields will be higher when using a foliar fungicide in the presence of severe sheath blight.
CCrroopp aanndd PPeesstt DDeessccrriippttiioonnCrop 1: Orysa Oryza sativa Rice, common Variety: CL151BBCH Scale: BRIC Planting Date: April 28, 2006 Planting Method: DrilledRate: 70 pounds Depth: 1 inch Perennial Age: ____ _____Row Spacing: 8 inches Spacing Within Row: ____ _____ Seed Bed: No-tillSoil Temperature: ____ Soil Moisture: Normal Emergence Date: May 5, 2006 Harvest Date: ______________ Harvest Equipment: ______________Harvested Width: ______________ Harvested Length: ______________
SSiittee aanndd DDeessiiggnnPlot Width, Unit: 8 feet Plot Length, Unit: 15 feet Reps: 4Site Type: FieldTillage Type: No-till Study Design: Randomized complete block
Trial Initiation Comments:
32

31/Jan/2007 (NB-06-06) Site Description Page 1 of 2
Delta Branch Experiment StationMMaaiinntteennaannccee
Maintenance Form Form Form RateNo. Date Treatment Name Conc Unit Type Rate Unit1 April 28, 2006 Roundup 4 lba/gal AS 1 qt/acre2 April 28, 2006 Command 3 lba/gal ME 1.67 pt/acre3 June 1, 2006 Regiment 80 % WP 0.67 oz/acre4 June 1, 2006 Facet 75 % DG 0.33 lb/acre5 June 1, 2006 Permit 75 % WG 0.67 oz/acre
Comment:
Field Prep./Maintenance:
Application DescriptionA B
Application Date: July 13, 2006 August 1, 2006Time of Day: 7:30 PM 7 AM Application Method: Spray Spray Application Timing: PD + 14D Boot Application Placement: Foliar Foliar Applied By: Nathan Nathan Air Temperature, Unit: 90 F 78 F% Relative Humidity: 65 75 Wind Velocity, Unit: 2 MPH 2 MPH Wind Direction: S S Dew Presence (Y/N): Y YWater Hardness: None None Soil Temperature, Unit: Soil Moisture: Excessive Excessive% Cloud Cover: 20 0
Crop Stage at Each ApplicationA B
Crop 1 Code, BBCH Scale: Orysa Bric Orysa BricStage Scale Used: BBCH BBCH Stage Majority, Percent: PD + 14D 100 Boot 100Stage Minimum, Percent:Stage Maximum, Percent:Diameter, Unit:Height, Unit:Height Minimum, Maximum:
Pest Stage at Each ApplicationA B
Pest 1 Code, Disc., Scale: Rhizsp D Rhizsp D Stage Majority, Percent:Stage Minimum, Percent:Stage Maximum, Percent:Diameter, Unit:Height, Unit:Height Minimum, Maximum:Density, Unit:Coverage, Unit:
Trt No Treatment Application Comment1 Plot 302 got oversprayed.
33

CCLL115511 FFuunnggiicciiddee RRaattee aanndd TTiimmiinnggTrial ID: NB-06-06 Study Director: Dr. Nathan BuehringLocation: Bolivar County Investigator: Dr. Nathan Buehring
Pest Type D Disease D DiseasePest Code RHIZSPPest Name Rhizoctonia sp.Crop Code Oryza Oryza Oryza Oryza OryzaCrop Variety CL151 CL151 CL151 CL151 CL151Description S. Blight K. Smut Yield Yield MoistureRating Date 31/Aug/2006 31/Aug/2006 15/Sep/2006 15/Sep/2006 15/Sep/2006Rating Data Type Severity Severity Yield Total Mil Whole MilRating Unit 0-10 0-10 BU % %Days After Last Application 30 30 45 45 45ARM Action Codes TY1 T2 T3Number of Decimals 1Trt Treatment RateNo. Type Name Rate Unit 1 2 5 7 91 Fung Quadris 6 fl oz/a 1 d 2 c 204.6 a 68 a 57 ab
Fung Quilt 14 fl oz/a2 Fung Quadris 12 fl oz/a 3 bc 3 bc 202.1 a 68 ab 56 ab
Fung Tilt 4 fl oz/a3 Fung Quadris 6 fl oz/a 4 b 3 bc 196.6 a 67 b 55 b4 Fung Quadris 9 fl oz/a 2 cd 4 b 193.2 a 69 a 57 ab5 Fung Quilt 14 fl oz/a 3 bc 3 bc 190.2 a 68 a 59 a
Fung Quadris 2 fl oz/a6 Fung Stratego 19 fl oz/a 3 bc 4 bc 189.9 a 69 a 57 ab7 Chk Untreated 9 a 7 a 148.8 b 64 c 50 cLSD (P=.05) 1.3 1.6 20.00 1.4 3.2Standard Deviation 0.8 1.1 13.40 0.8 1.8CV 25.53 31.17 7.08 1.14 3.19Grand Mean 3.33 3.46 189.35 67.62 55.92Bartlett's X2 3.769 6.595 3.664 9.284 10.114P(Bartlett's X2) 0.583 0.36 0.722 0.158 0.12
Replicate F 0.463 0.870 7.040 1.215 2.694Replicate Prob(F) 0.7116 0.4758 0.0028 0.3337 0.1116Treatment F 35.126 7.519 7.835 11.521 6.833Treatment Prob(F) 0.0001 0.0005 0.0004 0.0003 0.0032
31/Jan/2007 (NB-06-06) AOV Means Table Page 1 of 1
Delta Branch Experiment Station
34
Means followed by same letter do not significantly differ (P=.05, LSD)Mean comparisons performed only when AOV Treatment P(F) is significant at mean comparison OSL.Column 3: TY1 = 12.10757*[C3]*(100-[C4])/88Column 4: T2 = ([6]/125)*100Column 5: T3 = ([8]/125)*100

The information given here is for educational purposes only. References to commercial products, trade names, or suppliers are made with theunderstanding that no endorsement is implied and that no discrimination against other products or suppliers is intended.
Copyright 2007 by Mississippi State University. All rights reserved. This publication may be copied and distributed without alteration for nonprofit edu-cational purposes provided that credit is given to the Mississippi State University Extension Service.
By Nathan Buehring, Extension rice specialist, Delta Branch Research and Extension Center
Discrimination based upon race, color, religion, sex, national origin, age, disability, or veteran’s status is a violation of federal and state law and MSU poli-cy and will not be tolerated. Discrimination based upon sexual orientation or group affiliation is a violation of MSU policy and will not be tolerated.
E 0017Extension Service of Mississippi State University, cooperating with U.S. Department of Agriculture. Published in furtherance of Acts ofCongress, May 8 and June 30, 1914. VANCE H. WATSON, Interim Director (08-07)