e9e$ti7e 46..ar it
TRANSCRIPT

La transizioneenergeticain Italia e il ruolo del settore elettricoe del gas
AGGIORNATO AL 4 OTTOBRE 2019
EXECUTIVE SUMMARY IT
The energy transitionin Italyand the role of the gas and power sectors


TA BLE OF CON TEN TS
CHAPTER 1
The world, European and Italian energy scenarios 4
CHAPTER 2
The Scenario Description Document 20
CHAPTER 3
The role of the gas sector in the energy transition 36
CHAPTER 4
The role of the power sector in the energy transition 50

4
By
1.0
The world, European and Italian energy scenarios

1.1
5
1.1Global macro-trends and energy transition.
The world is buffeted by powerful forces of change. Global mega-trends are radically redefining the structure of political, economic and social balances at the international level. The growth and development trajectories of the entire planet depend substantially on the answers that institutions, governments, corporate entities, markets and civil society will be able to provide.
Over the next three decades, demographic dynamics, socio-e-conomic changes, the acceleration of technological innovation, the spread of digitalization and the growing impact of anthropic activi-ties on the environment and on the exploitation of natural resources, if not properly governed, will transform the world into a place that bears no resemblance to Earth as we know it.
The energy sector is affected by these trends under multiple dimensions and directions. As a consequence of changes in geo-political balances, energy consumption is gradually shifting from America and Europe to South East Asia. The economic expansion of developing countries, in addition to significantly increasing demand, will bring to the markets an ever-greater share of the billion people who still do not have access to electricity today. Population growth will have an increasing impact on access to scarce resources, inclu-ding energy resources responsible for the most significant share of climate-changing emissions.
Technological innovation and digitalization can contribute to accelerating the energy transition towards a carbon neutral economy, which has marked the first important steps over the last two decades. It is ever more necessary, if the planet wants to achieve sustainable, lasting and inclusive growth, that represents the core of the seventeen Sustainable Development Goals (SDGs) adopted by the UN through the 2030 Agenda.
The energy transition in Italy and the role of the gas and power sectors

6
16,000
14,000
12,000
10,000
8,000
6,000
4,000
2,000
0
1990
1992
1994
1996
1998
2000
2002
2004
2006
2008
2010
2012
2013
2015
2017
1991
1993
1995
1997
1999
2001
2003
2005
2007
2009
2011
2014
2016
2018
Oil Natural Gas Coal Nuclear Hydro Otherrenewables
1.2
▲ Figure 1. Global primary energy consumption by source (Mtoe), 1990-2018. Source: CDP elaboration on BP data, 2019.
1.2The global energy market.
Over the last thirty years, global energy consumption has expe-rienced a constant expansion that has led to an absolute value incre-ase of over 70%, with average annual growth rates of 1.9%.
Although the trends recorded in recent years have highlighted the increasingly important role of natural gas and the progressive growth of renewable energies, the impact of different sources on global pri-mary energy consumption mix remained relatively stable betwe-en 1990 and 2018. Fossil fuels, which accounted for about 88% of the total, continue to have a share close to 85%, while renewables other than hydropower still cover only 4% of total consumption despite the recent acceleration (+16.3% per year since 2009 to date).

1.2
7
One of the main reasons is the radical change in the geography of energy consumption. North America, which was the most signifi-cant area in 1990, with more than 28% of the world total, represented just over 20% in 2018, while Europe declined from 26% to 15%. On the other hand, the countries of the Asia-Pacific region have almost dou-bled their share from 22% to 43%.
This change has been due to the different dynamics that have characterized the composition of the energy mix, partly because of the different degrees of economic development and the different envi-ronmental policy choices . While Europe has experienced a reduction in the share of fossil fuels from around 85% in 1990 to around 74% in 2018 and a simultaneous increase in renewables of 10 percentage points, variations in North America and Asia-Pacific were much smal-ler, with change more modest.
The energy transition in Italy and the role of the gas and power sectors

8
▲ Figure 2. CO2 emissions (Gigatonnes) and carbon intensity of GDP (Kilograms of CO2 on GDP – US$), 1990-2018. Source: CDP elaboration on Enerdata data, 2019.
1 Enerdata (2019). The figure refers to CO2 emissions related to the burning of fossil fuels (oil, gas and coal), which represent around 80% of total emissions.
0.450
0.400
0.350
0.300
0.250
0.200
0.150
0.050
0.100
1990
1994
1998
2002
2006
2010
2014
1992
1996
2000
2004
2008
2012
2016
2018
0.000
CO2 Intensity (left axis)CO2 Emissions (right axis)
35
mld tKCO2/$
30
25
20
15
5
10
0
1.3 1.3 CO2 and carbon emissions.
Thanks to these phenomena, despite the constant improvement in the carbon intensity of GDP that has experienced a contraction of over 35% since 1990, CO2 emissions have continued to grow, rea-ching a record level of nearly 33 billion tons in 2018, mostly due to the simultaneous major increase in the consumption of fossil fuels1.

1.4
9
▼ Figure 3. Anomalies in global temperatures (°C), 1850-2019. Source: CDP elaboration on Climatic Research Unit, University of East Anglia data, 2019. Note: The anomalies in global temperatures are calculated considering the deviation from the average temperature recorded in the period 1960-1990.
2 NASA GISS (2019). 3 MunichRE, NatCatSERVICE (2019).
0.8
0.6
0.4
0.2
-0.2
-0.4
1850
1862
1874
1886
1898
1910
1922
1934
1946
1958
1970
1982
1988
2000
2012
1856
1868
1880
1892
1904
1916
1928
1940
1952
1964
1976
1994
2006
2018
-0.6
0
1.4 Global temperatures.
The most immediate effect of this trend is the increase in glo-bal temperatures which, according to the latest estimates, are 1°C higher on average than those recorded in the pre-industrial era. 2018 was the fourth warmest year since 1880, with a temperature of 1.5°C higher than the average calculated over the period between 1951 and 1980. Overall, the last 5 years have been the warmest since records began2.
Furthermore, extreme climatic phenomena with ever-greater impacts are growing in number and intensity. Between 1990 and 2018, there were more than 15,000 catastrophic events of a geophy-sical, meteorological, hydrogeological or climatic nature, with the loss of more than 1.5 million lives and damage to economies and territories estimated at over 4.2 trillion dollars3.
The energy transition in Italy and the role of the gas and power sectors

1.5 The Earth Overshoot Day.
Apart from global warming, demographic growth and global eco-nomic development are closely correlated to global sustainability. In 2019, the Earth Overshoot Day4, which measures the environ-mental footprint of humans by identifying the date when all avai-lable resources are consumed for a given year, fell on 29th July; only 20 years ago it was on 1st October. This means that today’s world population already need the resources of about 1.75 Earthhs to sati-sfy their needs for a year without compromising the security of future resources.
These data clearly show that the model on which the development of the planet has been built over the last few decades will be unsu-stainable in the future. This requires a global commitment to a pro-gressive and more rapid decarbonization of all energy sectors. If we do not change the current path, energy consumption in 2040 will be 38% higher than today, CO2 emissions will increase by 23% and global temperatures could rise to a level that would make environ-ment impacts irreversible, exposing the planet to a systemic risk of catastrophic climatic events, with disruptive effects on economic growth, social stability and geopolitical balances5.
Thanks to the growing and widespread awareness of these factors, international debate has increasingly focused on identifying the development paths needed to deliver a decent world to future gene-rations. Within this framework, the need to define global policies aimed at containing emissions has crystallised. This long process began with the adoption of the United Nations Framework Conven-tion on Climate Change in 1992, was followed by the partial failure of the Kyoto Protocol signed in 1997 and culminated with the signing of the Paris Agreement on climate change in 2015, ratified by 185 coun-tries to date.
10
4 https://www.overshootday.org/.5 IEA (2018). The estimates of growth in energy consumption and CO2 emissions refer to the "Current Policies Scena-rio" which considers the expected evolution with unchanged policies.
1.5

1.6
11
1.6 The Paris Agreement.
The Paris Agreement is the first with a global reach and a bin-ding character in the field of climate change and aims to keep the average increase in temperatures well below 2°C compared to pre-industrial levels and to intensify efforts to limit this increase to 1.5°C in order to significantly reduce the risks and impacts of human activities on the environment6.
These thresholds are considered by the international scientific community to be those which, with a probability of 50% and 66% respectively, would make the process of raising the concentration of greenhouse gases in the atmosphere reversible7. Nevertheless, reaching these goals would require a radical transformation of the global energy system with the taking of concrete actions in all sectors, a commitment focused on the production of electricity from renewable sources, the development of renewable gases, hydrogen and the electrification of final consumption. It is estimated that, if a share of 66% and 50% of renewable sources and electricity with respect to final energy consumption could be achieved, with a total of 2,200 TWh of hydrogen in the energy mix, this might result in a substantial reduction in emissions, reaching values of 48% lower than 2016 levels in 2040 and around 70% lower in 20508.
To implement the objectives assumed under the Paris Agree-ment, the signatory countries are required to adopt "Nationally Determined Contributions" (NDC), aimed at identifying the quanti-tative targets, strategic plans and energy policy tools needed to the gradual decarbonization process. However, according to prelimi-nary estimates based on the expected effects of the proposed NDCs, climate-changing emissions would continue to grow over the next decade, albeit at a slower pace9.
The COP 26, to be held in 2020 in the United Kingdom, will repre-sent a key opportunity to review the NDCs presented by the parties involved and to calibrate the commitments made to ensure consi-stency with the final objective.
6 Paris Agreement, art. 2.7 IPCC (2018).8 IRENA (2019). 9 UNFCCC (2016).
The energy transition in Italy and the role of the gas and power sectors

12
1.7 1.7 Europeanpoliciestofightclimatechange.
In fighting against climate change, the European Union has taken
a leading international role since the 1990s in designing environmen-tal energy policies that promote innovation, combining economic growth with the protection of ecosystems. The EU, together with its Member States, is the only Party to have ratified the Kyoto Pro-tocol which is in the process of reaching the three objectives set for 2020 for containing emissions, increasing the use of renewable energy sources and promoting energy efficiency. Furthermore, this process has had positive socio-economic implications in terms of increased employment in the energy sector and reduction of ener-gy costs from renewable sources, to the point that photovoltaic and wind power are beginning to compete with conventional fuels on today’s energy markets.
Target 2020 non achievedTarget 2020 achieved
20% 1,48320%
17.5%
1,562
2017
21.7%
2017 2017
▼ Figure 4. Distance of the European Union from the 2020 targets (percentage values). Source: CDP elaboration on Eurostat data, 2019.
13
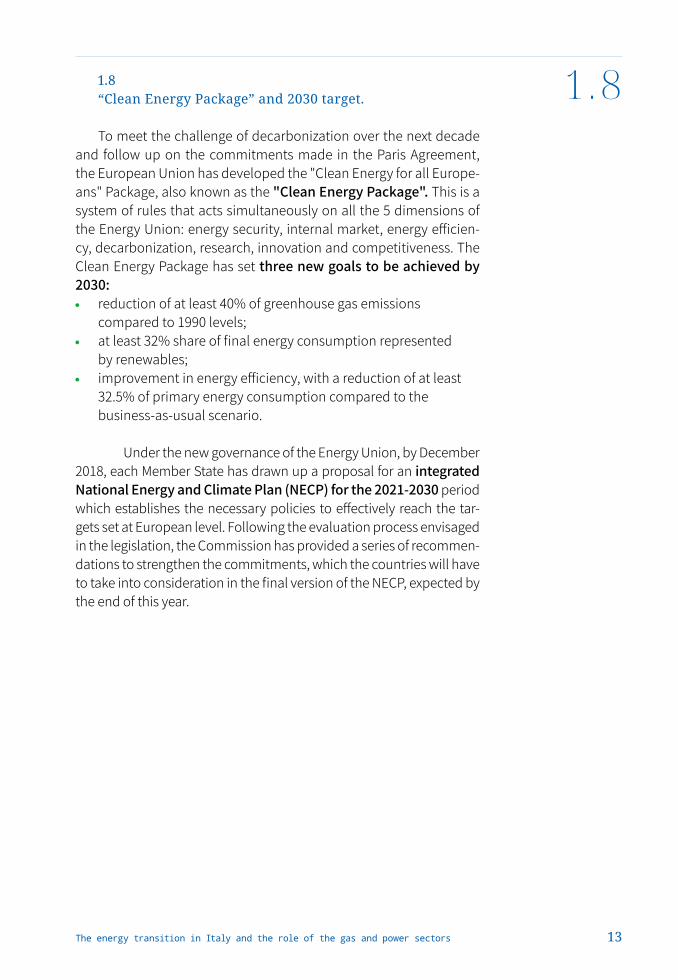
1.8 “Clean Energy Package” and 2030 target.
To meet the challenge of decarbonization over the next decade and follow up on the commitments made in the Paris Agreement, the European Union has developed the "Clean Energy for all Europe-ans" Package, also known as the "Clean Energy Package". This is a system of rules that acts simultaneously on all the 5 dimensions of the Energy Union: energy security, internal market, energy efficien-cy, decarbonization, research, innovation and competitiveness. The Clean Energy Package has set three new goals to be achieved by 2030: reduction of at least 40% of greenhouse gas emissions
compared to 1990 levels; at least 32% share of final energy consumption represented
by renewables; improvement in energy efficiency, with a reduction of at least
32.5% of primary energy consumption compared to the business-as-usual scenario.
Under the new governance of the Energy Union, by December 2018, each Member State has drawn up a proposal for an integrated National Energy and Climate Plan (NECP) for the 2021-2030 period which establishes the necessary policies to effectively reach the tar-gets set at European level. Following the evaluation process envisaged in the legislation, the Commission has provided a series of recommen-dations to strengthen the commitments, which the countries will have to take into consideration in the final version of the NECP, expected by the end of this year.
1.8
The energy transition in Italy and the role of the gas and power sectors
14
1.9 1.9 "Green Deal"
This approach, aimed at speeding up this process, seems to be reflected in the orientation of the energy policy by the new Commis-sion that will be established in November 2019. In her first official communications, President Ursula von der Leyen outlined a Euro-pean Green Deal rooted in raising the emissions reduction target to 50% and relaunching international negotiations to increase the level of ambition of the other countries most responsible for global warming. In this context, the European target could subsequently be revised to reach 55%.
This commitment has already had a national impact. In Italy, the newly formed Government has announced its intention to promote a "Green New Deal" that "involves a radical change of cultural para-digm and leads to the introduction of environmental and biodiversity protection as one of the fundamental principles of our constitutional system”10.
All these objectives - national, European and global – are extre-mely ambitious. If they are to be achieved, the following will be necessary: i) a rapid transition towards completely new production and consumption models, relying on increasingly more established technologies and the innovations that will take place over the next few years; ii) an unprecedented mobilization of resources. The most challenging scenarios currently estimate an investment requi-rement at global level of around 3 trillion dollars per year until 2050, while this value has been just over 1.8 trillion dollars in the last two years11.
To achieve such an ambitious target, the international commu-nity needs to promote a convergence of objectives and commitmen-ts involving all the stakeholders. International institutions, national policy makers, the financial world, industrial sectors and civil society must make a greater contribution, aware that the sustainable deve-lopment of the planet depends on a successful transition to a low carbon impact economy.
10 Government program PD-M5S, 4 September 2019.11 IEA (2018); IRENA (2019).

1.10
15
▲ Figure 5. Italian energy balance (Mtoe), 2000-2018. Source: CDP on Ministero dello Sviluppo Economico data, 2019.
200
150
100
50
Natural GasSolids Oil Renewables Net importof electricity
2000
2001
2002
2003
2004
2005
2006
2007
2008
2009
2010
2011
2012
2013
2014
2015
2016
2017
2018*
0
* Provisional data
1.10 Primary energy consumption in Italy.
In Italy, total primary energy consumption reached 172.3 Mtoe in 2018, a rise of 1.6% compared to the previous year due to the expan-sion of GDP (+0.8%) and climatic conditions characterized by a parti-cularly harsh winter. By analyzing trends in overall demand, we can highlight a contraction of more than 7% in absolute terms between 2000 and 2018, with a peak of 197.8 Mtoe in 2005 and a minimum of 166 Mtep in 2014.
The energy transition in Italy and the role of the gas and power sectors

1.11
16
12 Ministero dello Sviluppo Economico (2019). 13 Unione Petrolifera (2019).
1.11Italian energy mix.
The structural reduction of energy consumption reflects on the one hand the gradual evolution of the production structure with a contraction of activities in the industry and construction sectors and, on the other, the improvement in the efficiency of end uses, as evidenced by the gradual reduction in energy intensity which fell by -10.7% over the 2000-2018 period12.
Analysis of the trends of the various energy sources, in 2018, shows: The persistent decline in the use of non-renewable solid
fuels, which reached an all-time low of 9.2 Mtoe in 2018, a value 46% lower than that recorded in 2006-2007. This trend is due to the gradual closure of coal-fired power plants and the reduced use of those still in operation, thanks to national energy policies and the high production costs linked to the changing cost of raw materials13 and a reduction in the use of fuels solids in industrial end uses, such as for steel mills; After three years of significant increases that had brought
consumption from 50.7 Mtoe in 2014 to 61.7 Mtoe in 2017, a 3.4% reduction in natural gas, reaching 59.5 Mtoe. The economic trend is due to the lower appeal of natural gas as an input for electricity generation. The latter benefited from particularly favorable hydraulic conditions, leading to an increase in hydroelectric production of over 30%. Consumption is growing once againin 2019; An increase of 1.6% in oil consumption, equal to 58.6 Mtoe,
due to persistently heavy use in the transport sector, where it covers a portion of over 92% of demand. Net of last year's trend, the use of oil has fallen by more than 35% compared to the values recorded in the early 2000s; A significant increase in the contribution of renewable
sources, which reached 35.3 Mtoe, a rise of 11.4% compared to 2017. The trend in hydroelectric generation more than compensated for the setback suffered by wind and photovoltaic. Between 2000 and 2018, renewables more than tripled their volumes, with an average annual growth rate close to 6%;
1.11
17
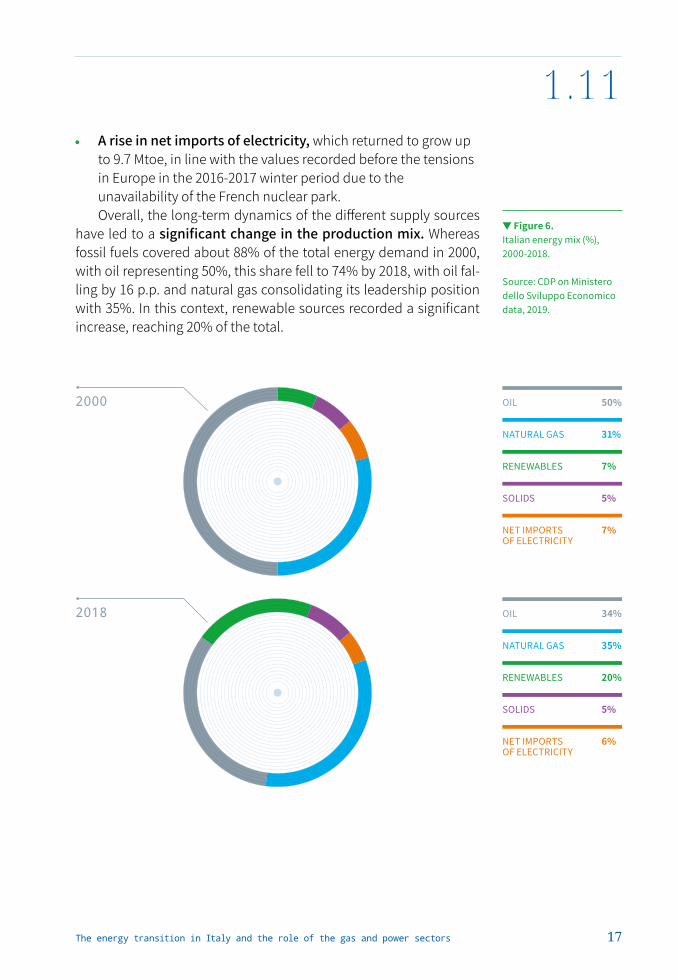
A rise in net imports of electricity, which returned to grow up to 9.7 Mtoe, in line with the values recorded before the tensions in Europe in the 2016-2017 winter period due to the unavailability of the French nuclear park.
Overall, the long-term dynamics of the different supply sources have led to a significant change in the production mix. Whereas fossil fuels covered about 88% of the total energy demand in 2000, with oil representing 50%, this share fell to 74% by 2018, with oil fal-ling by 16 p.p. and natural gas consolidating its leadership position with 35%. In this context, renewable sources recorded a significant increase, reaching 20% of the total.
▼ Figure 6. Italian energy mix (%), 2000-2018. Source: CDP on Ministero dello Sviluppo Economico data, 2019.
OIL 50%
NATURAL GAS 31%
RENEWABLES 7%
SOLIDS 5%
NET IMPORTS 7% OF ELECTRICITY
2000
2018 OIL 34%
NATURAL GAS 35%
RENEWABLES 20%
SOLIDS 5%
NET IMPORTS 6% OF ELECTRICITY
The energy transition in Italy and the role of the gas and power sectors

18
1.12Italy and 2020 target.
The reduction of energy consumption - also due to the improve-ment of energy efficiency, the evolution of the production mix with a significant decrease in fossil fuels in favor of natural gas and the simultaneously increasing penetration of renewables, enabled Italy to achieve the goals set for Europe by the 2020 Energy Climate Package as early as 2017.
* The overall objective of reducing CO2 emissions is set at Euro-pean level. With reference to the sectors included in the “Effort Sha-ring” regulation, subject to a specific objective for each country, Italy achieved a reduction of 19.6% in 2017 against a target of -13%.
1.12
▼ Figure 7. Italy and 2020 target. Source: CDP on Eurostat data, 2019.
17%
15820%
18.3%
149
2017
21.7%
2017 2017
17%
Target 2020 non achievedTarget 2020 achieved

19The energy transition in Italy and the role of the gas and power sectors

20
The Scenario DescriptionDocument(SDD 2019)
2.0
By

2.1Players of the Scenario Description Document.
The achievement of the Italian policy targets requires the joint
and coordinated work of the main actors of the Italian energy sector, in order to reach a coherent vision of the conceivable future trends of the Italian energy system. For this purpose, Snam and Terna deve-loped the Scenario Description Document (DDS 2019)*, whose outcome is preparatory to the national transmission grids deve-lopment plans of electricity and natural gas sector at national level. This work allowed the two system operators to put together their specific expertise, being aware that the interaction between electri-city and gas scenarios represents, at both national and European level, a new element characterised by a high degree of complexity.
The working activities have been carried out in compliance with ARERA resolutions 654/2017/R/eel and 689/2017/R/gas, in line with the process developed at European level, in which the two associa-tions of electricity and gas transport (ENTSO-E and ENTSOG) build joint energy scenarios, essential to the relative Ten-Year Network Development Plans for electricity and gas infrastructure (TYNDP).
The scenario elaboration process lasted for almost two years and was organised in three different working groups, committed respectively to technological aspects, scenarios elaboration e regulatory, with the help of many analytic tools, specific models and databases. Furthermore, Snam and Terna working group recei-ved the support of several stakeholders, including institutional players, sector operators, research institutes, by means of three workshops, held in coincidence with the key decisional moments.
21
2.1
▼ Figure 8. Scenarios and time horizons used in DDS 2019. Source: Terna and Snam elaboration, 2019.
* The Scenario Description Document is available on the dedicated web pages of Snam and Terna web sites.
Scenarios/time horizon 2030 20402025
PNIEC
BAU
CEN
DEC
The energy transition in Italy and the role of the gas and power sectors
22
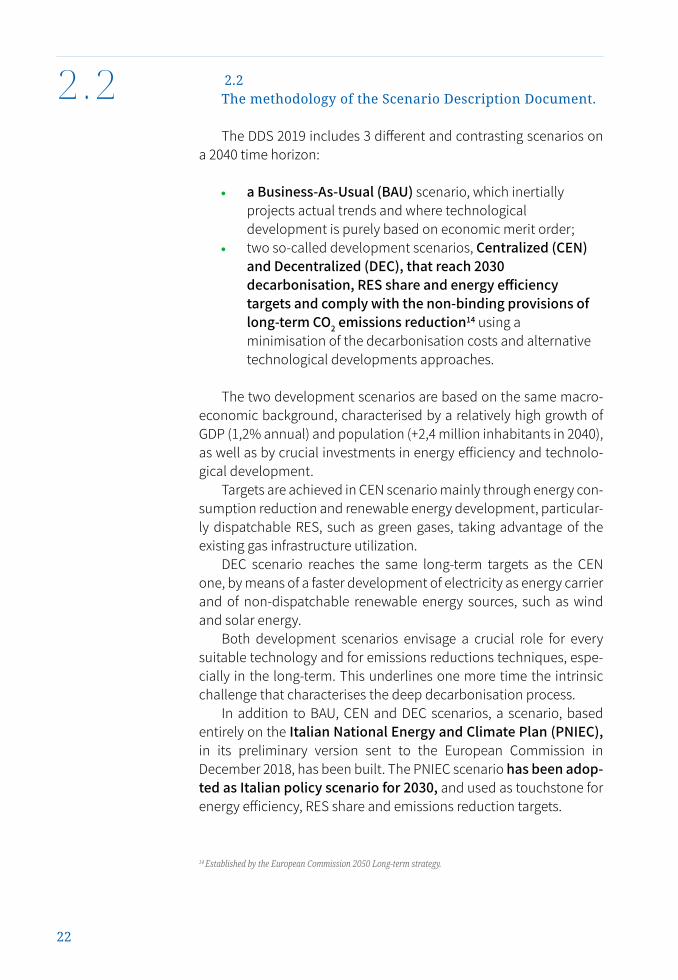
2.2The methodology of the Scenario Description Document.
The DDS 2019 includes 3 different and contrasting scenarios on a 2040 time horizon:
a Business-As-Usual (BAU) scenario, which inertially projects actual trends and where technological development is purely based on economic merit order;
two so-called development scenarios, Centralized (CEN) and Decentralized (DEC), that reach 2030 decarbonisation, RES share and energy efficiency targets and comply with the non-binding provisions of long-term CO2 emissions reduction14 using a minimisation of the decarbonisation costs and alternative technological developments approaches.
The two development scenarios are based on the same macro-economic background, characterised by a relatively high growth of GDP (1,2% annual) and population (+2,4 million inhabitants in 2040), as well as by crucial investments in energy efficiency and technolo-gical development.
Targets are achieved in CEN scenario mainly through energy con-sumption reduction and renewable energy development, particular-ly dispatchable RES, such as green gases, taking advantage of the existing gas infrastructure utilization.
DEC scenario reaches the same long-term targets as the CEN one, by means of a faster development of electricity as energy carrier and of non-dispatchable renewable energy sources, such as wind and solar energy.
Both development scenarios envisage a crucial role for every suitable technology and for emissions reductions techniques, espe-cially in the long-term. This underlines one more time the intrinsic challenge that characterises the deep decarbonisation process.
In addition to BAU, CEN and DEC scenarios, a scenario, based entirely on the Italian National Energy and Climate Plan (PNIEC), in its preliminary version sent to the European Commission in December 2018, has been built. The PNIEC scenario has been adop-ted as Italian policy scenario for 2030, and used as touchstone for energy efficiency, RES share and emissions reduction targets.
2.2
14 Established by the European Commission 2050 Long-term strategy.

23
The scenarios building process started with an initial stage of storylines definition and inputs set-up, followed by a final energy consumption forecast phase, an electricity market analysis phase and, for development scenarios, the verification of the accomplish-ment of policy targets.
Final energy consumption has been modelled with an analytic tool, using macroeconomic parameters and commodity prices as input forecasts, and performing an economic optimisation process, based on technology Total Costs of Ownership (TCO) and technical constraints related to their potential diffusion. Power sector has been analysed with another analytic tool which forecasts the opti-mum dispatchment according to the merit order of electricity gene-ration fleet, including the techno-economic sustainability evaluation and the optimisation of renewable sources based on the evaluation of Levelized Cost of Energy (LCoE) and technical, adequacy and poli-cy constraints.
In the definition and elaboration of the scenarios, the working group put consistent effort into assuring the highest grade of cohe-rence with the analogous long-term European scenario building processes, yet under development by ENTSO-E and ENTSOG. The following Figure shows the logical correlation between European and Italian scenarios. The temporal mismatch between the activity roadmaps, together with a higher level of detail in the national scale analysis, led to slight discrepancies between national and European scenarios.
2.2
▲ Figure 9. Decarbonisation, final energy consumption and RES share target. Source: Terna and Snam elaboration, 2019.
Target PNIEC BAU CEN DEC
2017 2030 2040 2030 2030 2040 2030 2040 2030 2040
CO2emissions reduction vs 1990 [%] 17.4 40.0 65 40.0 28.4 32.0 42.9 64.1 41.4 63.7
Final energy consumption [Mtep] 113.6 103.8 N/D 103.8 114.3 115.3 103.8 93.4 103.1 90.2
RES share on final energy consumption [%] 18.1 30.0 N/D 30.0 20.0 22.7 30.0 44.3 31.3 50.5
The energy transition in Italy and the role of the gas and power sectors

24
The main findings of the scenarios are summarised below: Electricity consumption grows in every scenario: PNIEC and
CEN results are similar and characterised by a lower electricity consumption with respect to DEC scenario, which predicts a higher use of electricity as energy carrier. Overall gas consumption is increasing in BAU scenario,
steady in CEN scenario and slightly decreasing in DEC scenario. The role of gas remains crucial in every scenario, in order to enable energy transition, also by means of the gradual substitution of natural gas with green gases (biomethane15, green syngas16 and hydrogen). Particularly, natural gas fulfils a key-role in assuring adequacy and programmability of electricity generation. DEC scenario is characterised, especially in the long-term
horizon, by a final energy consumption lower than CEN scenario, thanks to the higher intrinsic efficiency of electricity. DEC scenario heavily relies on non-dispatchable renewable
energy sources: their integration requires relevant investments in network development; on the other hand, CEN scenario rely on higher diffusion of green gases, contributing in maximising the utilisation of the existing infrastructure.
2.2
Bottom UP
Top Down
National Trend (NT)
DistributedEnergy (DE)
Global Ambition (GA)
National scenarios, Snam-Terna
European scenarios (ENTSO-E/G)
Businnes AsUsual (BAU)
PNIEC Decentralized (DEC)
Centralized(CEN)
▲ Figure 10. Correlation between Italian and European scenarios. Source: Terna and Snam elaboration, 2019.
15 Methane produced by anaerobic digestion, gasification and other processes that involve biomass.16 Renewable methane produced by hydrogen methanization process.

25
The achievement of 2030 and, even more, 2040 targets implies a wide diffusion of efficient and low emission technologies in the residential & commercial (R&C) (i.e. heat pumps) and in the transport sector (i.e. electric vehicles and CNG/hydrogen vehicles), besides the large-scale implementation of energy efficiency measures in R&C and industrial sector. After 2030, the ambitious decarbonisation targets require
the gradual penetration of green gases in the Italian energy mix, enhancing usage of biomethane, hydrogen and green syngas. Sector coupling is therefore crucial to provide enabling instruments for energy system decarbonisation. Power-to-Gas may be the key technology of this process, enabling the decarbonisation of the most problematic energy intensive sectors and representing a seasonal storage resource for renewable electricity. In 2040 both CEN and DEC scenarios foresee the utilisation
of carbon capture and storage techniques (CCS/CCU) in order to achieve decarbonisation targets higher than 60%. The achievement of decarbonisation target implies a gradual
"alignment" in the European generation mix (coal phase-out, nuclear power plant decommissioning, RES penetration); the consequence is a progressive transformation in the electricity cross-border flows, in all the scenarios. In particular, the results remark an increase in the total amount of energy exchanged between Italy and border countries, with a growing contribution of electricity exported from Italy to border countries. In this increasingly integrated European market, interconnection capacity becomes a fundamental tool for maximizing the penetration of renewable sources and guaranteeing the safety and quality of service in the interconnected European electricity system. Electricity peak load increases to a greater extent in DEC and
PNIEC scenarios, both characterised by higher diffusion of electric vehicles. Furthermore, electrification of energy consumption and spread of renewable energy sources emphasize the complexities related to residual load ramp and overgeneration management, confirming the need for new flexibile technologies for electric system (storage systems, demand-response management, distributed generation management, Power-to-Gas).
2.2
The energy transition in Italy and the role of the gas and power sectors

2.2
26
While Daily peak demand of gas decreases in every scenario, its volatility increases because of the relevant change in the sectorial composition. Gas peak demand in R&C sector, easily predictable due to its strong dependency on temperature, decreases; on the contrary, thermoelectric peak demand increases and so does its variability because of the higher share of non-dispatchable renewable sources. Higher volatility of thermoelectric demand is also proved by the increase of the peak/ off-peak ratio.
17 Electricity demand includes final usage consumption and transmission losses; hydrogen volumes are expressed in bilion cubic meters of equivalent methane.

2.2
27
▲ Figure 11. Main parameters and results of BAU, CEN, DEC e PNIEC scenarios in 2025, 2030 e 204017. Source: Terna.
2025 2030 2040
BAU CEN DEC PNIEC BAU CEN DEC PNIEC BAU CEN DEC
Final energyconsumption - Mtep 115 110 109 109 114 104 103 104 115 93 90
Electricity demand - TWh 330 326 338 325 340 332 356 330 371 352 391
Peak load - GW 55 55 57 54 56 57 62 62 62 60 72
Total RES - GW 59.5 62.4 72.2 66.1 70.7 80.3 94.3 93.3 92.7 99.0 123.1
Wind 11.5 13.7 15.2 15.7 13.6 17.1 18.9 18.4 17.6 22.1 25.4
Solar 22.5 23.8 31.7 26.8 30.5 37.6 49.3 50.9 47.5 50.6 69.8
Hydroelectric 20.1 20.1 20.1 19.1 20.8 20.8 20.8 19.2 21.8 21.8 21.8
Other RES 5.4 4.8 5.2 4.5 5.8 4.8 5.3 4.8 5.8 4.5 6.1
Thermoelectric - GW 54 50 50 49 50 50 50 50 50 50 50
Electric storage - GW 7.4 10.7 10.4 12.7 7.4 12.7 13.4 17.9 7.4 14.3 18.9
Pumped Hydro Storage 7.4 10.4 8.9 10.4 7.4 11.9 10.4 11.9 7.4 11.9 11.9
Electrochemical Batteries 0.0 0.3 1.5 2.3 0.0 0.8 3.0 6.0 0.0 2.4 7.0
Gas total - bn m3 75.9 77.5 73.7 70.7 79.6 73.5 68.6 62.0 84.4 76.5 67.2
Natural gas - bn m3 75.9 74.6 72.6 70.0 79.6 65.2 64.8 61.0 84.4 58.0 54.0
of which CCS 0 0 0 0 0 0 0 0 0 7.8 7.6
Green gases - bn m3 0 3.0 1.1 0.7 0 8.3 3.7 1.0 0 18.5 13.2
Biomethane 0 3.0 1.1 0.7 0 8.1 3.7 1.0 0 12.0 12.0
Hydrogen 0 0 0 0 0 0.2 0 0 0 3.0 1.2
Green Syngas 0 0 0 0 0 0 0 0 0 3.5 0
Gas peak demand - mln m3 / day 467 458 451 N/A 461 429 423 N/A 454 399 388
The energy transition in Italy and the role of the gas and power sectors

2.3
28
2.3The Business As Usual (BAU) scenario.
The BAU scenario has been developed with a bottom-up approa-ch, characterised by regressive forecast models and switching techno-logy mechanisms, purely based on economic merit order with tech-nology-driven methods (i.e. switching from traditional to condensing boilers when the condensing boiler is economically cheaper).
BAU scenario is a current policy scenario, built considering moderate economic growth. It does not accomplish the policy tar-gets achievement set for 2030, neither the long-term indications.
Overall, the scenario is characterized by:
Moderate GDP growth and slight decrease in population. Value Added structure consistent with the current situation. Technology switching based on Total Cost of Ownership (TCO). Minimal incentive measures in energy efficiency. Renewables growth based on Levelized Cost of Electricity (LCoE). Economic phase-out of coal generation plants. Minimal investments in electrochemical storage systems.

2.3
29
▲ Figure 12. Key parameters and results of BAU scenario at 2030 and 2040. Source: Terna and Snam elaboration, 2019.
Demand (TWh): 340
Electrification (%): 24
Peak load (GW): 56
Demand (TWh): 371
Electrification (%): 26
Peak load (GW): 62
Electric
vehicles
+ 1.7M
BAU 2030 BAU 2040
Electric
HP
+ 1.8M
Gas
HP
+ 0.6M
PV, Wind and Hydro (TWh)
126
Thermoelectric (TWh)
197
(of which 27 renewables)
Wind (GW): 14
PV (GW): 31
Other RES (GW): 25
Thermal (GW): 50
Natural gas (bn m3): 79.6
Biomethane (bn m3): 0
Green syngas (bn m3): 0
Hydrogen (bn m3): 0
Natural gas (bn m3): 84.4
Biomethane (bn m3): 0
Green syngas (bn m3): 0
Hydrogen (bn m3): 0
Wind: 18
PV (GW): 47
Other RES (GW): 28
Thermal (GW): 50
PV, Wind and Hydro (TWh)
160
Thermoelectric (TWh)
201
(of which 26 renewables)
Electric
vehicles
+ 3.8M
CNG/H2
vehicles
+ 3.6M
Electric
HP
+ 2.5M
Gas
HP
+ 3.0M
TargetDemand
SupplyGeneration
Technologies
Final energy
consumption
(Mtep)
114
Electric RES
share (%)
44
Final energy
consumption
RES share (%)
20
CO2 reduction
VS 1990 (%)
~28
Final energy
consumption
(Mtep)
115
Electric RES
share (%)
48
Final energy
consumption
RES share (%)
23
CO2 reduction
VS 1990 (%)
~32
Demand (bn m3): 80
Share on final use (%): 33
Daily peak (Mm3): 461
Demand (Mm3): 84
Share on final use (%): 34
Daily peak (Mm3): 454
* Electric vehicles include BEV (Battery Electric Vehicle) and PHEV (Plug-in Hybrid Eletric Vehicles); CNG: Compressed Natural Gas
CNG/H2
vehicles
+ 1.7M
The energy transition in Italy and the role of the gas and power sectors

2.4
30
2.4The CENTRALIZED (CEN) scenario.
The Centralized scenario has been built with a top-down appro-ach, characterised by technology-pull technology switching mecha-nisms (i.e. technology diffusion as a function of the targets) and characterised by a check on target achievement and eventually by iterations.
It is a development scenario, built considering high economic growth. It accomplishes the target achievement set for 2030 in the Clean energy for all Europeans Package and the long-term indications. The name “Centralized” refers to a higher development in centrali-zed renewables/low carbon technologies (i.e. higher development in utility-scale wind and solar and higher usage of traditional thermal plants with green gas).
Overall, the scenario is characterized by:
High economic growth and slight growth in population. Binding decarbonisation, RES share and energy efficiency targets. Coal plants phase-out by 2025. High growth in renewable/low carbon dispatchable and
centralised technologies. Potential usage of CCS/CCU in industrial sector and electricity
production. High penetration of gas heat pumps and condensing boilers in
residential sector. Fast expansion of CNG and LNG vehicles. Fast diffusion of biomethane and green/decarbonized gas in order
to decarbonise transport, industry and residential sectors.

2.4
31
▲ Figure 13. Key parameters and results of CEN scenario at 2030 and 2040. Source: Terna and Snam elaboration, 2019.
Demand (TWh): 332
Electrification (%): 26
Peak load (GW): 57
Demand (TWh): 352
Electrification (%): 30
Peak load (GW): 60
Electric
vehicles
+ 2.8M
CEN 2030 CEN 2040
Electric
HP
+ 2.8M
Gas
HP
+ 1.7M
PV, Wind and Hydro (TWh)
149
Thermoelectric (TWh)
161
(of which 40 renewables)
Wind (GW): 17
PV (GW): 38
Other RES (GW): 26
Thermal (GW): 50
Natural gas (bn m3): 65.2
Biomethane (bn m3): 8.1
Green syngas (bn m3): 0
Hydrogen (bn m3): 0.2
Natural gas (bn m3): 58.0
Biomethane (bn m3): 12.0
Green syngas (bn m3): 3.5
Hydrogen (bn m3): 3.0
Wind: 22
PV (GW): 51
Other RES (GW): 27
Thermal (GW): 50
PV, Wind and Hydro (TWh)
181
Thermoelectric (TWh)
172
(of which 58 renewables & 41 CCS)
Electric
vehicles
+ 6.4M
CNG/H2
vehicles
+ 7.7M
Electric
HP
+ 3.8M
Gas
HP
+ 5.5M
TargetDemand
SupplyGeneration
Technologies
Final energy
consumption
(Mtep)
104
Electric RES
share (%)
55
Final energy
consumption
RES share (%)
30
CO2 reduction
VS 1990 (%)
~43
Final energy
consumption
(Mtep)
93
Electric RES
share (%)
62
Final energy
consumption
RES share (%)
44
CO2 reduction
VS 1990 (%)
~65
Demand (bn m3): 74
Share on final use (%): 36
Daily peak (Mm3): 429
Demand (Mm3): 77
Share on final use (%): 38
Daily peak (Mm3): 399
CNG/H2
vehicles
+ 4.8M
* Electric vehicles include BEV (Battery Electric Vehicle) and PHEV (Plug-in Hybrid Eletric Vehicles); CNG: Compressed Natural Gas
The energy transition in Italy and the role of the gas and power sectors
2.5
32
2.5The DECENTRALIZED (DEC) scenario.
The Decentralized scenario, as the CEN, is a development sce-nario, built using a top-down approach. It accomplishes the tar-get achievement set for 2030 in the Clean energy for all Europeans Package and the long-term indications. The name “Decentralized” refers to a higher development in decentralized renewables/low carbon technologies (i.e. small-scale solar plants and electrochemi-cal storage systems) and a higher electrification in final consumption (i.e. penetration of electric heat pump and electric vehicles).
Overall, the scenario is characterised by:
High economic growth and slight growth in population. Binding decarbonization, RES share and energy efficiency
targets. Coal plants phase-out by 2025. High growth in non-dispatchable renewables, mainly in
distributed generation. Potential usage of CCS/CCU in electricity production. Fast technology process in storage system paired with solar
plants, in terms of costs, lifetime and efficiency. High penetration of electric heat pumps in the residential sector. Fast expansion in electric vehicles18. Diffusion of biomethane and green/decarbonized gas to
decarbonise transport, industry and residential sectors.
18 Electric vehicles include Plug-In Electric Vehicles (PEV) and Plug-In Hybrid Electric Vehicles (PHEV).

2.5
33
▲ Figure 14. Key parameters and results of DEC scenario at 2030 and 2040. Source: Terna and Snam elaboration, 2019.
Demand (TWh): 356
Electrification (%): 28
Peak load (GW): 62
Demand (TWh): 391
Electrification (%): 35
Peak load (GW): 72
Electric
vehicles
+ 5.7M
DEC 2030 DEC 2040
Electric
HP
+ 3.7M
Gas
HP
+ 1.5M
PV, Wind and Hydro (TWh)
170
Thermoelectric (TWh)
161
(of which 33 renewables)
Wind (GW): 19
PV (GW): 49
Other RES (GW): 26
Thermal (GW): 50
Natural gas (bn m3): 64.8
Biomethane (bn m3): 3.7
Green syngas (bn m3): 0
Hydrogen (bn m3): 0
Natural gas (bn m3): 54.0
Biomethane (bn m3): 12.0
Green syngas (bn m3): 0
Hydrogen (bn m3): 1.2
Wind: 25
PV (GW): 70
Other RES (GW): 28
Thermal (GW): 50
PV, Wind and Hydro (TWh)
214
Thermoelectric (TWh)
175
(of which 51 renewables & 40 CCS)
Electric
vehicles
+ 9.9M
CNG/H2
vehicles
+ 3.0M
Electric
HP
+ 8.9M
Gas
HP
+ 2.3M
TargetDemand
SupplyGeneration
Technologies
Final energy
consumption
(Mtep)
103
Electric RES
share (%)
55
Final energy
consumption
RES share (%)
31
CO2 reduction
VS 1990 (%)
~41
Final energy
consumption
(Mtep)
90
Electric RES
share (%)
66
Final energy
consumption
RES share (%)
51
CO2 reduction
VS 1990 (%)
~65
Demand (bn m3): 69
Share on final use (%): 32
Daily peak (Mm3): 423
Demand (Mm3): 67
Share on final use (%): 32
Daily peak (Mm3): 388
CNG/H2
vehicles
+ 2.7M
* Electric vehicles include BEV (Battery Electric Vehicle) and PHEV (Plug-in Hybrid Eletric Vehicles); CNG: Compressed Natural Gas
The energy transition in Italy and the role of the gas and power sectors

2.6
34
2.6The PNIEC scenario.
The PNIEC scenario is the current Italian policy scenario, based on the National Energy and Climate Plan proposal. It sets the Italian target of decarbonization, RES share and energy efficiency for 2030 in accordance with the Clean energy for all Europeans Package.
It is a top-down scenario, built by the working group using data from the plan and other public documents.
Overall, the scenario is characterized by:
Economic growth and growth in population. Binding decarbonization, RES share and energy efficiency goals. Coal plants phase-out by 2025. High growth in non-dispatchable renewables, mainly wind
and solar. High growth in storage system, both electrochemical and
pumped hydro. Penetration of electric heat pumps in the residential sector. Penetration of electric vehicles and starting development
of hydrogen mobility.

2.6
35
PNIEC 2025 PNIEC 2030
TargetDomanda
OffertaGenerazione
Tecnologie
Demand (TWh): 325
Electrification (%): 23
Peak load (GW): 54
Demand (TWh): 330
Electrification (%): 25
Peak load (GW): 62
Electric
vehicles
~ + 2.0M
PV, Wind and Hydro (TWh)
116
Thermoelectric (TWh)
185
(of which 23 renewables)
Wind (GW): 16
PV (GW): 27
Other RES (GW): 24
Thermal (GW): 49
Natural gas (bn m3): 70
Biomethane (bn m3): 0.7
Green syngas (bn m3): 0
Hydrogen (bn m3): 0
Natural gas (bn m3): 61
Biomethane (bn m3): 1
Green syngas (bn m3): 0
Hydrogen (bn m3): 0
Wind: 18
PV (GW): 51
Other RES (GW): 24
Thermal (GW): 50
PV, Wind and Hydro (TWh)
164
Thermoelectric (TWh)
146
(of which 23 renewables)
Electric
vehicles
+ 6.0M
CNG/H2
vehicles
+ 1.5M
Final energy
consumption
(Mtep)
109
Electric RES
share (%)
N/A
Final energy
consumption
RES share (%)
23
CO2 reduction
VS 1990 (%)
N/A
Final energy
consumption
(Mtep)
104
Electric RES
share (%)
55
Final energy
consumption
RES share (%)
30
CO2 reduction
VS 1990 (%)
40
Demand (bn m3): 70.7
Share on final use (%): 28
Daily peak (Mm3): N/D
Demand (Mm3): 62
Share on final use (%): 28
Daily peak (Mm3): N/D
CNG/H2
vehicles
~ + 0.7M
* Electric vehicles include BEV (Battery Electric Vehicle) and PHEV (Plug-in Hybrid Eletric Vehicles); CNG: Compressed Natural Gas
▲ Figure 15. Key parameters and results of PNIEC scenario at 2025 and 2030. Source: Terna and Snam elaboration, 2019.
The energy transition in Italy and the role of the gas and power sectors
By
36
The roleof gas sectorin energytransition
3.0
3.1The demand for gas in Italy and uses by sector.
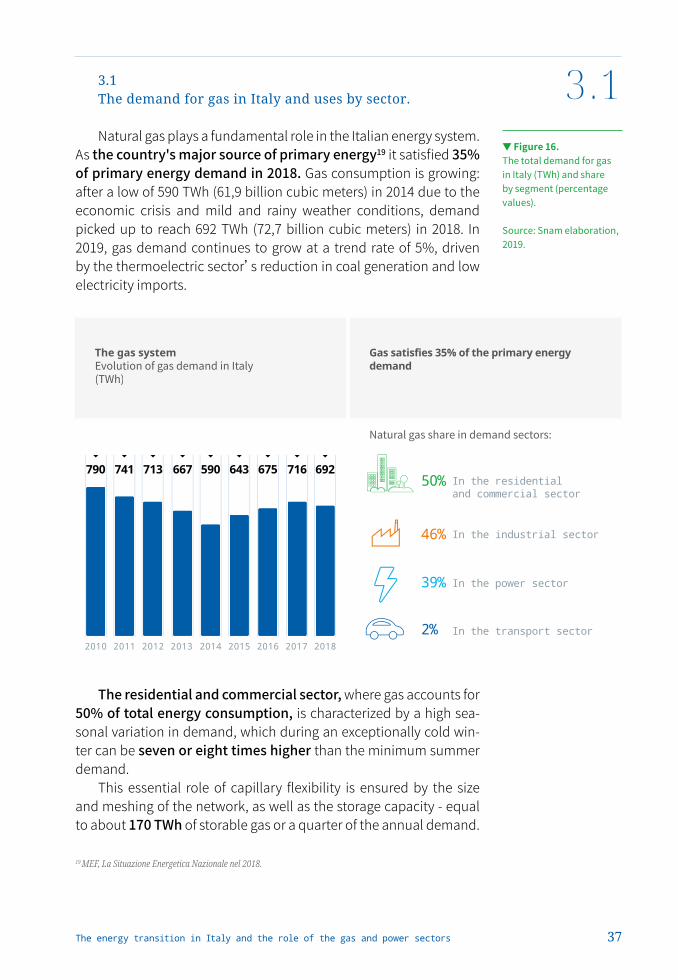
Natural gas plays a fundamental role in the Italian energy system. As the country's major source of primary energy19 it satisfied 35% of primary energy demand in 2018. Gas consumption is growing: after a low of 590 TWh (61,9 billion cubic meters) in 2014 due to the economic crisis and mild and rainy weather conditions, demand picked up to reach 692 TWh (72,7 billion cubic meters) in 2018. In 2019, gas demand continues to grow at a trend rate of 5%, driven by the thermoelectric sector’s reduction in coal generation and low electricity imports.
The residential and commercial sector, where gas accounts for 50% of total energy consumption, is characterized by a high sea-sonal variation in demand, which during an exceptionally cold win-ter can be seven or eight times higher than the minimum summer demand.
This essential role of capillary flexibility is ensured by the size and meshing of the network, as well as the storage capacity - equal to about 170 TWh of storable gas or a quarter of the annual demand.
37
3.1
19 MEF, La Situazione Energetica Nazionale nel 2018.
790
2010
741
2011
713
2012
667
2013
590
2014
643
2015
675
2016
716
2017
692
2018
The gas system Gas satisfies 35% of the primary energy
demand
In the industrial sector46%
In the power sector39%
In the transport sector2%
In the residential and commercial sector
50%
▼ Figure 16. The total demand for gas in Italy (TWh) and share by segment (percentage values). Source: Snam elaboration, 2019.
The energy transition in Italy and the role of the gas and power sectors

38
3.1Storage can cover a large part of this seasonal demand variation: in times of need, natural gas storage can release 2 TWh / day. Storage provides an hourly, daily, monthly, seasonal and multi-year service.
As for the industrial sector, natural gas today covers 46% of energy consumption. Across all industries, more than 60% of gas is consumed in sectors involving high temperature processes. In those sectors, security of gas supply, which guarantees the continuity of the production process, and lower gas costs, if compared to other fuels, are key elements for national manufacturers to be competitive on international markets.
400
350
300
250
200
150
50
100
01/0
1/20
18
26/0
2/20
18
23/0
4/20
18
18/0
6/20
18
13/0
8/20
18
08/1
0/20
18
29/0
1/20
18
26/0
3/20
18
21/0
5/20
18
16/0
7/20
18
10/0
9/20
18
05/1
1/20
18
17/1
2/20
18
15/0
1/20
18
12/0
3/20
18
07/0
5/20
18
02/0
7/20
18
27/0
8/20
18
22/1
0/20
18
12/0
2/20
18
09/0
4/20
18
04/0
6/20
18
30/0
7/20
18
24/0
9/20
18
19/1
1/20
1803
/12/
2018
31/1
2/20
18
0
3,8
TWh
Millionsof cubicmeters
3,0
2,4
1,8
0,6
1,2
3,63,4
2,8
2,2
1,6
1,0
3,2
2,6
2,0
1,4
0,8
00,20,4
StorageProduction &Imports
Consumption
▼ Figure 17. Daily values for consumption, production, imports and storage of natural gas (millions of cubic meters and TWh), 2018. Source: Snam elaboration, 2019.

39
3.2In the thermoelectric sector, gas is replacing other fossil fuels
with high carbon content and pollutants. The addition of approxi-mately 35 GW of gas combined cycle plants from 2000 to 2010, has almost completely replaced fuel oil generation, helping to avoid around 100 MtCO2 of emissions over the decade. In addition, they favoured the displacement of coal, decreasing its electricity genera-tion from 55.5 TWh in 2012 to 32.1 TWh in 2018. As a result of the abo-ve-mentioned development, the share of the electricity production from gas rose from 37% in 2000 to 44% in 2018.
In the early months of 2019, thanks to the strong decrease in natural gas prices and the increase in the cost of CO2, the switch from coal to gas in the power sector accelerated again with a further 30% decline in coal generation. Permitting processes have also started for the construction of 3.2 GW of flexible gas power, with the aim to total-ly displace coal by 2025.
Finally, gas also plays a key role in mobility. A cumulative con-sumption in the transport sector of 1.1 billion cubic meters makes Italy the leading European country in gas mobility: 1300 refuelling stations supply approximately 900,000 cars and 100,000 commercial vehicles.
20 The price of CO2 has moved from € 15.9/ton in 2018 to € 24.5 /ton in the period January-August of 2019.21 In the period January-August 2019 compared to the same period in 2018.
The energy transition in Italy and the role of the gas and power sectors

3.2
40
3.2 The supply of gas in Italy.
The Italian gas infrastructure system is able to manage fluctua-tions on both the demand and supply sides. Italy has several sources of supply, with two routes from Northern and Eastern Europe, two from North Africa, and three LNG terminals, which allow to connect the country to the global market.
The supply portfolio mix has shifted towards more flexible and integrated sources from global markets, such as LNG (volumes in the first half of 2019 have increased by 90% compared to 2018). A further diversification of the supply will be guaranteed by the almost-com-plete Southern Corridor connecting Italy with Turkey and Azerbai-jan. In addition, new export capacities are available at the Tarvisio and Passo Gries Exit Points, for a total daily value of 40 million cubic meters.
The ample portfolio of supply options, as well as the startup of biomethane national production, compensate for the progressive reduction of national natural gas production and contribute to the security of the national and European gas system22.
Russia Algeria NorthernEurope
Libya LNG Other
2011
70.4
2012
67.7
2013
62.0
2010
75.3
2014
55.8
2015
61.2
2016
65.3
2017
69.6
2018
67.9
H12019
37.5
91% 90% 93% 93%
22 ENTSOG, "TYNDP 2018", 2020 Best Estimate: Italy has the highest index of access to the supply source (SSA) which measures the number of supply sources a country can access.
▼ Figure 18. Italian natural gas imports (billions of cubic meters), 2010-2019. Source: Snam based on data from the Ministry of Economic Development, 2019.
3.3
41
3.3 The contribution of the gas system to decarbonisation.
The long-term goal of containing global warming to well below 2°C calls for the energy system to undertake an effective, sustainable and deep decarbonisation path in all sectors while ensuring security of supply and affordable energy cost for both household and enter-prises.
Snam and Terna’s development scenarios, illustrated in Chap-ter 2, comply with the long-term deep decarbonisation targets (-40% of CO2 at 2030 and -65% at 2040) and highlight the strategic value of the gas system. According to the scenarios, total gas consumption (renewable, low carbon and natural), will be between 642 and 724 TWh in 2040.
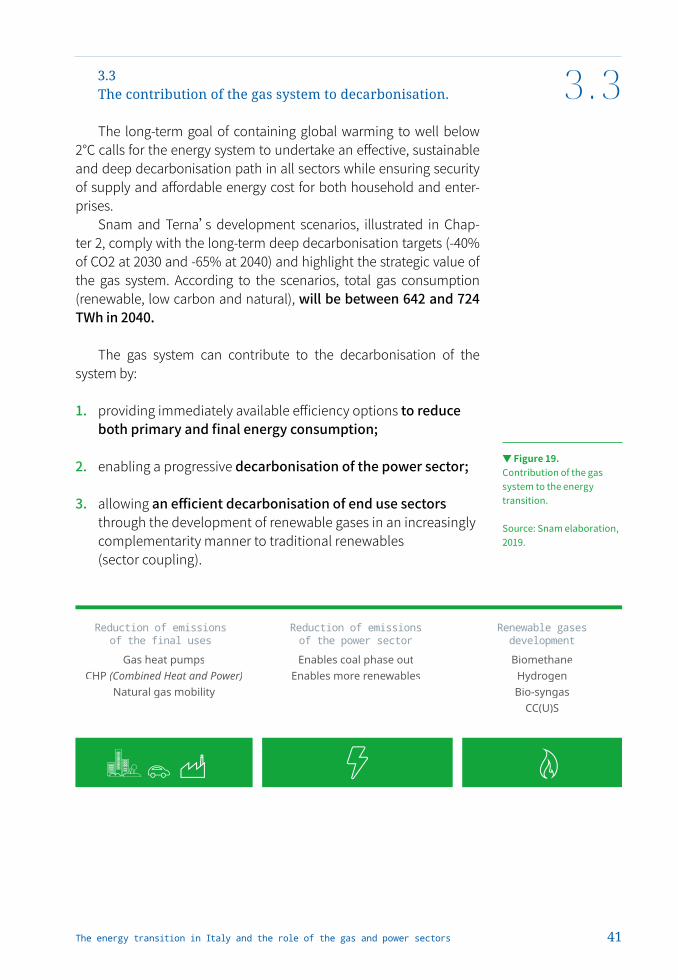
The gas system can contribute to the decarbonisation of the system by:
1. providing immediately available efficiency options to reduce both primary and final energy consumption;
2. enabling a progressive decarbonisation of the power sector;
3. allowing an efficient decarbonisation of end use sectors through the development of renewable gases in an increasingly complementarity manner to traditional renewables (sector coupling).
▼ Figure 19. Contribution of the gas system to the energy transition. Source: Snam elaboration, 2019.
Reduction of emissionsof the final uses
Gas heat pumps
CHP (Combined Heat and Power)Natural gas mobility
Reduction of emissionsof the power sector
Enables coal phase out
Enables more renewables
Renewable gasesdevelopment
Biomethane
Hydrogen
Bio-syngas
CC(U)S
The energy transition in Italy and the role of the gas and power sectors
42
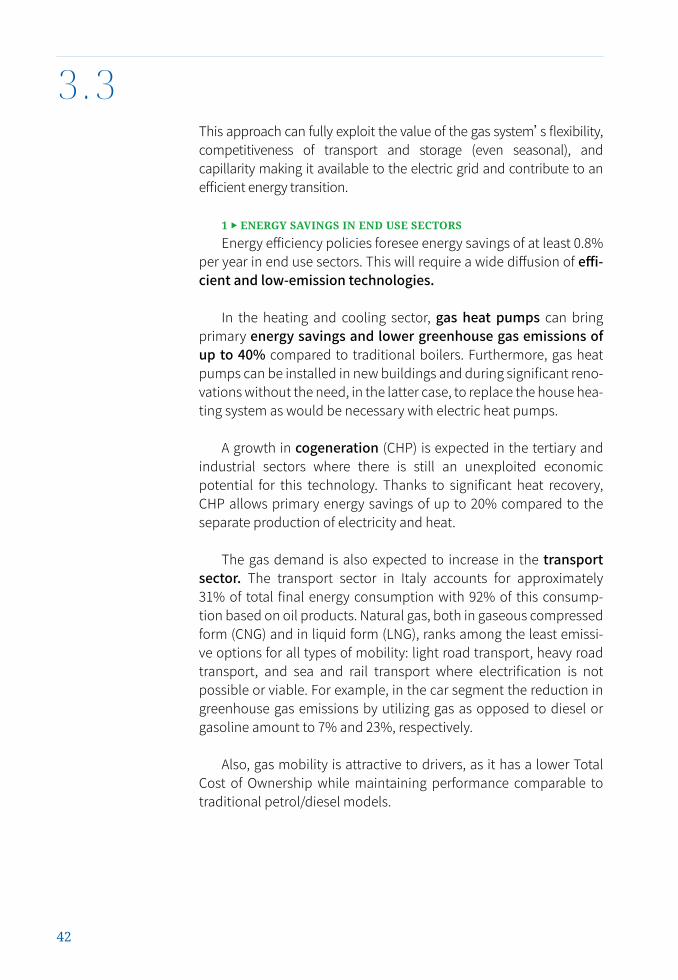
This approach can fully exploit the value of the gas system’s flexibility, competitiveness of transport and storage (even seasonal), and capillarity making it available to the electric grid and contribute to an efficient energy transition.
1 ▶ ENERGY SAVINGS IN END USE SECTORSEnergy efficiency policies foresee energy savings of at least 0.8%
per year in end use sectors. This will require a wide diffusion of effi-cient and low-emission technologies.
In the heating and cooling sector, gas heat pumps can bring primary energy savings and lower greenhouse gas emissions of up to 40% compared to traditional boilers. Furthermore, gas heat pumps can be installed in new buildings and during significant reno-vations without the need, in the latter case, to replace the house hea-ting system as would be necessary with electric heat pumps.
A growth in cogeneration (CHP) is expected in the tertiary and industrial sectors where there is still an unexploited economic potential for this technology. Thanks to significant heat recovery, CHP allows primary energy savings of up to 20% compared to the separate production of electricity and heat.
The gas demand is also expected to increase in the transport sector. The transport sector in Italy accounts for approximately 31% of total final energy consumption with 92% of this consump-tion based on oil products. Natural gas, both in gaseous compressed form (CNG) and in liquid form (LNG), ranks among the least emissi-ve options for all types of mobility: light road transport, heavy road transport, and sea and rail transport where electrification is not possible or viable. For example, in the car segment the reduction in greenhouse gas emissions by utilizing gas as opposed to diesel or gasoline amount to 7% and 23%, respectively.
Also, gas mobility is attractive to drivers, as it has a lower Total Cost of Ownership while maintaining performance comparable to traditional petrol/diesel models.
3.3
43
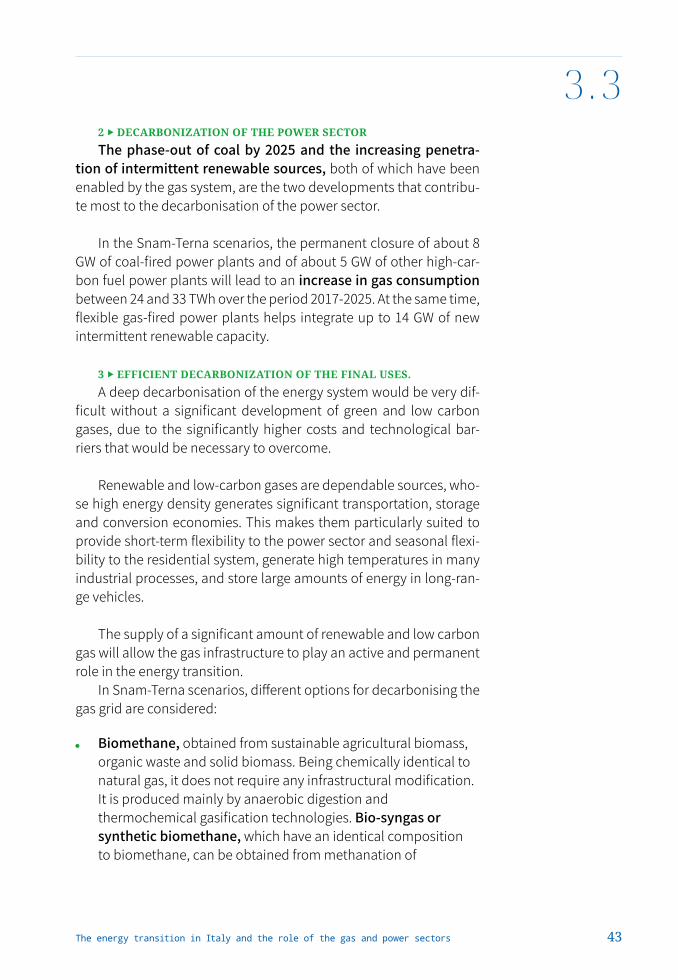
2 ▶ DECARBONIZATION OF THE POWER SECTORThe phase-out of coal by 2025 and the increasing penetra-
tion of intermittent renewable sources, both of which have been enabled by the gas system, are the two developments that contribu-te most to the decarbonisation of the power sector.
In the Snam-Terna scenarios, the permanent closure of about 8 GW of coal-fired power plants and of about 5 GW of other high-car-bon fuel power plants will lead to an increase in gas consumption between 24 and 33 TWh over the period 2017-2025. At the same time, flexible gas-fired power plants helps integrate up to 14 GW of new intermittent renewable capacity.
3 ▶ EFFICIENT DECARBONIZATION OF THE FINAL USES.A deep decarbonisation of the energy system would be very dif-
ficult without a significant development of green and low carbon gases, due to the significantly higher costs and technological bar-riers that would be necessary to overcome.
Renewable and low-carbon gases are dependable sources, who-se high energy density generates significant transportation, storage and conversion economies. This makes them particularly suited to provide short-term flexibility to the power sector and seasonal flexi-bility to the residential system, generate high temperatures in many industrial processes, and store large amounts of energy in long-ran-ge vehicles.
The supply of a significant amount of renewable and low carbon gas will allow the gas infrastructure to play an active and permanent role in the energy transition.
In Snam-Terna scenarios, different options for decarbonising the gas grid are considered:
Biomethane, obtained from sustainable agricultural biomass, organic waste and solid biomass. Being chemically identical to natural gas, it does not require any infrastructural modification. It is produced mainly by anaerobic digestion and thermochemical gasification technologies. Bio-syngas or synthetic biomethane, which have an identical composition to biomethane, can be obtained from methanation of
3.3
The energy transition in Italy and the role of the gas and power sectors

3.3
44
renewable hydrogen with CO2 recovered from many types of emissive processes. The support scheme now in place in Italy incentivizes the production of advanced biomethane for the transport sector. To date, the connections to the gas grid have been signed amount to around 4 TWh. However, it is estimated that potential supply could reach 76 TWh in 2030. Both of the Snam-Terna development scenarios forecast a biomethane supply of 114 TWh from anaerobic digestion and thermochemical gasification in 2040. The Centralized scenario also contemplates 33 TWh of bio-syngas from methanation, for a total supply of 147 TWh.
Renewable hydrogen, obtained through the electrolysis of water with renewable electricity. Its chemical-physical characteristics, including a high energy density per unit of mass, make it very competitive for all activities that involve transport and storage of energy, especially over long distances and for long time-lags between production and use (e.g.: for transporting and storing electricity converted into gaseous form; to decarbonise sectors that have high-temperature thermal processes; or use fuels as a feedstock for non-energy conversions). The continuous reduction of investment costs for wind, photovoltaic and electrolysers will allow to reduce the production costs of renewable hydrogen down to 1.5-2.5 eur/kg (38-63 €/MWh). Hydrogen can be transported and stored both in mixture with natural gas and in pure form in dedicated pipelines. Analyses are under way to enable the grid injection of higher amounts of hydrogen "blended" with natural gas, allowing a first phase of large-scale development at a minimal infrastructure costs and enabling sector coupling already in the medium term.
Low-carbon hydrogen, obtained from various processes such as "gas steam reforming" associated with CO2 capture and storage. The advantage of this process is that the separation of CO2 (and CO) from H2 is easier than in the post-combustion capture process: CO2 concentration and pressure are relatively high, allowing very efficient separation methods.
23 Biomethane Decree of 2 March 2018.

3.4
45
Post-combustion carbon capture and storage (CCS), in which CO2 is extracted from the flue gas of combustion (a mixture of CO2, N2, H2O and O2). The advantage of CCS post-combustion is that it can be applied to existing installations, such as power plants or large industrial installations.
3.4 The challenges of the energy transition for the gas system.
In order to face the challenges of energy transition the gas system has to undertake three different courses of action:
1. Ensuring competitiveness, liquidity and sustainability of the system, being the enabler of the energy transition, integrating renewable electricity and thermal sources and replacing high-carbon fuels, while maintaining and improving security and adequacy of supply and quality of service.
2. Increasing the flexibility of the system through a growing availability of flexibility resources that will have to be activate quickly and on specific locations of the network to integrate a growing share of intermittent renewable electricity sources, pursuing a joint gas-electricity adequacy condition.
3. Supporting a sustained growth of renewable gases by 2040, with a foreseeable further increase to 2050, creating the regulatory and industrial conditions to support their development; guaranteeing their quality; allowing their transport, storage and distribution; and enabling their penetration in end use sectors.
The energy transition in Italy and the role of the gas and power sectors

46
3.5 Enabling factors for the gas system transition.
At the same time, it is necessary to create the conditions useful for the realization of four enabling factors for the energy transition of the gas system in Italy and achieve the results desirable from the courses of action.
1 ▶ INCREASING COMPETITIVENESS AND EFFICIENCY OF THE GAS SYSTEM
It is necessary to increase the security of supply, European market integration, and liquidity of the Italian market (e.g. the interconnection project with the TAP and the increase in intercon-nection capacity between Germany and Switzerland).
At the same time, it will be necessary to preserve the functiona-lity of gas infrastructure assets over time, develop the LNG supply chain for maritime and terrestrial transport where feasible by modi-fying existing terminals and infrastructures, and also develop the CNG supply chain for sustainable mobility by boosting the penetra-tion of BioLNG and BioCNG in the transport sector.
3.5
Develop and integraterenewable gases
Ensurecompetitivness and
liquidity of the system
Increase flexibilityof the system
R&D
and innovation
▲ Figure 20. The courses of action for the gas system. Source: Snam elaboration, 2019.

47
The reduction of emissions and the increase in energy efficiency should take place both in the network and in buildings. It is notewor-thy the potential contributions offered by both the project of gas-e-lectric hybrid compressor stations and by the actions planned to reduce fugitive methane emissions, for which Snam has already set voluntary targets (-15% in 2022 and -25% in 2025).
Fundamental support for the maintenance and development of gas infrastructures, linked to the transformation towards renewable gases and decarbonisation, will have to come from long-term finan-cing sources based on a principle of technological neutrality.
2 ▶ INCREASING THE FLEXIBILITY OF THE SYSTEMIt is necessary to make the storage system more responsive
to the hourly and daily peak demand, which is expected to grow because of an increasing share of intermittent renewable sources in the power sector. Moreover, a greater withdrawal from storage in the winter period would allow gas imports to be reduced in the months of higher consumption and higher prices, and increased during the summer period when prices tend to be lower.
The flexibility needed to integrate renewable energies can be created also through coordinated actions on gas and electricity systems, such as the possible conversion of transport and storage compressor stations from gas to electricity to reduce energy con-sumption and CO2 emissions.
3 ▶ ENABLING THE GROWTH OF RENEWABLE GASESThe development of renewable and low carbon gases, also
through new emerging technologies, requires:
Support for research and development activities, aimed to increase the maturity of the most suitable technologies along the value chain, as well as at guaranteeing the "readiness" of gas infrastructure to receive growing shares of hydrogen. Technical regulations will have to be modified accordingly. A sound market design able to reveal and value the positive
externalities of these resources, such as dependability. Innovative ways to monitor and guarantee the quality of the
various renewable gases from diverse producers, as well as - for transport / storage activities of hydrogen blended with methane - the appropriate physical concentration along the infrastructures.
3.5
The energy transition in Italy and the role of the gas and power sectors
48
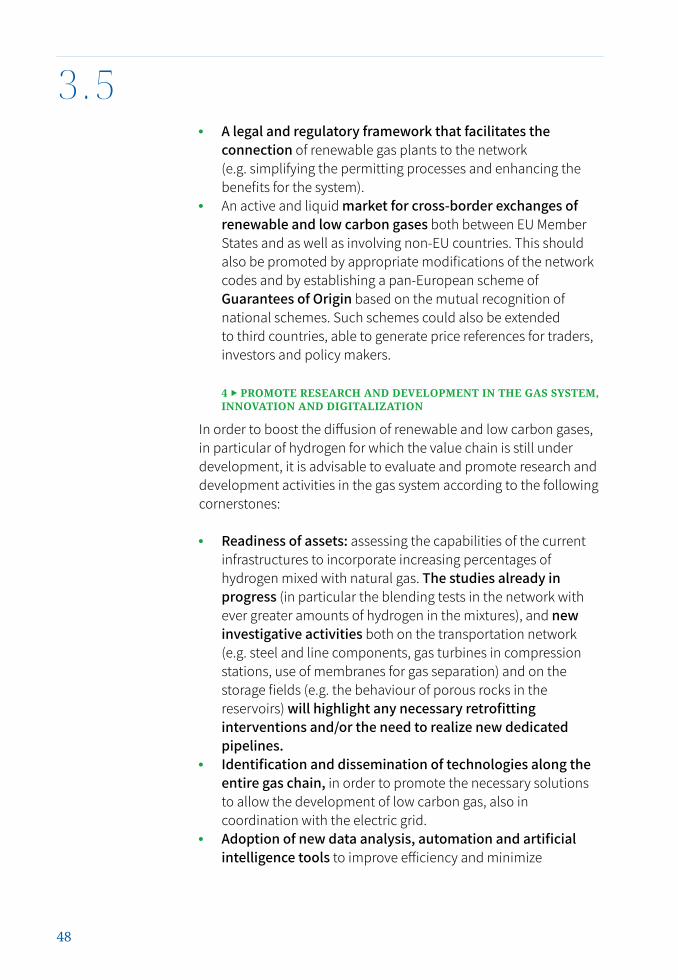
A legal and regulatory framework that facilitates the connection of renewable gas plants to the network (e.g. simplifying the permitting processes and enhancing the benefits for the system). An active and liquid market for cross-border exchanges of
renewable and low carbon gases both between EU Member States and as well as involving non-EU countries. This should also be promoted by appropriate modifications of the network codes and by establishing a pan-European scheme of Guarantees of Origin based on the mutual recognition of national schemes. Such schemes could also be extended to third countries, able to generate price references for traders, investors and policy makers.
4 ▶ PROMOTE RESEARCH AND DEVELOPMENT IN THE GAS SYSTEM, INNOVATION AND DIGITALIZATION
In order to boost the diffusion of renewable and low carbon gases, in particular of hydrogen for which the value chain is still under development, it is advisable to evaluate and promote research and development activities in the gas system according to the following cornerstones:
Readiness of assets: assessing the capabilities of the current infrastructures to incorporate increasing percentages of hydrogen mixed with natural gas. The studies already in progress (in particular the blending tests in the network with ever greater amounts of hydrogen in the mixtures), and new investigative activities both on the transportation network (e.g. steel and line components, gas turbines in compression stations, use of membranes for gas separation) and on the storage fields (e.g. the behaviour of porous rocks in the reservoirs) will highlight any necessary retrofitting interventions and/or the need to realize new dedicated pipelines. Identification and dissemination of technologies along the
entire gas chain, in order to promote the necessary solutions to allow the development of low carbon gas, also in coordination with the electric grid. Adoption of new data analysis, automation and artificial
intelligence tools to improve efficiency and minimize
3.5

49
operational risks. The main areas of interest are: Big Data & AI, to extract the maximum value from data for the purpose of optimizing operational activities, such as asset maintenance, guaranteeing reliability and increasingly improving security; and the IIOT (Industrial Internet of Things), to optimize with the use of sensors the performance of network control, and to manage activities and Automation for optimal review of business processes.
3.5
The energy transition in Italy and the role of the gas and power sectors

By
50
The role ofthe power sectorin the energy transition
4.0

4.1The power sector in the energy transition.
The exponential increase in global primary energy consump-tion, the persistent increase in CO2 emissions and their effects on the ecosystem and the growing attention of international institu-tions to climate and environmental issues are evidence that the cur-rent energy model that fuelled the recent growth of the global economy is no longer sustainable. A worldwide commitment is required to progressively decarbonise all energy sectors and reduce overall consumption by increasing energy efficiency. Moreover, it is essential to achieve these goals as soon as possible.
The power sector plays a central role in decarbonizing the whole energy system, thanks to the intrinsic efficiency of electricity and the technological maturity of renewables such as wind and solar. Even though today electricity ranks third in final energy consumption coverage (around 1/5 of the total), it is the sector with the highest share of renewables already today (35%), much higher than the overall share of renewables in final energy consumption (18%).
The greater penetration of electricity in the residential, industrial and transport sectors, together with an increasing share of renewables in the energy production mix are essential elements in radically chan-ging the current energy paradigm and improving the quality of life in big cities, where already today and even more in the future an ever-increa-sing share of the global population is concentrated.
51
4.1
35%
RES in final electricityconsumption
18%
RES in final energyconsumption
35%
RES in final electricityconsumption
18%
RES in final energyconsumption
▼ Figure 21. Final energy consumption by energy vector and share of RES in final electricity consumption and final total energy consumption. Source: Terna data based on Eurostat 2017 and MiSE data.
ELECTRICITY 22%
GAS 30%
LIQUID 34%
SOLID 7%
DERIVED HEAT 4%
OTHER 3%
The energy transition in Italy and the role of the gas and power sectors

4.1
52
Electrification and the increasing diffusion of renewables are trends that have already been on-going for several years in many OECD countries. In Italy, in particular, the share of electricity in final consumption has grown from 17% in 1990 to 22% in 2017, while the RES share in electricity consumption increased to 35% in 2018 thanks to the integration of more than 30 GW of new renewable capa-city into the Electricity System.
Despite these results, the road to decarbonisation is still long and the objectives to be achieved in the coming years remain extremely challenging.
In fact, the ambitious goals set out in the draft National Integra-ted Plan for Energy and Climate (NECP) include a complete pha-se-out of coal by 2025 and a RES coverage of more than half of gross electricity consumption (55.4%) by 2030. To this end, by 2030 it will be necessary to install approximately 40 GW of new RES capacity, relying almost exclusively on intermittent renewables such as wind and solar. Moreover, the Terna – Snam scenarios indicate a fur-ther growth in the RES share by 2040, ranging from 62% in the Cen-tralized scenario to 65% in the Decentralized scenario.
Traditional Wind power Geothermoelectric Hydroelectric Photovoltaic Bioenergy
2005 2006 2007 2008 2009 2010 2011 2012 2013 2014 2015 2016 2017 2018
330 337 340 339 320 330 335 328 318 311 317 314 321 321
35%RES*14%
RES*
50%Thermal
72%Thermal
Foreign exchange and energy for pumping
*RES does not include energy produced by hydroelectric pumping
▲ Figure 22. Evolution of electricity demand and production mix (TWh), 2005-2018. Source: Terna data, 2019.
4.2
53
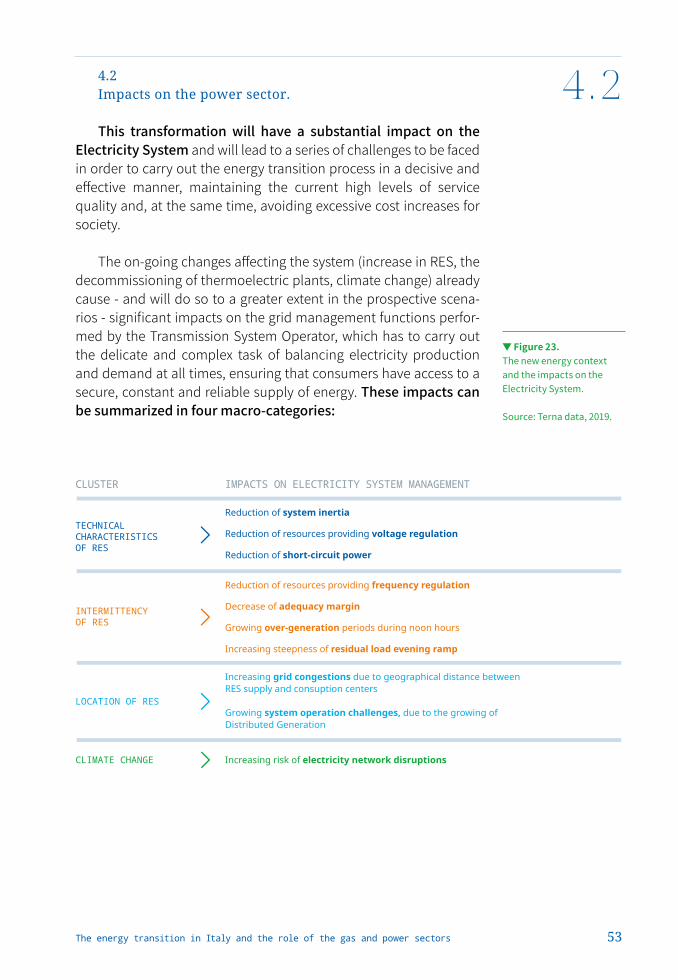
4.2Impacts on the power sector.
This transformation will have a substantial impact on the Electricity System and will lead to a series of challenges to be faced in order to carry out the energy transition process in a decisive and effective manner, maintaining the current high levels of service quality and, at the same time, avoiding excessive cost increases for society.
The on-going changes affecting the system (increase in RES, the decommissioning of thermoelectric plants, climate change) already cause - and will do so to a greater extent in the prospective scena-rios - significant impacts on the grid management functions perfor-med by the Transmission System Operator, which has to carry out the delicate and complex task of balancing electricity production and demand at all times, ensuring that consumers have access to a secure, constant and reliable supply of energy. These impacts can be summarized in four macro-categories:
CLUSTER IMPACTS ON ELECTRICITY SYSTEM MANAGEMENT
TECHNICALCHARACTERISTICSOF RES
Reduction of system inertia
Reduction of resources providing voltage regulation
Reduction of short-circuit power
Reduction of resources providing frequency regulation
Decrease of adequacy margin
Growing over-generation periods during noon hours
Increasing steepness of residual load evening ramp
INTERMITTENCYOF RES
LOCATION OF RES
Increasing grid congestions due to geographical distance between
RES supply and consuption centers
Growing system operation challenges, due to the growing of
Distributed Generation
CLIMATE CHANGE Increasing risk of electricity network disruptions
▼ Figure 23. The new energy context and the impacts on the Electricity System. Source: Terna data, 2019.
The energy transition in Italy and the role of the gas and power sectors

4.2
54
Technical characteristics: RES plants usually interface with the network through the use of static machines (e.g. inverters), which, unlike the typical rotating machines of traditional generation, do not have the same capability to support the stability of fundamental network parameters (frequency and voltage) and to cope with disruption caused by the sudden and unexpected loss of generation capacity or load or other grid elements; Intermittency: electricity production from intermittent
RES does not follow demand, but rather the availability of the underlying energy resource, such as sun or wind, which is subject to weather conditions. In an electricity system with increasing RES penetration, this can lead to challenges in balancing production and consumption because of the reduction of resources able to provide balancing services, especially during critical moments for the electricity system such as peaks and load ramps. The system will also be "structurally" exposed to periods in which production from RES exceeds electricity demand (over-generation), especially around noon, when the solar generation reaches its maximum, with the consequent need to implement an adequate level of storage to avoid the curtailment of energy; Location: RES plants, in particular wind power, are often
located far away from consumption centers, causing an increase in transmission network congestion, especially from South to North (Figure 24). In addition, due to most of RES plants being connected to MV/LV distribution networks, which are traditionally characterized only by electrical loads, new challenges are emerging in the management of the electricity system. Among these are the reduced selectivity of protection systems, the reduced effectiveness of Defens Plans and the possible inadequacy of monitoring systems and automatisms designed for unidirectional operation; Climate Change: the higher frequency of extreme weather
events, already perceivable today, results in a higher probability of significant damage to the country's infrastructure, including electricity transmission assets, augmenting the risk of service interruptions.

4.2
55
The effects of the above-mentioned challenges are amplified by the structural characteristics of the Italian power grid resulting from the geography of the country (e.g. the limited possibility for interconnection with the European continent, transmission constraints between Northern and Southern Italy and the islands), which will make management of the electricity system even more complex under the new conditions.
North
44%
Center North
12%
Sardiniaddrdi
4%
Sicily
7%
Center North
1%
Sardiniadrdi
10%
◀ Figure 24. Photovoltaic and wind power installed in Italy by market area. Source: Terna data, 2019.
Photovoltaic
Wind
The energy transition in Italy and the role of the gas and power sectors

4.2
56
The new context puts pressure on all the key dimensions that the TSO must closely observe in order to manage the electricity system:
System security, i.e. the ability of the electricity system to withstand changes in the operating status due to sudden disruption, avoiding violation of the system's operating limits;
Adequacy: The Electricity System is considered adequate if it has production, storage, demand control and transportation capacity resources able to satisfy expected demand, with a margin of adequacy in any given period;
Quality of supply, i.e. the ability to guarantee continuity of the service (i.e. avoiding interruptions) and to ensure quality of service (i.e. keeping frequency and voltage within their limits);
Resilience, i.e. the capability to withstand stress on the grid that is exceeding its design limits, and to return to normal operating status, if necessary through temporary measures;
Efficiency, which means the ability to manage the Electricity System meeting the requirements of system security, adequacy and quality, at the lowest possible total cost for the citizen/user.
SystemSecurity
Adequacy Resilience Efficiency Quality of supply
Role of TSO
Extreme climatic events
Electrification Thermoelectric generationdecommissioning
RES growth
▲ Figure 25. Key dimensions of the Electricity System. Source: Terna data, 2019.

4.3
57
4.3 Factors enabling the Electricity System transition.
Given the above, Terna takes the view that a full integration of renewables into the electricity system can only be achieved by imple-menting a set of essential, coordinated and coherent actions. The actions and interventions identified by Terna for the achievement of the national decarbonisation objectives can be grouped into four categories:
1. Investment in the National Transmission Grid and in Inter-connections with foreign countries, as set out in the Development Plan, prepared annually by Terna and based on the current network situation and the future needs of the electricity system. All the network interventions planned by Terna are prepared taking into consideration the key drivers of decarbonisation, safety, quality, market efficiency and sustainability, as well as the need to boost network resilience.
More specifically, work on the internal transmission network will be necessary for the optimal use of national production plants and to minimize inter-zonal congestion risk. Therefore, interventions are planned not only to upgrade existing assets and build new ones
▼ Figure 26. Factors enabling the Electricity System transition. Source: Terna data, 2019.
1 TRANSMISSION GRIDDEVELOPMENT
• Strengthening of North-South backbone and grid reinforcements in the South of Italy and the Islands• Foreign interconnections• Investments in voltage regulation and to increase the inertia of the electricity system• Interventions to strengthen grid resilience
2 LONG-TERM PRICE SIGNALS
• Capacity market to deliver long-term price signal to encourage investments in new efficient and flexible thermal generation• Auctions and Power Purchase Agreements (PPAs) for RES capacity• Long-term contracts through competitive procurement for new storage capacity, hydroelectric included
3 MARKET EVOLUTION
• Evolution of the structure of the ancillary services market to cope with new needs (voltage regulation, inertia...)• Participation of new flexible resources in ancillary services market,i.e. demand, distributed generation, variable renewable energy sources and storage, including electric veichle-to grid• Progressive integration with European ancillary services markets
4 INNOVATION ANDDIGITALISATION
• Digitalisation of the Transmission Grid (Assets and processes) and of the Electricity System management
The energy transition in Italy and the role of the gas and power sectors
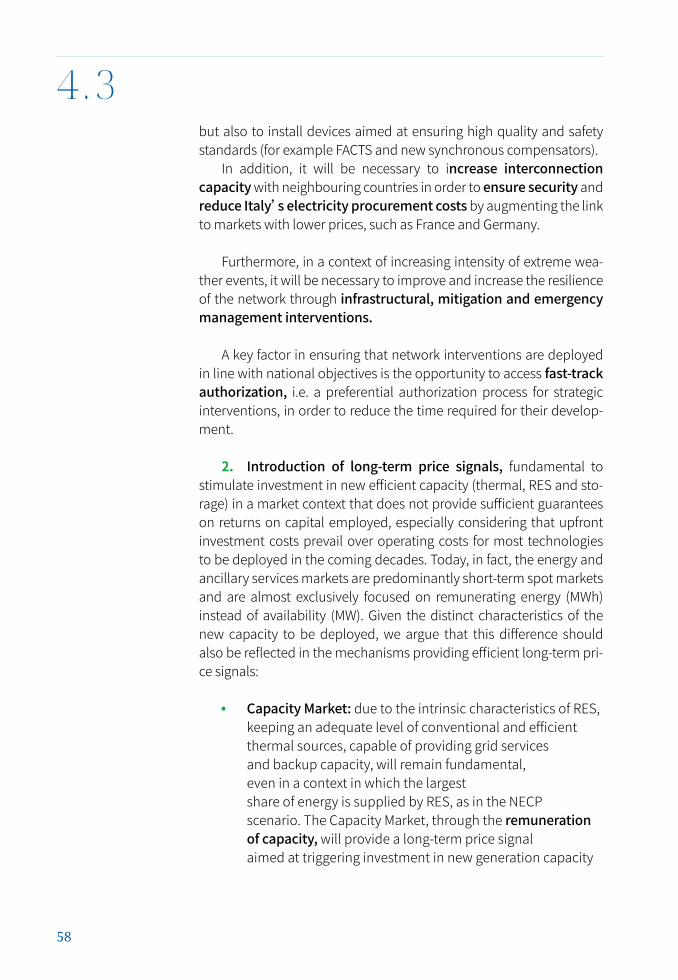
58
but also to install devices aimed at ensuring high quality and safety standards (for example FACTS and new synchronous compensators).
In addition, it will be necessary to increase interconnection capacity with neighbouring countries in order to ensure security and reduce Italy’s electricity procurement costs by augmenting the link to markets with lower prices, such as France and Germany.
Furthermore, in a context of increasing intensity of extreme wea-ther events, it will be necessary to improve and increase the resilience of the network through infrastructural, mitigation and emergency management interventions.
A key factor in ensuring that network interventions are deployed in line with national objectives is the opportunity to access fast-track authorization, i.e. a preferential authorization process for strategic interventions, in order to reduce the time required for their develop-ment.
2. Introduction of long-term price signals, fundamental to stimulate investment in new efficient capacity (thermal, RES and sto-rage) in a market context that does not provide sufficient guarantees on returns on capital employed, especially considering that upfront investment costs prevail over operating costs for most technologies to be deployed in the coming decades. Today, in fact, the energy and ancillary services markets are predominantly short-term spot markets and are almost exclusively focused on remunerating energy (MWh) instead of availability (MW). Given the distinct characteristics of the new capacity to be deployed, we argue that this difference should also be reflected in the mechanisms providing efficient long-term pri-ce signals:
Capacity Market: due to the intrinsic characteristics of RES, keeping an adequate level of conventional and efficient thermal sources, capable of providing grid services and backup capacity, will remain fundamental, even in a context in which the largest share of energy is supplied by RES, as in the NECP scenario. The Capacity Market, through the remuneration of capacity, will provide a long-term price signal aimed at triggering investment in new generation capacity
4.3

59
and ensuring system adequacy in the long run. PPAs and RES auctions: the deployment of new RES plants,
essential for the achievement of national and international energy and climate objectives, has slowed down dramatically in recent years, in particular due to significant uncertainty about future energy prices. Auction mechanisms (such as those envisaged by the recent RES decree) and long-term contracts between producers and a typically non-regulated counterpart (long term Power Purchase Agreements - PPAs) are effective mechanisms to stimulate new investment.
The draft National Energy and Climate Plan envisages, by 2030, the deployment of new utility-scale storage capacity (both pumped hydro plants and electrochemical batteries) of at least 6 GW. The realization of new storage capacity, in particular storage technologies capable of performing charge-discharge cycles in the order of hours / days / weeks, is in fact key to managing the electricity system in the short
to medium term (2030), although to date the price signals for investment in this capacity are not sufficient. It will therefore be necessary to build an ad-hoc regulatory and contractual framework, also by means of long-term contracting with counterparties selected through competitive bidding procedures organized by the TSO. Given the complexity of the topic and the plurality of subjects involved, Terna strongly believes that it is necessary to establish a central coordination body with all the Ministries (Economic Development, Environment, Infrastructure), institutions and local authorities that are involved in the planning, authorization and realization of pumped hydro plants. It would also be desirable to adopt dedicated legislation that simplifies the authorization process for the construction of new pumped hydro plants and for the use of water.
3. Market evolution and integration, in order to develop new grid services needed for the energy transition and foster the participa-tion of new flexibility resources in electricity markets, promoting their integration at European level.
In fact, the electricity system to date has relied on a set of "impli-cit" services, supplied by a fleet of conventional plants with rotating masses, in particular thermoelectric plants. In the near future, the
4.3
The energy transition in Italy and the role of the gas and power sectors

60
availability of resources that can provide grid services of this type will significantly decrease. Therefore, it becomes an essential require-ment for a secure power system operation to design and introduce new grid services that explicitly provision services that were previou-sly provided implicitly.
Moreover, the growing penetration of RES and the consequent reduction in the running hours of traditional thermal plants increa-se the need for flexibility in the future electricity system and make it necessary to provision grid services from new flexibility resources. Consumption resources (demand response), distributed generation, renewable resources not currently enabled and storage systems con-stitute a large pool of resources (over 800,000 production plants and about 40 million consumption units) potentially useful in offering the flexibility services necessary to guarantee the adequacy and safety of an increasingly broad and complex electricity system.
4. Investment in digitalization and innovation for the manage-ment of an increasingly complex, integrated and distributed electricity system, characterized by a soaring number of active, grid-connected resources and exchanges between each other. In light of the exponen-tial increase in the number of production (especially small-scale inter-mittent RES) and consumption plants, as well as the growing intermit-tent RES contribution to total production, we are already observing how the complexity of system operation is growing and how forecasts are becoming more challenging and subject to greater uncertainty. These trends will only continue.
In order to mitigate the effects of these phenomena, it is essen-tial to guarantee timely and reliable information to grid operators about the increasing number of resources that can actively be managed and are connected to the electricity system, primarily to the national transmission grid operator who is responsible for the security of the electricity system.
Enabling factors are, on the one hand, the new digital technolo-gies, which allow information to be collected at a low cost (IoT, smart meters), the transfer of large data streams with reliable connectivity solutions (optical fibre, 5G) and the effective storage and analysis of data (using, for example, advanced analytics), and, on the other, investment in innovation projects that put together new digital tools, thereby allowing us to deal with the new challenges in the ener-gy sector.
4.3
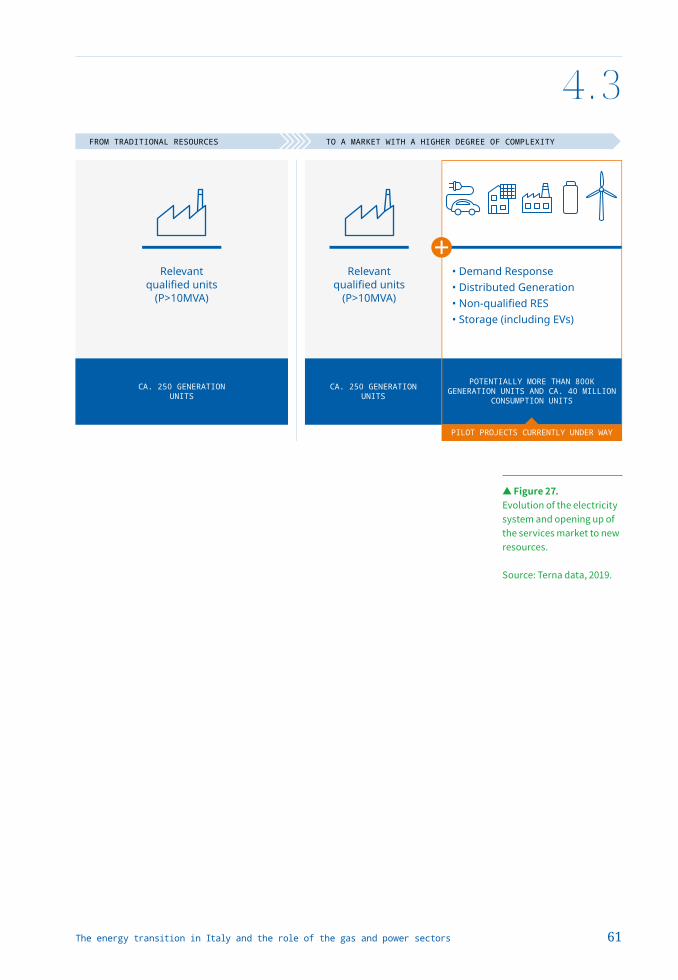
61
4.3FROM TRADITIONAL RESOURCES TO A MARKET WITH A HIGHER DEGREE OF COMPLEXITY
CA. 250 GENERATIONUNITS
CA. 250 GENERATIONUNITS
• Demand Response
• Distributed Generation
• Non-qualified RES
• Storage (including EVs)
POTENTIALLY MORE THAN 800KGENERATION UNITS AND CA. 40 MILLION
CONSUMPTION UNITS
PILOT PROJECTS CURRENTLY UNDER WAY
Relevant
qualified units
(P>10MVA)
Relevant
qualified units
(P>10MVA)
▲ Figure 27. Evolution of the electricity system and opening up of the services market to new resources. Source: Terna data, 2019.
The energy transition in Italy and the role of the gas and power sectors

62
4.4Phasing out coal.
Moreover, Terna has also defined a set of short-term measures and solutions necessary to achieve the goal of completely phasing out coal by 2025, while ensuring system adequacy and security. These interventions are summarized in Figure 28. In particular, it should be noted that the Italian electricity system, in addition to the deploy-ment of 12 GW of new RES capacity, has a significant need for new efficient thermal capacity in order to replace the capacity which is expected to be decommissioned (primarily coal-fired). In fact, Terna's analysis shows that the power system requires around 55 GW of instal-led thermoelectric generation capacity to meet the adequacy criteria adopted at national and EU level. To guarantee this level of installed capacity in 2025 it will be necessary to build 5.4 GW of additional gas-fi-red power plants (in line with the NECP), taking into account both the increase in demand and the decommissioning of the residual oil-fired power plants. Moreover, to guarantee adequacy and security of the power system it is also necessary to install 3 GW of new storage facili-ties, such as pumped hydro or electrochemical batteries.
In order to implement these measures by 2025, in line with the objective to phase-out coal, it will be essential to reduce the autho-rization time for grid infrastructure projects (also subject to the approval of the National Grid Development Plan) and of new genera-tion capacity, particularly thermal and pumped hydro capacity.
4.4
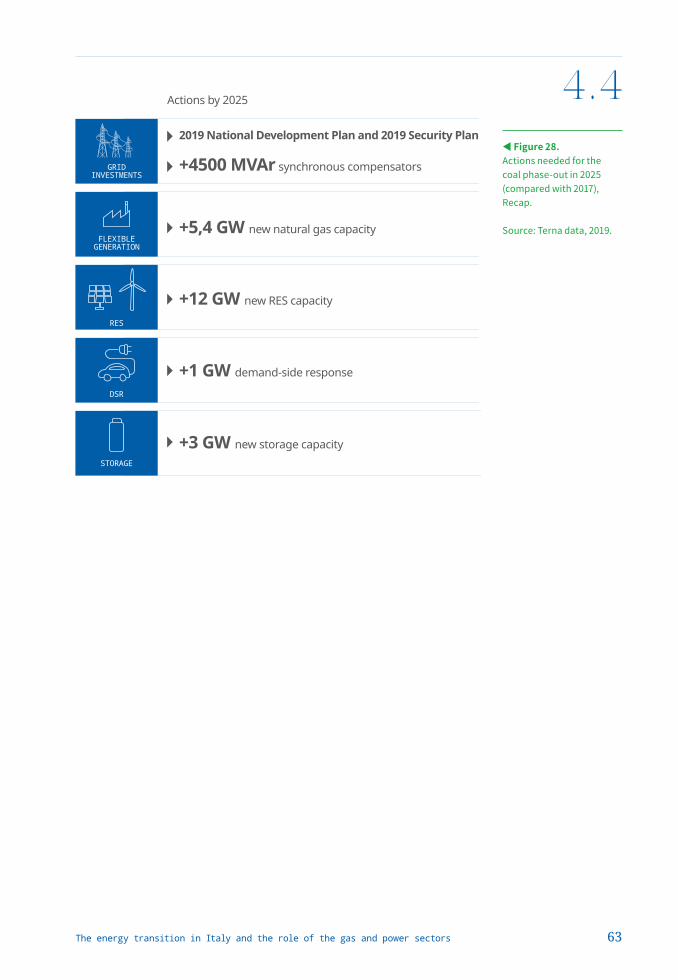
63
4.4◀ Figure 28. Actions needed for the coal phase-out in 2025 (compared with 2017), Recap. Source: Terna data, 2019.
2019 National Development Plan and 2019 Security Plan
Actions by 2025
+4500 MVAr synchronous compensators
+5,4 GW new natural gas capacity
+12 GW new RES capacity
+1 GW demand-side response
+3 GW new storage capacity
RES
FLEXIBLEGENERATION
GRIDINVESTMENTS
DSR
STORAGE
The energy transition in Italy and the role of the gas and power sectors
