eaf2 associates with foxa1 and eaf2 alleviates...
TRANSCRIPT

EAF2 Associates with FOXA1 and EAF2 Alleviates FOXA1-Mediated Repression of Androgen Receptor Transactivation
by
Anne Lipton Keener
BA, Amherst College, 2008
Submitted to the Graduate Faculty of
The School of Medicine in partial fulfillment
of the requirements for the degree of
Doctor of Philosophy
University of Pittsburgh
2013
UNIVERSITY OF PITTSBURGH
School of Medicine
This dissertation was presented
by
Anne Lipton Keener
It was defended on
December 2nd, 2013
and approved by
Chairman Robert W. Sobol, Ph.D., Associate Professor, Department of Pharmacology and
Chemical Biology
Donald DeFranco, Ph.D., Professor & Vice Chair, Medical Education, Department of
Pharmacology and Chemical Biology
Jing Hu, Ph.D., Assistant Professor, Department of Pharmacology and Chemical Biology
Yong Wang, PhD., Associate Professor, Department of Cell Biology and Physiology
Dissertation Advisor: Zhou Wang Ph.D., Director of Urologic Research & UPMC Chair in
Urologic Research & Professor, Department of Urology
ii

Copyright © by Anne Lipton Keener
2013
EAF2 Associates with FOXA1 and Alleviates FOXA1-Mediated Repression of Androgen
Receptor Transactivation
Anne Lipton Keener, PhD
University of Pittsburgh, 2013
iii

Prostate Cancer (PCa) is the most commonly diagnosed cancer and the second most
common cause of cancer death in men in the United States. During the development of PCa,
several androgen receptor (AR) regulated tumor-suppressors are down regulated, including ELL-
associated factor 2 (EAF2), also known as androgen up-regulated 19 (U19), an RNA polymerase
II transcription elongation factor. In order to determine how EAF2 is regulated and find other
genes that interact with EAF2, an RNAi screen was performed in C. elegans. When eaf-1, the C.
elegans ortholog to EAF2 was knocked out, the resulting worms had reduced fertility and the
screen was designed to detect phenotypic enhancers, RNAis that increased the eaf-1KO reduced
fertility phenotype. Knockdown of the gene pha-4, the C. elegans ortholog to Forkhead Box A1
(FOXA1), was found to cause egg degeneration rendering the eaf-1KO worms sterile. FOXA1, a
pioneer factor for AR, is required for normal differentiation of prostatic epithelial cells and up-
regulation of FOXA1 is associated with a worse prostate cancer prognosis in advanced prostate
cancer. We hypothesized that EAF2 associates with FOXA1 to modulate AR transactivation.
Transfected FOXA1 associated with EAF2 when co-immunoprecipitated and FOXA1 associated
with both the N-terminus and C-terminus of EAF2. Co-expression of EAF2 and FOXA1 reduced
EAF2 and FOXA1 protein levels relative to EAF2 or FOXA1 alone. FOXA1 protein level
increased and PSA protein and mRNA levels decreased when EAF2 was knocked down in
human PCa cell line LNCaP by siRNA. Similarly, EAF2 knockout also increased FOXA1
protein level in the mouse prostate. In a luciferase assay, FOXA1 reduced PSA-promoter
expression in C4-2 prostate cancer cells, and EAF2 transfection alleviated FOXA1-mediated
repression of PSA. In a colony formation assay performed in LNCaP cells, over-expression of
EAF2 reduced the number of colonies, over-expression of FOXA1 increased the number of
colonies, and over-expression of FOXA1 and EAF2 produced an intermediary number of
iv

colonies. These findings suggest a potential functional and physical interaction of EAF2 and
FOXA1 that may represent a new pathway and could potentially play a role in controlling
growth in the normal prostate and prostate cancer.
v

TABLE OF CONTENTS
ACKNOWLEDGEMENTS ..................................................................................................... XII
1.0 INTRODUCTION ........................................................................................................ 1
1.1 PROSTATE CANCER AND PROSTATE DEVELOPMENT ....................... 4
1.1.1 Prostate Cancer................................................................................................ 4
1.1.2 Prostate Development...................................................................................... 8
1.2 EAF2 AND FOXA1 ............................................................................................. 9
1.2.1 EAF2 ............................................................................................................... 10
1.2.2 FOXA1 ............................................................................................................ 14
1.3 PROJECT DESIGN .......................................................................................... 16
1.3.1 C. elegans screen to find EAF2-interacting proteins .................................. 16
1.3.2 From C. elegans to mammals........................................................................ 21
2.0 MATERIALS AND METHODS .............................................................................. 23
2.1 C. ELEGANS ...................................................................................................... 23
2.2 SEQUENCE ANALYSIS .................................................................................. 24
2.3 CELL CULTURE .............................................................................................. 24
2.4 PLASMIDS ......................................................................................................... 25
2.5 ANTIBODIES .................................................................................................... 26
2.6 CO-IMMUNOPRECIPITATION .................................................................... 27
vi

2.7 WESTERN BLOTS OF CELL LINES............................................................ 28
2.8 CYCLOHEXIMIDE ASSAY ............................................................................ 29
2.9 QRT-PCR ........................................................................................................... 30
2.10 ANIMALS .......................................................................................................... 31
2.11 LUCIFERASE ASSAY ..................................................................................... 31
2.12 COLONY FORMATION ASSAY ................................................................... 32
3.0 RESULTS ................................................................................................................... 33
3.1 FOXA1 AND EAF2 ASSOCIATE ................................................................... 33
3.2 EAF2 PROTEIN LEVEL IS REDUCED BY FOXA1 AND FOXA1
PROTEIN LEVEL IS REDUCED BY EAF2 .................................................................. 38
3.2.1 FOXA1 and EAF2 protein levels are reduced when co-expressed ........... 38
3.2.2 FOXA1 protein levels rise when EAF2 is lost ............................................. 41
3.3 FOXA1 PROTEIN LEVELS ARE ELEVATED AND PSA RNA LEVELS
ARE REDUCED UPON EAF2 KNOCKDOWN ............................................................. 44
3.4 CO-EXPRESSION OF EAF2 AND FOXA1 COUNTERACTS EACH
OTHER’S EFFECTS ON CELL GROWTH .................................................................. 47
4.0 DISCUSSION ............................................................................................................. 49
4.1 OVERVIEW OF RESULTS ............................................................................. 49
4.2 ROLE OF FOXA1 AND EAF2 INTERACTION IN AR SIGNALING ....... 50
4.3 MECHANISM OF FOXA1 AND EAF2 INTERACTIONS .......................... 53
4.4 FOXA1 AND EAF2 REPRESENT A NOVEL FEEDBACK LOOP IN
ANDROGEN RECEPTOR SIGNALING ........................................................................ 55
4.5 FUTURE DIRECTIONS ................................................................................... 57
vii

5.0 SUPPLEMENTARY FIGURES ............................................................................... 60
5.1 FOXA1 AND EAF2 PROTEIN STABILITY ASSAY ................................... 60
5.2 EFFECT OF OVER-EXPRESSION OF FOXA1 AND EAF2 ON PSA-
PROMOTER ACTIVITY .................................................................................................. 62
BIBLIOGRAPHY ....................................................................................................................... 65
viii

LIST OF TABLES
Table 1. Cell Lines and Experiments ............................................................................................ 25
Table 2. qRT-PCR primer sequences ............................................................................................ 30
Table 3. Relative protein levels of over-expressed FOXA1 in the FOXA1 and GFP-EAF2 over-
expression experiments. ................................................................................................................ 40
Table 4. Relative protein levels of over-expressed GFP-EAF2 in the GFP-EAF2 and Myc-DDK-
FOXA1 co-expression experiments .............................................................................................. 40
ix

LIST OF FIGURES
Figure 1. Hypothesized model of the interaction of FOXA1 and EAF2 modulating androgen
receptor signaling ............................................................................................................................ 3
Figure 2. A simplified schematic of androgen receptor activation and activity in the prostate. .... 7
Figure 3. EAF2 is in a negative feedback loop with Wnt-4 .......................................................... 12
Figure 4. Sequence similarity of human EAF2 and C. elegans eaf-1. .......................................... 17
Figure 5. Schematic of the design of phenotypic enhancer screen. .............................................. 18
Figure 6. Sequence similarity of pha-4 and FOXA1 proteins ...................................................... 19
Figure 7. Knockdown of pha-4 in eaf-1 knockout C. elegans results in sterility ......................... 20
Figure 8. Loss of pha-4 in eaf-1 knockout C. elegans results in egg degeneration ...................... 21
Figure 9. Structure of EAF2 and EAF2 deletion mutants ............................................................. 26
Figure 10. FOXA1 and EAF2 associate when overexpressed in a prostate cancer cell line ........ 34
Figure 11. FOXA1 associates with the NH2-terminus of EAF2 ................................................... 36
Figure 12. FOXA1 associates with the COOH-terminus of EAF2 ............................................... 37
Figure 13. FOXA1 and EAF2 protein levels are reduced when co-expressed ............................. 39
Figure 14. FOXA1 protein levels are elevated in the prostates of EAF2 knockout mice ............. 42
Figure 15. FOXA1 protein levels are elevated and PSA protein levels are reduced in EAF2
knockdown LNCaP cells ............................................................................................................... 43
x

Figure 16. PSA mRNA levels are reduced in EAF2 knockdown LNCaP cells ............................ 45
Figure 17. FOXA1 represses PSA promoter activity .................................................................... 46
Figure 18. Co-expression of FOXA1 and EAF2 results in an intermediary growth phenotype ... 48
Figure 19. FOXA1 and EAF2 form a feedback loop in androgen receptor signaling .................. 56
Figure 20. The effect of co-expression of EAF2 and FOXA1 on FOXA1 and EAF2 protein
stability is inconclusive ................................................................................................................. 61
Figure 21. EAF2 alleviated FOXA1-mediated repression of the PSA promoter ......................... 62
Figure 22. EAF2 enhanced FOXA1-mediated repression of the PSA promoter .......................... 63
xi

ACKNOWLEDGEMENTS
There are a number of people without whom this work would not have been possible.
First and foremost, I would like to thank my advisor, Dr. Zhou Wang, for his advice and
guidance. His mentoring made a difference in what I managed to accomplish. Additionally, I
would like to thank the members of my committee for their excellent advice and suggestions.
They helped guide my questions and provided unique insights into the difficulties I occasionally
faced.
I would also like to thank my loving husband Jim, who has stood by me through the past
few years of graduate school. He has been wonderfully supportive when I have needed it,
comforting me after a bad day, and just being there for me when I am happy or when I am
tearing my hair out.
I would be remiss if I didn’t thank my parents and siblings. I would like to thank my
mother and father for the wonderful job they did rearing me and for always being there to
support me. I would like to thank my siblings, Tom, M.J., and Tricia for just being there and
occasionally listening to a rant or two.
I would like to thank my colleagues in the Wang lab for the assistance they have provided
during the course of my graduate career. I would like to thank Dr. Junkui Ai for his guidance,
particularly when I first joined the Wang lab, as well as his assistance in performing several
xii

experiments. Next, I would like to thank Dr. Liquan Cai for his assistance with the C. elegans
work and teaching me how to work with C. elegans and perform a C. elegans screen. I would
like to thank Dr. Laura Pascal for her assistance and guidance through several experiments, as
well as happily providing editing assistance when I needed it. I would also like the thank
Katherine Willet, the lab manager of the Wang lab, for her assistance with QPCR as well as for
making sure everything in the Wang lab ran as smoothly as possible.
I would like to thank the Department of Defense for the training grant, W81XWH-11-1-
0316, that helped to finance my research.
Lastly I would like to thank my high school biology teacher, Mrs. Hayes, for strongly
encouraging my interest in science and setting me on the path to where I am today.
xiii

1.0 INTRODUCTION
Prostate cancer is the most commonly diagnosed cancer and the second leading cause of cancer
death in men in the US (1). Prostate cancer results from the accumulation of mutations that affect
regulatory pathways controlling cell growth, differentiation, and death. ELL-associated factor 2,
also known as androgen up-regulated 19, (EAF2/U19) is a putative transcription factor and was
discovered to be a protein up-regulated by the androgen receptor in the normal prostate. Over-
expression of EAF2 induces apoptosis in prostate cancer cell lines while EAF2 is down-
regulated in the majority of human prostate cancer specimens (2). This shows that EAF2 plays a
role in maintaining prostate homeostasis, which is dysregulated in prostate cancer. Furthermore,
loss of EAF2 in mice results in prostatic intraepithelial neoplasia, the putative precursor of
prostate cancer (3).
One important question is which proteins EAF2 interacts with and the effect of that
interaction, on the prostate. An RNAi screen was performed in the C. elegans model to find
genes that can enhance the reduced fertility phenotype caused by loss of eaf-1, the C. elegans
ortholog of EAF2 (4). These studies observed that knockdown of pha-4 resulted in reduced
fertility in wild-type worms, but knockdown of pha-4 in eaf-1 knockout worms resulted in
sterility caused by egg degeneration as can be seen in Figures 7 and 8 in section 1.3.1. These
results suggested that EAF2 and FOXA1 may functionally interact in mammals and the
interaction may regulate cell growth, development, and differentiation. The mammalian ortholog
1

of pha-4 is FOXA1 (5). FOXA1 is a pioneer factor for the androgen receptor (6); FOXA1 is
required in the development of prostate epithelial cells due to the inability of Foxa1-/- prostate
progenitor cells to give rise to luminal epithelial cells or luminal epithelial cell-lined ductal
structures (7). Furthermore, up-regulation of FOXA1 in prostate cancer patients is associated
with a poor prognosis (8). The combination of the experimental results and the known literature
about EAF2 and FOXA1 suggested that EAF2 and FOXA1 interact and the interaction of
FOXA1 and EAF2 affects cell growth and differentiation. We hypothesized that EAF2 associates
with FOXA1 to modulate androgen receptor transactivation and that loss of EAF2 shifts
androgen-receptor signaling towards increased growth via FOXA1, leading to prostatic
intraepithelial neoplasia and prostate cancer. Figure 1 illustrates this hypothesis. This research
will give a better understanding of the role of EAF2 in prostate development and prostate cancer.
2

Figure 1. Hypothesized model of the interaction of FOXA1 and EAF2 modulating androgen receptor
signaling
In the normal prostate epithelial cells, FOXA1 and EAF2 are both expressed. EAF2 suppresses
growth and promotes cell death while FOXA1 promotes cell growth and suppresses cell death.
The expression of both results in an intermediary phenotype and prostate homeostasis. In
prostate cancer, EAF2 expression is reduced in early stage cancer and absent in advanced
prostate cancer. Loss of EAF2 upsets the balance between increased proliferation signals and
decreased proliferation signals, leading to increased cell growth and survival.
EAF2
AR Signaling
Reduced GrowthCell Death
Increased GrowthCell Survival
EAF2 FOXA1
Normal Prostate
Prostate Cancer
AR Signaling
Reduced GrowthCell Death
Increased GrowthCell Survival
FOXA1
3

1.1 PROSTATE CANCER AND PROSTATE DEVELOPMENT
1.1.1 Prostate Cancer
The focus of this research was on furthering our understanding of the roles of EAF2 in prostate
cancer and prostate development. Prostate cancer is one of the cancers that, like breast cancer, is
reliant on a steroid receptor for growth and survival (9, 10). While PCa is characterized by
origination in the prostate and is usually dependent on AR, PCa is heterogeneous in its sensitivity
to androgen receptor and the outcomes of prostate cancer vary dramatically (11). Some tumors
will be aggressive and proceed quickly to metastatic and castration-resistant prostate cancer,
others are indolent. In addition, the standard first-line treatment for prostate cancer is
prostatectomy or radiation supplemented with androgen deprivation therapy (ADT) which is
achieved by physical or chemical castration (9). However, most prostate tumors that are treated
with ADT eventually reach a state known as castration-resistant prostate cancer, where although
the cancer is still dependent on AR for growth and survival, it is no longer dependent on
circulating androgens (12). Common mechanisms by which prostate cancer escapes ADT include
AR hyper-sensitization, AR gene amplification, AR over-expression, AR mutation which
includes AR gene translocations, post-transcriptional modifications of AR, and intra-tumoral
synthesis of androgen (13).
Prostate cancer is rarely diagnosed before age 40, when circulating androgen levels are
highest (10, 14, 15). As has been reported previously, incidence of prostate cancer is sharply
correlated with age and the rate of increase is the highest of all cancers after the age of 40 but
decreases steadily with age (10, 16). Prostate cancer tends to be diagnosed at a time when the
androgen/estrogen ratio is decreasing which means there is less circulating androgen available to
4

activate the androgen receptor (10, 15). As reported in Morley, J. E. et al., 1997, the levels of
circulating testosterone, luteinizing hormone (LH), follicle stimulating hormone (FSH), and sex
hormone-binding globulin (SHGB) were measured in 39 subjects who were 61-87 years old at
the time the New Mexico Aging Process Study began and took part in the study for 14 years
(15). Testosterone levels were significantly decreased, while FSH, LH and SHGB levels were
significantly elevated when compared to the original serum levels and FSH and LH levels
correlated but testosterone levels did not (15). As reported in Isbarn, H. et al., 2009, direct
injections of testosterone did not increase a man’s risk of developing prostate cancer, cause a
recurrence of prostate cancer or significantly increase intraprostatic androgen levels (13, 17).
Furthermore, prostate cancer can recur after androgen deprivation therapy, a condition known as
castration resistant prostate cancer. (18). This led to the theory in the field that alterations in
normal AR activity, such as duplication, mutation, increased bio-availability of androgen, or
altered regulation of AR co-factors, were driving the development of prostate cancer, including
castration resistant prostate cancer (10, 12, 18).
AR is a 113 kiloDalton (kDa) protein that is a member of the steroid receptor super-
family and the AR gene is located on the long arm of the X chromosome (6, 10). AR has the
traditional structure of a unique N-terminal domain, a DNA-binding domain, and a hormone
binding domain (18). AR is localized in the cytoplasm bound to chaperones like heat-shock
proteins in order to stabilize the protein and prevent degradation (19, 20). AR then binds to either
testosterone, or to dihydrotestosterone (DHT), a more active form that is derived by the 5α-
reductase from testosterone after testosterone enters the prostate cell (10). AR can then form a
dimer and translocate into the nucleus (18). Upon entering the nucleus, pioneer factors like
FOXA1 recruit AR to open chromatin, then other co-factors and the RNA pol II transcription
5

machinery are recruited, and the transcription of the early androgen-responsive genes, including
PSA and EAF2, begins (2, 6, 21). However, in prostate cancer, particularly castration-resistant
prostate cancer, AR binds to different stretches of DNA than it would in the normal prostate or in
early-stage prostate cancer (22). As reported in Decker et al. 2012, AR mediates the expression
of different set of genes in castration-resistant prostate cancer than in early-stage prostate cancer,
and it was shown that there are distinct androgen-dependent AR occupied regions and androgen-
independent AR occupied regions. These results showed that there are distinct alterations in
androgen receptor signaling between in early-stage prostate cancer and castration-resistant
prostate cancer (23).
AR signaling is required for normal prostate development. The prostate will not develop
if males undergo androgen deprivation pre-puberty, and it will wither away if androgen
deprivation occurs post-puberty (24). Figure 2 shows the activity of androgen receptor. FOXA1
is known to bind to AR and to recruit AR to the promoter (6). FOXA1 is one of the genes
involved in the AR signaling pathway that is de-regulated in prostate cancer. FOXA1 has been
found to be up-regulated in castration-resistant prostate cancer, and this up-regulation is an
indicator of a poor prostate cancer prognosis (25).
6

Figure 2. A simplified schematic of androgen receptor activation and activity in the prostate.
Testosterone enters the cell and is converted by 5-alpha reductase (5αR) to 5α-
dihydrotestosterone (DHT). DHT binds to the androgen receptor (AR) in the cytoplasm,
releasing AR from chaperoning heat-shock proteins (HSPs). AR dimerizes, translocates to the
nucleus, binds to pioneer factors and co-factors (represented by FOXA1), and begins
transcription of AR-upreglated genes (represented by PSA and EAF2).
In PCa, like other cancers, pathways used in development and wound healing are
dysregulated. Genes that would normally inhibit the growth of the prostate like PTEN, p53, and
EAF2 are down regulated (26). PTEN is a phosphatase that inhibits the PI3K-AKT signaling
pathway and is considered a classical tumor-suppressor (26). The tumor-suppressor p53 is one of
the most commonly mutated genes in cancer, and mutation of p53 is associated with metastatic
and castration resistant prostate cancer (26). EAF2 is an androgen up-regulated tumor-suppressor
Testosterone Prostate Cell
DHT AR
HSPs
AR AR
5αR
Nucleus
AR ARFOXA1
EAF2
PSA
7

that is down-regulated in 100 percent of known prostate cancer cell lines and 83 percent of
human prostate cancer tumor samples (2). Genes that promote the growth of the prostate like AR
and FOXA1 are up-regulated in PCa (26). AR is a transcription factor that is required for
prostate development and growth and is often duplicated or mutated (13). There have been
reports of AR mutation in 8-25% of metastatic prostate cancer. One of the most common point
mutations is T877A, which occurs in the ligand-binding domain of AR and has been reported to
broaden ligand specificity, including allowing the anti-androgen flutamide to serve as a partial
agonist and allow other steroids to activate AR (13, 27). One important marker of increased AR
activity is the level of PSA, an androgen up-regulated protein, in the serum, due to PSA
containing several androgen response elements (ARE) (28). FOXA1 is an androgen receptor
pioneer factor that is up-regulated in metastatic and castration resistant prostate cancer (13, 25).
Pioneer factors bind to condensed chromatin, and displace repressive histones (29).
1.1.2 Prostate Development
Prostate cancer is believed to be a result of a de-regulation of the normal prostate growth
pathways. In order to understand how those pathways normally function, it is important to
understand prostate development. The prostate, unlike most of the male accessory sex glands,
derives from the endodermal urogenital sinus, not the mesodermal Wolffian ducts (30). As
mentioned above, androgens are required for the prostate to develop. Initially, androgen
receptors are present only in the urogenital sinus mesenchyme and appear in the epithelium a few
days before the epithelium begins producing prostate-specific secretory proteins (31, 32).
Prostate epithelial cells will develop if there is wild-type AR in the urogenital sinus mesenchyme
and mutant AR in the urogenital sinus epithelium but not if there is mutant AR in the urogenital
8
sinus mesenchyme and wild-type AR in the urogenital sinus epithelium, showing that the
development of the prostate requires crosstalk between the mesenchymal cells and the epithelial
cells (33). Likewise, urogenital sinus mesenchyme can induce seminal vesicle epithelium and
bladder epithelium to differentiate into prostate epithelium (34). One of the important proteins
involved in this crosstalk is FOXA1. FOXA1 is highly expressed in the urogenital sinus
epithelium and wild-type urogenital mesenchyme cannot rescue prostate epithelial development
in FOXA1-/- epithelial cells (7, 32). The FOXA1-/- epithelial cells fail to develop the normal
ductal structure of the prostate (7). EAF2 is involved in prostate growth. EAF2 is expressed in
the prostate epithelial cells, and in EAF2-/- mice prostate abnormalities are observed beginning at
3 months old (3). The prostates of the EAF2-/- mice exhibit hypertrophy and the prostate
epithelium exhibits hyperplasia and dysplasia (3). There are no abnormalities in the mesenchyme
in EAF2-/- mixed genetic background mice, but Black 6 and FVB strain EAF2-/- mice show
stromal abnormalities that include increased vascularization and stromal inflammation and it is
unknown whether the stromal abnormalities are due to epithelial cell signaling or to the
expression of EAF2 in other cell types (3, 35, 36). This leads to the conclusion that EAF2 is
expressed in human prostate epithelial cells and in the mouse prostate. These results suggest that
EAF2, an androgen up-regulated gene, plays a role in inhibiting AR-mediated growth in the
normal prostate (2, 3).
1.2 EAF2 AND FOXA1
EAF2 and FOXA1 are two transcription factors that are known to play a role in regulating
prostate growth (3, 7). They have also been shown to play a role in the development of prostate
9

cancer, although these are opposite roles. Loss of EAF2 is associated with late stage prostate
cancer, development of prostatic intraepithelial neoplasia, and 33% EAF2-/- PTEN+/- Black 6
mice developed prostate cancer while no EAF2-/- PTEN+/+ or EAF2+/+ PTEN+/- Black 6 mice
developed prostate cancer (2, 3, 37). FOXA1 promotes the development of prostate cancer. High
levels of FOXA1 in primary prostate cancer indicates a poor outcome, FOXA1 is highly
expressed in prostatic intraepithelial neoplasia, and FOXA1 is over-expressed in castration-
resistant and metastatic prostate cancer compared to primary prostate cancer or the normal
prostate (8, 25, 38, 39). A C. elegans screen that will be discussed further in chapter 3 section 1
suggested that EAF2 and FOXA1 interact and led to the work in this thesis.
1.2.1 EAF2
ELL-associated factor 2 (EAF2), also known as androgen-upregulated 19 (U19) is a member of
the EAF family of transcription elongation factors (40). EAF2 was simultaneously discovered as
a transcription elongation factor that was bound to eleven-nineteen lysine-rich leukemia factor
(ELL), a transcription elongation factor that binds to RNA polymerase II (40) and as an androgen
up-regulated tumor suppressor that is down-regulated in prostate cancer (PCa) (2). EAF2 is
known to have an N-terminus ELL interaction domain located in amino acids 17-104 and a C-
terminus transactivation domain that interacts with TCEA1 and TCEA2 located in amino acids
117-260 (40-42). EAF2 also possesses a poly-glutamine region located in amino acids 126-130
and a serine-rich region located in amino-acids 174-207 (40). EAF2 also has two serine residues
that have been found to be phosporylated; these are serine residues 151 and 154 (43). EAF2 also
possesses a homolog in mammals, ELL-associated factor 1 (EAF1) which has 74 percent amino
10
acid conservation with EAF2 and is involved in several of the same transcription complexes (40,
44). EAF2 has recently been implicated in several important roles.
EAF2 is a tumor suppressor (2, 3). EAF2 is down-regulated in PCa cell lines and human
prostate cancer tissue samples (2). Furthermore, over-expression of EAF2 in prostate cancer cell
lines causes apoptosis (2). Also, EAF2 is associated with and its transcriptional activity inhibited
by FB1, which is a fusion partner with E2A in leukemia (45). Eaf2-knockout mice develop
hepatocellular carcinoma, lung adenocarcinoma and B-cell lymphoma (3). EAF2 knockout mice
also develop prostatic intraepithelial neoplasia (PIN), a hypothetical precursor to prostate cancer
(3). In addition, although mice characterized by heterozygous loss of PTEN or homozygous loss
of EAF2 alone do not display prostate tumors, thirty percent of PTEN+/- EAF2-/- mice develop
prostate tumors when 12 months old (37). Four out of nine PTEN+/- and nine out of nine PTEN+/-
EAF2-/- mice had prostate epithelial cell hyperplasia at 19 weeks old, compared to zero wild-type
or EAF2-/- mice (37). Nine out of nine PTEN+/- EAF2-/- have developed prostatic intraepithelial
neoplasia at 12 months old, compared to 8 out of 9 PTEN+/- mice, two out of nine EAF2-/- mice,
and zero out of nine wild-type mice (37). When EAF2 and PTEN mRNA levels were measured
in human prostate cancer samples, EAF2 was down-regulated in one out of nine and PTEN
down-regulated in zero out of seven Gleason grade 6-7 prostate tumor samples while down-
regulation of both EAF2 and PTEN was observed in six out of eleven Gleason grade 8-9 prostate
tumor samples (37). These findings all provide evidence that EAF2 is a tumor suppressor that is
down-regulated in prostate cancer.
EAF2 is a protein involved in growth and development of the prostate and other organs.
EAF2 is expressed in the epithelium during development in the central nervous system and in
tissues that require reciprocal tissue-tissue inductions between epithelial and mesenchymal cells,
11

like the kidneys, lungs and pancreas (46). EAF2 has been shown to be important for non-
canonical wnt signaling and the development of several organs, including the eyes and neural
tissue (47-49). The Xenopus laevis homolog of EAF2, was discovered to be a downstream target
of wnt4, a non-canonical Wnt protein, in Xenopus eye development and over-expression of
EAF2 can rescue eye development in wnt4 knockdown Xenopus laevis embryos (47). The
zebrafish homolog of EAF2 (eaf2) was shown to form a negative feedback loop with wnt4a that
is formed by eaf2 suppressing wnt4a through actions on the wnt4a promoter while eaf2 is up-
regulated by wnt4a signaling (48, 49). Figure 3 shows the feedback loop of EAF2 and Wnt-4.
Figure 3. EAF2 is in a negative feedback loop with Wnt-4
EAF2 is up-regulated by non-canonical Wnt-4 signaling during eye development, and EAF2
inhibits expression of Wnt-4, forming a negative feedback loop during eye development.
Eaf2 has been found to regulate extension movements required for development of the
heart and pancreas through upstream regulation of wnt5 and wnt11 signaling (48). EAF2 is also
involved in immunoglobulin secretion by plasma cells through its interaction with eleven-
nineteen lysine-rich leukemia factor 2 (ELL2) and is up-regulated in plasma cells compared to B-
EAF2
Wnt-4
Eye Development
12

cells (50, 51). EAF2 has also been implicated in regulating collagen formation and maintenance
of the extracellular matrix, due to knockdown of the C. elegans homolog of EAF2, eaf-1, in C.
elegans with mutations in the genes responsible for collagen formation rescuing the mutants (4).
Loss of EAF2 has been shown to result in prostate hypertrophy, epithelial cell hyperplasia and
the development of murine PIN lesions (3).
EAF2 is a transcription elongation factor that binds to eleven-nineteen lysine-rich
leukemia factors 1 and 2 (ELL1 and ELL2) and is stabilized by ELL1 (40, 42). ELL1 and ELL2
are transcription elongation factors and ELL1 is frequently fused to MLL in acute myelogenous
leukemia which disrupts the binding of EAF2 and ELL1 (40, 52). EAF2 also interacts with
transcription elongation factor S-II to mediate RNA PolII transcription of DNA (41). EAF2 is a
positive regulator of RNA polII and part of the super elongation complex (SEC) and the little
elongation complex (LEC) (53-55). The SEC is a transcription complex that is involved in acute
myelogenous leukemia due to several members of the complex, including EAF2 binding partner
ELL, undergoing fusion with MLL and is involved in HIV due to HIV Tat recruiting the SEC to
transcribe HIV genes (44). The major proteins in the SEC are ELL1 or ELL2, EAF1 or EAF2,
AFF 1 or AFF4, AFF9 or ENL, and P-TEFb (44). The LEC is composed of ICE1, ICE2, ELL1,
and EAF1 or EAF2 and is involved in the transcription of snRNA (55). EAF2 binds to MED26,
linking the SEC and the Mediator complexes involved in gene transcription (56). The Mediator
complex recruits the SEC to gene promoters during gene transcription (56).
EAF2 has been shown to play a role in angiogenesis and hypoxia response. EAF2 was
shown to bind to and stabilize pVHL, an important inhibitor of hypoxia response and loss of
EAF2 in a pVHL heterozygous background resulted in increased angiogenesis (35, 57). The
protein pVHL modulates hypoxia response through inhibiting hypoxia-inducible factor 1 alpha
13

(HIF1α) by hydroxylation of HIF1α prolines P402 and P564 and HIF1α is observed to be up-
regulated in the EAF2 KO mouse (57). EAF2 has also been shown to promote the transcription
elongation of the anti-angiogenic protein TSP-1 through interactions with ELL and p53 (58, 59).
There is also evidence that EAF2 plays a role in DNA-damage repair. EAF2 has been
shown to localize to the nucleus after DNA damage is induced by ultraviolet (UV) light (60).
Loss of EAF2 has been shown to reduce apoptosis after cells have been exposed to UV through
increased expression of p53 (61), providing further evidence of a role in DNA-damage repair.
Additionally, ELL, a known binding partner of EAF2, binds to TFIIH and mediates the re-start
of transcription after nucleotide excision repair (NER) (62).
Although several EAF2-interacting proteins had already been noted in the literature, it
was important to find more EAF2-interacting proteins and to determine if that interaction affects
growth and development in the normal prostate and in PCa. For these reasons, a screen was
performed using the C. elegans homolog of EAF2, eaf-1, which revealed FOXA1 as a potential
interacting protein (4).
1.2.2 FOXA1
Forkhead box protein A1 (FOXA1) was originally discovered in 1989 as a transcription factor
named hepatocyte nuclear factor 3α (HNF3α) that bound to the promoters of transthyretin and
α1-antitrypsin in hepatocytes, and then was distinguished from its homologs FOXA2/HNF3β and
FOXA3/HNF3γ in 1990 (63, 64). HNF3α was renamed FOXA1 in recognition of the prominent
winged-helix domain known as a forkhead domain that marked it as a homolog of the drosophila
gene fkh and for being the first discovered member of the FOXA subfamily (6, 65).
14

FOXA1 is an important protein in the growth and development of many organs, including
the liver, pancreas, kidney, lung, brain, gastrointestinal tract, breast and prostate (39, 66). Each of
these tissues displays developmental abnormalities if FOXA1 is knocked out in a tissue-specific
fashion or in a rescue experiment (39, 66). FOXA1 knockout mice survive to birth, but suffer
neonatal mortality 2-14 days after birth (67). The cause of death was hypoglycemia due to a
defect in insulin secretion, despite the fact that the pancreatic islets appeared normal until
challenged with glucose and severe dehydration due to kidney defects (39, 67). In the pancreas,
lung, brain, and gastrointestinal tract, FOXA2 can compensate for the absence of FOXA1 in a
conditional knockout, but not in the breast or prostate (39). FOXA1 localizes with the estrogen
receptor (ER) and GATA3 at a specific promoter sequence next to the ER binding site, and is
necessary in the breast for normal development of the mammary gland because there is impaired
ductal invasion in rescued FOXA1-/- breast tissue (39). FOXA1 also plays an important role in
prostate development. Epithelial expression of FOXA1 is required for the normal glandular
structure of the prostate and for luminal epithelial cells to develop (7). FOXA1 localizes with AR
and binds to the promoter of AR-responsive genes right next to the androgen response element
that AR binds to. FOXA1 also acts as a pioneer factor for AR and ER, by binding to stretches of
chromatin, recruiting other proteins that modify the chromatin to enable transcription, and then
by binding to AR and ER after they are activated by androgen and estrogen respectively (68).
FOXA1 also plays an important role in cancer, particularly in breast and prostate cancer.
FOXA1 is required for breast cancer cells to respond to tamoxifen in ER+ breast cancer, so the
presence of FOXA1 is associated with a positive outcome in ER+ breast cancer. (69). In ER-
apocrine breast carcinoma, FOXA1 and AR are over-expressed and promote tumor growth and
survival. Furthermore, several studies have shown that FOXA1 recruits AR to sites that are
15

associated with ERα-mediated transcription and are dependent on AR in apocrine carcinoma
(69). The results observed in breast cancer show that FOXA1 can serve as an oncogene or tumor
suppressor, depending on which pathways FOXA1 interacts with. In prostate cancer (PCa),
FOXA1 modulates AR activity, which is required for PCa tumor growth and survival. FOXA1 is
observed to be necessary for some AR-mediated gene transcription (6). FOXA1 also regulates
AR-mediated transcription in castration-resistant prostate cancer and is a driver of cancer cell
growth (70). FOXA1 expression levels are indicative of PCa patient outcome, with a higher level
of FOXA1 expression indicating a poorer outcome, particularly in metastatic and castration
resistant prostate cancer (8, 71).
1.3 PROJECT DESIGN
The goal of this project was to confirm that a functional interaction between the C. elegans
orthologs of EAF2 and FOXA1 occurred in mammals. After confirming the presence of the
interaction, the next goal was to determine the effects of the interaction on PCa and prostate
development.
1.3.1 C. elegans screen to find EAF2-interacting proteins
EAF2 is a conserved protein and does possess a C. elegans homolog, eaf-1 (4, 72). When eaf-1 is
knocked out, the resulting C. elegans worms have a short and stubby body, also known as a
dumpy phenotype, a shortened life expectancy, and reduced fertility (4). Compared to the wild-
16

type worms, the eaf-1KO worms produce two-thirds fewer offspring (4). EAF2 has ~63%
similarity to eaf-1 (4). Figure 4 shows the similarity of the EAF2 and eaf-1 protein sequences.
Figure 4. Sequence similarity of human EAF2 and C. elegans eaf-1.
Sequence analysis of human EAF2 (EAF2) and C. elegans eaf-1 (eaf-1) was performed using
ClustalW and BOXSHADE from Swiss EMBnet and protein sequences from the NCBI protein
database. Identical amino acids are shaded black, similar amino acids are shaded grey, and a ˗
represents amino acid stretches not present in one of the proteins.
Because eaf-1 and EAF2 are so similar, a screen was conducted for phenotypic enhancers
using eaf-1 in C. elegans. C. elegans is an excellent organism to perform screens due to the ease
of performing RNAi (73). A phenotypic enhancer is a gene that increases the severity of a
phenotype from another gene. This enhancement of the phenotype is then considered to be
functional synergism and is interpreted as a sign that the two genes functionally interact (74, 75).
The eaf-1KO C. elegans worms were noted to have reduced fertility and this phenotype was used
as the readout for the screen. Reduced fertility was the chosen readout because of the ease to
eaf-1 1 ---MAESSDIPNGTYTLTLGKSFEVKGRKSDPKAEQFHTLRYDFKPSSVSNNADTFIAFG EAF2 1 MNSAAGFSHLDRRERVLKLGESFEKQPR------CAFHTVRYDFKPASIDTSSEGYLEVG eaf-1 58 NSGDVHVSVP---SEGDNMTVYKGSKKEAKPKECLLFFDKKTNTVRLEKITSNINVKKTR EAF2 55 EGEQVTITLPNIEGSTPPVTVFKGSKK-PYLKECILIINHDTGECRLEKLSSNITVKKTR eaf-1 115 DLDQGTELALKRGIER-----------LRTSSNNQRSGPSSPEEKAKIQKQMQRDTSDSS EAF2 114 VEGSSKIQYRKEQQQQQMWNSARTPNLVKHSPSEDKMSPASPIDDIERELKAEASLMDQM eaf-1 164 SDSDGSSDSDKSNGDSSDDEDESEKILLEEMKKPKPYTEREPAPPSSSNTYNHKESHVAP EAF2 174 SSCDSSSDSKSSSSSSS--EDSSSDSEDEDCKSSTSDTGNCVSGHPTMTQYRIPDIDASH eaf-1 224 YISSSGNKNKDSEEKYGLALSESSDEDD- EAF2 232 NRFRDNSGLLMNTLRNDLQLSESGSDSDD
17

determine C. elegans fertility. The design of the screen is illustrated in Figure 5. Briefly, wild-
type and eaf-1KO worms were treated with control RNAi and RNAi from a library of nuclear
factors. It was then determined if the number of eaf-1KO + RNAi knockdown offspring were
fewer than either eaf-1KO or RNAi knockdown alone.
Figure 5. Schematic of the design of phenotypic enhancer screen.
Wild-type C. elegans (WT) will have normal fertility (no phenotype). eaf-1KO C. elegans (KO
gene A) will have reduced fertility. Treatment of wild-type C. elegans with double-stranded
RNA corresponding to a C. elegans gene (KO gene B) will result in the reduced fertility
phenotype or no phenotype. Treatment of eaf-1KO C. elegans with the gene B RNAi will result
in a severe phenotype like sterility (KO gene A&B).
The screen produced several hits and among these were pha-4, the C. elegans homolog of
FOXA1 (5, 76). Rat FOXA1 has 75-78% similarity to pha-4 showing that pha-4 is closely
related to FOXA1 (76). Figure 6 shows the similarity between the C. elegans pha-4 protein and
human FOXA1. In C. elegans, pha-4 is expressed in the pharynx, and is required for the pharynx
WT KO gene A (eaf-1) KO gene B KO gene A & B
No Phenotype
Reduced fertility
Reduced fertility
Sterile
18

to develop (77). An abnormal pharynx was not noted in the pha-4 knockdown C. elegans but was
not the primary focus of the screen.
Figure 6. Sequence similarity of pha-4 and FOXA1 proteins
Sequence analysis of human FOXA1 (FOXA1) and C. elegans pha-4 (pha-4) was performed
using ClustalW and BOXSHADE from Swiss EMBnet and protein sequences from the NCBI
protein database. Identical amino acids are shaded black, similar amino acids are shaded grey,
and a ˗ represents amino acid stretches not present in one of the proteins.
RNAi knockdown of pha-4 reduced the number of offspring to 10% of what was
produced by wild-type C. elegans. When pha-4 was knocked down in eaf-1KO worms, the
resulting worms were sterile, with zero viable eggs produced. Figure 7 shows these results.
When the worms were examined, the wild-type worms and the single mutants showed egg
pha-4 1 MTSPSSDEDIIDIRVIKEEPESEPDSEAEPATTTNSTDSEDSVEQENKKLLETEKNRKRE FOXA1 1 ----------------------------------------------------MLGTVKME pha-4 61 QKHKMLPNGTTSGTSDTGNQVPATSSAASSVDYTAMNAQDYLPTYSNTTLNYQPYQYQTA FOXA1 9 GHETSDWNSYYADTQEAYSSVPVSNMNSGLGSMNSMNTYMTMNTMT-TSGNMTPASFNMS pha-4 121 ANGLLNYNNYSQYATANQLGSNYISPANFMQGGGISPLGFTTGTTGATTAAASVATSSAS FOXA1 68 YANPGLGAGLSPGAVAGMPGGSAGAMNSMTAAGVTAMGTALSPSGMGAMGAQQAASMNGL pha-4 181 AVIGRSNGRSSSTVAASPADRSYSGVSGGQGQELTIQEFETVTEKIRRHGTYGQSKPPYS FOXA1 128 GPYAAAMNPCMSPMAYAPSNLGRSRAGGGG-------------DAKTFKRSYPHAKPPYS pha-4 241 YISLITMAIQKSNSRQLTLSEIYNWIMDLFPYYQNNQQRWQNSIRHSLSFNDCFVKVARS FOXA1 175 YISLITMAIQQAPSKMLTLSEIYQWIMDLFPYYRQNQQRWQNSIRHSLSFNDCFVKVARS pha-4 301 PDKPGKGSFWTLHEHCGNMFENGCYLRRQKRFKVKE------------------------ FOXA1 235 PDKPGKGSYWTLHPDSGNMFENGCYLRRQKRFKCEKQPGAGGGGGSGSGGSGAKGGPESR pha-4 337 REPSRKKRNANSQQLHQQQHIPKMEIK-----------EEDPTSITTTSSLGAYSLIPQI FOXA1 295 KDPSGASNPSADSPLHRGVHGKTGQLEGAPAPGPAASPQTLDHSGATATGGASELKTPAS pha-4 386 STKKEIKEELKAVQDATAAAANLGLIDPSGTPSAVN--HSQPTSVISSVGTLGTTQAQMT FOXA1 355 STAPPISSGPGALASVPASHPAHGLAPHESQLHLKGDPHYSFNHPFSINNLMSSSEQQHK pha-4 444 LNGQYASPYLYSSDFATILPQSQNFLNNTLYNTTSSYPGIDYTNGVYQNTLYSSTNPNSA FOXA1 415 LDFKAYEQALQYSPYGSTLPASLPLGSASVTTRSPIEP--SALEPAYYQGVYSRPVLNTS pha-4 504 ANL FOXA1 473 ---
19

development, but in the double mutants, the eggs appeared to degenerate during development
(Figure 8). These results suggested functional synergism between pha-4 and eaf-1, indicating
that pha-4 was a phenotypic enhancer of eaf-1.
Figure 7. Knockdown of pha-4 in eaf-1 knockout C. elegans results in sterility
A single L2/L3 wild-type (WT) or eaf-1 KO (eaf-1KO) C. elegans worm was placed on a plate
treated with E. coli transformed with control or pha-4 RNAi and the number of offspring was
counted. The experiment was performed 4 times with each sample in triplicate. ***=p≤0.001.
20

Figure 8. Loss of pha-4 in eaf-1 knockout C. elegans results in egg degeneration
Representative images showing egg development in adult wild-type (WT) and eaf-1 KO (eaf-1
KO) C. elegans that have been treated with control or pha-4 RNAi. The arrows indicate the
gonads in which egg development occurs. Egg development is absent in the eaf-1 KO C. elegans
treated with pha-4 RNAi.
1.3.2 From C. elegans to mammals
The C. elegans screen showed that homologs of EAF2 and FOXA1 had a functional synergism,
which could be due to 1) eaf-1 and pha-4 being two steps in the parallel pathways that both
perform the same function, 2) eaf-1 and pha-4 being in two different pathways that converge for
a specific function (74). The first scenario is most commonly found in homologous genes where
the functions of the two genes are partially or completely redundant (74). For instance, FOXA1
is known to be partially redundant with FOXA2 because Foxa1-/- mice with lung-specific
knockouts of Foxa2 show abnormal lung development, but loss of FOXA2 results in an
embryonic lethal phenotype while loss of FOXA1 results in a postnatal lethal phenotype (78).
Likewise EAF2 is known to be partially redundant with EAF1 due to both proteins binding to the
Control RNAi pha-4 RNAiWT
eaf-1 KO
21

N-terminus of ELL, while EAF1 also binds to the C-terminus of ELL (40). In addition to the
functional synergism of their C. elegans homologs revealed by the screen, EAF2 and FOXA1
both have roles in prostate cancer (PCa) and regulating prostate growth (2, 3, 7, 38, 79). The
results of the C. elegans screen and the literature on FOXA1 and EAF2 led to the hypothesis that
FOXA1 and EAF2 should interact at the molecular level or at the functional level. Therefore,
experiments were performed to test for molecular interactions and functional interactions
between FOXA1 and EAF2 in human prostate cancer cell lines and murine prostate tissue
samples.
22

2.0 MATERIALS AND METHODS
The reagents and the experimental methods used for this project are described below to
determine whether EAF2 and FOXA1 interact.
2.1 C. ELEGANS
N2 C. elegans or tm3976 (eaf-1KO) were used for the C. elegans experiments (4). The C.
elegans were maintained on NGM plates on an E. coli OP50 lawn until they were used for an
experiment (80). Eggs were harvested from N2 or eaf-1KO worms lysed by hypochlorite
solution (3.5mL 10M KOH, 4mL NaClO solution (Chlorox), 35mL dH2O) then washed 3x with
S-BASAL (5.85g NaCL, 6g KH2PO4, 1g K2HPO4, ddH2O to 1L) (4). The eggs were then plated
on RNAi plates with E. coli transformed by control RNAi or pha-4 RNAi obtained from the
Ahringer RNAi library through the Fisher lab (diluted 1:3 with control RNAi) (4, 81, 82). The
number of offspring was determined by moving a single L2/L3 C. elegans to individual RNAi
plates containing the appropriate RNAi transformed E. coli and then counting the resulting
number of L2/L3 offspring. Comparison analysis was then carried out with a Student’s t test.
Bright-field images were taken on a Leica microscope (Leica Microsystems, Buffalo Grove, IL,
USA) using the offspring once adulthood was reached.
23

2.2 SEQUENCE ANALYSIS
A comparison of FOXA1 and pha-4 protein sequences and EAF2 and eaf-1 protein sequences
were performed using ClustalW, BOXSHADE, and LALIGN from Swiss EMBnet.
2.3 CELL CULTURE
Prostate cancer cell lines PC3 and LNCaP were obtained from ATCC (Mannasas, VA, USA) and
the prostate cancer cell line C4-2 was a generous gift from Dr. Leland Chung. Please see Table 1
for a characterization of the cell lines and the experiments each cell line was used in. The cell
lines were cultured in RPMI-1640 with 10% fetal bovine serum (FBS), penicillin/streptomycin,
and L-glutamine (RPMI+ media). LNCaP cells were treated with siRNA for 18 hours in
OptiMEM medium. Then cells were cultured in RPMI 1640 medium containing 1nM of R1881
for additional 24 hours. Cells were collected in RIPA buffer for Western blotting using the
indicated antibodies. Control siRNA and siRNA EAF2-1 were purchased from Santa Cruz.
siRNA EAF2-2 was purchased from Qiagen. C4-2 shScr and shEAF2 cells were generated using
lentivirus supplied by the UPCI Vector Core Facility and were cultured in RPMI-1640 with 10%
FBS, penicillin/streptomycin, L-glutamine and 1 µg/mL puromycin. PC3, LNCaP, and C4-2
cells were transfected using PolyJet (SignaGen, Gaithersburg, MD, USA).
24

Table 1. Cell Lines and Experiments
Cell Line Experiments AR status/androgen
dependence FOXA1 status
EAF2 status
PC3 Co-transfection and co-
immunoprecipitation, cycloheximide assay
AR - / androgen independent
FOXA1 positive
EAF2 negative
LNCaP Endogenous co-immunopreciptation,
EAF2 siRNA cell lines, QPCR, colony formation assay
AR + / androgen dependent
FOXA1 positive
EAF2 positive
C4-2 Luciferase assay, shRNA AR+ / castration resistant
FOXA1 positive
EAF2 positive
Characterization of cell lines used for this project and the experiments they were used in.
2.4 PLASMIDS
CMV-Myc, CMV-HA and pEGFP-N3 vectors were purchased from Clontech (Mountain View,
California, USA) (42). Human EAF2 cDNA was amplified by PCR and cloned into the pEGFP-
N3, CMV-HA and CMV-Myc vectors, producing pEGFP-EAF2-N3, CMV-HA-EAF2, and
CMV-Myc-EAF2 (2, 42). EAF2 deletion mutants were generated by PCR and cloned into the
CMV-Myc vector (Figure 9) (83). pCMV-Renilla was obtained from Promega (Madison,
Wisconsin, USA) and pGL-PSA was a generous gift from Dr. Marianne Sadar, Ph.D. (BC
Cancer Agency, British Columbia, Canada). pCMV6-FOXA1 was purchased from Origene
(Rockville, Maryland, USA) (RC20604); pCMV6, pEGFP-N3-FOXA1, and FOXA1-untagged
were generated from pCMV6-FOXA1 by PCR subcloning. Full-length cDNAs were verified by
sequencing.
25

Figure 9. Structure of EAF2 and EAF2 deletion mutants
Map of full-length EAF2 and EAF2 deletion mutants. EAF2 is 260 amino acid residues long and
encoded by 6 exons, I, II, III, IV, V, and VI. The numbers at the top indicate amino acids
corresponding to each exon below.
2.5 ANTIBODIES
The following antibodies were used for the co-immunoprecipitations and Western Blots:
polyclonal rabbit anti-FOXA1 (ab23738, 1:1500 dilution for western blot) and agarose-
conjugated polyclonal goat anti-Myc (ab1253, 10-20uL for co-immunoprecipitation) were
obtained from Abcam (Cambridge, United Kingdom), polyclonal rabbit anti-GFP (TP401
(1:2000–1:3000 dilution for western blot) from Torrey Pines Biolabs (Houston, Texas, USA),
monoclonal mouse anti-Myc (MMS-150R, 1:1000 dilution for western blot) and monoclonal
mouse anti-HA (MMS-101R, 1:1000 dilution for western blot) from Covance (Princeton, New
1 35 67 113 161 245 260 aa
I II III IV V VICMYC CMV-MYC-EAF2
CMYC I II CMV-MYC-EAF2 1-67
CMYC I II III CMV-MYC-EAF2 1-113
CMYC I II III IV CMV-MYC-EAF2 1-161
CMYC I II III IV V CMV-MYC-EAF2 1-245
CMYC II III IV V VI CMV-MYC-EAF2 36-260
CMYC III IV V VI CMV-MYC-EAF2 68-260
CMYC IV V VI CMV-MYC-EAF2 113-260
CMYC V VI CMV-MYC-EAF2 162-260
26
Jersey, USA), monoclonal mouse anti-EAF2 generated by the Wang lab (1:1000 dilution for
western blot), and polyclonal rabbit anti-GAPDH (sc-25778, 1:3000 dilution for western blot)
from Santa Cruz Biotechnology (Dallas, Texas, USA), protein A/G-conjugated agarose beads
(sc-2003, 20 µL for pre-clearing lysates), goat anti-rabbit-HRP (sc-2004, 1:2500-1:5000 dilution
for western blot) or goat anti-mouse-HRP (sc-2005, 1:2500 dilution for western blot) secondary
antibodies from Santa Cruz Biotechnology, light-chain specific mouse anti-rabbit (211-032-171,
1:4000-1:5000 dilution for western blot) and light-chain specific goat anti-mouse (115-035-174,
1:2500-1:4000 dilution for western blot) antibodies from Jackson ImmunoResearch (West
Grove, Pennsylvania, USA).
2.6 CO-IMMUNOPRECIPITATION
PC3 cells were plated into 10 cm dishes. When the cells reached 60-80% confluency, they were
transfected with pEGFP-N3 and CMV-Myc, pEGFP-N3 and CMV-Myc-EAF2, pEGFP-FOXA1
and CMV-Myc, pEGFP-FOXA1-N3 and CMV-Myc-EAF2, or pEGFP-FOXA1-N3 and the
CMV-Myc-EAF2 deletion mutants. Cells were lysed in RIPA lysis buffer (50 mM Tris-HCl, pH
8.0, 150 mM NaCl, 1 mMEDTA, 1% (v/v) NP-40, 0.1% SDS, 0.25% sodium deoxycholate,
1 mM sodium orthovanadate, 1 mM PMSF, 1:100 dilution of protease inhibitor cocktail (P8340,
Sigma-Aldrich, St Louis, MO, USA). Protein concentration was determined by BCA Protein
Assay (Thermo Scientific, Rockford, IL, USA). Pre-clearing was performed using 20 µL of
protein A/G-agarose and the lysates from the experiments to determine which regions of EAF2
are required for FOXA1 and EAF2 to associate. The beads and lysates were incubated at 4oC for
1 hour. Pre-clearing was not performed in the experiments to determine if FOXA1 and EAF2
27

associate. Immunoprecipitation was performed using agarose-conjugated mouse anti-Myc. 20 µL
were used for the co-immunoprecipitations to determine whether FOXA1 and EAF2 associate
the beads were incubated with the lysates overnight at 4oC. 10 µL were used for the co-
immunoprecipitations to determine which regions of EAF2 are responsible for the association of
EAF2 and FOXA1 and the incubation was 4-6 hours at 4oC.
Immunoprecipitates and whole cell lysate (WCL) were boiled with SDS sample buffer
for five minutes, separated on a 10% SDS-PAGE gel (4.8 mL ddH2O, 2.5 mL 1.5 M Tris pH 8.8,
100 µL 10% SDS, 100 µL 10% APS, 2.5 mL 40% Bis-Tris acrylamide, 10 µL TEMED) with a
4% SDS-PAGE stacking gel (2920 µL ddH2O, 500 µL 1M Tris pH 6.8, 40 µL 10% SDS, 40 µL
10% APS, 500 µL 40% tris-bis acrylamide, 4 µL TEMED) under reducing conditions and
transferred onto a nitrocellulose membrane. The membranes were then blotted with the above
primary antibodies. Signals were visualized using chemiluminescence (ECL Western Blotting
Detection Reagents, GE Healthcare, Little Chalfont, United Kingdom) and were exposed to X-
ray film (Fuji film, Valhalla, NY, USA).
2.7 WESTERN BLOTS OF CELL LINES
After co-transfection using the appropriate plasmids as mentioned in the figure, cells were lysed
in RIPA lysis buffer (50 mM Tris-HCl, pH 8.0, 150 mM NaCl, 1 mMEDTA, 1% (v/v) NP-40,
0.1% SDS, 0.25% sodium deoxycholate, 1 mM sodium orthovanadate, 1 mM PMSF, 1:100
dilution of protease inhibitor cocktail (P8340, Sigma-Aldrich, St Louis, MO, USA). Protein
concentration was determined by BCA Protein Assay (Thermo Scientific, Rockford, IL, USA).
Cell lysates were boiled with SDS sample buffer for five minutes, separated on a 10% SDS-
28

PAGE gel (4.8 mL ddH2O, 2.5 mL 1.5 M Tris pH 8.8, 100 µL 10% SDS, 100 µL 10% APS, 2.5
mL 40% Bis-Tris acrylamide, 10 µL TEMED) with a 4% SDS-PAGE stacking gel (2920 µL
ddH2O, 500 µL 1M Tris pH 6.8, 40 µL 10% SDS, 40 µL 10% APS, 500 µL 40% tris-bis
acrylamide, 4 µL TEMED) under reducing conditions and transferred onto a nitrocellulose
membrane. The membranes were then blotted with the above primary antibodies and secondary
antibodies. Signals were visualized using chemiluminescence (ECL Western Blotting Detection
Reagents, GE Healthcare, Little Chalfont, United Kingdom) and were exposed to X-ray film
(Fuji film, Valhalla, NY, USA). The signals were quantified using ImageJ (NIH, Bethesda,
Maryland, USA) and statistical analysis was performed using GraphPad Prism (GraphPad
Software Inc., La Jolla, California, USA).
2.8 CYCLOHEXIMIDE ASSAY
PC3 cells in 10cm dishes at 60-80% confluency were transfected with pCMV6-FOXA1 + HA,
pCMV6-FOXA1 + HA-EAF2, or pCMV-Myc + HA-EAF2 using Polyjet (Signagen,
Gaithersburg, MD, USA). At 24 hours post transfection, each 10 cm dish was split into 5 wells
on a 6-well plate. 40 hours post transfection, 4 of the 5 wells were treated with 1uL of 50ug/uL
cycloheximide. The fifth well of each 6-well plate was lysed to provide the 0 hour time point.
Every two hours one well from each 6-well plate was lysed. The last time point was 8 hours post
transfection. The lysates were then analyzed by western blot as described above.
29

2.9 QRT-PCR
Quantitative reverse transcription polymerase chain reaction (qRT-PCR) was performed as
described (84). Briefly, after siControl and siEAF2 cells were lysed and RNA isolation, reverse
transcription, and real-time PCR were performed using CellsDirectTM One-Step qRT-PCR Kit
(Invitrogen, Carlsbad, California, USA). The PSA, and GAPDH primers described in (84) were
used and are listed in Table 2. The FOXA1 qRT-PCR primers were proprietary primers from
Applied Biosystems (Foster City, California, USA, catalogue number 4331182). Efficiencies
were incorporated into calculations for qRT-PCR using the ΔCp (crossing point) method (R =
2[Cp sample – Cp control]) in which the relative expression ratio (R) for each sample was to GAPDH.
All assays were run on an ABI Step-One Plus thermocycler (Applied Biosystems Inc., Carlsbad,
California, United States) (36).
Table 2. qRT-PCR primer sequences
Gene Forward Sequence Reverse Sequence Probe Species
PSA
5’-
CATCAGGAACAA
AAGCGTGA-3’
5’-AGCTGT
GGCTGACCTGA
AAT-3’
5’-
6FAMCACAGCCTG
TTTCATCCTGAAG
ACACATAMRA-3’
Mouse
GAPDH
5’-
CATGTTCGTCATG
GGTGTGA-3’
5’-GTAGACCAT
GTAGTTGAGGT
CA-3’
5’-
6FAMACAGCCTCA
AGATCATCAGCAA
TGCCTCTAMRA-3’
Mouse
Sequences of the primers and Taqman probes used for qRT-PCR.
30

2.10 ANIMALS
U19/EAF2 heterozygous mice (U19/EAF2+/−) were previously generated as described in (3). The
heterozygous mice were then backcrossed to the C57BL/6J strain (The Jackson Laboratory, Bar
Harbor, ME, USA) for >12 generations to generate U19/EAF2 knockout (KO) mice with a pure
C57BL/6J background under approval by the Institutional Animal Care and Use Committee of
the University of Pittsburgh. Genotyping was determined by PCR analysis of mouse tail genomic
DNA as described earlier (3). A group of 3 wild-type and 5 EAF2-/- C57BL/6J mice at 5-7
months of age were euthanized and the anterior prostates were isolated for western blot analysis
24 hours after the mice were treated with 8 gray of whole body γ-radiation. Anterior prostate
lobes were micro-dissected from the urogenital tract and stored at -80oC. The tissue was lysed
and the protein lysates were analyzed by Western blot using rabbit anti-FOXA1 (ab23738,
Abcam, Cambridge, USA) at a 1:1000 dilution and rabbit anti-GAPDH (sc-25778, Santa Cruz
Biotechnology, Santa Cruz, USA) at a 1:1000 dilution. Protein quantification was performed
using ImageJ and comparison analysis was carried out with a Student’s t test.
2.11 LUCIFERASE ASSAY
C4-2 prostate cancer cell line cells were plated into 24-well plates and then transfected at 60-
80% confluency with 250 ng pGL-PSA, 25 ng pCMV-Renilla, 250ng total of FOXA1-untagged
and pCMV6 at varying ratios, and 250 ng total of HA-EAF2 and HA at 1:1, 1:5, 1:15 and 1:25
ratios of FOXA1 to EAF2, with pCMV6 balancing FOXA1. Luciferase activity was measured
using Dual-Luciferase Reporter Assay (Promega, Madison, Wisconsin, USA) and luminescence
31

was assessed with LMax II/LMax II 384 Luminometer (Molecular Devices, Sunnyvale, CA,
USA). Background was subtracted and fold induction calculated. Each sample was performed in
triplicate. Luciferase activities were normalized to the expression of Renilla. Statistical analysis
was performed using GraphPad Prism (GraphPad Software Inc., La Jolla, California, USA).
2.12 COLONY FORMATION ASSAY
LNCaP cells were plated into five 10cm dishes. When the cells reached 60-80% confluency, four
dishes were transfected with 0.83 µg pEGFP-N3 and 4.17 µg CMV-HA plasmids, 0.83 µg
pEGFP-N3 and 4.17 µg CMV-HA-EAF2 plasmids, 0.83 µg pEGFP-FOXA1-N3 and 4.17 µg
CMV-HA plasmids, or 0.83 µg pEGFP-FOXA1-N3 and 4.17 µg CMV-HA-EAF2 plasmids,
respectively using Polyjet (SignaGen, Gaithersburg, MD, USA). The fifth plate was mock
transfected and remained an un-transfected control. Eighteen hours after transfection the media
was changed with fresh RPMI+ media in order to remove the transfection reagents. Twenty-four
hours after transfection each 10 cm dish was split into three 10 cm dishes. The samples were not
normalized relative to each other. Forty-eight hours after transfection, the media was changed
over to RPMI+ media supplemented with 1mg/mL G418. The cells were grown for three weeks,
changing media about once a week. After 3 weeks, the colonies were stained with a 0.5% crystal
violet solution. The colonies were counted using the Adobe Photoshop CS5 counting tool
(Adobe, San Jose, California, USA). Comparison analysis was performed by Student’s t test
using GraphPad Prism (GraphPad Software Inc., La Jolla, California, USA).
32

3.0 RESULTS
The C. elegans screen identified a phenotypic interaction between the C. elegans homologs of
EAF2 and FOXA1. Loss of eaf-1 or pha-4 alone resulted in reduced fertility, and loss of pha-4 in
eaf-1KO C. elegans resulted in sterility. FOXA1 had been reported to be a pioneer factor for the
androgen receptor and EAF2 had been reported to be up-regulated by androgen in the normal
prostate (2, 6). Loss of FOXA1 had been reported to result in the absence of prostate luminal
epithelial cells and loss of EAF2 resulted in epithelial cell hypertrophy and hyperplasia in three
month old mice (3, 7). It was hypothesized that FOXA1 and EAF2 interact and that interaction
affects androgen receptor signaling, cell growth, and cell development. The following
experiments were performed to test that hypothesis.
3.1 FOXA1 AND EAF2 ASSOCIATE
Since FOXA1 and EAF2 are known transcription factors, and knowing that FOXA1 and EAF2
both show nuclear localization, it is possible that EAF2 and FOXA1 associate within the same
complex (42, 85). In order to test this, PC3 cells were transfected with FOXA1 and EAF2
plasmids, then an immunoprecipitation was performed for EAF2 and the immunoprecipitation
was then blotted for FOXA1. The PC3 cell line was chosen because it is a cell line derived from
prostate cancer, fast-growing when compared to the LNCaP and C4-2 cell lines, and has higher
33

transfection efficiency when compared to the LNCaP and C4-2 cell lines when using the PolyJet
transfection reagent (Signagen). However, the PC3 cell line is AR-, so it was not used for the
experiments to test signaling or survival. As shown in Figure 10, EAF2 does specifically
immunoprecipitate FOXA1 when over-expressed, which suggested EAF2 may associate in the
same complex endogenously.
Figure 10. FOXA1 and EAF2 associate when overexpressed in a prostate cancer cell line
GFP-tagged FOXA1 (GFP-FOXA1) and the GFP-tagged vector (GFP) were co-transfected with
either Myc-tagged EAF2 (Myc-EAF2) or the Myc-tagged empty vector (Myc) into PC3 cells.
Cell lysates were immunoprecipitated (IP) using anti-Myc antibody-conjugated agarose beads,
and blots of the IP lysates and whole cell lysates (WL) were probed using anti-GFP antibody (top
images), anti-Myc antibody (middle images), and anti-GAPDH antibody (bottom images). Four
replications were performed.
GFPGFP-FOXA1MycMyc-EAF2
+
+
++ +
+ ++ +
++
++
++
+
- -- -
IP: αMyc WL
--- -
- -- -
- -- -
75 kDa GFP-FOXA1
50 kDa Myc-EAF2
GAPDH37 kDa
34

After showing that FOXA1 and EAF2 associate when over-expressed, the next question
was which regions of EAF2 are required for EAF2 to bind to FOXA1. For this purpose, N-
terminus deletion mutants and C-terminus deletion mutants of EAF2 were transfected with full
length FOXA1 and then an immunoprecipitation was performed to pull down the EAF2 deletion
mutants and the immunopreciptation was then blotted for FOXA1 to determine which regions of
EAF2 are required for EAF2 to associate with FOXA1. As can be seen in Figures 11 & 12,
FOXA1 bound to the N-terminus deletion mutants and the C-terminus deletion mutants. The N-
terminus of EAF2 is known to bind to ELL, and the C-terminus of EAF2 is involved in DNA
transactivation and the results of the co-immunoprecipitations shown in Figures 11 and 12
suggest that FOXA1 associates with both the N-terminus and C-terminus of EAF2 and may be
associating with EAF2 in a transcription complex (41, 42).
35

Figure 11. FOXA1 associates with the NH2-terminus of EAF2
GFP-tagged FOXA1 (GFP-FOXA1) was co-transfected with full length Myc-tagged EAF2
(Myc-EAF2), Myc-tagged EAF2 COOH-terminal deletion mutants (1-67, 1-113, 1-161, and 1-
245) or Myc-tagged empty vector (Myc) into PC3 cells. Myc-EAF2 was co-transfected with the
GFP-tagged empty vector (GFP) as a negative control. Cell lysates were immunoprecipitated
-+ -
++
+- +
- --
GFP-FOXA1
GFPGFP-FOXA1Myc
-
1-67
+-
-+-
-+-
-+-
1-113
1-161
1-245
75 kDaMyc-EAF2
Anti-Myc IP
Myc-EAF2 1-245
Myc-EAF2 1-161
Myc-EAF2 1-113
Myc-EAF2 1-67
Myc-EAF250 kDa
15 kDa
25 kDa
+
-+ -
++
+- +
- --
75 kDa GFP-FOXA1
GFPGFP-FOXA1MycMyc-EAF2
-+-
-+-
-+-
-+-
WL
1-67
1-113
1-161
1-245
25 kDa GFP
Myc-EAF2 1-245
Myc-EAF2 1-161
Myc-EAF2 1-113
Myc-EAF2 1-67
Myc-EAF250 kDa
15 kDa
GAPDH37 kDa
+
36

with anti-Myc antibody-conjugated agarose beads and blots were probed with anti-GFP antibody
(1st and 3rd blot), anti-Myc antibody (2nd and 4th blot) or anti-GAPDH antibody (5th blot).
Figure 12. FOXA1 associates with the COOH-terminus of EAF2
GFP-tagged FOXA1 (GFP-FOXA1) was co-transfected with full length Myc-tagged EAF2
(Myc-EAF2), Myc-tagged EAF2 NH2-terminal deletion mutants (36-260, 68-260, 113-260, and
162-260) or Myc-tagged empty vector (Myc) into PC3 cells. Myc-EAF2 was co-transfected with
Anti-Myc IP
-+ -
++
+
+- +
- --
GFPGFP-FOXA1Myc
-
36-260
+-
-+-
-+-
-+-
68-260
113-260
162-260
Myc-EAF2
75 kDa
50 kDa
20 kDa
GFP-FOXA1
Myc-EAF2Myc-EAF2 36-260Myc-EAF2 113-260Myc-EAF2 68-260
Myc-EAF2 162-260
25 kDa
WL
-+ -
++
+
+- +
- --
GFPGFP-FOXA1Myc
-
36-260
+-
-+-
-+-
-+-
68-260
113-260
162-260Myc-EAF2
GFP-FOXA1
GFPMyc-EAF2Myc-EAF2 36-260Myc-EAF2 113-260Myc-EAF2 68-260
Myc-EAF2 162-260
75 kDa
50 kDa
20 kDa
25 kDa
GAPDH37 kDa
37

the GFP-tagged empty vector (GFP) as a negative control. Cell lysates were immunoprecipitated
with anti-Myc antibody-conjugated agarose beads and blots were probed with anti-GFP antibody
(1st and 3rd blot), anti-Myc antibody (2nd and 4th blot) or anti-GAPDH antibody (5th blot).
3.2 EAF2 PROTEIN LEVEL IS REDUCED BY FOXA1 AND FOXA1 PROTEIN
LEVEL IS REDUCED BY EAF2
While performing the co-immunoprecipitations of FOXA1 and EAF2, it was noted that FOXA1
altered EAF2 protein levels and EAF2 altered FOXA1 protein levels. Therefore a series of
experiments was performed to confirm whether the presence of FOXA1 reduced EAF2 protein
levels and that the presence of EAF2 reduced FOXA1 protein levels.
3.2.1 FOXA1 and EAF2 protein levels are reduced when co-expressed
In order to test whether FOXA1 reduces EAF2 protein level and EAF2 reduces FOXA1 protein
level, untagged FOXA1 and GFP-tagged EAF2 were co-expressed in LNCaP cells, which do
express both FOXA1 and EAF2 endogenously; a western blot was performed, and the protein
level of EAF2 and FOXA1 was quantified (Figure 13). FOXA1 protein levels were slightly
reduced in the presence of EAF2 and EAF2 protein levels were reduced in the presence of
FOXA1. The results were not statistically significant, due to differences between the degree of
EAF2 and FOXA1 expression between the three different experiments. Table 3 shows the
relative levels of Myc-DDK-FOXA1 and Table 4 shows the relative levels of GFP-EAF2
(normalized to GAPDH).
38

Figure 13. FOXA1 and EAF2 protein levels are reduced when co-expressed
Western blot of whole cell lysate from LNCaP cells co-transfected with GFP-tagged EAF2
(GFP-EAF2), GFP-tagged empty vector (GFP), untagged FOXA1 (FOXA1), or Myc-DDK-
tagged empty vector (Myc-DDK) suggests EAF2 and FOXA1 protein levels are reduced when
co-expressed. The left panel is a blot that is representative of the 3 replications and was blotted
with anti-FOXA1 antibody (top blot), anti-GFP antibody (middle blot), or anti-GAPDH antibody
(bottom blot). The upper right panel is a graphical summary of the densitometric analysis of
FOXA1 expression normalized to GAPDH used as a loading control. The lower right panel is a
graphical summary of the densitometric analysis of EAF2 expression normalized to GAPDH
used as a loading control. Bars represent the means of 3 independent experiments ± SEM.
GFPGFP-EAF2Myc-DDKFOXA1
+
+
+
+
++
+
+
-
-
--
-
-
-
-
GFPGFP-EAF2Myc-DDKFOXA1
+
+
+
+
++
+
+
-
-
--
-
-
-
-
+
+
+
+
++
+
+
-
-
--
-
-
-
-
GFPGFP-EAF2Myc-DDKFOXA1
50 kDa
50 kDa
75 kDa
37 kDa
25 kDa
37 kDa
39

Table 3. Relative protein levels of over-expressed FOXA1 in the FOXA1 and GFP-EAF2 over-expression
experiments.
Sample GFP + Myc-
DDK GFP + FOXA1
GFP-EAF2 +
Myc-DDK
GFP-EAF2 +
FOXA1
15 March 2013 1.00 1.94 0.94 1.07
21 March 2013 1.00 2.19 1.06 0.93
3 April 2013 1.00 1.30 0.84 2.19
Average 1.00 1.81 0.95 1.40
Numerical summary of the densitometric analysis of FOXA1 expression normalized to GAPDH
used as a loading control. Numbers are in densitometric units relative to the empty vector
control.
Table 4. Relative protein levels of over-expressed GFP-EAF2 in the GFP-EAF2 and Myc-DDK-FOXA1 co-
expression experiments
Sample GFP + Myc-
DDK GFP + FOXA1
GFP-EAF2 +
Myc-DDK
GFP-EAF2 +
FOXA1
15 March 2013 1.00 0.51 2.06 1.39
21 March 2013 1.00 0.40 9.27 2.40
3 April 2013 1.00 1.64 68.1 42.4
Average 1.00 0.85 26.5 15.4
Numerical summary of the densitometric analysis of EAF2 expression normalized to GAPDH
used as a loading control. Numbers are in densitometric units relative to the empty vector
control.
40

3.2.2 FOXA1 protein levels rise when EAF2 is lost
The co-transfection results suggested that EAF2 could affect FOXA1 protein stability so the next
set of experiments tested FOXA1 protein and mRNA levels in the presence and absence of
EAF2. The first experiment, shown in Figure 14, tested the level of FOXA1 in the prostates of
wild-type and EAF2-/- mice. As can be seen in Figure 14, FOXA1 protein levels were elevated 3-
fold in the EAF2-/- mice when compared to the wild-type mice, and this was a significant
elevation (p ≤ 0.05). However, the mice used in the experiment had been irradiated as part of a
separate project examining the role of EAF2 in DNA-damage response. It may be that while
absence of EAF2 increases FOXA1 protein levels in an irradiated mouse prostate, absence of
EAF2 will have no effect on FOXA1 protein levels under normal biological conditions. This
mechanism could be due to the published finding that EAF2 promotes apoptosis after UV
exposure (61). It is possible that the reduction in FOXA1 protein levels is due to EAF2-induced
apoptosis. Therefore, additional experiments were performed to confirm the finding that FOXA1
protein levels rise in the absence of EAF2.
41

Figure 14. FOXA1 protein levels are elevated in the prostates of EAF2 knockout mice
Western blot of murine prostate tissue reveals FOXA1 is elevated when EAF2 is knocked out.
Protein lysates harvested from the anterior prostates of 3 wild type (EAF2 +/+) and 5 Eaf2
knockout (EAF2 -/-) mice 24 hours after the mice were exposed to 8 gray of whole-body γ-
radiation were blotted with anti-FOXA1 antibody (upper blot) or GAPDH antibody (lower blot).
The lower panel is a graphical summary of the densitometric analysis of XA1 expression
normalized to GAPDH used as a loading control. Bars represent the mean of the different
samples ± SEM. A t-test was performed to determine significance. *=p≤0.05
Having observed that FOXA1 protein levels were elevated when EAF2 was knocked out
in irradiated mice, the next experiment tested if FOXA1 protein levels were elevated when EAF2
is knocked down in a human prostate cancer cell line. This experiment avoided the problem of
irradiation adding an extra variable to the results. As shown in Figure 15, a reduction in EAF2
protein level caused by treatment with siEAF2 in LNCaP cells increased FOXA1 protein level
EAF2+/+
EAF2-/-
EAF2+/-
50 kDa
37 kDa
FOXA1
GAPDH
42
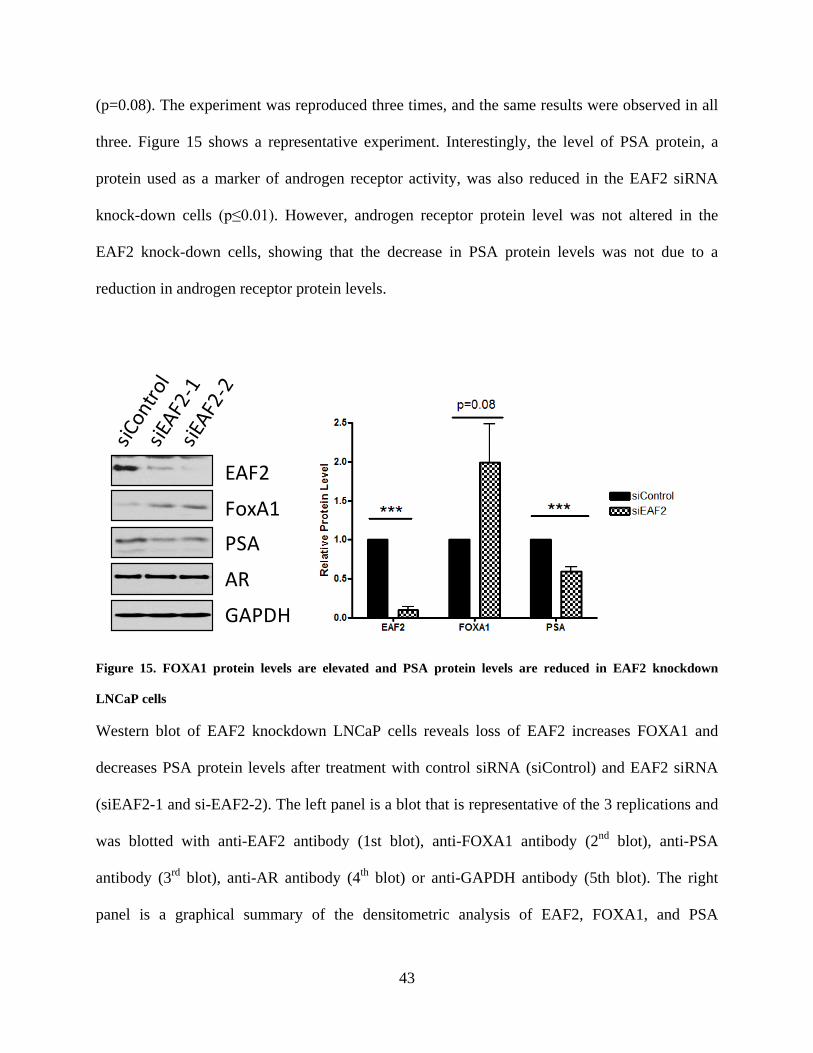
(p=0.08). The experiment was reproduced three times, and the same results were observed in all
three. Figure 15 shows a representative experiment. Interestingly, the level of PSA protein, a
protein used as a marker of androgen receptor activity, was also reduced in the EAF2 siRNA
knock-down cells (p≤0.01). However, androgen receptor protein level was not altered in the
EAF2 knock-down cells, showing that the decrease in PSA protein levels was not due to a
reduction in androgen receptor protein levels.
Figure 15. FOXA1 protein levels are elevated and PSA protein levels are reduced in EAF2 knockdown
LNCaP cells
Western blot of EAF2 knockdown LNCaP cells reveals loss of EAF2 increases FOXA1 and
decreases PSA protein levels after treatment with control siRNA (siControl) and EAF2 siRNA
(siEAF2-1 and si-EAF2-2). The left panel is a blot that is representative of the 3 replications and
was blotted with anti-EAF2 antibody (1st blot), anti-FOXA1 antibody (2nd blot), anti-PSA
antibody (3rd blot), anti-AR antibody (4th blot) or anti-GAPDH antibody (5th blot). The right
panel is a graphical summary of the densitometric analysis of EAF2, FOXA1, and PSA
EAF2
FoxA1 PSA
AR
GAPDH
43

expression normalized to GAPDH used as a loading control. Bars represent the mean of the
different samples ± SEM. A t-test was performed to determine significance. ***=p≤0.001.
3.3 FOXA1 PROTEIN LEVELS ARE ELEVATED AND PSA RNA LEVELS ARE
REDUCED UPON EAF2 KNOCKDOWN
Having observed that loss of EAF2 altered FOXA1 and PSA protein levels, the next question
was whether the effect occurred at the protein level or at the mRNA level and if the increase of
FOXA1 and the decrease of PSA occurs at the mRNA level, does overexpression of FOXA1 and
EAF2 affect PSA-promoter activity. In order to test this, qRT-PCR was performed on RNA
isolated from the control and EAF2 knockdown LNCaP cells. As shown in Figure 16, there was
a statistically significant 1.3 fold reduction of PSA mRNA levels (p≤0.01) in the EAF2
knockdown cell lines compared to the control. FOXA1 mRNA levels showed a trend of
elevation, but the result was not statistically significant (p≤0.1295).
After observing that FOXA1 protein was elevated and PSA mRNA was reduced when
EAF2 was knocked down, the next experiment tested, by luciferase assay, the effect of FOXA1
and EAF2 on PSA promoter activity. When FOXA1 was over-expressed in C4-2 cells, PSA
promoter activity was reduced in a dose-dependent manner, as can be seen in Figure 17 and
which matches previous reports (86). This led to the hypothesis that loss of EAF2 reduced PSA
expression due to increased FOXA1 protein inhibiting PSA promoter activity.
44

Figure 16. PSA mRNA levels are reduced in EAF2 knockdown LNCaP cells
LNCaP cells were treated with EAF2 siRNA (siEAF2) or control siRNA (siC). The cells were
then subjected to reverse transcription and quantitative real-time PCR for PSA mRNA levels
(top) and FOXA1 mRNA levels (bottom). Data represents the mean ± SEM of 2 siC samples and
3 siEAF2 samples. A t-test was performed to determine significance. **= p≤0.01.
**=p<0.01
45

Figure 17. FOXA1 represses PSA promoter activity
C4-2 cells were transfected with 250 ng of PSA-promoter driven luciferase, 25 ng of CMV-
promoter driven renilla and 250 ng of FOXA1-untagged plasmid or pCMV6 empty vector alone
or with 1:1, 1:5, 1:15, and 1:25 parts FOXA1 plasmid to pCMV6 plasmid, totaling 250 ng of
DNA. Cells were lysed 24 hours after treatment with charcoal-striped RPMI+ media with (+
androgen) or without (-androgen) 1 nM supplemental R1881 administered 16 hours before lysis.
Luciferase expression was calculated relative to renilla expression. Significance determined by t-
test. *=p≤0.05
FOXA1pCMV6 +
‒+‒
Androgen + ‒
+‒
+‒
46

3.4 CO-EXPRESSION OF EAF2 AND FOXA1 COUNTERACTS EACH OTHER’S
EFFECTS ON CELL GROWTH
Over-expression of EAF2 has been previously shown to reduce growth when over-expressed in
PC3 cells and knockdown of FOXA1 in LNCaP and PC3 cell lines reduces growth (2, 25) When
EAF2 is overexpressed in LNCaP cells, a colony formation assay shows that cell growth is
reduced. Likewise, when FOXA1 is over-expressed in LNCaP cells, cell growth is increased.
When EAF2 and FOXA1 are over-expressed together, an intermediary growth phenotype similar
to the control cells is observed (Figure 18). Compared to the empty-vector control average
colony number of 52, the EAF2-alone average colony number was 24 which is a 2-fold reduction
colony number (p≤0.01 by t-test), the FOXA1-alone average colony number is 83 colonies
which is a 1.6 fold increase in colony number (p≤0.01), and the average number of
FOXA1+EAF2 colonies is 36 which is a 1.3 fold reduction in colony number (p≤0.05). The
FOXA1+EAF2 average colony number is reduced 2.3 fold compared to the FOXA1-alone
colony number (p≤0.001). The FOXA1+EAF2 average colony number is elevated 1.5 fold
compared to the EAF2-alone average colony number which was significant, but with a p=0.06.
This data shows that while FOXA1 increases cell survival and EAF2 decreases cell survival,
expression of both together results in an intermediate phenotype.
47

Figure 18. Co-expression of FOXA1 and EAF2 results in an intermediary growth phenotype
Effects of FOXA1 and EAF2 on colony formation. Surviving LNCaP cells co-transfected with
HA-EAF2 and/or GFP-FOXA1 at 3 weeks stained with crystal violet (top image). Empty vector
controls GFP and HA. Data depicted as mean ± SEM. Significance determined by t-test.
*=p≤0.05, **=p≤0.01, ***=p≤0.001.
GFPHA
GFPHA-EAF2
GFP-FOXA1HA
GFP-FOXA1HA-EAF2
Untransfected
GFP
GFP-FOXA1
HA
HA-EAF2
+
+
+
+
++
+
+
‒ ‒ ‒‒‒‒
‒‒
‒‒
‒
‒
48
4.0 DISCUSSION
4.1 OVERVIEW OF RESULTS
The research presented here demonstrates an interaction between FOXA1 and EAF2 that appears
to alter FOXA1-mediated androgen receptor signaling. Specifically, FOXA1 and EAF2 appear to
be part of a feedback loop that modulates androgen receptor (AR) signaling in the normal
prostate, which is de-regulated in prostate cancer (Figure 1). The first evidence of the interaction
was a genetic screen performed in C. elegans, which showed that loss of the C. elegans FOXA1
homolog in C. elegans where the EAF2 homolog had been knocked out resulted in sterility due
to egg degeneration (Figures 7&8).
Then human FOXA1 and EAF2 were shown to associate when over-expressed in prostate
cancer (PCa) cell lines. Specifically, when FOXA1 and EAF2 are over-expressed, EAF2 is able
to specifically immunoprecipitate FOXA1, suggesting that FOXA1 and EAF2 are associating in
the same complex (Figure 10). The association appears to be mediated by both the N-terminus
and C-terminus of EAF2 (Figures 11&12).
Next, it was shown that FOXA1 and EAF2 mutually reduce each other’s protein level.
Specifically, FOXA1 protein levels are reduced when co-expressed with EAF2 and EAF2
protein levels are reduced when co-expressed with FOXA1 (Figure 13, Tables 3&4).
49

Furthermore, FOXA1 protein levels are elevated in prostate tissue samples from EAF2 knockout
mice (Figure 14) and in prostate cancer cell lines when EAF2 is knocked down (Figure 15).
In addition, loss of EAF2 increases FOXA1-mediated repression of the PSA promoter.
First, PSA mRNA levels are reduced when EAF2 is knocked-down in PCa cell lines (Figure 16),
and FOXA1 has been shown to inhibit PSA promoter activity (Figure 17), while loss of EAF2
increases FOXA1 (Figures 14&15).
Finally, over-expression of FOXA1 and EAF2 in a prostate cancer cell line results in an
intermediary growth phenotype, when compared with expression of FOXA1 or EAF2 alone
(Figure 18). This result indicated that FOXA1 and EAF2 mediate cell growth, with over-
expression of FOXA1 promoting cell growth and over-expression of EAF2 promoting cell death.
4.2 ROLE OF FOXA1 AND EAF2 INTERACTION IN AR SIGNALING
As prostate cancer (PCa) is the most common non-cutaneous cancer diagnosed and the second
most common cause of cancer death in men in the United States, it is important to explore the
mechanisms of PCa development and progression (1). PCa, like other cancers, is believed to be
caused by a dysregulation of various signaling pathways, in particular the androgen receptor
(AR) signaling pathway that the prostate is dependent on for growth and survival (34). However,
the genes upregulated and down-regulated by AR in androgen dependent prostate cancer and
castration resistant prostate cancer are different (87). Therefore it is important to study how
prostate homeostasis is maintained in response to androgen receptor signaling and to determine
the signaling pathways that are dysregulated in prostate cancer. The interaction of FOXA1 and
50

EAF2 appears to play a role in maintaining prostate homeostasis and is dysregulated in PCa due
to the down-regulation of EAF2 (Figure 1).
One hypothesized way in which growth is controlled in the normal prostate is the
regulation by androgen receptor of growth-suppressive genes (88). EAF2, initially discovered in
1997 as U19 and in 2003 as EAF2, is an androgen up-regulated tumor suppressor and appears to
play a role in maintaining prostate homeostasis (2, 3, 40, 89). One of the key pieces of evidence
that EAF2 plays a role in maintaining prostate homeostasis is that when EAF2 was knocked out
in mice, prostate epithelial hypertrophy, hyperplasia, and dysplasia was observed (3). Therefore,
it is possible that EAF2, which is known to be a transcription elongation factor that promotes the
up-regulation of genes which inhibit the vascularization required for tumor growth and a pro-
apoptotic protein, could be promoting the transcription of a set of genes that inhibit prostate
growth and promote cell differentiation (2, 35, 59).
FOXA1 also plays a role in androgen receptor signaling, as an androgen receptor pioneer
factor (6, 29). FOXA1 binds to chromatin right next to an androgen response element (ARE),
and then AR binds to FOXA1 and to the ARE to begin transcription (6). FOXA1 has also been
shown to modulate AR signaling, with over-expression of FOXA1 inhibiting PSA promoter
activity (Figure 17) (86). FOXA1 is required for prostate epithelial cells to develop, and FOXA1
has been observed to be over-expressed in castration-resistant prostate cancer (7, 25).
Furthermore, over-expression of FOXA1 results in a castration-resistant prostate cancer
phenotype in the androgen-dependent LNCaP prostate cancer cell line, likely due to changes in
chromatin accessibility (90).
FOXA1 and EAF2 appear to associate in the same complex (Figure 10). In addition,
over-expression of FOXA1 reduces EAF2 protein levels and over-expression of EAF2 reduces
51

FOXA1 protein levels, while FOXA1 protein levels rise when EAF2 is absent or reduced
(Figures 13-15, Tables 3&4). This data supports the interaction of FOXA1 and EAF2 and hints
towards a possible mechanism by which FOXA1 and EAF2 form a feedback loop that modulates
AR activity and prostate cell growth and survival. In addition, over-expression of FOXA1 was
shown to promote cell growth and survival in a PCa cell line, while over-expression of EAF2
decreased cell growth and survival, which matches previous reports of the roles of FOXA1 and
EAF2 in cell growth and survival (Figure 18) (2, 90). However, when FOXA1 and EAF2 are
over-expressed together, the cell growth resembles that of the cells transfected with the empty
vector control (Figure 18). This data again shows that FOXA1 and EAF2 modulate prostate cell
growth. Both are present in the normal prostate, but EAF2 expression is reduced in prostate
cancer, while FOXA1 expression increased, suggesting a dysregulation of the AR-mediated
pathways that control PCa growth (2, 25). Furthermore, down-regulation of EAF2 may up-
regulate FOXA1 expression, or enhance FOXA1 function, which promotes PCa development
and progression.
FOXA1 and EAF2 may regulate AR signaling through co-factor recruitment to androgen
response elements on the promoters of androgen-responsive genes. For instance, FOXA1 has
been shown to recruit the Groucho/TLE co-repressor complex to chromatin (91). Groucho/TLE
represses gene transcription through multiple mechanisms including interactions with histone
deacetylases and promoter binding (92). FOXA1-mediated recruitment of co-repressors has been
shown to alter AR signaling and may be responsible for the different gene expression patterns
observed in androgen-dependent prostate cancer and castration-resistant prostate cancer (8).
EAF2 may inhibit FOXA1-mediated repression of AR signaling by blocking the recruitment of
co-repressors to the promoters of AR-dependent genes. EAF2 has also been shown to inhibit
52

gene transcription by blocking the recruitment of CBP/p300 (93). CBP/p300 is a transcription
co-activator that acetylates chromatin, which then shifts DNA into a conformation that is
permissive to gene transcription (94). EAF2 may inhibit FOXA1-mediated transcription of genes
that promote growth by inhibiting the recruitment of CBP/p300 to the promoter. FOXA1 and
EAF2 have both been reported to alter gene transcription by recruiting or inhibiting the
recruitment of transcription co-activators and co-repressors and may regulate AR-mediated gene
transcription through this mechanism.
4.3 MECHANISM OF FOXA1 AND EAF2 INTERACTIONS
There are multiple possibilities how FOXA1 and EAF2 could be interacting to affect each other
and prostate cell growth. Because EAF2 and FOXA1 are both transcription factors with nuclear
localization (40, 42, 63), it was hypothesized that the two proteins could associate in the same
complex. Another sign that FOXA1 and EAF2 could interact either directly or indirectly within
the same complex was that FOXA1 and EAF2 both associate with subunits of the Mediator
Complex with FOXA1 associating with MED1 and EAF2 associating with MED26 (56, 95, 96).
This suggested that EAF2 and FOXA1 could be components of the same transcription complex.
Furthermore, FOXA1 is known to recruit MED1 to the promoter of UBE2C, an oncogene that is
over-expressed in castration-resistant prostate cancer (95). Therefore, co-immunoprecipitations
were performed to test if FOXA1 and EAF2 associate. As Figure 10 shows, FOXA1 and EAF2
co-immunoprecipitated when over-expressed together in the PC3 cell line. Likewise, as shown in
Figures 11 and 12, FOXA1 associates with both the N-terminus and C-terminus of EAF2. The
N-terminus of EAF2 binds to ELL and joins EAF2 to the Super Elongation Complex, while the
53

C-terminus binds to TCEA1 and TCEA2, two transcription elongation factors that associate with
RNA polymerase II (40, 41, 54). These results indicate that FOXA1 and EAF2 are associating in
the same complex, potentially a transcription complex. It is possible that FOXA1 and EAF2
affect cell growth and survival by altering gene transcription, either in conjunction with AR or
independently of AR. For instance, it has been found that glucocorticoids up-regulate EAF2
mRNA expression, and FOXA1 binds to the promoters of glucocorticoid receptor regulated
genes (87). In addition, it has been found that down-regulation of EAF2 can be mediated by the
epidermal growth factor receptor in PCa (97). These results indicate that FOXA1 and EAF2 can
function independently of AR.
Another potential mechanism by which FOXA1 and EAF2 may affect each other is
through modulating the protein and mRNA levels of each other, which then affects AR-mediated
transcription of PSA and prostate cell growth and survival. As seen in Figure 13 and Tables 3&4,
over-expression of FOXA1 reduced EAF2 protein levels and over-expression of EAF2 reduces
FOXA1. In this experiment, the cells were transfected with CMV promoter-driven FOXA1 and
EAF2 plasmid constructs. Therefore, the effect occurred at the post-translational level, not the
transcriptional level. EAF2 could affect FOXA1 protein stability through direct interactions
where binding of FOXA1 to EAF2 promotes degradation of both. EAF2 could promote FOXA1
degradation by binding to and stabilizing a second protein which then promotes FOXA1
degradation. This would be similar to how EAF2 reduces protein levels of HIF1α by binding to
and stabilizing pVHL which then binds to HIF1α by hydroxylation of HIF1α prolines and
recruits ubiquitin ligases that ubiquitinate HIF1α, leading to HIF1α degradation by the
proteoseome (57). It could also be a chain of protein-protein interactions leading ultimately to
FOXA1 degradation. This would be similar to how NFκB is activated, where a chain of kinase-
54

mediated phosphorylation steps are required which ultimately leads to the ubiquitination and
degradation of IκB and NFκB translocation into the nucleus (98).
Another way EAF2 could reduce FOXA1 protein levels is by mediating the transcription
of another protein that then reduces FOXA1 protein levels and FOXA1 could use a similar
mechanism to reduce EAF2 protein levels. For instance, EAF2 binds to and is stabilized by
ELL2, which is another androgen-responsive gene (40, 42, 84). Over-expression of CMV-
promoter-driven FOXA1 may reduce CMV-promoter-driven EAF2 protein levels by reducing
transcription of ELL2 mRNA, which then leads to reduced ELL2 protein levels. With less
available ELL2 to bind to and stabilize EAF2, EAF2 protein degradation is promoted.
Use of CMV-promoter driven FOXA1 and EAF2 indicated that FOXA1 and EAF2
regulate each other at the post-transcriptional level, regulation at the post-transcriptional level
does not rule out the possibility that FOXA1 can reduce transcription of EAF2 mRNA and EAF2
can reduce transcription of FOXA1 mRNA. For instance, while knockdown of EAF2
significantly increased FOXA1 protein levels, FOXA1 mRNA levels were also increased,
although the result was not statistically significant (Figure 16). Over-expression of FOXA1
reduced the expression of PSA mRNA (Figures 16&17) and may reduce the expression of EAF2
mRNA as well.
4.4 FOXA1 AND EAF2 REPRESENT A NOVEL FEEDBACK LOOP IN ANDROGEN
RECEPTOR SIGNALING
The interaction of EAF2 and FOXA1 appears to be part of a newly identified feedback loop in
androgen receptor signaling. The over-expression of FOXA1 reduces the protein levels of the
55

androgen up-regulated genes like PSA and reduces the protein level of over-expressed EAF2.
Likewise, over-expression of EAF2 reduced FOXA1 protein levels. In addition, FOXA1 and
EAF2 associate in the same complex. Together the data suggests an interaction loop between
FOXA1 and EAF2 as illustrated in Figure 19. EAF2 reduces FOXA1 protein levels and inhibits
FOXA1-mediated repression of PSA and cell growth, and FOXA1 reduces EAF2 protein levels
and inhibits EAF2-mediated cell death. These results suggest that the interaction of FOXA1 and
EAF2 represents an interesting target for future therapies of prostate cancer. Pharmaceuticals that
promote EAF2 expression or which mimic the effects of the interaction of EAF2 and FOXA1
could be used to treat prostate cancer by restoring normal androgen receptor signaling.
Restoration of normal androgen receptor signaling would return the prostate back to normal
homeostasis and inhibit tumor growth.
Figure 19. FOXA1 and EAF2 form a feedback loop in androgen receptor signaling
Schematic of the proposed mechanism based on the current observations of the interaction of
FOXA1 and EAF2. FOXA1 binds to the androgen receptor (AR) and to a gene promoter and
inhibits transcription of androgen-responsive genes like PSA. EAF2 inhibits FOXA1-mediated
AR ARFOXA1PSA
EAF2
56

repression of androgen-receptor transcription and reduces FOXA1 protein levels and FOXA1
reduces EAF2 protein levels and inhibits EAF2.
4.5 FUTURE DIRECTIONS
The interaction of FOXA1 and EAF2 may be a promising target for future pharmaceuticals that
will either stabilize EAF2 by inhibiting the interaction of FOXA1 and EAF2 or will reduce
FOXA1 protein levels by mimicking the interaction of FOXA1 and EAF2. However, for such
pharmaceuticals to be practical, the mechanism of the interaction of FOXA1 and EAF2 needs to
be further elucidated, as well as the ramifications of inhibiting the interaction on prostate cell
growth and proliferation.
One key step is to further elucidate the association of FOXA1 and EAF2. Co-
immunoprecipitations will be performed to determine if the association of FOXA1 and EAF2
occurs when FOXA1 and EAF2 are expressed endogenously in addition to when they are over-
expressed. Also, further co-immunoprecipitations using FOXA1 deletion mutants and EAF2
deletion mutants will be used to determine which regions of FOXA1 and EAF2 are required for
FOXA1 and EAF2 to associate. Once it is possible to generate mutants of FOXA1 and EAF2
that do not associate, it is possible to determine if FOXA1 and EAF2 reduce the protein levels of
each other via association in the same complex or if another mechanism like transcription of an
intermediary protein is required. If FOXA1 and EAF2 reduce the protein levels of each other
through the association shown in Figure 10, FOXA1 and EAF2 deletion mutants lacking the
57

regions required for association will not be affected by co-transfection with wild-type EAF2 and
FOXA1 respectively.
Another question that should be answered is if FOXA1 and EAF2 promote the
degradation of each other. One method would be to perform pulse-chase experiments to
determine if FOXA1 protein levels are different when EAF2 is knocked-down and if EAF2
protein levels are different when FOXA1 is knocked-down. Then it can be determined if the
proteins reduce the stability of each other or if somehow more FOXA1 and EAF2 protein is
expressed when the other protein is absent.
It will also be important to determine if EAF2 alters the availability of FOXA1 and AR at
the PSA promoter. Chromatin immunoprecipitations would be performed to determine if the
presence or absence of EAF2 affects the localization of AR and FOXA1 to the PSA-promoter.
This would provide evidence that EAF2 is directly altering PSA-promoter activity by altering the
presence of AR at the PSA-promoter.
It is also important to determine if FOXA1 changes EAF2 mRNA levels and if EAF2
reduces FOXA1 mRNA levels. First, it should be determined if loss of EAF2 increases FOXA1
mRNA levels significantly and if loss of FOXA1 alters EAF2 mRNA levels. This can be
performed by knocking down FOXA1 and EAF2 in LNCaP or C4-2 cells, which endogenously
express FOXA1 and EAF2. If loss of EAF2 increases FOXA1 mRNA levels or if loss of FOXA1
alters EAF2 mRNA levels, chromatin immunoprecipitations will be performed to determine if
EAF2 is associated with the FOXA1 promoter or if FOXA1 is associated with the EAF2
promoter.
Another interesting question to answer would be if EAF2 binding partners like ELL1,
ELL2, or pVHL also affect FOXA1 protein levels and FOXA1-mediated transcription of PSA in
58

a manner similar to EAF2. It would be hypothesized that if ELL1 or ELL2 interact with FOXA1
in a manner similar to EAF2, the observed interaction involved either the super elongation
complex or little elongation complex of which EAF2, ELL, ELL2 are components (55). If pVHL
affects FOXA1 in a manner similar to EAF2, it would be hypothesized that the observed
interaction would involve the hypoxia-response signaling pathways (57, 99).
The research here suggests that in the normal prostate there is a balance between AR
signaling that promotes cell proliferation and that which promotes cell death (100, 101). During
the development and progression of prostate cancer, the balance between cell proliferation and
cell death becomes skewed towards cell proliferation due to the loss of tumor suppressors like
EAF2 (2, 26). More work is needed to elucidate the interaction of FOXA1 and EAF2, but it
represents a new potential way to restore normal AR signaling and to treat prostate cancer.
59

5.0 SUPPLEMENTARY FIGURES
5.1 FOXA1 AND EAF2 PROTEIN STABILITY ASSAY
It is possible that FOXA1 and EAF2 could affect the stability of the other protein. Therefore
assays were performed in LNCaP cells to determine if EAF2 protein stability was reduced in the
presence of FOXA1 or if FOXA1 stability was reduced in the presence of EAF2. As shown in
Figure 12, EAF2 degraded too quickly to be able to determine if FOXA1 affected EAF2 protein
stability or if EAF2 affected FOXA1 protein stability. EAF2 had been previously reported to be
50% degraded within 6 hours when over-expressed Cos-7 cells and 50% degraded within 2 hours
when over-expressed in 293 cells (42). A pulse-chase experiment using radioactively-labeled
EAF2 followed by another using radioactively-labeled FOXA1 will avoid the complications
caused by EAF2 degradation due to continuous expression of replacement EAF2 and will be
performed in the future.
60

Figure 20. The effect of co-expression of EAF2 and FOXA1 on FOXA1 and EAF2 protein stability is
inconclusive
The effect of FOXA1 on EAF2 protein stability (top images). Two micrograms of HA-EAF2
were co-transfected with 2.0 µg of Myc-DDK-FOXA1 (Myc-FOXA1) or Myc empty vector
(Myc) into PC3 cells. Forty hours after transfection, cells were treated with cycloheximide
(CHX) at 50 µg/µL for the indicated number of hours. A graphical display of the densitometric
analysis of EAF2 protein levels normalized to GAPDH protein levels was made. Points represent
the mean of the same time point from three different experiments ± SEM. The effect of EAF2 on
FOXA1 protein stability (bottom images). Two micrograms of Myc-DDK-FOXA1 were co-
transfected with 2.0 µg of HA-EAF2 or HA empty vector (HA) into PC3 cells. Forty hours after
transfection, cells were treated with cycloheximide (CHX) at 50 µg/µL for the indicated number
of hours. A graphical display of the densitometric analysis of EAF2 protein levels normalized to
GAPDH protein levels was made. Points represent the mean of the same time point from three
different experiments ± SEM.
Myc-FOXA1HA
Myc-FOXA1HA-EAF2
h CHX 0 2 4 6 8 0 2 4 6 8
Myc-FOXA150 kDa
HA-EAF250 kDa
GAPDH37 kDa
HA-EAF2Myc
HA-EAF2Myc-FOXA1
h CHX 0 2 4 6 8 0 2 4 6 8HA-EAF250 kDa
Myc-FOXA150 kDa
37 kDa GAPDH
61
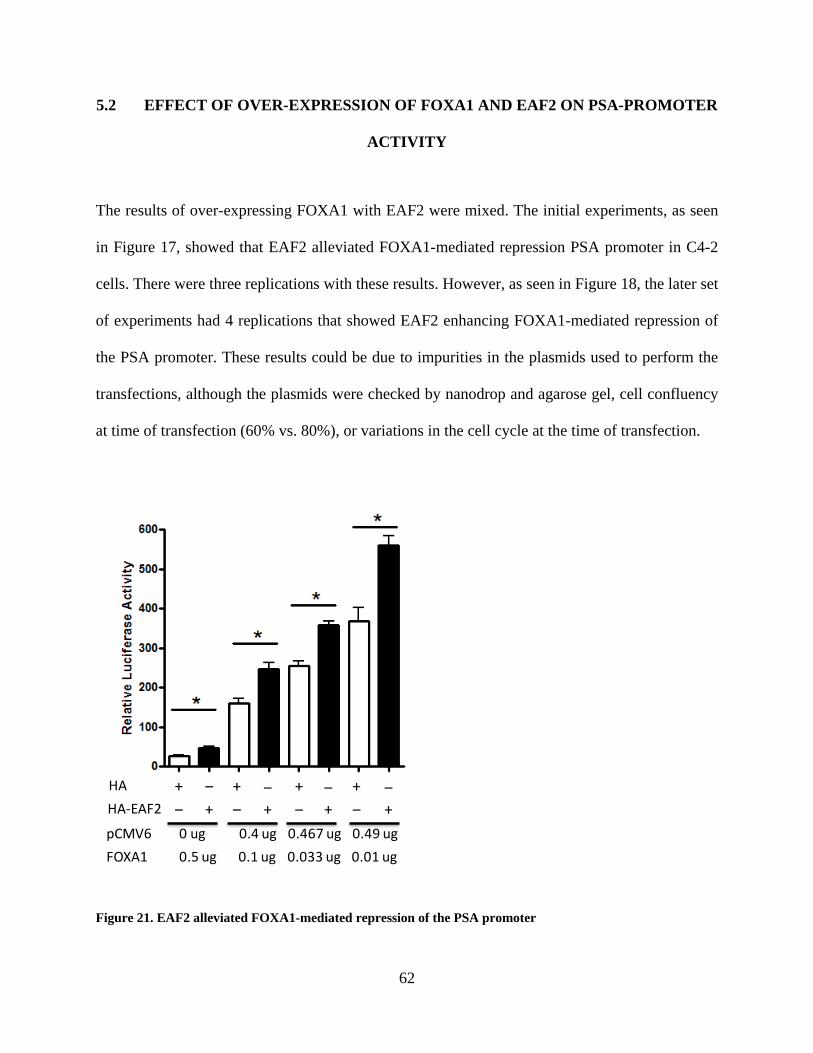
5.2 EFFECT OF OVER-EXPRESSION OF FOXA1 AND EAF2 ON PSA-PROMOTER
ACTIVITY
The results of over-expressing FOXA1 with EAF2 were mixed. The initial experiments, as seen
in Figure 17, showed that EAF2 alleviated FOXA1-mediated repression PSA promoter in C4-2
cells. There were three replications with these results. However, as seen in Figure 18, the later set
of experiments had 4 replications that showed EAF2 enhancing FOXA1-mediated repression of
the PSA promoter. These results could be due to impurities in the plasmids used to perform the
transfections, although the plasmids were checked by nanodrop and agarose gel, cell confluency
at time of transfection (60% vs. 80%), or variations in the cell cycle at the time of transfection.
Figure 21. EAF2 alleviated FOXA1-mediated repression of the PSA promoter
HAHA-EAF2
FOXA1pCMV6
+ + + ++ + + +‒ ‒ ‒ ‒
‒ ‒ ‒ ‒0 ug 0.4 ug 0.467 ug 0.49 ug0.5 ug 0.1 ug 0.033 ug 0.01 ug
62

C4-2 cells were transfected with 250 ng of PSA-promoter driven luciferase, 25 ng of CMV-
promoter driven renilla, 250 ng of HA-EAF2 or HA empty vector (HA) and 250 ng of FOXA1-
untagged plasmid alone or with 1:1, 1:5, 1:15, and 1:25 parts FOXA1 plasmid to pCMV6
plasmid, totaling 250 ng of DNA. Cells were lysed 24 hours after treatment with charcoal-striped
RPMI+ media with 1 nM supplemental R1881 administered 16 hours before lysis. Luciferase
expression was calculated relative to renilla expression. Significance determined by t-test.
*=p≤0.05
Figure 22. EAF2 enhanced FOXA1-mediated repression of the PSA promoter
C4-2 cells were transfected with 250 ng of PSA-promoter driven luciferase, 25 ng of CMV-
promoter driven renilla, 250 ng of HA-EAF2 or HA empty vector (HA) and 250 ng of FOXA1-
untagged plasmid alone or with 1:1, 1:5, 1:15, and 1:25 parts FOXA1 plasmid to pCMV6
plasmid, totaling 250 ng of DNA. Cells were lysed 24 hours after treatment with charcoal-striped
RPMI+ media with 1 nM supplemental R1881 administered 16 hours before lysis. Luciferase
HAHA-EAF2
FOXA1pCMV6
+ + + ++ + + +‒ ‒ ‒ ‒
‒ ‒ ‒ ‒0 ug 0.4 ug 0.467 ug 0.49 ug0.5 ug 0.1 ug 0.033 ug 0.01 ug
++‒
‒0.5 ug0 ug
63

expression was calculated relative to renilla expression. Significance determined by t-test.
*=p≤0.05
64

BIBLIOGRAPHY
1. R. Siegel, D. Naishadham, A. Jemal, CA Cancer J Clin 62, 10 (Jan-Feb, 2012). 2. W. Xiao et al., Cancer Res 63, 4698 (Aug 1, 2003). 3. W. Xiao et al., Oncogene 27, 1536 (Mar 6, 2008). 4. L. Cai, B. L. Phong, A. L. Fisher, Z. Wang, J Biol Chem, (Aug 31, 2011). 5. J. M. Kalb et al., Development 125, 2171 (Jun, 1998). 6. N. Gao et al., Molecular endocrinology (Baltimore, Md 17, 1484 (Aug, 2003). 7. N. Gao et al., Development 132, 3431 (Aug, 2005). 8. B. Sahu et al., The EMBO journal 30, 3962 (Oct 5, 2011). 9. R. L. Noble, Cancer Res 37, 1929 (Jun, 1977). 10. R. K. Ross et al., Cancer Res 58, 4497 (Oct 15, 1998). 11. F. Dayyani, G. E. Gallick, C. J. Logothetis, P. G. Corn, Journal of the National Cancer
Institute 103, 1665 (Nov 16, 2011). 12. J. Semenas, N. Dizeyi, J. L. Persson, Drug design, development and therapy 7, 875
(2013). 13. R. Schrecengost, K. E. Knudsen, Seminars in oncology 40, 244 (Jun, 2013). 14. H. Sternbach, The American journal of psychiatry 155, 1310 (Oct, 1998). 15. J. E. Morley et al., Metabolism: clinical and experimental 46, 410 (Apr, 1997). 16. P. J. Cook, R. Doll, S. A. Fellingham, International journal of cancer 4, 93 (Jan 15,
1969). 17. H. Isbarn et al., European urology 56, 48 (Jul, 2009). 18. P. Koivisto, M. Kolmer, T. Visakorpi, O. P. Kallioniemi, Am J Pathol 152, 1 (Jan, 1998). 19. M. B. Stope et al., Int J Clin Pharmacol Ther 50, 65 (Jan, 2012). 20. S. Lu, Z. Tan, M. Wortman, Z. Dong, Int J Oncol 36, 459 (Feb, 2010). 21. S. Yeh et al., Keio J Med 48, 87 (Jun, 1999). 22. Q. Wang et al., Cell 138, 245 (Jul 23, 2009). 23. K. F. Decker et al., Nucleic acids research 40, 10765 (Nov, 2012). 24. J. D. Wilson, C. Roehrborn, The Journal of clinical endocrinology and metabolism 84,
4324 (Dec, 1999). 25. J. Gerhardt et al., Am J Pathol 180, 848 (Feb, 2012). 26. C. Hughes, A. Murphy, C. Martin, O. Sheils, J. O'Leary, Journal of clinical pathology 58,
673 (Jul, 2005). 27. M. N. Middleman, R. M. Lush, W. D. Figg, Pharmacotherapy 16, 376 (May-Jun, 1996). 28. T. Kobayashi, T. Inoue, T. Kamba, O. Ogawa, Int J Mol Sci 14, 15615 (2013). 29. J. H. Taube, K. Allton, S. A. Duncan, L. Shen, M. C. Barton, J Biol Chem 285, 16135
(May 21, 2010). 30. G. S. Prins, O. Putz, Differentiation 76, 641 (Jul, 2008).
65

31. S. W. Hayward, G. R. Cunha, R. Dahiya, Ann N Y Acad Sci 784, 50 (Apr 30, 1996). 32. W. Kopachik, S. W. Hayward, G. R. Cunha, Dev Dyn 211, 131 (Feb, 1998). 33. G. R. Cunha, L. W. Chung, J Steroid Biochem 14, 1317 (Dec, 1981). 34. J. D. Wilson, Endocrinology and metabolism clinics of North America 40, 577 (Sep,
2011). 35. L. E. Pascal et al., Angiogenesis 14, 331 (Sep, 2011). 36. L. E. Pascal et al., PLoS One, (2013). 37. J. Ai et al., Oncogene, (May 27, 2013). 38. J. Mirosevich et al., Prostate 66, 1013 (Jul 1, 2006). 39. G. M. Bernardo, R. A. Keri, Biosci Rep 32, 113 (Apr 1, 2012). 40. F. Simone, R. T. Luo, P. E. Polak, J. J. Kaberlein, M. J. Thirman, Blood 101, 2355 (Mar
15, 2003). 41. T. Ito, K. Saso, N. Arimitsu, K. Sekimizu, Biochem Biophys Res Commun 363, 603 (Nov
23, 2007). 42. W. Xiao, F. Jiang, Z. Wang, Prostate 66, 1 (Jan 1, 2006). 43. N. Dephoure et al., Proc Natl Acad Sci U S A 105, 10762 (Aug 5, 2008). 44. Z. Luo, C. Lin, A. Shilatifard, Nat Rev Mol Cell Biol 13, 543 (Sep, 2012). 45. F. Jiang, J. Ai, W. Xiao, Z. Wang, Cancer Lett 253, 265 (Aug 18, 2007). 46. M. Li et al., Dev Dyn 228, 273 (Oct, 2003). 47. D. Maurus, C. Heligon, A. Burger-Schwarzler, A. W. Brandli, M. Kuhl, The EMBO
journal 24, 1181 (Mar 23, 2005). 48. J. X. Liu, B. Hu, Y. Wang, J. F. Gui, W. Xiao, J Biol Chem 284, 16679 (Jun 12, 2009). 49. X. Wan et al., PLoS One 5, e9118 (2010). 50. S. A. Shell, K. Martincic, J. Tran, C. Milcarek, J Immunol 179, 7663 (Dec 1, 2007). 51. K. Martincic, S. A. Alkan, A. Cheatle, L. Borghesi, C. Milcarek, Nature immunology 10,
1102 (Oct, 2009). 52. R. T. Luo et al., Mol Cell Biol 21, 5678 (Aug, 2001). 53. S. E. Kong, C. A. Banks, A. Shilatifard, J. W. Conaway, R. C. Conaway, Proc Natl Acad
Sci U S A 102, 10094 (Jul 19, 2005). 54. D. Biswas et al., Proc Natl Acad Sci U S A 108, 15751 (Sep 20, 2011). 55. E. R. Smith et al., Molecular cell 44, 954 (Dec 23, 2011). 56. H. Takahashi et al., Cell 146, 92 (Jul 8, 2011). 57. W. Xiao et al., Cancer Res 69, 2599 (Mar 15, 2009). 58. J. Zhou et al., J Biol Chem 284, 19142 (Jul 10, 2009). 59. F. Su, L. E. Pascal, W. Xiao, Z. Wang, Oncogene 29, 421 (Jan 21, 2010). 60. F. Zhuang et al., DNA Cell Biol 27, 649 (Dec, 2008). 61. F. Xiao, J. S. Zhang, J. Y. Zhao, D. Wu, International journal of ophthalmology 5, 570
(2012). 62. S. Mourgues et al., Proc Natl Acad Sci U S A 110, 17927 (Oct 29, 2013). 63. R. H. Costa, D. R. Grayson, J. E. Darnell, Jr., Mol Cell Biol 9, 1415 (Apr, 1989). 64. E. Lai et al., Genes Dev 4, 1427 (Aug, 1990). 65. E. Lai, V. R. Prezioso, W. F. Tao, W. S. Chen, J. E. Darnell, Jr., Genes Dev 5, 416 (Mar,
1991). 66. K. H. Kaestner, Curr Opin Genet Dev 20, 527 (Oct, 2010). 67. D. Q. Shih, M. A. Navas, S. Kuwajima, S. A. Duncan, M. Stoffel, Proc Natl Acad Sci U
S A 96, 10152 (Aug 31, 1999).
66

68. A. A. Serandour et al., Genome Res 21, 555 (Apr, 2011). 69. M. A. Augello, T. E. Hickey, K. E. Knudsen, The EMBO journal 30, 3885 (Oct 5, 2011). 70. C. Zhang et al., Cancer Res 71, 6738 (Nov 1, 2011). 71. R. K. Jain, R. J. Mehta, H. Nakshatri, M. T. Idrees, S. S. Badve, Histopathology 58, 766
(Apr, 2011). 72. D. D. Shaye, I. Greenwald, PLoS One 6, e20085 (2011). 73. L. Timmons, D. L. Court, A. Fire, Gene 263, 103 (Jan 24, 2001). 74. J. M. Perez-Perez, H. Candela, J. L. Micol, Trends in genetics : TIG 25, 368 (Aug, 2009). 75. D. Fay, WormBook : the online review of C. elegans biology, 1 (2006). 76. M. Azzaria, B. Goszczynski, M. A. Chung, J. M. Kalb, J. D. McGhee, Dev Biol 178, 289
(Sep 15, 1996). 77. S. E. Mango, E. J. Lambie, J. Kimble, Development 120, 3019 (Oct, 1994). 78. J. R. Friedman, K. H. Kaestner, Cell Mol Life Sci 63, 2317 (Oct, 2006). 79. J. Mirosevich, N. Gao, R. J. Matusik, Prostate 62, 339 (Mar 1, 2005). 80. T. Stiernagle, in WormBook T. C. e. R. Community, Ed. (WormBook). 81. J. Ahringer (ed.), in WormBook T. C. e. R. Community, Ed. (WormBook). 82. R. S. Kamath et al., Nature 421, 231 (Jan 16, 2003). 83. J. Hahn et al., Prostate 67, 146 (Feb 1, 2007). 84. K. J. O'Malley et al., Prostate 69, 1716 (Dec 1, 2009). 85. V. Besnard, S. E. Wert, W. M. Hull, J. A. Whitsett, Gene Expr Patterns 5, 193 (Dec,
2004). 86. H. J. Lee, M. Hwang, S. Chattopadhyay, H. S. Choi, K. Lee, Biochem Biophys Res
Commun 367, 481 (Mar 7, 2008). 87. B. Sahu et al., Cancer Res 73, 1570 (Mar 1, 2013). 88. N. Bruchovsky, B. Lesser, E. Van Doorn, S. Craven, Vitamins and hormones 33, 61
(1975). 89. Z. Wang, R. Tufts, R. Haleem, X. Cai, Proc Natl Acad Sci U S A 94, 12999 (Nov 25,
1997). 90. J. L. Robinson et al., Oncogene, (Dec 2, 2013). 91. K. S. Zaret, J. S. Carroll, Genes Dev 25, 2227 (Nov 1, 2011). 92. G. Chen, A. J. Courey, Gene 249, 1 (May 16, 2000). 93. Z. Chen, X. Liu, Z. Mei, Z. Wang, W. Xiao, Mol Cell Biol, (Jan 13, 2014). 94. F. Wang, C. B. Marshall, M. Ikura, Cell Mol Life Sci 70, 3989 (Nov, 2013). 95. Z. Chen et al., The EMBO journal 30, 2405 (Jun 15, 2011). 96. S. A. Ansari, R. H. Morse, Cell Mol Life Sci 70, 2743 (Aug, 2013). 97. C. Peraldo-Neia et al., BMC Cancer 11, 31 (2011). 98. M. R. Mohamed, G. McFadden, Cell Cycle 8, 3125 (Oct 1, 2009). 99. L. Liu et al., Prostate 70, 797 (May 15, 2010). 100. Z. Culig, F. R. Santer, Cancer metastasis reviews, (Jan 3, 2014). 101. S. Wen, Y. Niu, S. O. Lee, C. Chang, Cancer treatment reviews 40, 31 (Feb, 2014).
67