eapp master plan 2014 - ea energianalyse the power systems of the eapp member countries in balmorel...
TRANSCRIPT
February 2014
EASTERN AFRICA POWER POOL
(EAPP)
EAPP REGIONAL
POWER SYSTEM
MASTER PLAN
VOLUME II: DATA
REPORT
2 | EAPP Master Plan 2014 - Volume II: Data report - 19-12-2014
Published by:
EAPP, Eastern Africa Power Pool
Kirkos sub city, House No.513
P.O Box 100644
Addis Ababa, Ethiopia
Ea Energy Analyses
Frederiksholms Kanal 4, 3. th.
1220 Copenhagen K, Denmark
Energinet.dk
Tonne Kjærsvej 65
7000 Fredericia, Denmark
3 | EAPP Master Plan 2014 - Volume II: Data report - 19-12-2014
Contents
1 Introduction and background ...............................................................4
2 The BALMOREL model .........................................................................5
2.1 Investment approach ......................................................................... 5
2.2 Time resolution ................................................................................... 6
2.3 Geographical scope ............................................................................ 6
2.4 Hydro .................................................................................................. 8
3 General assumptions ......................................................................... 10
3.1 Technology catalogue ....................................................................... 10
3.2 Fuel prices ......................................................................................... 15
3.3 Levelized cost of energy overview .................................................... 17
3.4 Electricity demand forecasts ............................................................ 20
4 Interconnectors ................................................................................. 23
4.1 Existing and committed interconnectors ......................................... 23
4.2 Interconnector investment costs ..................................................... 26
5 Country-specific data ......................................................................... 29
5.1 Burundi ............................................................................................. 30
5.2 DRC ................................................................................................... 32
5.3 Egypt ................................................................................................. 36
5.4 Ethiopia ............................................................................................. 41
5.5 Kenya ................................................................................................ 45
5.6 Rwanda ............................................................................................. 49
5.7 Sudan ................................................................................................ 52
5.8 South Sudan ...................................................................................... 54
5.9 Tanzania ............................................................................................ 56
5.10 Uganda .............................................................................................. 59
5.11 Djibouti ............................................................................................. 62
5.12 Libya .................................................................................................. 64
6 References ........................................................................................ 66
4 | EAPP Master Plan 2014 - Volume II: Data report - 19-12-2014
1 Introduction and background
This data report is part of the Eastern Africa Power Pool (EAPP) 2014 Master
Plan. This report contains detailed information on the data used for modelling
of the power systems of the EAPP member countries in BALMOREL in relation
to the process of EAPP Master Plan as of 2014.
In order to identify and quantify the potential benefits of regional cooperation
in terms of transmission and generation within the EAPP member (and rele-
vant adjacent) countries, modelling of the power systems of the EAPP mem-
ber countries is being carried out based on the concept of ‘least-cost develop-
ment planning’. A number of scenarios is set up in consultation with the EAPP
and the member countries’ utilities in order to illustrate the economic conse-
quences of different possible future strategies.
The BALMOREL model is used to simulate the scenarios of the EAPP Master
Plan. The model area includes all of the EAPP member countries (Burundi, Dji-
bouti, DRC, Egypt, Ethiopia, Kenya, Libya, Rwanda, Sudan, South Sudan, Tanza-
nia and Uganda).
Data from the 2011 Master Plan has been used as a starting point. Thorough
data updating and verification process in association with the EAPP and the lo-
cal utilities has been carried out prior to data input into BALMOREL. This pro-
cess includes data collection tours as well as midway workshops to all EAPP
member countries except Libya.
All cost data in this report are USD 2012 real terms. The results are presented
in USD 2013 real terms using a conversion rate of 1.015.
Approach
5 | EAPP Master Plan 2014 - Volume II: Data report - 19-12-2014
2 The BALMOREL model
The power system analyses are carried out with the BALMOREL model, which
is a least-cost dispatch power system model. The model is based on a detailed
technical representation of the existing power system; all power generation
plants are represented on a unit basis as well as the interconnected transmis-
sion grid.
The output is a least-cost optimisation of all the production and transmission
units represented in the model. In addition to simulating least-cost dispatch of
generation units, the model simultaneously allows investments to be made in
different new generation units (hydro, coal, gas, wind, biomass etc.) as well as
in new interconnectors.
2.1 Investment approach
The BALMOREL model is myopic in its investment approach, in the sense that
it does not explicitly consider revenues beyond the year of installation. This
means that investments are undertaken in a given year if the annual revenue
requirement (ARR) in that year is satisfied by the market.
A balanced risk and reward characteristic of the market are assumed, which
means that the same ARR is applied to most technologies, specifically 0.1175,
which is equivalent to 10 % internal rate of return for 20 years. This rate
should reflect an investor’s perspective. Hydro and nuclear projects, due to
their longer economic and technical lifetime, have been assigned an ARR of
0.1009 equivalent to 10% internal rate for 50 years. Sensitivity analyses are
carried out for this parameter with parameter variations on 8% and 12 %.
In practice, this rate is contingent on the risks and rewards of the market,
which may be different from technology to technology. For instance, unless
there is a possibility to hedge the risk without too high risk premium, capital
intensive investments such as hydro or nuclear power investments may be
considered more risky by the potential investor (and higher return required as
a result).
It should be stressed that the recommended socio-economic discount rate in
many countries is significantly lower than the 10 % rate applied in the present
study (Germany: 2.2 %, Sweden and Norway: 4 %, Denmark and Finland: 5 %,

6 | EAPP Master Plan 2014 - Volume II: Data report - 19-12-2014
UK: 1.0-3.5 %, EU: 3.5-5.5 %1). Applying a lower discount rate would favour
capital intensive technologies like wind power, nuclear power and solar power
as opposed to for example gas power plants. It is considered relevant to apply
a relatively high discount rate in this study due to the challenge of securing
capital in East Africa.
2.2 Time resolution
The model is set up to analyse 2015 and the period 2020-2040 in five year in-
tervals.
To limit the computing time not all hours of the year are included in the simu-
lation. The yearly time resolution is set to 168x5 time steps, which is a total of
840 time steps. The 168 steps represent all hours of a week and the 5 are the
number of selected weeks. The following weeks are chosen to represent a
year in the model: week 1, 11, 21, 31 and 41. The chosen weeks are important
in relation to the data profiles included in the model. This relates to electricity
demand, hydro inflow, wind and solar profiles. Only the profile data of the
above weeks are included in the simulation and it is important to carefully se-
lect the weeks so they represent e.g. the different hydro inflow and electricity
demand situations of the year.
2.3 Geographical scope
The model contains data of the electricity systems of the 10 EAPP countries as
well South Sudan and Djibouti. The map below illustrates the existing inter-
connected power system of the EAPP region.
1 European Commission (2008): Guide to Cost-Benefit Analysis of investment Projects; Concito (2011): Den samfundsøkonomiske kalkulationsrente – fakta og etik
7 | EAPP Master Plan 2014 - Volume II: Data report - 19-12-2014
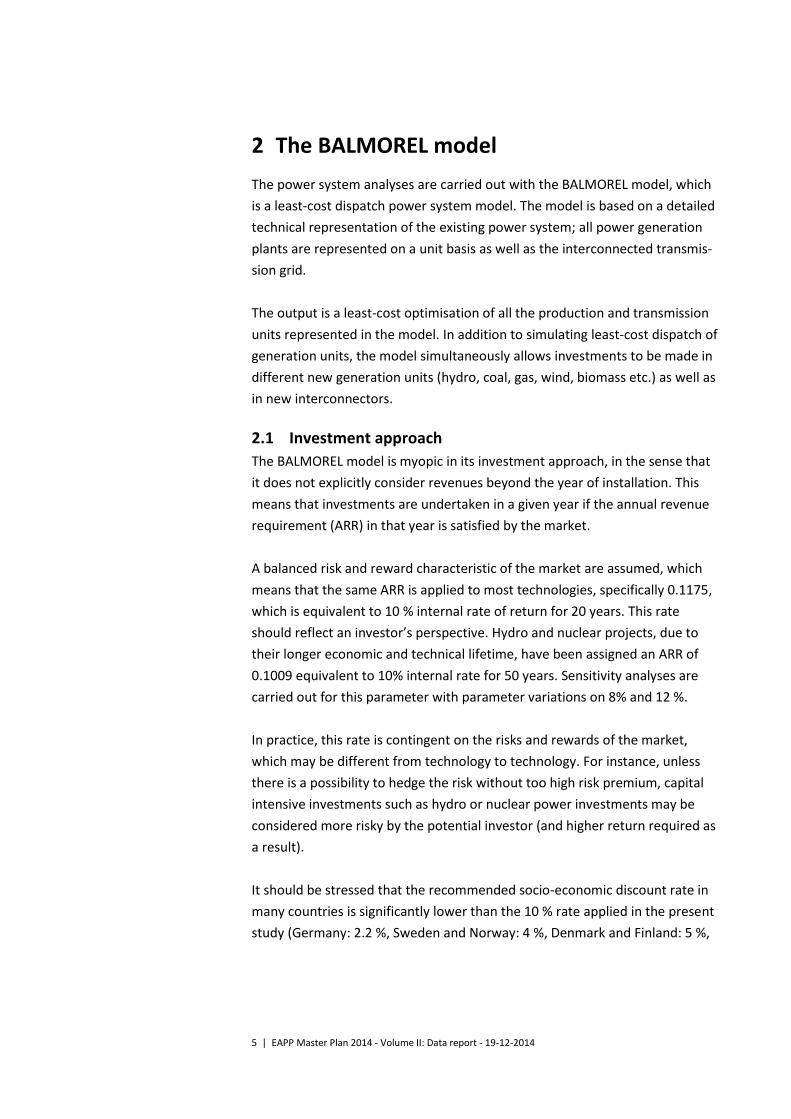
Figure 1. Current and committed (before 2020) interconnectors in EAPP (MW). Note that an ad-ditional 1000 MW line will connect the Western and Southern DRC by 2025 and a 500 MW will connect DRC South and East in 2025.
Each country is constituted of one or more regions while each region contains
one or more areas. Any area must be included in exactly one region, and any
region must be included in exactly one country. The areas are the building
blocks with respect to the geographical dimension. Thus, for instance all gen-
eration and generation capacities are described at the level of areas, and so
are all aspects of hydro inflow and resources.
8 | EAPP Master Plan 2014 - Volume II: Data report - 19-12-2014
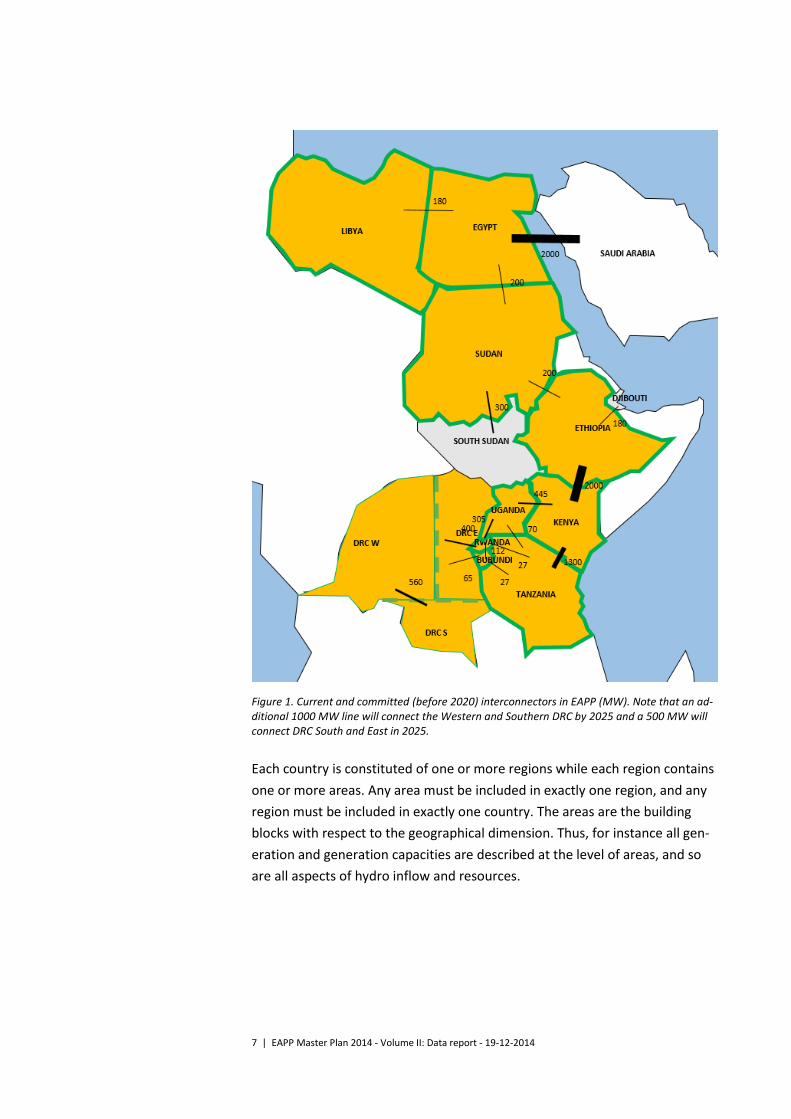
Figure 2: The geographical entities of the BALMOREL model.
Electricity balances are given on a regional basis. Hence, for each region an
electricity balance must be fulfilled but electricity may be exchanged between
regions. Hence the transmission, and its constraints, losses and costs, are the
motivation for the concept of regions. A country is comprised of one or more
regions.
The country does not have any generation or consumption apart from that
which follows as the sum over the regions in the country. However, a number
of characteristics may be identical for all entities (e.g. fuel prices) in a country.
A country is constituted of more than one region when needed to represent
bottlenecks in the electricity transmission system within the country. In the
model only DRC is divided into several regions. This is done to reflect that the
Western, Southern and Eastern DRC centralised power systems are not yet
connected.
2.4 Hydro
Hydropower production potential is denoted as average yearly energy output
(defined in the model in full-load hours), and each hydro plant has its own ge-
ographic entity with its own set of full load hours. This is the same for existing,
committed and candidate hydro plants. There are two types of hydro power
plants – hydro run-of-river plants and hydro reservoir plants. Run-of-river
plants do not have any reservoir capacity, and therefore have to generate ac-
cording to the water inflow to the plant. Reservoir plants can store the water
and the model will use this functionality to maximise the value of the water.
Both run-of-river and reservoir hydro plants are assigned with a hydro inflow
profile in the model. This profile will correspond to the generation profile of a
Countries
Regions
Areas
Electrical
transmission
Region Region

9 | EAPP Master Plan 2014 - Volume II: Data report - 19-12-2014
run-of-river plant, since the water has to be used when available for this tech-
nology type. For a reservoir plant this profile will tell the model how water in-
flow to the reservoir is throughout the year.
The hydro profiles in the model are from the EAPP 2011 Master Plan except
for Ethiopia that has provided updated profiles for their entire system. The
Ethiopian profiles are from the study “Ethiopian Power System Expansion
Master Plan Study - Interim Report - Volume 3 - Generation Planning, 2013”.
10 | EAPP Master Plan 2014 - Volume II: Data report - 19-12-2014
3 General assumptions
The general assumptions such as technology catalogue, fuel prices and as-
sumptions regarding electricity demand forecast are presented in this chap-
ter.
3.1 Technology catalogue
The BALMOREL model has a technology catalogue with a set of power genera-
tion technologies that it can invest in according to the input data. The invest-
ment module allows the model to invest in a range of different technologies
including (among others) coal power, gas power (combined cycle plants and gas
engines), solar PV and wind power.
The technology catalogue applied in this study is based on data from the Inter-
national Energy Agency (IEA) and their World Energy Outlook 2013. The IEA cat-
alogue is regional, which means that the cost data is based on a review of the
latest country data available for the African continent. The IEA also has an evo-
lution in assumptions in the projection period towards 2035. This means that
learning curves are applied depending on the development stage of the tech-
nology. Solar PV is e.g. expected to develop more in efficiency and investment
costs than e.g. gas or steam turbines.
It should be noted that the investment cost projections for solar PV technology
of IEA WEO 2013 (maintained in WEO 2014) used in the current study represent
medium cost reduction perspective. Alternative sources (e.g. OECD / IEA Tech-
nology Roadmap: Solar Photovoltaic Energy, 2014 edition) project significantly
higher cost reduction pathways.
Technical and economic data for the power generation technologies that the
model may invest in can be viewed in the table below. The technology assump-
tions develop from now to 2035, which means that the costs and efficiencies
are assumed to develop depending on the learning curves of the specific tech-
nologies. This development can be seen in the table below. Generally the tech-
nologies develop to have higher efficiencies and lower investments costs.
International Energy
Agency
Technology catalogue

11 | EAPP Master Plan 2014 - Volume II: Data report - 19-12-2014
Technology type Available
(Year)
CAPEX incl. IDC
(M$/MWel.)
Fixed O&M ($1000/MWel.)
Variable O&M
($/MWhel.)
Efficiency (%)
Technical lifetime (Years)
Steam Coal - Subcritical 2020-2034 1.8 45 3.8 35% 30
Steam Coal - Subcritical 2035- 1.8 45 3.8 35% 30
Steam Coal - Supercritical 2020-2034 2.2 63 5.3 40% 30
Steam Coal - Supercritical 2035- 2.2 63 5.3 40% 30
CCGT 2020-2034 0.8 25 2.1 59% 30
CCGT 2035- 0.8 25 2.1 61% 30
Gas turbine 2020-2034 0.4 20 1.7 38% 30
Gas turbine 2035- 0.4 20 1.7 40% 30
Geothermal* 2020- 4.3 43 3.1 30
Medium Speed Diesel (MSD) Engine 2020- 1.6 22 1.8 45% 30
Low Speed Diesel (LSD) Engine 2020- 2.4 10 0.8 46% 30
Nuclear** 2020- 5.7 140 0.0 33% 60
Solar PV*** 2020-2034 1.9 24 2.0 25
Solar PV*** 2035- 1.5 23 1.9 25
Wind - onshore 2020-2034 1.5 22 3.7 20
Wind - onshore 2035- 1.4 21 3.5 20
Table 1: Power generation technology catalogue. Efficiency is net lower heating value. For nu-clear power all O&M costs are assumed to be fixed. (Costs in USD 2012 real terms). * Geothermal only available as an investment option for Ethiopia and Kenya, limited by the re-source availability. Capital costs derived from “Republic of Kenya Updated LCPDP 2013-2033” (May 2013). ** Nuclear only available as an investment option for Egypt and Kenya, constrained by the de-velopment limits set by the respective National Master Plans. *** Solar PV investment cost projections follow IEA WEO 2013 (and 2014). Alternative perspec-tives exist suggesting significantly higher cost reductions in the future.
The opportunities to invest in the different technologies are not uniform
across the region, for example because there are differences in the availability
of resources in the different countries, e.g. access to natural gas. Political
opinions about certain technologies like nuclear power and coal power also
influence their future role in some countries.
The capital costs (CAPEX) include engineering and other pre-construction
costs such as environmental assessments. The CAPEX together with the fixed
annual and variable costs cover the operation of the plant in its technical life-
time, which e.g. for a CCGT is 30 years. Regarding grid connection costs these
are considered on a project basis for candidate plants, which is the case for all
hydro plants etc. This generic technology catalogue also includes grid connec-
tion costs, but assumes that power generation is built close to the existing
grid.
The load factor is specifically defined for each single hydro power plant. In
BALMOREL this is given by yearly full load hours. For candidate plants this
data will come from the feasibility studies while for the existing plants it will
12 | EAPP Master Plan 2014 - Volume II: Data report - 19-12-2014
be based on the average yearly energy for a historic period. Thermal power
plants are considered to have a yearly availability of 90 %.
Interests during construction (IDC) are of importance when evaluating the
capital costs of one technology option to another. Units with a short construc-
tion phase pay less IDC’s than plants with longer construction time.
Most capital cost data on power generation, also in the IEA catalogue, are
given in overnight costs, meaning that no IDC are considered. To ensure that
the technologies are equally considered by the model the IDC costs are there-
fore added to the capital costs.
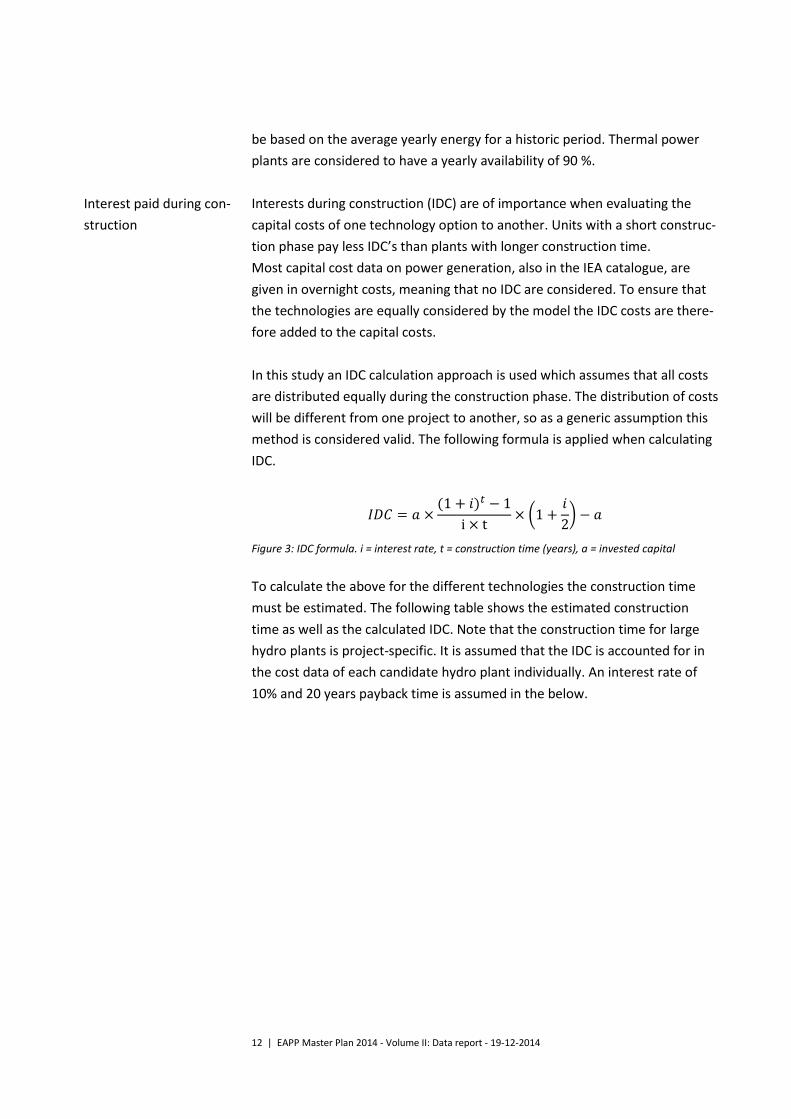
In this study an IDC calculation approach is used which assumes that all costs
are distributed equally during the construction phase. The distribution of costs
will be different from one project to another, so as a generic assumption this
method is considered valid. The following formula is applied when calculating
IDC.
𝐼𝐷𝐶 = 𝑎 ×(1 + 𝑖)𝑡 − 1
i × t× (1 +
𝑖
2) − 𝑎
Figure 3: IDC formula. i = interest rate, t = construction time (years), a = invested capital
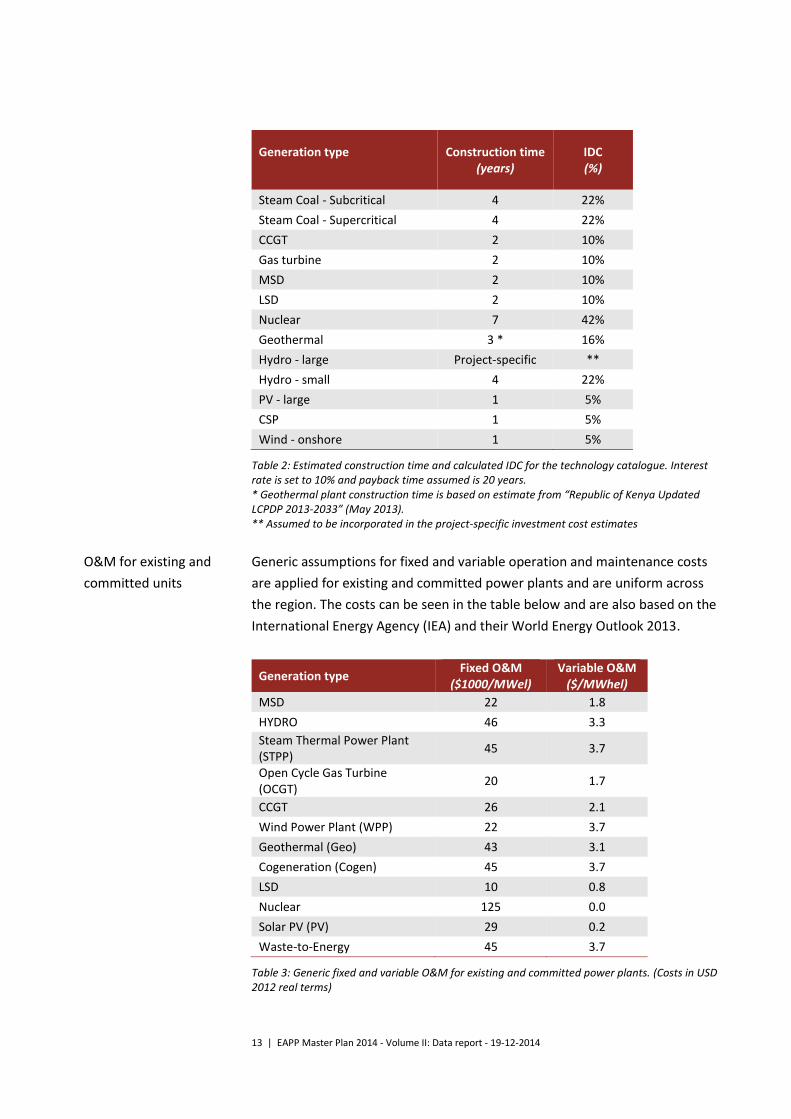
To calculate the above for the different technologies the construction time
must be estimated. The following table shows the estimated construction
time as well as the calculated IDC. Note that the construction time for large
hydro plants is project-specific. It is assumed that the IDC is accounted for in
the cost data of each candidate hydro plant individually. An interest rate of
10% and 20 years payback time is assumed in the below.
Interest paid during con-
struction
13 | EAPP Master Plan 2014 - Volume II: Data report - 19-12-2014
Generation type
Construction time (years)
IDC (%)
Steam Coal - Subcritical 4 22%
Steam Coal - Supercritical 4 22%
CCGT 2 10%
Gas turbine 2 10%
MSD 2 10%
LSD 2 10%
Nuclear 7 42%
Geothermal 3 * 16%
Hydro - large Project-specific **
Hydro - small 4 22%
PV - large 1 5%
CSP 1 5%
Wind - onshore 1 5%
Table 2: Estimated construction time and calculated IDC for the technology catalogue. Interest rate is set to 10% and payback time assumed is 20 years. * Geothermal plant construction time is based on estimate from “Republic of Kenya Updated LCPDP 2013-2033” (May 2013). ** Assumed to be incorporated in the project-specific investment cost estimates
Generic assumptions for fixed and variable operation and maintenance costs
are applied for existing and committed power plants and are uniform across
the region. The costs can be seen in the table below and are also based on the
International Energy Agency (IEA) and their World Energy Outlook 2013.
Generation type Fixed O&M
($1000/MWel) Variable O&M
($/MWhel)
MSD 22 1.8
HYDRO 46 3.3
Steam Thermal Power Plant (STPP)
45 3.7
Open Cycle Gas Turbine (OCGT)
20 1.7
CCGT 26 2.1
Wind Power Plant (WPP) 22 3.7
Geothermal (Geo) 43 3.1
Cogeneration (Cogen) 45 3.7
LSD 10 0.8
Nuclear 125 0.0
Solar PV (PV) 29 0.2
Waste-to-Energy 45 3.7
Table 3: Generic fixed and variable O&M for existing and committed power plants. (Costs in USD 2012 real terms)
O&M for existing and
committed units
14 | EAPP Master Plan 2014 - Volume II: Data report - 19-12-2014
Forced and planned outages are assumed for both existing, committed and
candidate power plants. All thermal units are set to have their net electricity
capacity derated by 10 % yearly due to planned and unplanned outages.
Wind, solar, and hydro are not set to be derated due to planned outages,
since this is assumed to take place when there is no generation on the unit.
Unplanned outages on these units are considered in their yearly energy out-
put (full load hours).
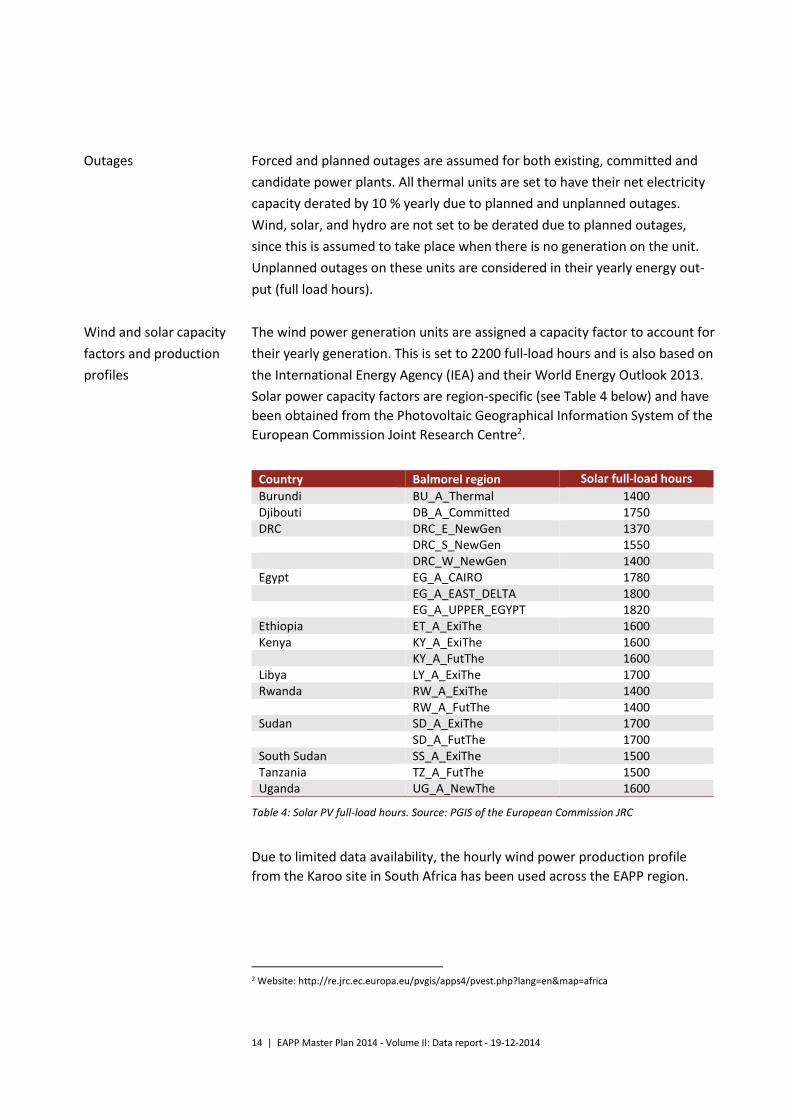
The wind power generation units are assigned a capacity factor to account for
their yearly generation. This is set to 2200 full-load hours and is also based on
the International Energy Agency (IEA) and their World Energy Outlook 2013.
Solar power capacity factors are region-specific (see Table 4 below) and have
been obtained from the Photovoltaic Geographical Information System of the
European Commission Joint Research Centre2.
Country Balmorel region Solar full-load hours
Burundi BU_A_Thermal 1400 Djibouti DB_A_Committed 1750 DRC DRC_E_NewGen 1370 DRC_S_NewGen 1550 DRC_W_NewGen 1400 Egypt EG_A_CAIRO 1780 EG_A_EAST_DELTA 1800 EG_A_UPPER_EGYPT 1820 Ethiopia ET_A_ExiThe 1600 Kenya KY_A_ExiThe 1600 KY_A_FutThe 1600 Libya LY_A_ExiThe 1700 Rwanda RW_A_ExiThe 1400 RW_A_FutThe 1400 Sudan SD_A_ExiThe 1700 SD_A_FutThe 1700 South Sudan SS_A_ExiThe 1500 Tanzania TZ_A_FutThe 1500 Uganda UG_A_NewThe 1600
Table 4: Solar PV full-load hours. Source: PGIS of the European Commission JRC
Due to limited data availability, the hourly wind power production profile
from the Karoo site in South Africa has been used across the EAPP region.
2 Website: http://re.jrc.ec.europa.eu/pvgis/apps4/pvest.php?lang=en&map=africa
Outages
Wind and solar capacity
factors and production
profiles
15 | EAPP Master Plan 2014 - Volume II: Data report - 19-12-2014
The hourly solar profiles have been obtained from the "SoDa. Integration and
exploitation of networked Solar radiation Databases for environment monitor-
ing", supported by the European Commission3. The profiles are based on the
calendar year 2005, and where the data has been missing, it has been popu-
lated with the data of the previous day (i.e. past 24 hours of hourly data). The
location of the observations has been the approximate geographical center of
each country. The exceptions are Djibouti (using Ethiopia's profile), and Bu-
rundi (using Rwanda's profile). DRC East and South both use the same profile,
for the approximate geographical centre of both areas combined. DRC West
has an individual profile. The profiles of Libya and DRC West are each shifted
by 1 hour to accommodate for the de facto time zone difference (with respect
to daylight occurrence).
3.2 Fuel prices
The fuel prices of coal and oil in this study are based on the IEA New Policies
Scenario as presented in IEA World Energy Outlook, November 2013. The
New Policies Scenario, dealing with the period 2012-2035, assumes that cur-
rent G20 low carbon agreements are implemented. A linear projection is as-
sumed for the period 2035-2040 for fuel prices.
The cost of methane gas in Rwanda (deposits in Lake Kivu) is estimated at 6.75
USD/GJ (2012 USD values), constant in real terms throughout the modelling
period.
The global efforts to combat climate change will reduce the demand for fossil
fuels at the global level compared to a development with no low-carbon regu-
lations. Therefore, according to the International Energy Agency (IEA), in-
creases in prices of coal, oil and natural gas will be relatively moderate. In
2035 the price of crude oil is projected to reach $128 per barrel in real terms
(in 2012 dollars).
The natural gas price is dependent on infrastructure bottlenecks and availabil-
ity as well as local resource availability and extraction costs. In the World En-
ergy Outlook 2013 this is illustrated by the regional price differences of natu-
ral gas. In 2012 the US gas price was 2.7 $/MBtu while the European and Japa-
nese price was 11.7 and 16.7 $/MBtu respectively. These regional price differ-
ences are caused by bottlenecks in the distribution system and costs of lique-
fying natural gas for transport by ship (LNG). The costs of liquefying and ship-
ping gas is in the range of 4-7 $/MBtu depending on shipping distance and gas
3 Website: http://www.soda-is.com/eng/services/service_invoke/gui.php?xml_descript=hc3v4_in-voke_hour_demo.xml&Submit=HC3v4hour
Natural gas price
16 | EAPP Master Plan 2014 - Volume II: Data report - 19-12-2014
price, which is a very significant cost element compared to the fuel price
alone.
In the EAPP region there are known reserves of natural gas in Libya, Egypt,
Tanzania, Ethiopia, western DRC and Rwanda. In Egypt the price of natural gas
is subsidised, which also has the only LNG terminal in the EAPP region.
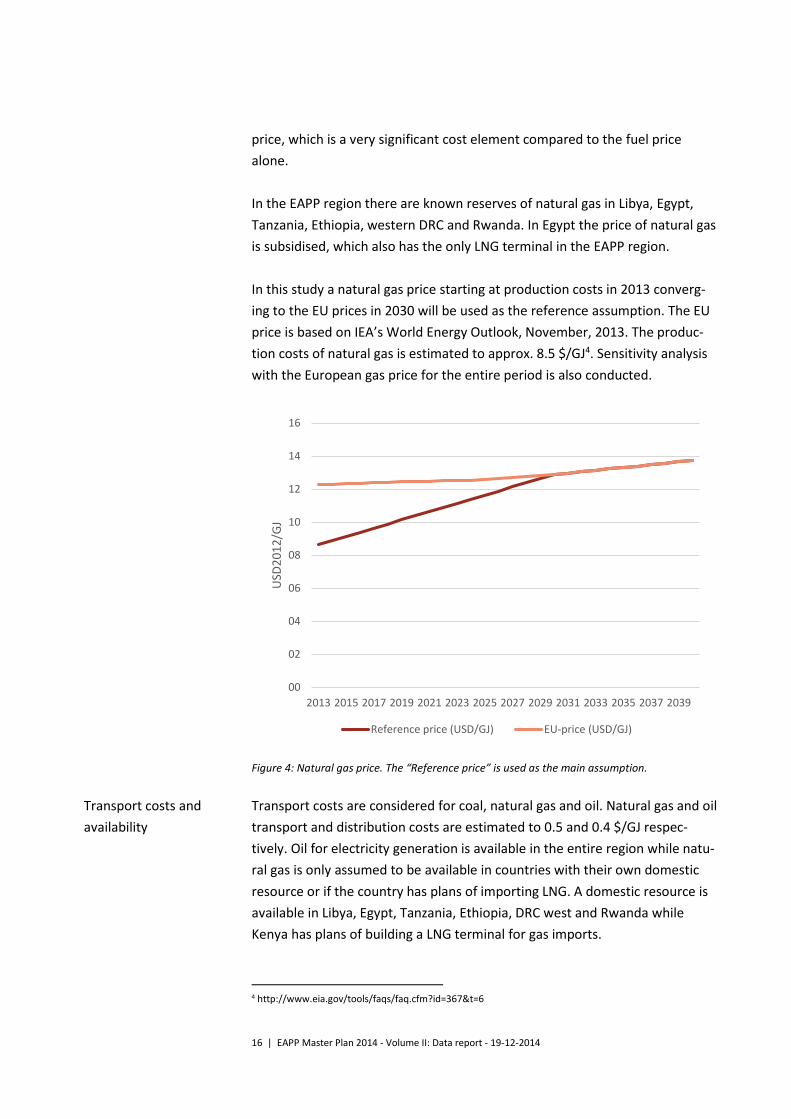
In this study a natural gas price starting at production costs in 2013 converg-
ing to the EU prices in 2030 will be used as the reference assumption. The EU
price is based on IEA’s World Energy Outlook, November, 2013. The produc-
tion costs of natural gas is estimated to approx. 8.5 $/GJ4. Sensitivity analysis
with the European gas price for the entire period is also conducted.
Figure 4: Natural gas price. The “Reference price” is used as the main assumption.
Transport costs are considered for coal, natural gas and oil. Natural gas and oil
transport and distribution costs are estimated to 0.5 and 0.4 $/GJ respec-
tively. Oil for electricity generation is available in the entire region while natu-
ral gas is only assumed to be available in countries with their own domestic
resource or if the country has plans of importing LNG. A domestic resource is
available in Libya, Egypt, Tanzania, Ethiopia, DRC west and Rwanda while
Kenya has plans of building a LNG terminal for gas imports.
4 http://www.eia.gov/tools/faqs/faq.cfm?id=367&t=6
00
02
04
06
08
10
12
14
16
2013 2015 2017 2019 2021 2023 2025 2027 2029 2031 2033 2035 2037 2039
USD
20
12
/GJ
Reference price (USD/GJ) EU-price (USD/GJ)
Transport costs and
availability
17 | EAPP Master Plan 2014 - Volume II: Data report - 19-12-2014
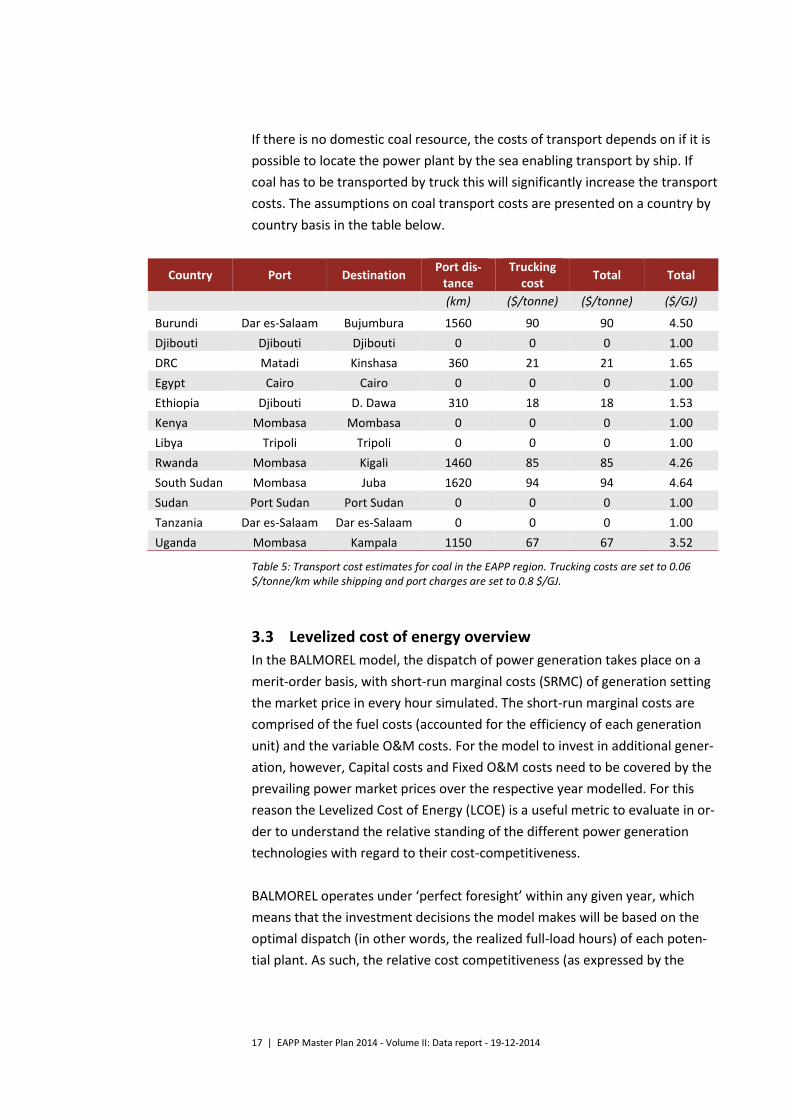
If there is no domestic coal resource, the costs of transport depends on if it is
possible to locate the power plant by the sea enabling transport by ship. If
coal has to be transported by truck this will significantly increase the transport
costs. The assumptions on coal transport costs are presented on a country by
country basis in the table below.
Country Port Destination Port dis-
tance Trucking
cost Total Total
(km) ($/tonne) ($/tonne) ($/GJ)
Burundi Dar es-Salaam Bujumbura 1560 90 90 4.50
Djibouti Djibouti Djibouti 0 0 0 1.00
DRC Matadi Kinshasa 360 21 21 1.65
Egypt Cairo Cairo 0 0 0 1.00
Ethiopia Djibouti D. Dawa 310 18 18 1.53
Kenya Mombasa Mombasa 0 0 0 1.00
Libya Tripoli Tripoli 0 0 0 1.00
Rwanda Mombasa Kigali 1460 85 85 4.26
South Sudan Mombasa Juba 1620 94 94 4.64
Sudan Port Sudan Port Sudan 0 0 0 1.00
Tanzania Dar es-Salaam Dar es-Salaam 0 0 0 1.00
Uganda Mombasa Kampala 1150 67 67 3.52
Table 5: Transport cost estimates for coal in the EAPP region. Trucking costs are set to 0.06 $/tonne/km while shipping and port charges are set to 0.8 $/GJ.
3.3 Levelized cost of energy overview
In the BALMOREL model, the dispatch of power generation takes place on a
merit-order basis, with short-run marginal costs (SRMC) of generation setting
the market price in every hour simulated. The short-run marginal costs are
comprised of the fuel costs (accounted for the efficiency of each generation
unit) and the variable O&M costs. For the model to invest in additional gener-
ation, however, Capital costs and Fixed O&M costs need to be covered by the
prevailing power market prices over the respective year modelled. For this
reason the Levelized Cost of Energy (LCOE) is a useful metric to evaluate in or-
der to understand the relative standing of the different power generation
technologies with regard to their cost-competitiveness.
BALMOREL operates under ‘perfect foresight’ within any given year, which
means that the investment decisions the model makes will be based on the
optimal dispatch (in other words, the realized full-load hours) of each poten-
tial plant. As such, the relative cost competitiveness (as expressed by the
18 | EAPP Master Plan 2014 - Volume II: Data report - 19-12-2014
LCOE) of the different technologies will vary depending on the obtainable dis-
patch of the respective plants.
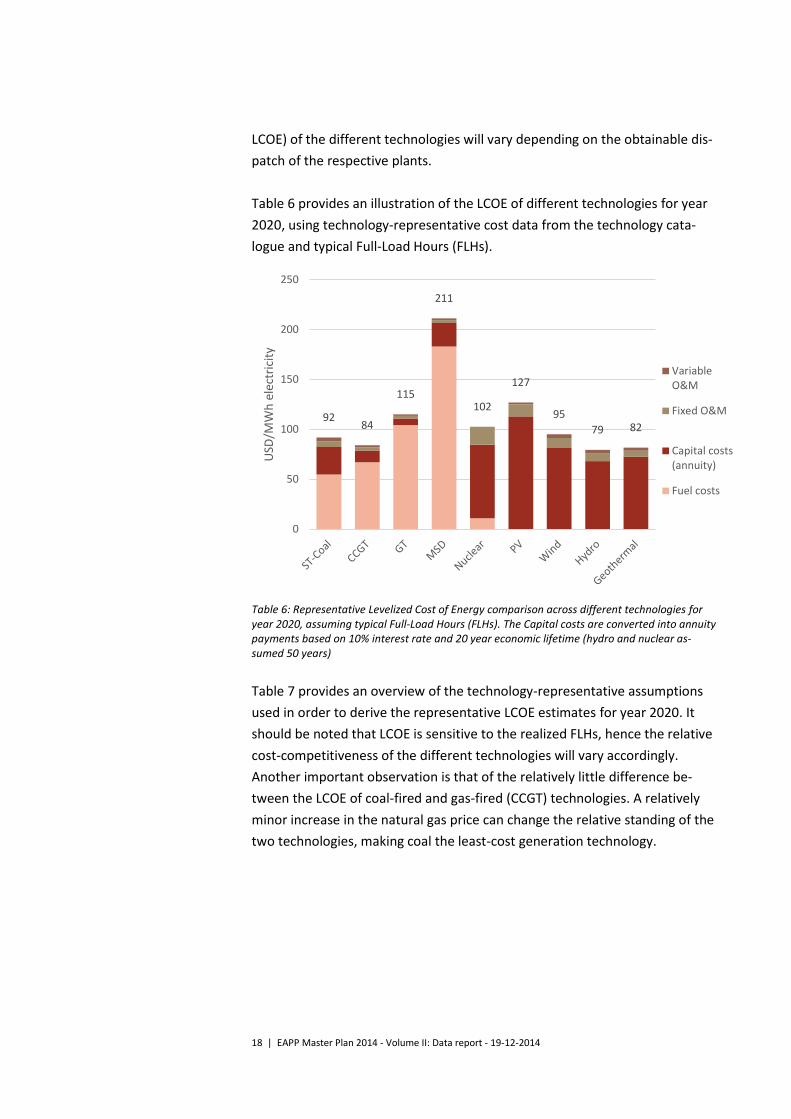
Table 6 provides an illustration of the LCOE of different technologies for year
2020, using technology-representative cost data from the technology cata-
logue and typical Full-Load Hours (FLHs).
Table 6: Representative Levelized Cost of Energy comparison across different technologies for year 2020, assuming typical Full-Load Hours (FLHs). The Capital costs are converted into annuity payments based on 10% interest rate and 20 year economic lifetime (hydro and nuclear as-sumed 50 years)
Table 7 provides an overview of the technology-representative assumptions
used in order to derive the representative LCOE estimates for year 2020. It
should be noted that LCOE is sensitive to the realized FLHs, hence the relative
cost-competitiveness of the different technologies will vary accordingly.
Another important observation is that of the relatively little difference be-
tween the LCOE of coal-fired and gas-fired (CCGT) technologies. A relatively
minor increase in the natural gas price can change the relative standing of the
two technologies, making coal the least-cost generation technology.
9284
115
211
102
127
95
79 82
0
50
100
150
200
250U
SD/M
Wh
ele
ctri
city
VariableO&M
Fixed O&M
Capital costs(annuity)
Fuel costs

19 | EAPP Master Plan 2014 - Volume II: Data report - 19-12-2014
Fuel type ST-Coal
CCGT GT MSD Nu-clear
PV Wind Hydro Geo
Efficiency (%) 35% 59% 38% 45% 33% * * * *
Capital costs
(mUSD/MWelectricity)
1.8 0.8 0.4 1.6 5.7 1.9 1.5 3.9 4.3
Fixed O&M
(USD/MWelectricity)
45 25 20 21.8 140 24 22 45.5 43.2
Variable O&M
(USD/MWhelectricity)
3.8 2.1 1.7 1.8 0.0 2.0 3.7 3.3 3.1
Fuel costs (USD/GJ fuel input)
5.3 11.0 11.0 22.9 1.0 0.0 0.0 0.0 0.0
FLH (Hours) 7800 7800 7800 7800 7800 2000 2200 5730 7000
Table 7: Assumptions used to derive the representative LCOE estimates for year 2020. * The efficiency (capacity factor) of these technologies is reflected in their respective Full-Load Hour (FLH) metrics
Figure 5 illustrates the LCOE of each technology in year 2020 depending on
the realized Full-Load Hours of operation. As it can be observed in the graph,
the relative cost-competitiveness of the different technologies changes de-
pending on the realized power production, making gas turbines and CCGTs
most economic for fewer operating hours (i.e. peaking units), and geothermal
and hydro – for base load, respectively. It should, however, be noted, that
technology-representative LCOE estimated are hereby presented – whereas
the LCOEs of e.g. each individual hydro project could vary substantially based
on its respective Capital costs.
Figure 5: Representative LCOE across different technologies for year 2020, depending on the re-alized FLHs. The FLHs of wind and solar PV is site dependent, but is assumed not to exceed 3000 hours.
0
100
200
300
400
500
600
700
800
1000 2000 3000 4000 5000 6000 7000 8000
LCO
E (U
SD 2
01
2 /
MW
h e
lect
rici
ty)
Full-Load Hours
ST-Coal
CCGT
GT
MSD
Nuclear
PV
Wind
Hydro
Geothermal
20 | EAPP Master Plan 2014 - Volume II: Data report - 19-12-2014
The LCOE of the different technologies – and the relative standing thereof -
will also evolve in line with the projected developments in Capital, Fuel and
O&M costs throughout the projection period (2025 – 2040) as laid out in the
technology catalogue and fuel price descriptions earlier.
A cost can be added for technologies emitting CO2, however this is not in-
cluded here.
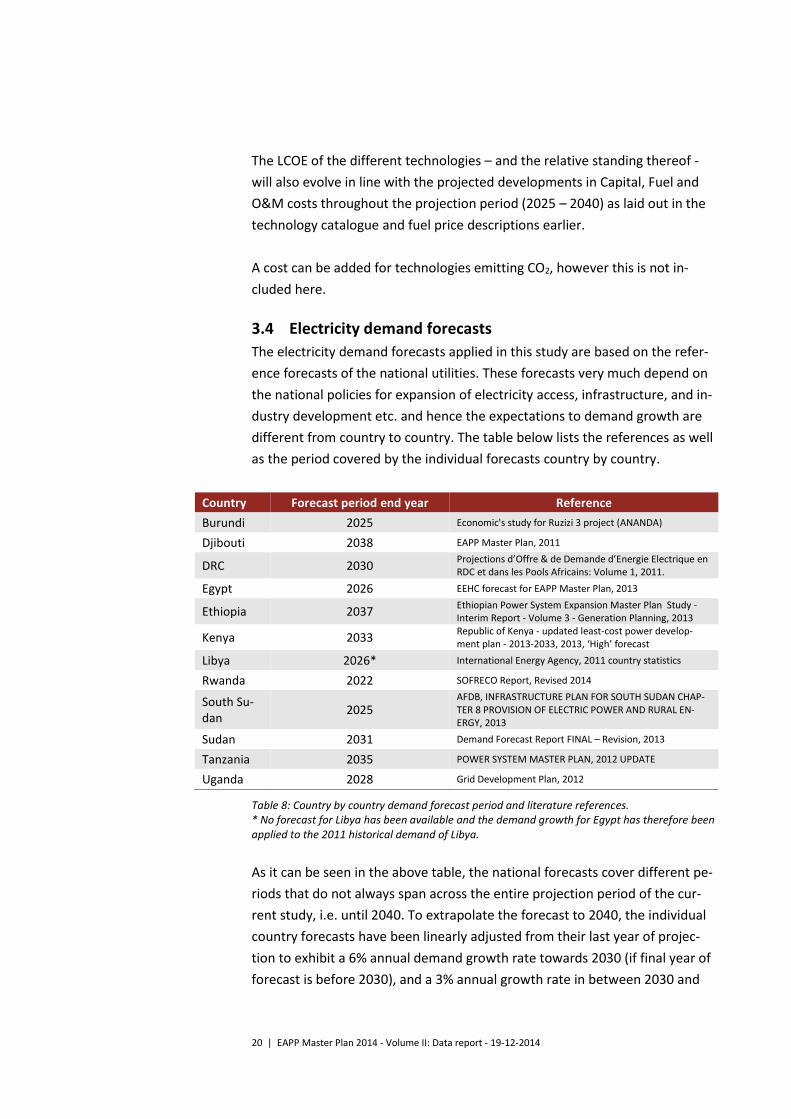
3.4 Electricity demand forecasts
The electricity demand forecasts applied in this study are based on the refer-
ence forecasts of the national utilities. These forecasts very much depend on
the national policies for expansion of electricity access, infrastructure, and in-
dustry development etc. and hence the expectations to demand growth are
different from country to country. The table below lists the references as well
as the period covered by the individual forecasts country by country.
Country Forecast period end year Reference
Burundi 2025 Economic's study for Ruzizi 3 project (ANANDA)
Djibouti 2038 EAPP Master Plan, 2011
DRC 2030 Projections d’Offre & de Demande d’Energie Electrique en RDC et dans les Pools Africains: Volume 1, 2011.
Egypt 2026 EEHC forecast for EAPP Master Plan, 2013
Ethiopia 2037 Ethiopian Power System Expansion Master Plan Study - Interim Report - Volume 3 - Generation Planning, 2013
Kenya 2033 Republic of Kenya - updated least-cost power develop-ment plan - 2013-2033, 2013, ‘High’ forecast
Libya 2026* International Energy Agency, 2011 country statistics
Rwanda 2022 SOFRECO Report, Revised 2014
South Su-dan
2025 AFDB, INFRASTRUCTURE PLAN FOR SOUTH SUDAN CHAP-TER 8 PROVISION OF ELECTRIC POWER AND RURAL EN-ERGY, 2013
Sudan 2031 Demand Forecast Report FINAL – Revision, 2013
Tanzania 2035 POWER SYSTEM MASTER PLAN, 2012 UPDATE
Uganda 2028 Grid Development Plan, 2012
Table 8: Country by country demand forecast period and literature references. * No forecast for Libya has been available and the demand growth for Egypt has therefore been applied to the 2011 historical demand of Libya.
As it can be seen in the above table, the national forecasts cover different pe-
riods that do not always span across the entire projection period of the cur-
rent study, i.e. until 2040. To extrapolate the forecast to 2040, the individual
country forecasts have been linearly adjusted from their last year of projec-
tion to exhibit a 6% annual demand growth rate towards 2030 (if final year of
forecast is before 2030), and a 3% annual growth rate in between 2030 and

21 | EAPP Master Plan 2014 - Volume II: Data report - 19-12-2014
2040. This assumption reflects the assumed decrease in demand growth rate
as electricity access is provided to a larger share of the population of the EAPP
region.
The demand forecasts are presented in Chapter 5 with country-specific data.
Demand profiles
All countries in the EAPP region are assigned their own hourly electricity de-
mand profiles when available. This reflects the differences across the region
regarding weekly and yearly demand variations. This is e.g. seasonal tempera-
ture variations which lead to yearly variations in electricity demand for cool-
ing. Time zone differences are also captured as well as the differences in
weekdays and weekends in the region. The table below illustrates the differ-
ent time zones and weekday-weekend relations in EAPP. Eastern Africa Time
(EAT) is set as the reference time, meaning that the yearly count of hours will
start in this time zone.
EAT EAT minus 1 hour EAT minus 2 hours
Ethiopia Egypt DRC West
Burundi Libya
Djibouti DRC East
Kenya DRC South
Rwanda
South Sudan
Sudan
Tanzania
Uganda
Table 9: Different time zones across the EAPP. The countries in red bold font have their weekend on Saturday-Sunday while the rest have their weekends on Friday-Saturdays.
The demand profiles used in this study are all from 2011.
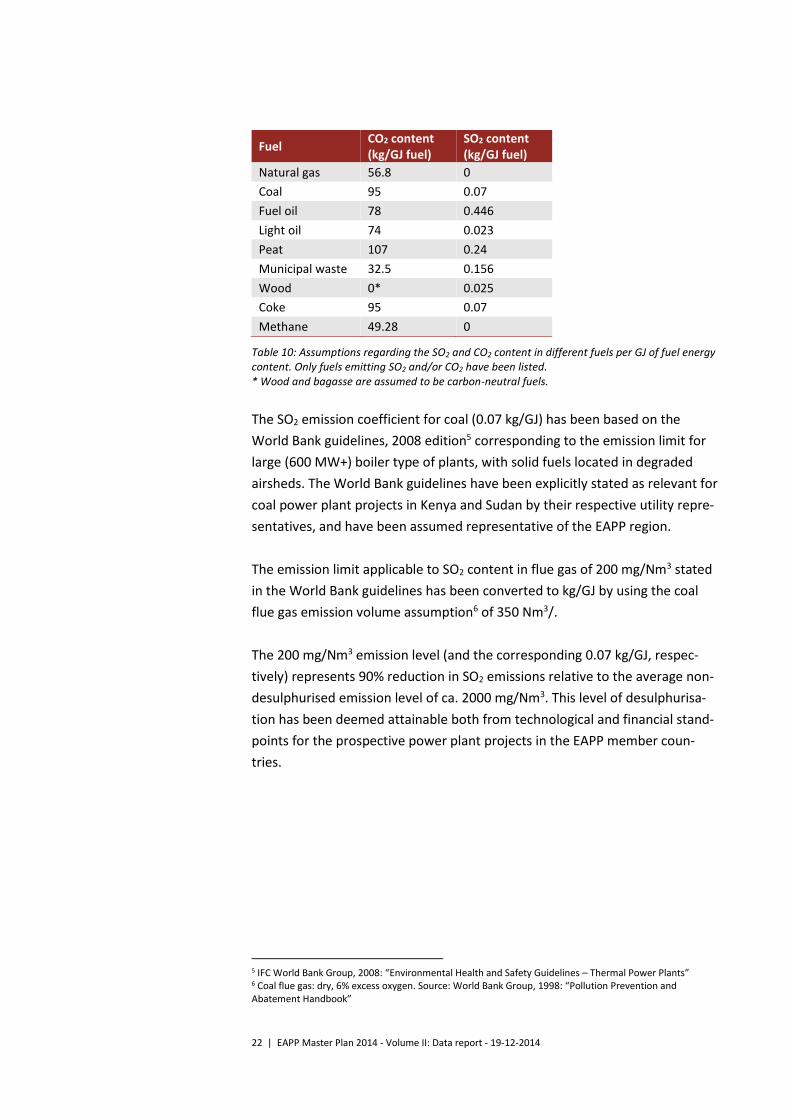
3.5 Emission factors
The level of SO2 and CO2 emissions reported in the EAPP Master Plan 2014 is
determined by the fuel use in the power production modelled in each time
period by the individual generation units represented and the corresponding
emission factors. An overview regarding the emission factors employed in the
current analysis is provided in Table 10.
22 | EAPP Master Plan 2014 - Volume II: Data report - 19-12-2014
Fuel CO2 content (kg/GJ fuel)
SO2 content (kg/GJ fuel)
Natural gas 56.8 0
Coal 95 0.07
Fuel oil 78 0.446
Light oil 74 0.023
Peat 107 0.24
Municipal waste 32.5 0.156
Wood 0* 0.025
Coke 95 0.07
Methane 49.28 0
Table 10: Assumptions regarding the SO2 and CO2 content in different fuels per GJ of fuel energy content. Only fuels emitting SO2 and/or CO2 have been listed. * Wood and bagasse are assumed to be carbon-neutral fuels.
The SO2 emission coefficient for coal (0.07 kg/GJ) has been based on the
World Bank guidelines, 2008 edition5 corresponding to the emission limit for
large (600 MW+) boiler type of plants, with solid fuels located in degraded
airsheds. The World Bank guidelines have been explicitly stated as relevant for
coal power plant projects in Kenya and Sudan by their respective utility repre-
sentatives, and have been assumed representative of the EAPP region.
The emission limit applicable to SO2 content in flue gas of 200 mg/Nm3 stated
in the World Bank guidelines has been converted to kg/GJ by using the coal
flue gas emission volume assumption6 of 350 Nm3/.
The 200 mg/Nm3 emission level (and the corresponding 0.07 kg/GJ, respec-
tively) represents 90% reduction in SO2 emissions relative to the average non-
desulphurised emission level of ca. 2000 mg/Nm3. This level of desulphurisa-
tion has been deemed attainable both from technological and financial stand-
points for the prospective power plant projects in the EAPP member coun-
tries.
5 IFC World Bank Group, 2008: “Environmental Health and Safety Guidelines – Thermal Power Plants” 6 Coal flue gas: dry, 6% excess oxygen. Source: World Bank Group, 1998: “Pollution Prevention and Abatement Handbook”

23 | EAPP Master Plan 2014 - Volume II: Data report - 19-12-2014
4 Interconnectors
The starting point of the interconnected grid within the EAPP region is all ex-
isting and committed interconnectors. In the BALMOREL model this is defined
as the net transfer capacity between the countries. The DRC is divided into
three geographical entities (the West, South, and the East), and the only exist-
ing connection is the DRC West – DRC South DC line. This grid of the existing
and committed interconnectors will serve as a starting point for the BAL-
MOREL model to make investments in interconnectors on top of the existing
grid for the period beyond 2020. It is therefore of importance to define the
existing and committed interconnectors as well as the costs for the develop-
ment of the grid for the period 2020 to 2040.
4.1 Existing and committed interconnectors
Committed interconnectors are projects that are under construction or pro-
jects that are decided and financed. The table below shows a list of existing
and committed interconnectors. These committed interconnection projects
and their net transfer capacities will be considered as firm capacity just as ex-
isting interconnectors.
As mentioned above DRC is divided into three region to reflect that not all of
the grids are currently not connected. The Western and Southern grids will be
further connected in 2025 by a 1000 MW AC line. Construction of this line will
continue to the Eastern grid of the DRC (DRC South – DRC East) with a capac-
ity of 500 MW, which is also expected to be finalised by 2025. The construc-
tion of this approx. 2500 km line will result in the Western and Southern re-
gions of the DRC also being interconnected with the EAPP region.

24 | EAPP Master Plan 2014 - Volume II: Data report - 19-12-2014
To/From From/To Existing Committed Online
(MW) (MW) (Year)
DRC Burundi 15.5 49 2018**
DRC Rwanda 100 300 2015
DRC Tanzania - -
DRC Uganda - -
DRC South DRC East - 500 2025
DRC West DRC East - -
DRC West DRC South 560 1000 2025
Egypt Sudan - 200 2016
Ethiopia Djibouti 180 -
Ethiopia Kenya - 2000 2017
Kenya Tanzania - 1300 2018***
Libya Egypt 180 -
Libya Sudan - -
Rwanda Burundi 12 100 2018**
Rwanda Tanzania - 27 2018
South Sudan DRC - -
South Sudan Ethiopia - -
South Sudan Kenya - -
South Sudan Uganda - -
Sudan Ethiopia 200 -
Sudan South Sudan 300* -
Tanzania Burundi - 27 2018
Uganda Kenya 145 300 2015
Uganda Rwanda 5 300 2015
Uganda Tanzania 70 -
Table 11: Existing and committed interconnectors (MW). “Online” is the year when the commit-ted projects are expected to be operational. * The 220 kV line is currently operated at 12 MW. ** According to data updates received from Burundi. *** The project is awaiting financial close at the time of writing this report; 2018 has been indi-cated as a realistic commissioning year
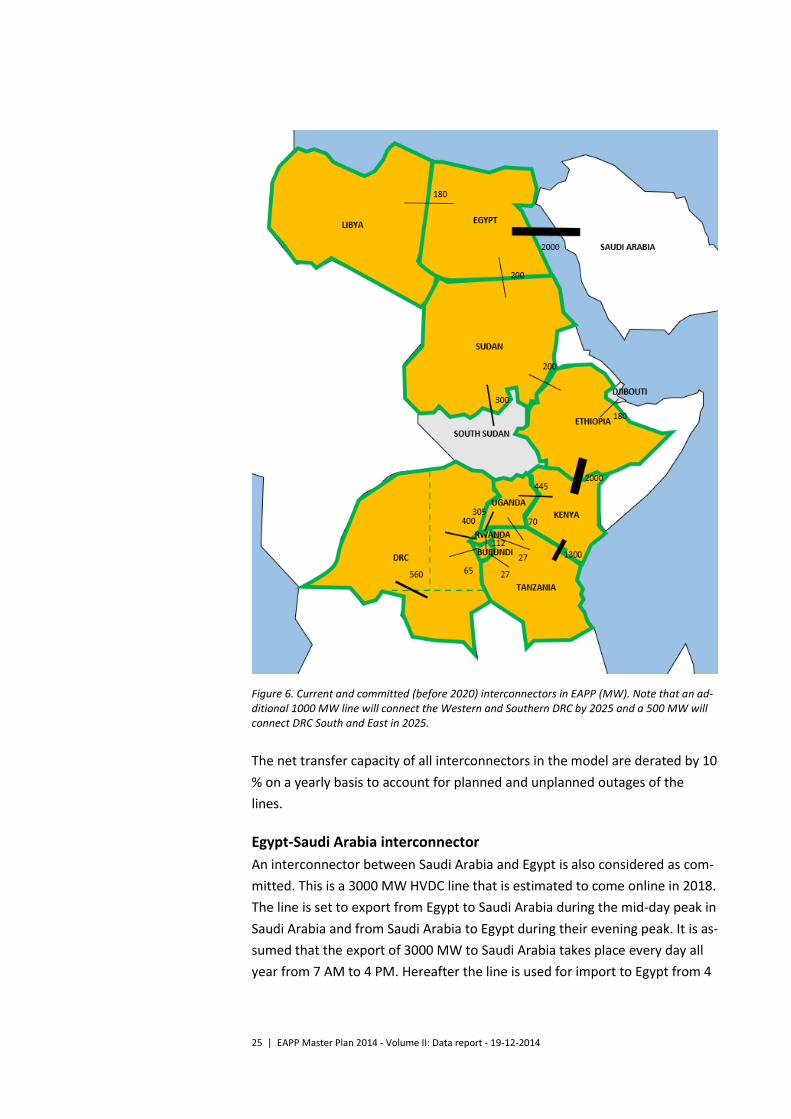
The figure below shows a map of the EAPP region with all existing and com-
mitted interconnectors as of 2020. Note that DRC is as the only country di-
vided into three regions to represent that the Western, Southern and Eastern
grid are not fully interconnected until 2025 as described in Table 7.
25 | EAPP Master Plan 2014 - Volume II: Data report - 19-12-2014
Figure 6. Current and committed (before 2020) interconnectors in EAPP (MW). Note that an ad-ditional 1000 MW line will connect the Western and Southern DRC by 2025 and a 500 MW will connect DRC South and East in 2025.
The net transfer capacity of all interconnectors in the model are derated by 10
% on a yearly basis to account for planned and unplanned outages of the
lines.
Egypt-Saudi Arabia interconnector
An interconnector between Saudi Arabia and Egypt is also considered as com-
mitted. This is a 3000 MW HVDC line that is estimated to come online in 2018.
The line is set to export from Egypt to Saudi Arabia during the mid-day peak in
Saudi Arabia and from Saudi Arabia to Egypt during their evening peak. It is as-
sumed that the export of 3000 MW to Saudi Arabia takes place every day all
year from 7 AM to 4 PM. Hereafter the line is used for import to Egypt from 4

26 | EAPP Master Plan 2014 - Volume II: Data report - 19-12-2014
PM to 12 PM, also at 3000 MW per hour. This is a 9 hours flow in each direc-
tion every day all year, corresponding to a yearly flow in each direction of 9.83
TWh, hence the yearly net balance is zero.The power system of Saudi Arabia is
not modelled, but the aforementioned import and export flows are imposed
on Egypt to simulate the planned effect of the interconnector.
4.2 Interconnector investment costs
To analyse the development of the future interconnected EAPP power system
beyond 2020 the investment costs of interconnectors is an important ele-
ment. It is preferable to use cost data from actual feasibility studies, and this
is done for all projects where the data has been available. In the absence of
cost data from feasibility studies, the investment costs need to be estimated.
Estimating interconnector costs
The cost estimates presented in Table 8 are based on the EAPP 2011 Master
Plan. These costs are considered to still be accurate. To account for inflation,
the cost data have been converted to correspond to 2012 USD in real terms.
The inflation-adjusted interconnector costs are presented in the table below:
Technology Voltage level Configuration Line cost Converter cost Fixed cost for additional AC requirements
(kV) (k$/km) (k$/MW/terminal) (M$)
HVDC 500 Bipolar 301 130.8 14.2
HVDC 600 Bipolar 316 136.3 17.4
AC 220 Double-circuit 262 - 10.9
AC 400 Double-circuit 436 - 14.2
AC 500 Double-circuit 480 - 17.4
Table 12: Assumptions for estimating interconnector capital costs (Costs in USD 2012 real terms)
Interest paid during construction (IDC) is added to the above costs based on
an estimate of the duration of the construction phase. This estimated con-
struction time can be found in the table below. As with power plants an ap-
proach calculating IDC assuming that all costs are distributed equally during
the construction phase is applied in this study.
The costs of all possible interconnectors and their technical characteristics are
presented in the table below. In BALMOREL the costs of interconnectors are
defined as costs per MW net transfer capacity and are given line by line. The
model can invest in an interconnector of any size using this input. When the
costs are estimated using the cost estimates from Table 8 above “Estimated”
is written under source in Table 9. Only the costs of 9 out of 26 possible lines

27 | EAPP Master Plan 2014 - Volume II: Data report - 19-12-2014
are estimated whereas the rest are based on actual project cost data or feasi-
bility studies.
In the table below an AC and a HVDC option for the Egypt-Sudan intercon-
nector is listed. Due to grid stability issues this AC option is limited to 1000
MW. The AC line has significantly lower costs than the HVDC alternative,
which means that the model will choose the AC option before the HVDC. If the
model increase the capacity on this border above 1000 MW it has to invest in
the HVDC technology for all capacity above 1000 MW.

To/From From/To Type Voltage Distance Capacity Construction time Total costs (incl. IDC) Costs per km Costs per MW Source
(AC/HVDC) (kV) (km) (MW) (years) (m$) (m$/km) (m$/MW)
DRC East Burundi AC 220 78 49 2 41 0.53 0.83 Burundi
DRC East Rwanda AC 220 46 300 2 89 1.93 0.30 Rwanda
DRC East Tanzania AC 220 678 300 4 229 0.34 0.76 Estimated
DRC East Uganda AC 220 352.2 600 4 134 0.38 0.22 Uganda
DRC south DRC east AC 220 841 500 5 227 0.27 0.45 DRC
DRC west DRC east AC 400 1710 1000 9 1204 0.70 1.20 Estimated
DRC west DRC south AC 400 1700 1000 9 1110 0.65 1.11 DRC
DRC west Egypt* HVDC 600 5351 3500 10 7521 1.41 2.15 AECOM & EDF
Egypt Sudan** AC 500 775 1000 4 444 0.57 0.44 Sudan
Egypt Sudan HVDC 600 1665 2000 4 1385 0.83 0.69 NBI
Ethiopia Djibuti AC 220 283 300 3 98 0.35 0.33 Estimated
Ethiopia Kenya HVDC 500 1068 2000 4 1260 1.18 0.63 AFDB
Kenya Tanzania AC 400 508 1300 3 214 0.42 0.16 NBI & Tanzania
Libya Egypt AC 220 163 300 3 62 0.38 0.21 Estimated
Libya Sudan HVDC 500 1400 1000 4 849 0.61 0.85 Estimated
Rwanda Burundi AC 220 131 300 3 55 0.42 0.18 Rwanda
Rwanda Tanzania AC 220 115 320 3 47 0.41 0.15 Estimated
South Sudan DRC east HVDC 500 583 1000 4 550 0.94 0.55 Estimated
South Sudan Ethiopia AC 220 300 300 3 101 0.34 0.34 EAPP and AFDB
South Sudan Kenya HVDC 500 540 1000 4 534 0.99 0.53 Estimated
South Sudan Uganda AC 400 200 1000 3 117 0.59 0.12 NBI
Sudan Ethiopia AC 500 550 1200 4 267 0.49 0.22 NBI***
Sudan South Sudan AC 220 400 300 4 141 0.35 0.47 Estimated
Tanzania Burundi AC 220 161 27 3 44 0.27 1.66 Burundi
Uganda Kenya AC 400/220 254 600 3 92 0.36 0.15 Uganda&Kenya
Uganda Rwanda AC 220 172 600 3 61 0.35 0.10 Uganda&Rwanda
Uganda Tanzania AC 220 271**** 400 4 172 0.63 0.43 Uganda&Tanzania
Table 13: All possible new interconnectors in the EAPP region and assumptions regarding their type, length and capital costs. (Costs in USD 2012 real terms). Nile Basin Initiative (NBI) and African Develop-ment Bank (AFDB) * A direct DC connection from the Grand Inga site (DRC West) to Egypt is only made available as an investment option in the ‘Inga North East’ scenario, and not before 2030. ** The Egypt-Sudan AC line is limited to a maximum of 1000 MW, hereafter the model will need to invest in HVDC.to increase the capacity on this border. *** The NBI cost estimate for the Ethiopia-Sudan line has been updated to reflect the pre-existing 500 kV substation as well as closer expected geographical location **** The length of the Uganda – Tanzania line has been reduced from 640 km to 271 km to reflect the currently on-going line developments. The costs per MW have been adjusted accordingly

5 Country-specific data
This section presents the BALMOREL data input for each of the countries in
the EAPP region, including data on the existing power plants, the candidate
plants, hydro data as well as the electricity demand forecasts.
The existing and candidate power plants are described by their technology
type, net fuel efficiency, installed net capacity and fixed and variable opera-
tion and maintenance costs.
Committed generation units are plants that are certain to come online within
the short-term. These are plants that are either under construction or con-
tracted units that are financed.

5.1 Burundi
Existing, committed and candidate plants
The existing Burundian power system consist of smaller diesel engines and hydro plants, which are aggregated into two groups in the table below.
Four hydro plants are committed, which will more than double the power capacity before 2020.
BALMOREL area Name Type Nominal capacity (MW el.)
Fuel Effici-ency
(net %)
CAPEX (M$/MW el.)
Fixed costs
(1000$/Mwel.)
Variable costs
($/MWh el.)
On power (Year incl.)
Retire-ment (Year incl.)
Existing BU_A_Thermal Burundi_exi_the MSD 17 (10.5)* Diesel 27% 21.80 1.82 1998 2027
BU_A_ExiHydro Burundi_exi_hy HYDRO 39 (33)* Water - ROR 45.53 3.25 2010 2050
Committed BU_A_Mpanda Mpanda HYDRO 10 Water - RESER 45.53 3.25 2018 2050
BU_A_Kabu_16 Kabu_16 HYDRO 21 (20)* Water - ROR 45.53 3.25 2018 2050
BU_A_JIJI JIJI HYDRO 33 Water - ROR 45.53 3.25 2017 2050
BU_A_Mulembwe Mulembwe HYDRO 17 Water - ROR 45.53 3.25 2019 2050
BU_A_Thermal BU_PV PV 20 Sunlight 29.38 0.24 2015 2039
BU_A_RUSUMO_FALLS RUSUMO_FALLS HYDRO 26.7 Water - ROR 45.53 3.25 2018 2050
Candidates BU_A_KAYONGOZI KAGUNUZI_06 HYDRO 8 Water - RESER 3.75 45.53 3.25 2019 2050
BU_A_RUZIZI_3 RUZIZI_3 HYDRO 48 Water - ROR 3.47 45.53 3.25 2017 2050
BU_A_Ruzibazi Ruzibazi HYDRO 17 Water - ROR 4.52 45.53 3.25 2019 2050
BU_A_KabuDiversion Kabu 23 HYDRO 14.6 Water - ROR 4.52 45.53 3.25 2019** 2050
BU_A_RUZIZI_4 RUZIZI_4 HYDRO 95.7 Water - ROR 3.00 45.53 3.25 2019** 2050
Table 14: Existing, committed and candidate power plants as represented in the model for Burundi * The capacities indicated in parentheses (in italics) correspond to the latest data updates received from Burundi. These are provided for reference only (not included in the model simulation due to data being received after the closure of the data collection period). ** Based on the latest data updates received from Burundi, both Kabu 23 and Ruzizi 4 should be available for investment 2025 and onwards. The updates are not included in the model simulation due to data being received after the closure of the data collection period.
31 | EAPP Master Plan 2014 - Volume II: Data report - 19-12-2014
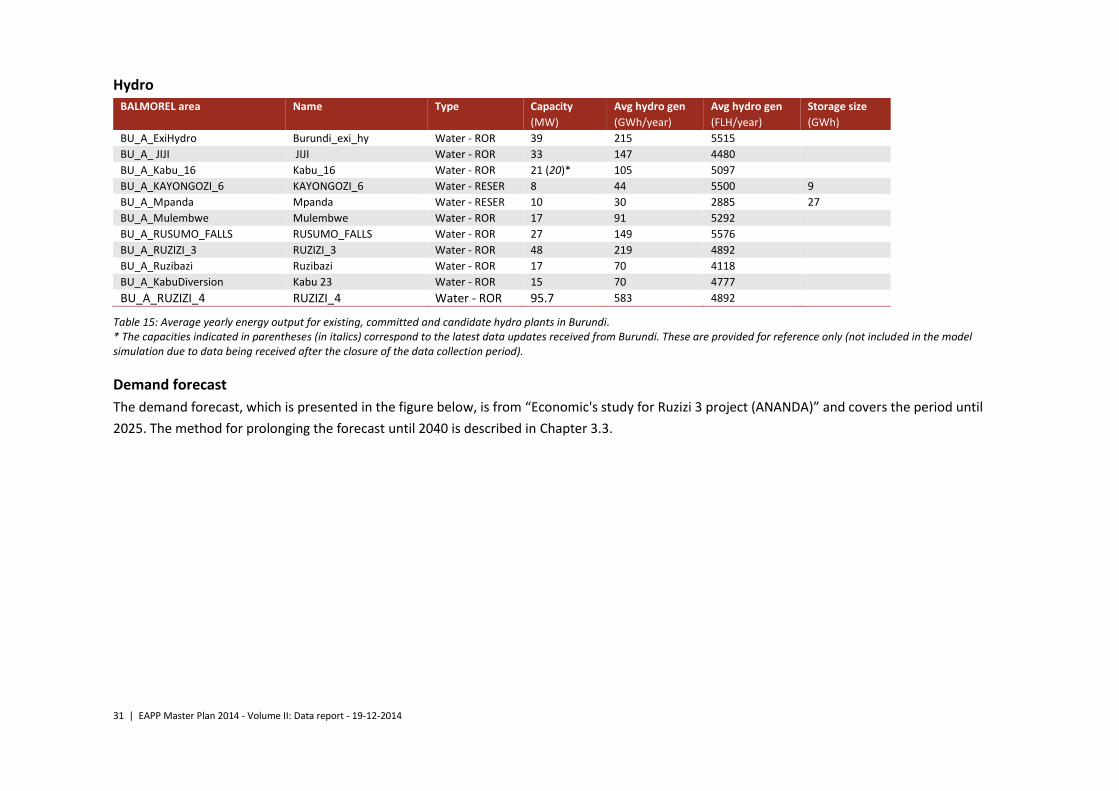
Hydro
BALMOREL area Name Type Capacity Avg hydro gen Avg hydro gen Storage size
(MW) (GWh/year) (FLH/year) (GWh)
BU_A_ExiHydro Burundi_exi_hy Water - ROR 39 215 5515
BU_A_ JIJI JIJI Water - ROR 33 147 4480
BU_A_Kabu_16 Kabu_16 Water - ROR 21 (20)* 105 5097
BU_A_KAYONGOZI_6 KAYONGOZI_6 Water - RESER 8 44 5500 9
BU_A_Mpanda Mpanda Water - RESER 10 30 2885 27
BU_A_Mulembwe Mulembwe Water - ROR 17 91 5292
BU_A_RUSUMO_FALLS RUSUMO_FALLS Water - ROR 27 149 5576
BU_A_RUZIZI_3 RUZIZI_3 Water - ROR 48 219 4892
BU_A_Ruzibazi Ruzibazi Water - ROR 17 70 4118
BU_A_KabuDiversion Kabu 23 Water - ROR 15 70 4777
BU_A_RUZIZI_4 RUZIZI_4 Water - ROR 95.7 583 4892
Table 15: Average yearly energy output for existing, committed and candidate hydro plants in Burundi. * The capacities indicated in parentheses (in italics) correspond to the latest data updates received from Burundi. These are provided for reference only (not included in the model simulation due to data being received after the closure of the data collection period).
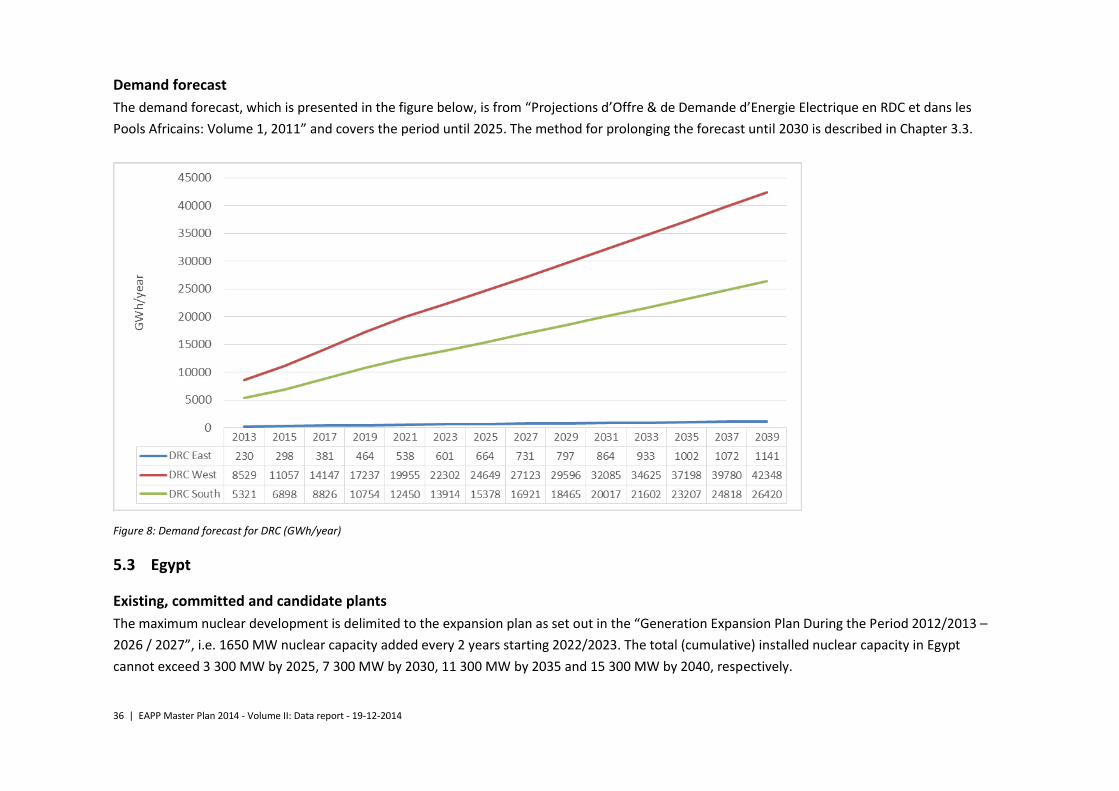
Demand forecast
The demand forecast, which is presented in the figure below, is from “Economic's study for Ruzizi 3 project (ANANDA)” and covers the period until
2025. The method for prolonging the forecast until 2040 is described in Chapter 3.3.

32 | EAPP Master Plan 2014 - Volume II: Data report - 19-12-2014
Figure 7: Demand forecast for Burundi (GWh/year)
5.2 DRC
DRC is divided into the Eastern, Western and Southern grid to reflect that these are currently not fully connected. This division is also reflected in
the representation of the data, as shown below. It should also be noted that model-based investments from/to DRC West and from/to DRC South
(above and beyond the committed lines added in 2025, respectively) are only allowed starting from 2030 and limited to 1000 MW addition per line
per 5-year period. This is done to account for the challenging infrastructural and investment environment domestically within the DRC.
A direct DC connection from the Grand Inga site (DRC West) to Egypt is only made available as an investment option in the ‘Inga North East’ sce-
nario, and not before 2030, for similar reasons as stated earlier. This would be a very ambitious and challenging infrastructural project involving,
among other things, regional coordination among several countries, hence its potential implications, if / when materialized, are explored in a sepa-
rate scenario, as opposed to it being included as a part of the base assumptions in the Main scenario.

33 | EAPP Master Plan 2014 - Volume II: Data report - 19-12-2014
Existing, committed and candidate plants
All hydropower generation plants in the DRC (both existing, committed and candidate) have been modelled as run-of-river units, with the excep-
tion of Nseke and Nzilo plants. These 2 units have been modelled with reservoir storage capacity equivalent to 30% on annual power production.
The Grand Inga site has been provided as a set of candidate projects, made available for investment in a step-wise manner by 2040. The candidate
project investment stages follow the suggested development pathway laid out in the pre-feasibility study of the Grand Inga site (AECOM & EDF
2011). It should be noted that the Inga 3 candidate project has a recommended capacity of 4800 MW, yet a Joint Development Agreement has
been signed with South Africa along with a commitment of purchase of 2500 MW of the Inga 3 produced power. South Africa is beyond the scope
and modelled area of the current EAPP Master Plan.
As such, should the Inga 3 project materialize in the foreseeable future, only the remaining 2300 MW of its capacity would be available for local
demand in the DRC and / or power exchanges with other EAPP member countries. As such, only the 2300 MW capacity is hereby modelled for the
Inga 3 candidate project.
In addition, due to significant data availability limitations, the majority of the DRC hydro projects are assigned the inflow profile of the Ruzizi River.
Grand Inga site projects, however, follow the Grand Inga recorded hydro inflow7.
For the committed Kakobola 10 MW hydro project, due to lacking data, the Zongo 2 full-load hours have been applied based on the project similar-
ities.
7 Grand Inga site inflow profile: based on the The Grand Inga Power Plant Project presentation by Mr Vika di Panzu, SNEL CEO

34 | EAPP Master Plan 2014 - Volume II: Data report - 19-12-2014
BALMOREL area Name Type Nominal capacity
(MW el.) Fuel
Efficiency (net %)
CAPEX (M$/MW el.)
Fixed costs (1000$/Mwel.)
Variable costs
($/MWh el.)
On po-wer
(Year incl.)
Retirement (Year incl.)
Existing DRC_E_ExiThe DRC_Exi_Ther MSD 18 Diesel 27% 21.80 1.82 2009 2038 DRC_E_Tshopo1 Tshopo1 HYDRO 19 Water - ROR 45.53 3.25 2010 2050 DRC_E_Ruzizi1 Ruzizi1 HYDRO 28 Water - ROR 45.53 3.25 2010 2050 DRC_E_Ruzizi2 Ruzizi2 HYDRO 36 Water - ROR 45.53 3.25 2010 2050 DRC_S_Bendera Bendera HYDRO 43 Water - ROR 45.53 3.25 2010 2050 DRC_S_Nseke Nseke HYDRO 240 Water - RESER 45.53 3.25 1957 2050 DRC_S_Nzilo Nzilo HYDRO 110 Water - RESER 45.53 3.25 1954 2050 DRC_S_Mwadingusha Mwadingusha HYDRO 66 Water - ROR 45.53 3.25 1954 2050 DRC_S_Koni Koni HYDRO 42 Water - ROR 45.53 3.25 1950 2050 DRC_W_Inga1 Inga1 HYDRO 351 Water - ROR 45.53 3.25 1971 2050 DRC_W_Inga2 Inga2 HYDRO 1424 Water - ROR 45.53 3.25 1982 2050 DRC_W_Zongo Zongo HYDRO 75 Water - ROR 45.53 3.25 1965 2050 DRC_W_Sanga Sanga HYDRO 12 Water - ROR 45.53 3.25 1949 2050
Committed DRC_S_Katende Katende HYDRO 64 Water - ROR 45.53 3.25 2017 2050 DRC_W_Kakobola Kakobola HYDRO 10 Water - ROR 45.53 3.25 2016 2050 DRC_W_Zongo2 Zongo2 HYDRO 150 Water - ROR 45.53 3.25 2015 2050
Candidates DRC_E_WanieRukula WanieRukula HYDRO 688 Water - ROR 2.50 45.53 3.25 2021 2050 DRC_E_RuziziIV RuziziIV HYDRO 95.7 Water - ROR 3.00 45.53 3.25 2019 2050 DRC_E_RuziziIII RuziziIII HYDRO 48 Water - ROR 3.47 45.53 3.25 2017 2050 DRC_E_Bengamisa Bengamisa HYDRO 50 Water - ROR 3.50 45.53 3.25 2018 2050 DRC_E_BabebaI BabebaI HYDRO 50 Water - ROR 3.50 45.53 3.25 2019 2050 DRC_E_Semliki Semliki HYDRO 14 Water - ROR 3.50 45.53 3.25 2018 2050 DRC_E_Mugomba Mugomba HYDRO 40 Water - ROR 3.50 45.53 3.25 2019 2050 DRC_S_Nzilo2 Nzilo2 HYDRO 120 Water - ROR 3.00 45.53 3.25 2018 2050 DRC_S_PianaMwanga PianaMwanga HYDRO 29.5 Water - ROR 3.49 45.53 3.25 2018 2050 DRC_S_Bendera2 Bendera2 HYDRO 43 Water - ROR 3.50 45.53 3.25 2017 2050 DRC_S_Luapula Luapula HYDRO 800 Water - ROR 2.50 45.53 3.25 2022 2050 DRC_W_Inga3 Inga3 HYDRO 2300 Water - ROR 2.00 45.53 3.25 2022 2050 DRC_W_Inga4 Inga4 HYDRO 7424 Water - ROR 2.50 45.53 3.25 2030 2050 DRC_W_Inga5 Inga5 HYDRO 7424 Water - ROR 2.50 45.53 3.25 2035 2050 DRC_W_Inga6 Inga6 HYDRO 7424 Water - ROR 2.50 45.53 3.25 2035 2050 DRC_W_Inga7 Inga7 HYDRO 7424 Water - ROR 2.50 45.53 3.25 2040 2050 DRC_W_Inga8 Inga8 HYDRO 7424 Water - ROR 2.50 45.53 3.25 2040 2050 DRC_S_Busanga Busanga HYDRO 240 Water - ROR 2.5 45.53 3.25 2022 2050
Table 16: Existing, committed and candidate power plants as represented in the model for DRC
35 | EAPP Master Plan 2014 - Volume II: Data report - 19-12-2014
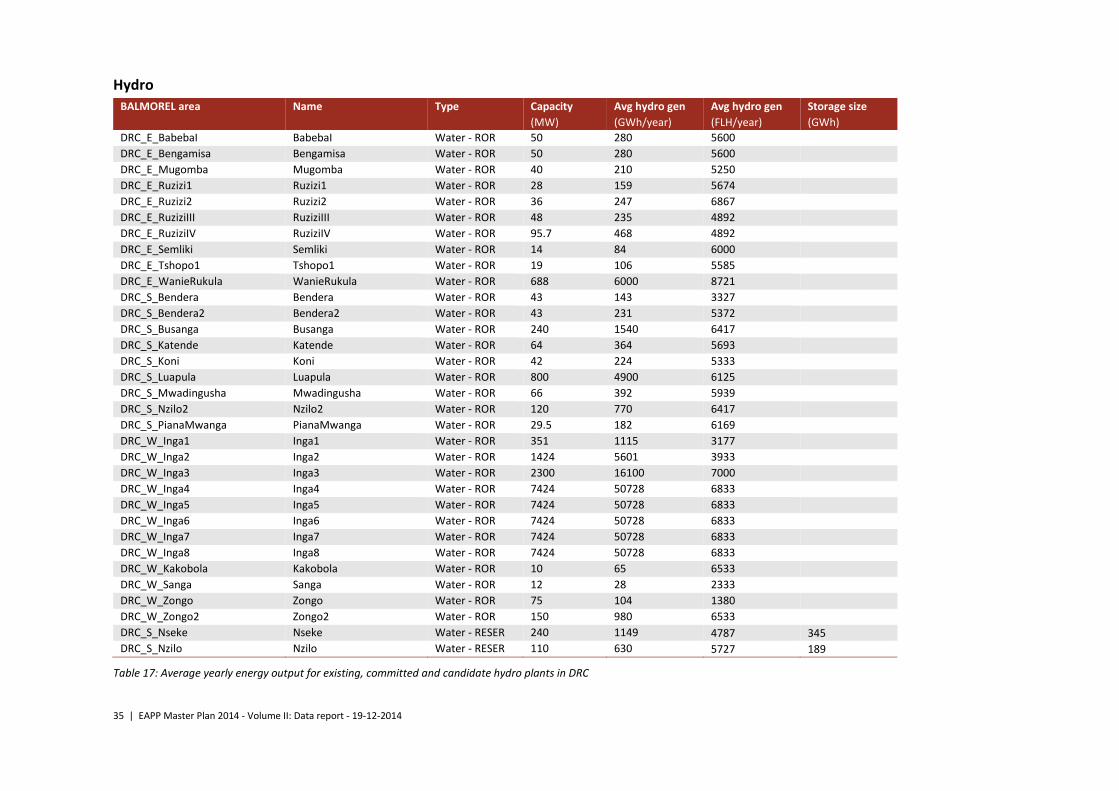
Hydro
BALMOREL area Name Type Capacity Avg hydro gen Avg hydro gen Storage size
(MW) (GWh/year) (FLH/year) (GWh)
DRC_E_BabebaI BabebaI Water - ROR 50 280 5600
DRC_E_Bengamisa Bengamisa Water - ROR 50 280 5600
DRC_E_Mugomba Mugomba Water - ROR 40 210 5250
DRC_E_Ruzizi1 Ruzizi1 Water - ROR 28 159 5674
DRC_E_Ruzizi2 Ruzizi2 Water - ROR 36 247 6867
DRC_E_RuziziIII RuziziIII Water - ROR 48 235 4892
DRC_E_RuziziIV RuziziIV Water - ROR 95.7 468 4892
DRC_E_Semliki Semliki Water - ROR 14 84 6000
DRC_E_Tshopo1 Tshopo1 Water - ROR 19 106 5585
DRC_E_WanieRukula WanieRukula Water - ROR 688 6000 8721
DRC_S_Bendera Bendera Water - ROR 43 143 3327
DRC_S_Bendera2 Bendera2 Water - ROR 43 231 5372
DRC_S_Busanga Busanga Water - ROR 240 1540 6417
DRC_S_Katende Katende Water - ROR 64 364 5693
DRC_S_Koni Koni Water - ROR 42 224 5333
DRC_S_Luapula Luapula Water - ROR 800 4900 6125
DRC_S_Mwadingusha Mwadingusha Water - ROR 66 392 5939
DRC_S_Nzilo2 Nzilo2 Water - ROR 120 770 6417
DRC_S_PianaMwanga PianaMwanga Water - ROR 29.5 182 6169
DRC_W_Inga1 Inga1 Water - ROR 351 1115 3177
DRC_W_Inga2 Inga2 Water - ROR 1424 5601 3933
DRC_W_Inga3 Inga3 Water - ROR 2300 16100 7000
DRC_W_Inga4 Inga4 Water - ROR 7424 50728 6833
DRC_W_Inga5 Inga5 Water - ROR 7424 50728 6833
DRC_W_Inga6 Inga6 Water - ROR 7424 50728 6833
DRC_W_Inga7 Inga7 Water - ROR 7424 50728 6833
DRC_W_Inga8 Inga8 Water - ROR 7424 50728 6833
DRC_W_Kakobola Kakobola Water - ROR 10 65 6533
DRC_W_Sanga Sanga Water - ROR 12 28 2333
DRC_W_Zongo Zongo Water - ROR 75 104 1380
DRC_W_Zongo2 Zongo2 Water - ROR 150 980 6533
DRC_S_Nseke Nseke Water - RESER 240 1149 4787 345
DRC_S_Nzilo Nzilo Water - RESER 110 630 5727 189
Table 17: Average yearly energy output for existing, committed and candidate hydro plants in DRC
36 | EAPP Master Plan 2014 - Volume II: Data report - 19-12-2014
Demand forecast
The demand forecast, which is presented in the figure below, is from “Projections d’Offre & de Demande d’Energie Electrique en RDC et dans les
Pools Africains: Volume 1, 2011” and covers the period until 2025. The method for prolonging the forecast until 2030 is described in Chapter 3.3.
Figure 8: Demand forecast for DRC (GWh/year)
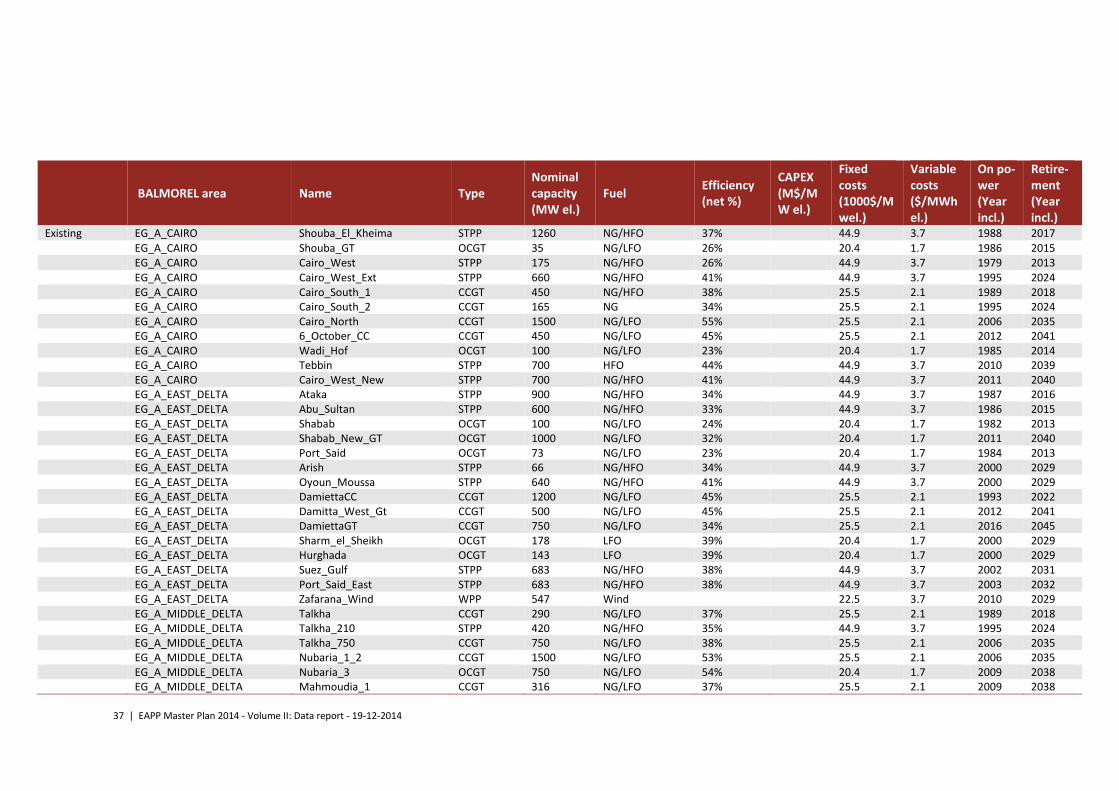
5.3 Egypt
Existing, committed and candidate plants
The maximum nuclear development is delimited to the expansion plan as set out in the “Generation Expansion Plan During the Period 2012/2013 –
2026 / 2027”, i.e. 1650 MW nuclear capacity added every 2 years starting 2022/2023. The total (cumulative) installed nuclear capacity in Egypt
cannot exceed 3 300 MW by 2025, 7 300 MW by 2030, 11 300 MW by 2035 and 15 300 MW by 2040, respectively.
37 | EAPP Master Plan 2014 - Volume II: Data report - 19-12-2014
BALMOREL area Name Type Nominal capacity (MW el.)
Fuel Efficiency (net %)
CAPEX (M$/MW el.)
Fixed costs (1000$/Mwel.)
Variable costs ($/MWh el.)
On po-wer (Year incl.)
Retire-ment (Year incl.)
Existing EG_A_CAIRO Shouba_El_Kheima STPP 1260 NG/HFO 37% 44.9 3.7 1988 2017 EG_A_CAIRO Shouba_GT OCGT 35 NG/LFO 26% 20.4 1.7 1986 2015 EG_A_CAIRO Cairo_West STPP 175 NG/HFO 26% 44.9 3.7 1979 2013 EG_A_CAIRO Cairo_West_Ext STPP 660 NG/HFO 41% 44.9 3.7 1995 2024 EG_A_CAIRO Cairo_South_1 CCGT 450 NG/HFO 38% 25.5 2.1 1989 2018 EG_A_CAIRO Cairo_South_2 CCGT 165 NG 34% 25.5 2.1 1995 2024 EG_A_CAIRO Cairo_North CCGT 1500 NG/LFO 55% 25.5 2.1 2006 2035 EG_A_CAIRO 6_October_CC CCGT 450 NG/LFO 45% 25.5 2.1 2012 2041 EG_A_CAIRO Wadi_Hof OCGT 100 NG/LFO 23% 20.4 1.7 1985 2014 EG_A_CAIRO Tebbin STPP 700 HFO 44% 44.9 3.7 2010 2039 EG_A_CAIRO Cairo_West_New STPP 700 NG/HFO 41% 44.9 3.7 2011 2040 EG_A_EAST_DELTA Ataka STPP 900 NG/HFO 34% 44.9 3.7 1987 2016 EG_A_EAST_DELTA Abu_Sultan STPP 600 NG/HFO 33% 44.9 3.7 1986 2015 EG_A_EAST_DELTA Shabab OCGT 100 NG/LFO 24% 20.4 1.7 1982 2013 EG_A_EAST_DELTA Shabab_New_GT OCGT 1000 NG/LFO 32% 20.4 1.7 2011 2040 EG_A_EAST_DELTA Port_Said OCGT 73 NG/LFO 23% 20.4 1.7 1984 2013 EG_A_EAST_DELTA Arish STPP 66 NG/HFO 34% 44.9 3.7 2000 2029 EG_A_EAST_DELTA Oyoun_Moussa STPP 640 NG/HFO 41% 44.9 3.7 2000 2029 EG_A_EAST_DELTA DamiettaCC CCGT 1200 NG/LFO 45% 25.5 2.1 1993 2022 EG_A_EAST_DELTA Damitta_West_Gt CCGT 500 NG/LFO 45% 25.5 2.1 2012 2041 EG_A_EAST_DELTA DamiettaGT CCGT 750 NG/LFO 34% 25.5 2.1 2016 2045 EG_A_EAST_DELTA Sharm_el_Sheikh OCGT 178 LFO 39% 20.4 1.7 2000 2029 EG_A_EAST_DELTA Hurghada OCGT 143 LFO 39% 20.4 1.7 2000 2029 EG_A_EAST_DELTA Suez_Gulf STPP 683 NG/HFO 38% 44.9 3.7 2002 2031 EG_A_EAST_DELTA Port_Said_East STPP 683 NG/HFO 38% 44.9 3.7 2003 2032 EG_A_EAST_DELTA Zafarana_Wind WPP 547 Wind 22.5 3.7 2010 2029 EG_A_MIDDLE_DELTA Talkha CCGT 290 NG/LFO 37% 25.5 2.1 1989 2018 EG_A_MIDDLE_DELTA Talkha_210 STPP 420 NG/HFO 35% 44.9 3.7 1995 2024 EG_A_MIDDLE_DELTA Talkha_750 CCGT 750 NG/LFO 38% 25.5 2.1 2006 2035 EG_A_MIDDLE_DELTA Nubaria_1_2 CCGT 1500 NG/LFO 53% 25.5 2.1 2006 2035 EG_A_MIDDLE_DELTA Nubaria_3 OCGT 750 NG/LFO 54% 20.4 1.7 2009 2038 EG_A_MIDDLE_DELTA Mahmoudia_1 CCGT 316 NG/LFO 37% 25.5 2.1 2009 2038

38 | EAPP Master Plan 2014 - Volume II: Data report - 19-12-2014
EG_A_MIDDLE_DELTA El_Atf CCGT 750 NG/LFO 55% 25.5 2.1 2010 2039
EG_A_WEST_DELTA Kafr_Dawar STPP 440 NG/HFO 31% 44.9 3.7 1986 2015 EG_A_WEST_DELTA Damhour_Ext STPP 300 NG/HFO 36% 44.9 3.7 1991 2020 EG_A_WEST_DELTA Damanhour_1 STPP 195 NG/HFO 31% 44.9 3.7 1969 2013 EG_A_WEST_DELTA Damanhour_2 CCGT 157 NG/LFO 40% 25.5 2.1 1995 2024 EG_A_WEST_DELTA Abu_Kir STPP 911 NG/HFO 39% 44.9 3.7 1991 2020 EG_A_WEST_DELTA Abu_Kir_2 OCGT 24 NG/LFO 36% 20.4 1.7 1983 2013 EG_A_WEST_DELTA Sidi_Krir_3_4 STPP 683 NG/HFO 42% 44.9 3.7 2001 2030 EG_A_WEST_DELTA El_Seiuf OCGT 200 NG/LFO 23% 20.4 1.7 1984 2013 EG_A_WEST_DELTA Karmouz OCGT 23 LFO 22% 20.4 1.7 1980 2013 EG_A_WEST_DELTA Sidi_Krir_1_2 STPP 640 NG/HFO 42% 44.9 3.7 2000 2029 EG_A_WEST_DELTA Sidi_Krir_New CCGT 750 NG/HFO 56% 25.5 2.1 2010 2039 EG_A_WEST_DELTA Matrouh STPP 60 NG/HFO 30% 44.9 3.7 1990 2019 EG_A_UPPER_EGYPT Walidia STPP 624 HFO 27% 44.9 3.7 1997 2026 EG_A_UPPER_EGYPT Kuriemat_1 STPP 1254 NG/HFO 41% 44.9 3.7 1999 2028 EG_A_UPPER_EGYPT Kuriemat_2 CCGT 750 NG/LFO 56% 25.5 2.1 2009 2038 EG_A_UPPER_EGYPT Kuriemat_3 OCGT 750 NG/HFO 50% 20.4 1.7 2011 2040 EG_A_UPPER_EGYPT Assiut STPP 90 HFO 29% 44.9 3.7 1967 2013 EG_A_UPPER_EGYPT Kuriemat_solar-thermal STPP 140 Sunlight 37% 44.9 3.7 2011 2035 EG_A_High_Aswan_Dam High_Aswan_Dam HYDRO 2100 Water - RESER 45.5 3.3 2010 2050 EG_A_Aswan_1 Aswan_1 HYDRO 280 Water - ROR 45.5 3.3 2010 2050 EG_A_Aswan_2 Aswan_2 HYDRO 270 Water - ROR 45.5 3.3 2010 2050 EG_A_Esna Esna HYDRO 86 Water - ROR 45.5 3.3 2010 2050 EG_A_Naga_Hamadi Naga_Hamadi HYDRO 64 Water - ROR 45.5 3.3 2010 2050 Committed EG_A_CAIRO Suez_Gulf_Wind1 WPP 500 Wind 22.5 3.7 2015 2034 EG_A_CAIRO Suez_Gulf_Wind2 WPP 200 Wind 22.5 3.7 2017 2036 EG_A_CAIRO Nile_Wind_EW_1 WPP 910 Wind 22.5 3.7 2015 2034 EG_A_CAIRO Nile_Wind_EW_2 WPP 600 Wind 22.5 3.7 2017 2036 EG_A_CAIRO Solar_EG PV 425 Sunlight 29.4 0.2 2016 2040 EG_A_CAIRO 6_October_CC_New CCGT 600 NG 57% 25.5 2.1 2015 2044 EG_A_EAST_DELTA Ain_SokhnaST STPP 1300 NG 40% 44.9 3.7 2015 2044 EG_A_MIDDLE_DELTA BanhaCC CCGT 750 NG 57% 25.5 2.1 2015 2044 EG_A_UPPER_EGYPT Giza_NorthCC CCGT 1750 NG 57% 25.5 2.1 2015 2044 EG_A_UPPER_EGYPT Giza_NorthCC_2 CCGT 500 NG 57% 25.5 2.1 2016 2045 EG_A_CAIRO DairoutCC CCGT 0 NG 57% 25.5 2.1 2016 2045 EG_A_CAIRO DairoutCC_2 CCGT 0 NG 57% 25.5 2.1 2017 2046 EG_A_EAST_DELTA SuezST STPP 650 NG 40% 44.9 3.7 2016 2045 EG_A_MIDDLE_DELTA DamanhourCC CCGT 0 NG 57% 25.5 2.1 2014 2043 EG_A_MIDDLE_DELTA DamanhourCC_2 CCGT 0 NG 57% 25.5 2.1 2015 2044 EG_A_MIDDLE_DELTA DamanhourCC_3 CCGT 0 NG 57% 25.5 2.1 2017 2046 EG_A_CAIRO El_SuiefCC CCGT 0 NG 57% 25.5 2.1 2014 2043 EG_A_CAIRO El_SuiefCC2 CCGT 0 NG 57% 25.5 2.1 2015 2044 EG_A_CAIRO El_SuiefCC3 CCGT 0 NG 57% 25.5 2.1 2017 2046

39 | EAPP Master Plan 2014 - Volume II: Data report - 19-12-2014
Table 18: Existing, committed and candidate power plants as represented in the model for Egypt
Hydro
BALMOREL area Name Type Capacity Avg hydro gen Avg hydro gen Storage size
(MW) (GWh/year) (FLH/year) (GWh)
EG_A_High_Aswan_Dam High_Aswan_Dam Water - RESER 2100 9921 4724 19516
EG_A_Aswan_1 Aswan_1 Water - ROR 280 1512 5401
EG_A_Aswan_2 Aswan_2 Water - ROR 270 1770 6556
EG_A_Esna Esna Water - ROR 86 411 4776
EG_A_Naga_Hamadi Naga_Hamadi Water - ROR 64 19 304
EG_A_SmallHydro MiniHydro Water - ROR 32 139 4352
Table 19: Average yearly energy output for existing, committed and candidate hydro plants in Egypt
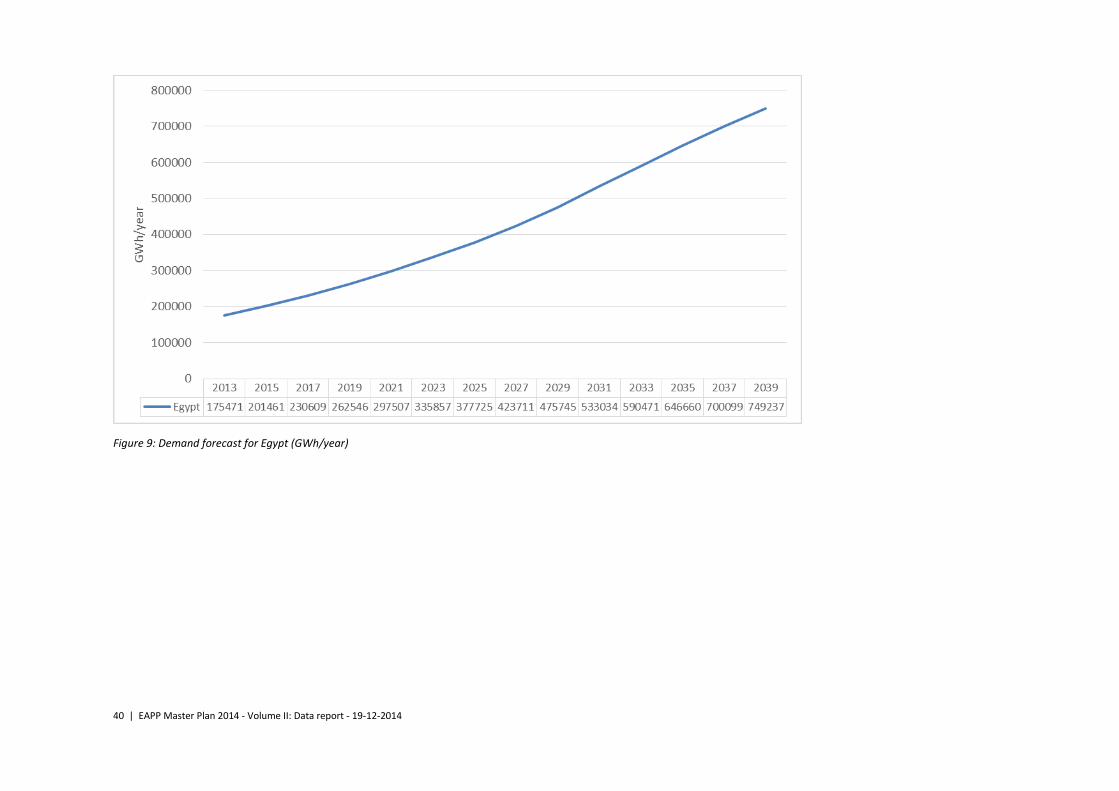
Demand forecast
The demand forecast, which is presented in the figure below, is from “EEHC forecast for EAPP Master Plan, 2013” and covers the period until 2026.
The method for prolonging the forecast until 2040 is described in Chapter 3.3.
EG_A_MIDDLE_DELTA MahmoudiaCC CCGT 0 NG 57% 25.5 2.1 2014 2043
EG_A_MIDDLE_DELTA MahmoudiaCC2 CCGT 0 NG 57% 25.5 2.1 2016 2045 EG_A_EAST_DELTA El_ShababCC CCGT 500 NG 57% 25.5 2.1 2017 2046 EG_A_SmallHydro MiniHydro HYDRO 0 Water - ROR 45.5 3.3 2015 2050 EG_A_UPPER_EGYPT HelwanSouthST STPP 1950 NG 40% 44.9 3.7 2018 2047 EG_A_UPPER_EGYPT Assuit_New STPP 650 HFO 29% 44.9 3.7 2018 2047 EG_A_EAST_DELTA Damitta_West_Gt_New CCGT 250 NG 45% 25.5 2.1 2017 2046 EG_A_WEST_DELTA Abu_Kir_NewST STPP 1300 NG/HFO 39% 44.9 3.7 2013 2042 Candidates EG_A_Nuclear EG_Nuclear Nuclear 4950 Nuclear 33% 5.56 125.5 0.0 2019 2078
40 | EAPP Master Plan 2014 - Volume II: Data report - 19-12-2014
Figure 9: Demand forecast for Egypt (GWh/year)
41 | EAPP Master Plan 2014 - Volume II: Data report - 19-12-2014
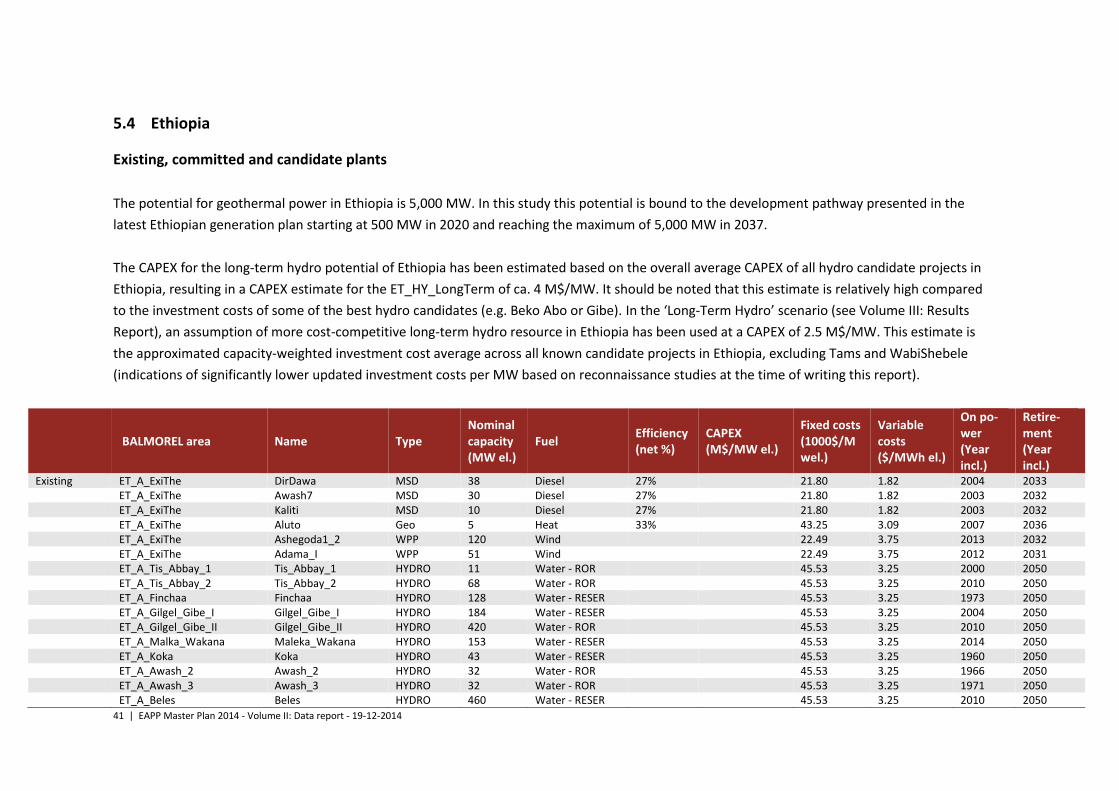
5.4 Ethiopia
Existing, committed and candidate plants
The potential for geothermal power in Ethiopia is 5,000 MW. In this study this potential is bound to the development pathway presented in the
latest Ethiopian generation plan starting at 500 MW in 2020 and reaching the maximum of 5,000 MW in 2037.
The CAPEX for the long-term hydro potential of Ethiopia has been estimated based on the overall average CAPEX of all hydro candidate projects in
Ethiopia, resulting in a CAPEX estimate for the ET_HY_LongTerm of ca. 4 M$/MW. It should be noted that this estimate is relatively high compared
to the investment costs of some of the best hydro candidates (e.g. Beko Abo or Gibe). In the ‘Long-Term Hydro’ scenario (see Volume III: Results
Report), an assumption of more cost-competitive long-term hydro resource in Ethiopia has been used at a CAPEX of 2.5 M$/MW. This estimate is
the approximated capacity-weighted investment cost average across all known candidate projects in Ethiopia, excluding Tams and WabiShebele
(indications of significantly lower updated investment costs per MW based on reconnaissance studies at the time of writing this report).
BALMOREL area Name Type Nominal capacity (MW el.)
Fuel Efficiency (net %)
CAPEX (M$/MW el.)
Fixed costs (1000$/Mwel.)
Variable costs ($/MWh el.)
On po-wer (Year incl.)
Retire-ment (Year incl.)
Existing ET_A_ExiThe DirDawa MSD 38 Diesel 27% 21.80 1.82 2004 2033 ET_A_ExiThe Awash7 MSD 30 Diesel 27% 21.80 1.82 2003 2032 ET_A_ExiThe Kaliti MSD 10 Diesel 27% 21.80 1.82 2003 2032 ET_A_ExiThe Aluto Geo 5 Heat 33% 43.25 3.09 2007 2036 ET_A_ExiThe Ashegoda1_2 WPP 120 Wind 22.49 3.75 2013 2032 ET_A_ExiThe Adama_I WPP 51 Wind 22.49 3.75 2012 2031 ET_A_Tis_Abbay_1 Tis_Abbay_1 HYDRO 11 Water - ROR 45.53 3.25 2000 2050 ET_A_Tis_Abbay_2 Tis_Abbay_2 HYDRO 68 Water - ROR 45.53 3.25 2010 2050 ET_A_Finchaa Finchaa HYDRO 128 Water - RESER 45.53 3.25 1973 2050 ET_A_Gilgel_Gibe_I Gilgel_Gibe_I HYDRO 184 Water - RESER 45.53 3.25 2004 2050 ET_A_Gilgel_Gibe_II Gilgel_Gibe_II HYDRO 420 Water - ROR 45.53 3.25 2010 2050 ET_A_Malka_Wakana Maleka_Wakana HYDRO 153 Water - RESER 45.53 3.25 2014 2050 ET_A_Koka Koka HYDRO 43 Water - RESER 45.53 3.25 1960 2050 ET_A_Awash_2 Awash_2 HYDRO 32 Water - ROR 45.53 3.25 1966 2050 ET_A_Awash_3 Awash_3 HYDRO 32 Water - ROR 45.53 3.25 1971 2050 ET_A_Beles Beles HYDRO 460 Water - RESER 45.53 3.25 2010 2050
42 | EAPP Master Plan 2014 - Volume II: Data report - 19-12-2014
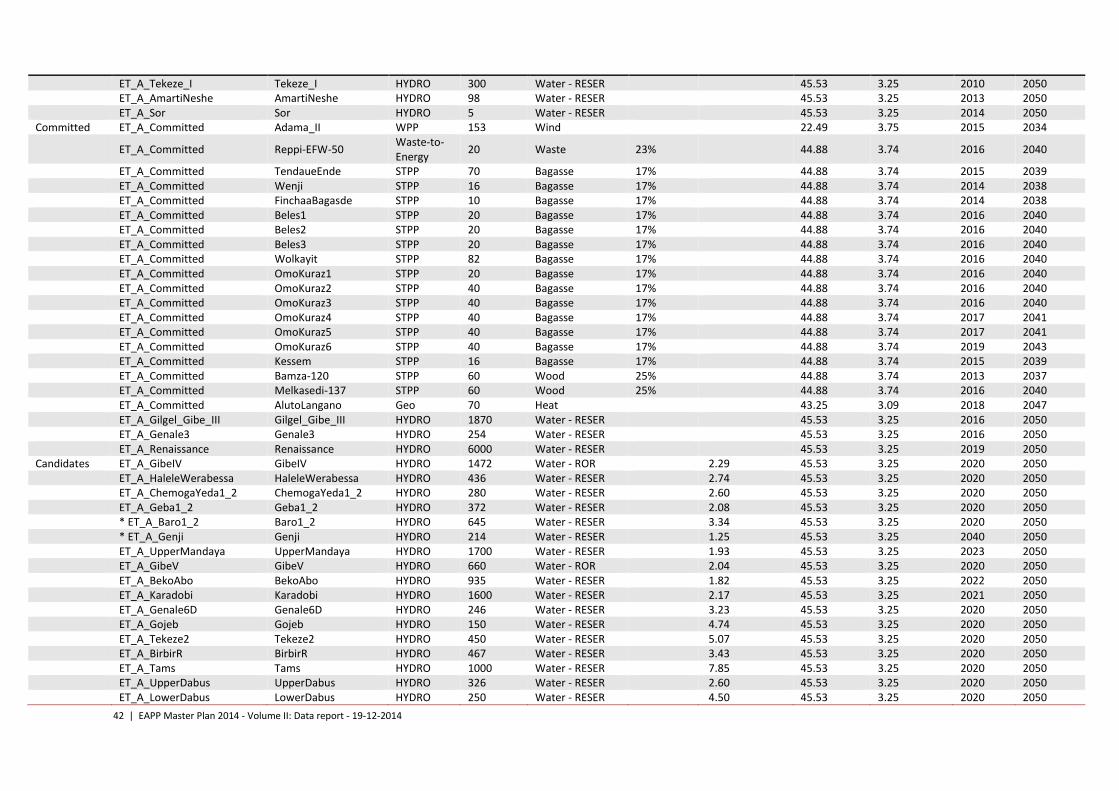
ET_A_Tekeze_I Tekeze_I HYDRO 300 Water - RESER 45.53 3.25 2010 2050
ET_A_AmartiNeshe AmartiNeshe HYDRO 98 Water - RESER 45.53 3.25 2013 2050 ET_A_Sor Sor HYDRO 5 Water - RESER 45.53 3.25 2014 2050
Committed ET_A_Committed Adama_II WPP 153 Wind 22.49 3.75 2015 2034
ET_A_Committed Reppi-EFW-50 Waste-to-Energy
20 Waste 23% 44.88 3.74 2016 2040
ET_A_Committed TendaueEnde STPP 70 Bagasse 17% 44.88 3.74 2015 2039 ET_A_Committed Wenji STPP 16 Bagasse 17% 44.88 3.74 2014 2038 ET_A_Committed FinchaaBagasde STPP 10 Bagasse 17% 44.88 3.74 2014 2038 ET_A_Committed Beles1 STPP 20 Bagasse 17% 44.88 3.74 2016 2040 ET_A_Committed Beles2 STPP 20 Bagasse 17% 44.88 3.74 2016 2040 ET_A_Committed Beles3 STPP 20 Bagasse 17% 44.88 3.74 2016 2040 ET_A_Committed Wolkayit STPP 82 Bagasse 17% 44.88 3.74 2016 2040 ET_A_Committed OmoKuraz1 STPP 20 Bagasse 17% 44.88 3.74 2016 2040 ET_A_Committed OmoKuraz2 STPP 40 Bagasse 17% 44.88 3.74 2016 2040 ET_A_Committed OmoKuraz3 STPP 40 Bagasse 17% 44.88 3.74 2016 2040 ET_A_Committed OmoKuraz4 STPP 40 Bagasse 17% 44.88 3.74 2017 2041 ET_A_Committed OmoKuraz5 STPP 40 Bagasse 17% 44.88 3.74 2017 2041 ET_A_Committed OmoKuraz6 STPP 40 Bagasse 17% 44.88 3.74 2019 2043 ET_A_Committed Kessem STPP 16 Bagasse 17% 44.88 3.74 2015 2039 ET_A_Committed Bamza-120 STPP 60 Wood 25% 44.88 3.74 2013 2037 ET_A_Committed Melkasedi-137 STPP 60 Wood 25% 44.88 3.74 2016 2040 ET_A_Committed AlutoLangano Geo 70 Heat 43.25 3.09 2018 2047 ET_A_Gilgel_Gibe_III Gilgel_Gibe_III HYDRO 1870 Water - RESER 45.53 3.25 2016 2050 ET_A_Genale3 Genale3 HYDRO 254 Water - RESER 45.53 3.25 2016 2050 ET_A_Renaissance Renaissance HYDRO 6000 Water - RESER 45.53 3.25 2019 2050
Candidates ET_A_GibeIV GibeIV HYDRO 1472 Water - ROR 2.29 45.53 3.25 2020 2050 ET_A_HaleleWerabessa HaleleWerabessa HYDRO 436 Water - RESER 2.74 45.53 3.25 2020 2050 ET_A_ChemogaYeda1_2 ChemogaYeda1_2 HYDRO 280 Water - RESER 2.60 45.53 3.25 2020 2050 ET_A_Geba1_2 Geba1_2 HYDRO 372 Water - RESER 2.08 45.53 3.25 2020 2050 * ET_A_Baro1_2 Baro1_2 HYDRO 645 Water - RESER 3.34 45.53 3.25 2020 2050 * ET_A_Genji Genji HYDRO 214 Water - RESER 1.25 45.53 3.25 2040 2050 ET_A_UpperMandaya UpperMandaya HYDRO 1700 Water - RESER 1.93 45.53 3.25 2023 2050 ET_A_GibeV GibeV HYDRO 660 Water - ROR 2.04 45.53 3.25 2020 2050 ET_A_BekoAbo BekoAbo HYDRO 935 Water - RESER 1.82 45.53 3.25 2022 2050 ET_A_Karadobi Karadobi HYDRO 1600 Water - RESER 2.17 45.53 3.25 2021 2050 ET_A_Genale6D Genale6D HYDRO 246 Water - RESER 3.23 45.53 3.25 2020 2050 ET_A_Gojeb Gojeb HYDRO 150 Water - RESER 4.74 45.53 3.25 2020 2050 ET_A_Tekeze2 Tekeze2 HYDRO 450 Water - RESER 5.07 45.53 3.25 2020 2050 ET_A_BirbirR BirbirR HYDRO 467 Water - RESER 3.43 45.53 3.25 2020 2050 ET_A_Tams Tams HYDRO 1000 Water - RESER 7.85 45.53 3.25 2020 2050 ET_A_UpperDabus UpperDabus HYDRO 326 Water - RESER 2.60 45.53 3.25 2020 2050 ET_A_LowerDabus LowerDabus HYDRO 250 Water - RESER 4.50 45.53 3.25 2020 2050
43 | EAPP Master Plan 2014 - Volume II: Data report - 19-12-2014
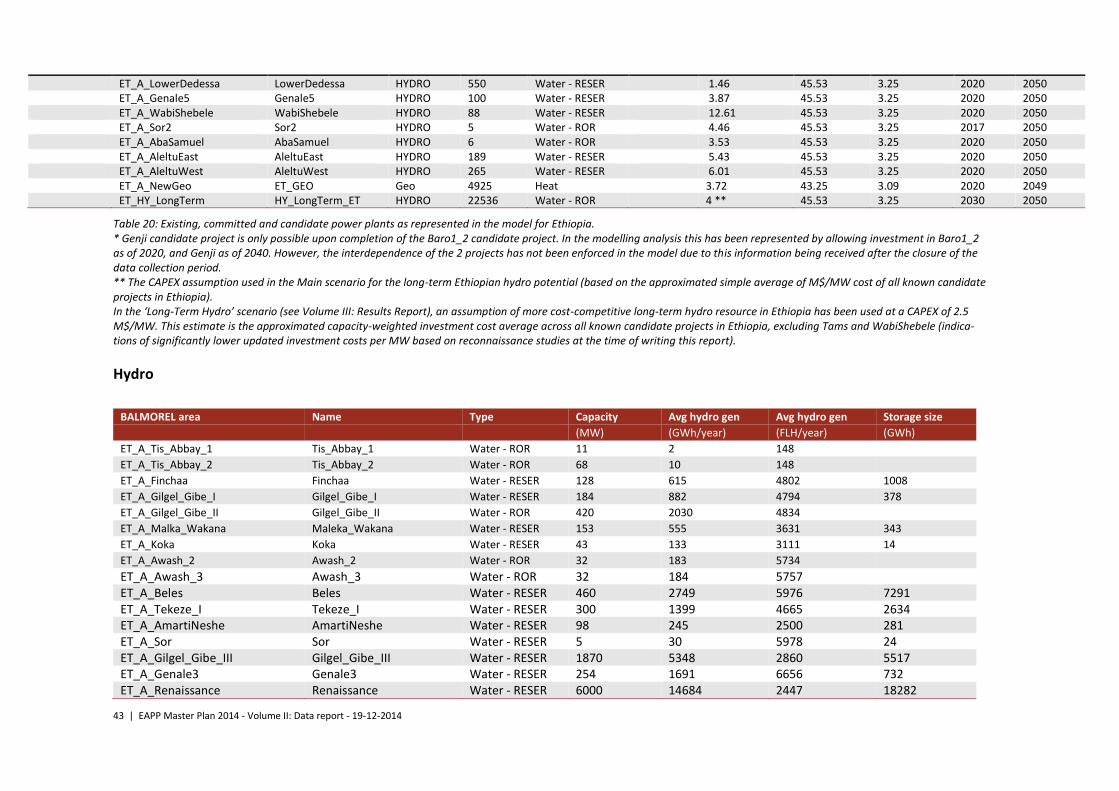
Table 20: Existing, committed and candidate power plants as represented in the model for Ethiopia. * Genji candidate project is only possible upon completion of the Baro1_2 candidate project. In the modelling analysis this has been represented by allowing investment in Baro1_2 as of 2020, and Genji as of 2040. However, the interdependence of the 2 projects has not been enforced in the model due to this information being received after the closure of the data collection period. ** The CAPEX assumption used in the Main scenario for the long-term Ethiopian hydro potential (based on the approximated simple average of M$/MW cost of all known candidate projects in Ethiopia). In the ‘Long-Term Hydro’ scenario (see Volume III: Results Report), an assumption of more cost-competitive long-term hydro resource in Ethiopia has been used at a CAPEX of 2.5 M$/MW. This estimate is the approximated capacity-weighted investment cost average across all known candidate projects in Ethiopia, excluding Tams and WabiShebele (indica-tions of significantly lower updated investment costs per MW based on reconnaissance studies at the time of writing this report).
Hydro
ET_A_LowerDedessa LowerDedessa HYDRO 550 Water - RESER 1.46 45.53 3.25 2020 2050
ET_A_Genale5 Genale5 HYDRO 100 Water - RESER 3.87 45.53 3.25 2020 2050 ET_A_WabiShebele WabiShebele HYDRO 88 Water - RESER 12.61 45.53 3.25 2020 2050 ET_A_Sor2 Sor2 HYDRO 5 Water - ROR 4.46 45.53 3.25 2017 2050 ET_A_AbaSamuel AbaSamuel HYDRO 6 Water - ROR 3.53 45.53 3.25 2020 2050 ET_A_AleltuEast AleltuEast HYDRO 189 Water - RESER 5.43 45.53 3.25 2020 2050 ET_A_AleltuWest AleltuWest HYDRO 265 Water - RESER 6.01 45.53 3.25 2020 2050 ET_A_NewGeo ET_GEO Geo 4925 Heat 3.72 43.25 3.09 2020 2049 ET_HY_LongTerm HY_LongTerm_ET HYDRO 22536 Water - ROR 4 ** 45.53 3.25 2030 2050
BALMOREL area Name Type Capacity Avg hydro gen Avg hydro gen Storage size
(MW) (GWh/year) (FLH/year) (GWh)
ET_A_Tis_Abbay_1 Tis_Abbay_1 Water - ROR 11 2 148
ET_A_Tis_Abbay_2 Tis_Abbay_2 Water - ROR 68 10 148
ET_A_Finchaa Finchaa Water - RESER 128 615 4802 1008
ET_A_Gilgel_Gibe_I Gilgel_Gibe_I Water - RESER 184 882 4794 378
ET_A_Gilgel_Gibe_II Gilgel_Gibe_II Water - ROR 420 2030 4834
ET_A_Malka_Wakana Maleka_Wakana Water - RESER 153 555 3631 343
ET_A_Koka Koka Water - RESER 43 133 3111 14
ET_A_Awash_2 Awash_2 Water - ROR 32 183 5734
ET_A_Awash_3 Awash_3 Water - ROR 32 184 5757 ET_A_Beles Beles Water - RESER 460 2749 5976 7291 ET_A_Tekeze_I Tekeze_I Water - RESER 300 1399 4665 2634 ET_A_AmartiNeshe AmartiNeshe Water - RESER 98 245 2500 281 ET_A_Sor Sor Water - RESER 5 30 5978 24 ET_A_Gilgel_Gibe_III Gilgel_Gibe_III Water - RESER 1870 5348 2860 5517 ET_A_Genale3 Genale3 Water - RESER 254 1691 6656 732 ET_A_Renaissance Renaissance Water - RESER 6000 14684 2447 18282
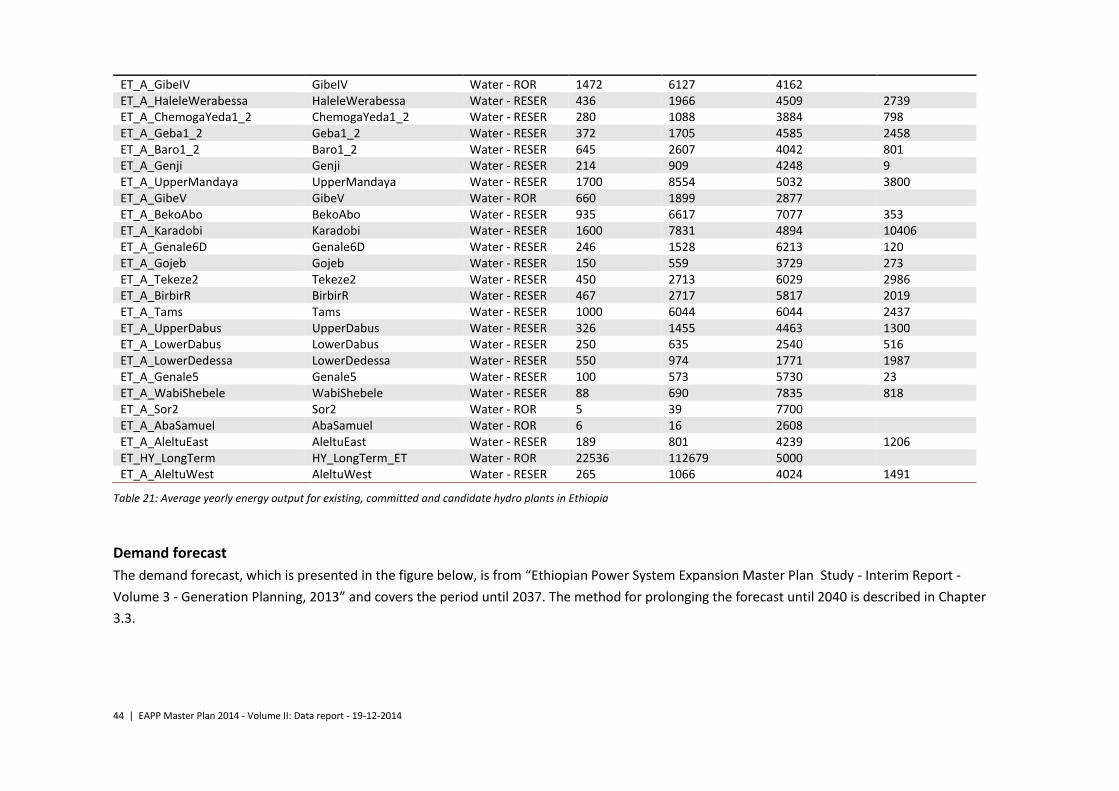
44 | EAPP Master Plan 2014 - Volume II: Data report - 19-12-2014
Table 21: Average yearly energy output for existing, committed and candidate hydro plants in Ethiopia
Demand forecast
The demand forecast, which is presented in the figure below, is from “Ethiopian Power System Expansion Master Plan Study - Interim Report -
Volume 3 - Generation Planning, 2013” and covers the period until 2037. The method for prolonging the forecast until 2040 is described in Chapter
3.3.
ET_A_GibeIV GibeIV Water - ROR 1472 6127 4162 ET_A_HaleleWerabessa HaleleWerabessa Water - RESER 436 1966 4509 2739 ET_A_ChemogaYeda1_2 ChemogaYeda1_2 Water - RESER 280 1088 3884 798 ET_A_Geba1_2 Geba1_2 Water - RESER 372 1705 4585 2458 ET_A_Baro1_2 Baro1_2 Water - RESER 645 2607 4042 801 ET_A_Genji Genji Water - RESER 214 909 4248 9 ET_A_UpperMandaya UpperMandaya Water - RESER 1700 8554 5032 3800 ET_A_GibeV GibeV Water - ROR 660 1899 2877 ET_A_BekoAbo BekoAbo Water - RESER 935 6617 7077 353 ET_A_Karadobi Karadobi Water - RESER 1600 7831 4894 10406 ET_A_Genale6D Genale6D Water - RESER 246 1528 6213 120 ET_A_Gojeb Gojeb Water - RESER 150 559 3729 273 ET_A_Tekeze2 Tekeze2 Water - RESER 450 2713 6029 2986 ET_A_BirbirR BirbirR Water - RESER 467 2717 5817 2019 ET_A_Tams Tams Water - RESER 1000 6044 6044 2437 ET_A_UpperDabus UpperDabus Water - RESER 326 1455 4463 1300 ET_A_LowerDabus LowerDabus Water - RESER 250 635 2540 516 ET_A_LowerDedessa LowerDedessa Water - RESER 550 974 1771 1987 ET_A_Genale5 Genale5 Water - RESER 100 573 5730 23 ET_A_WabiShebele WabiShebele Water - RESER 88 690 7835 818 ET_A_Sor2 Sor2 Water - ROR 5 39 7700 ET_A_AbaSamuel AbaSamuel Water - ROR 6 16 2608 ET_A_AleltuEast AleltuEast Water - RESER 189 801 4239 1206 ET_HY_LongTerm HY_LongTerm_ET Water - ROR 22536 112679 5000 ET_A_AleltuWest AleltuWest Water - RESER 265 1066 4024 1491
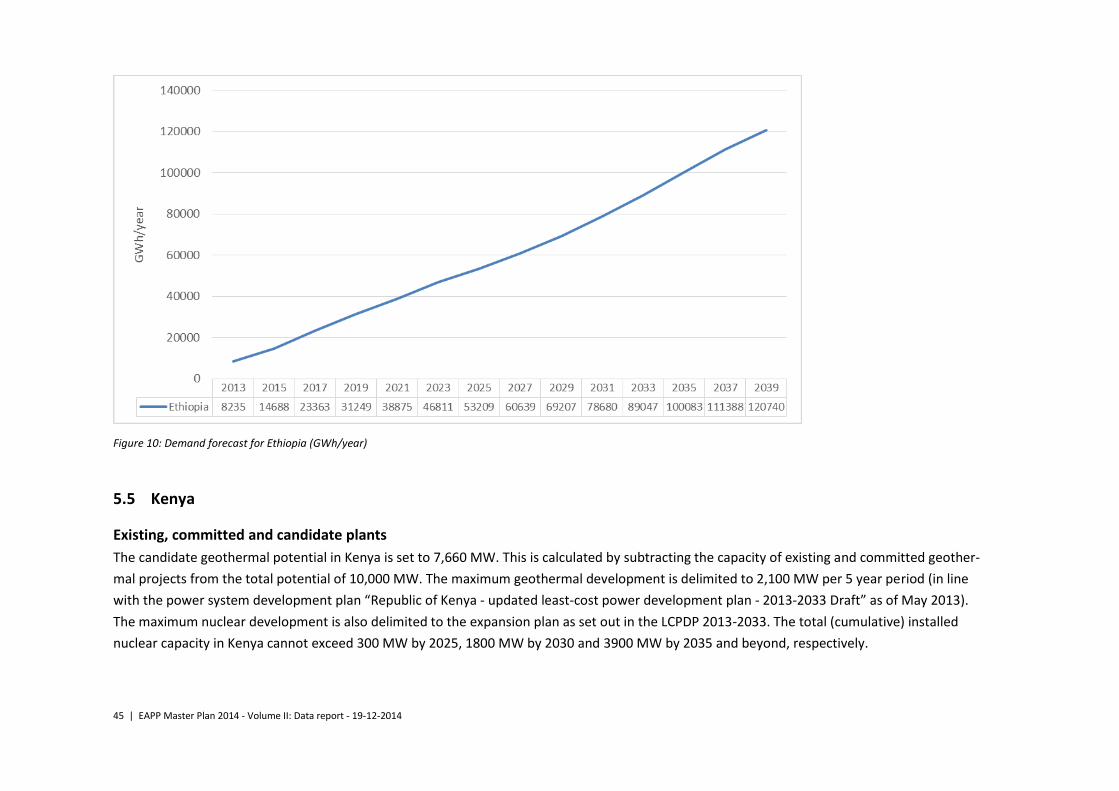
45 | EAPP Master Plan 2014 - Volume II: Data report - 19-12-2014
Figure 10: Demand forecast for Ethiopia (GWh/year)
5.5 Kenya
Existing, committed and candidate plants
The candidate geothermal potential in Kenya is set to 7,660 MW. This is calculated by subtracting the capacity of existing and committed geother-
mal projects from the total potential of 10,000 MW. The maximum geothermal development is delimited to 2,100 MW per 5 year period (in line
with the power system development plan “Republic of Kenya - updated least-cost power development plan - 2013-2033 Draft” as of May 2013).
The maximum nuclear development is also delimited to the expansion plan as set out in the LCPDP 2013-2033. The total (cumulative) installed
nuclear capacity in Kenya cannot exceed 300 MW by 2025, 1800 MW by 2030 and 3900 MW by 2035 and beyond, respectively.

46 | EAPP Master Plan 2014 - Volume II: Data report - 19-12-2014
BALMOREL area Name Type
Nominal capacity (MW el.)
Fuel Efficiency (net %)
CAPEX (M$/MW el.)
Fixed costs (1000$/Mwel.)
Variable costs ($/MWh el.)
On power (Year incl.)
Retirement (Year incl.)
Existing KY_A_ExiThe Kipevu_1_Diesel MSD 60 HFO 40% 21.80 1.82 1999 2017 KY_A_ExiThe Emabakasi OCGT 0 LFO 26% 20.40 1.70 1999 2028 KY_A_ExiThe Olkaria_1 Geo 44 Heat 36% 43.25 3.09 1981 2013 KY_A_ExiThe Olkaria_2 Geo 101 Heat 36% 43.25 3.09 2003 2032 KY_A_ExiThe OrPower_4a Geo 13 Heat 36% 43.25 3.09 2000 2029 KY_A_ExiThe OrPower_4b Geo 35 Heat 33% 43.25 3.09 2008 2037 KY_A_ExiThe Iberafrica_IPP MSD 56 HFO 39% 21.80 1.82 1997 2026 KY_A_ExiThe Tsavo_IPP MSD 74 HFO 41% 21.80 1.82 2001 2017 KY_A_ExiThe Mumias STPP 26 Bagasse 39% 44.88 3.74 2008 2032 KY_A_ExiThe Aggreko_IPP MSD 120 Diesel 40% 21.80 1.82 2008 2037 KY_A_ExiThe Olkaria_Well_Head Geo 4 Heat 33% 43.25 3.09 2012 2041 KY_A_ExiThe Rabai_diesel_IPP MSD 90 HFO 40% 21.80 1.82 2009 2017 KY_A_ExiThe Iberafrica_3_IPP MSD 52 HFO 39% 21.80 1.82 2004 2033 KY_A_ExiThe Kipevu_III_Diesel MSD 115 HFO 40% 21.80 1.82 2011 2017 KY_A_ExiThe Ngong WPP 5 Wind 22.49 3.75 2010 2029 KY_A_ExiThe Eburru Geo 2 Heat 43.25 3.09 2012 2041 KY_A_Tana Tana HYDRO 20 Water - ROR 45.53 3.25 1955 2050 KY_A_Small_hydro KY_Small_hydro HYDRO 11 Water - ROR 45.53 3.25 2010 2050 KY_A_Kamburu Kamburu HYDRO 90 Water - RESER 45.53 3.25 1974 2050 KY_A_Gitaru Gitaru HYDRO 216 Water - ROR 45.53 3.25 1998 2050 KY_A_Kindaruma Kindaruma HYDRO 44 Water - ROR 45.53 3.25 1968 2050 KY_A_Masinga Masinga HYDRO 40 Water - RESER 45.53 3.25 1981 2050 KY_A_Kiambere Kiambere HYDRO 164 Water - RESER 45.53 3.25 1988 2050 KY_A_Sondu_Miriu Sondu_Miriu HYDRO 60 Water - ROR 45.53 3.25 2008 2050 KY_A_Turkwell Turkwell HYDRO 105 Water - RESER 45.53 3.25 1991 2050 KY_A_Sangoro Sangoro HYDRO 20 Water - ROR 45.53 3.25 2012 2050
Committed KY_A_FutThe THIKA MSD 0 HFO 45% 21.80 1.82 2043 2072 KY_A_FutThe GULF MSD 80 HFO 41% 21.80 1.82 2014 2043 KY_A_FutThe Triumph MSD 83 HFO 44% 21.80 1.82 2014 2043 KY_A_Kindaruma_opt Kindaruma_opt HYDRO 24 Water - ROR 45.53 3.25 2015 2050 KY_A_FutThe ORP4 Geo 17.6 Heat 43.25 3.09 2014 2043 KY_A_FutThe OLK1B Geo 140 Heat 43.25 3.09 2014 2043 KY_A_FutThe OLK4 Geo 140 Heat 43.25 3.09 2014 2043 KY_A_FutThe OLKWH1 Geo 45.6 Heat 43.25 3.09 2014 2043 KY_A_FutThe MENW Geo 70 Heat 43.25 3.09 2017 2046 KY_A_FutThe MENWH Geo 0 Heat 43.25 3.09 2017 2046 KY_A_FutThe OLK1B_2 Geo 70 Heat 43.25 3.09 2016 2045 KY_A_FutThe OLKWH2 Geo 30 Heat 43.25 3.09 2015 2044 KY_A_FutThe Ngong2 WPP 14 Wind 22.49 3.75 2014 2033 KY_A_FutThe NgongI2 WPP 7 Wind 22.49 3.75 2014 2033

47 | EAPP Master Plan 2014 - Volume II: Data report - 19-12-2014
Table 22: Existing, committed and candidate power plants as represented in the model for Kenya
KY_A_FutThe Kwala Cogen 18 Bagasse 17% 44.88 3.74 2015 2039 KY_A_FutThe KY_LNG CCGT 700 NG 57% 25.50 2.13 2017 2046 KY_A_FutThe Aelous WPP 60 Wind 22.49 3.75 2015 2034 KY_A_FutThe Menengai_I Geo 107 Heat 43.25 3.09 2015 2044 KY_A_FutThe Silali Geo 100 Heat 43.25 3.09 2018 2047 KY_A_FutThe Isiolo WPP 100 Wind 22.49 3.75 2016 2035 KY_A_FutThe KY_Coal STPP 960 Coal 40% 44.88 3.74 2016 2045 KY_A_FutThe LTWP WPP 150 Wind 22.49 3.75 2016 2035 KY_A_FutThe LTWP2 WPP 150 Wind 22.49 3.75 2016 2035 KY_A_FutThe Kipeto WPP 100 Wind 22.49 3.75 2016 2035 KY_A_FutThe Prunus WPP 50 Wind 22.49 3.75 2016 2035 KY_A_FutThe Suswa Geo 150 Heat 43.25 3.09 2016 2045 KY_A_FutThe OLK1B_3 Geo 140 Heat 43.25 3.09 2017 2046 KY_A_FutThe Menengai_2 Geo 460 Heat 43.25 3.09 2018 2047 KY_A_FutThe OLK_V Geo 140 Heat 43.25 3.09 2017 2046 KY_A_FutThe Baringo Geo 200 Heat 43.25 3.09 2017 2046 KY_A_FutThe Suswa2 Geo 50 Heat 43.25 3.09 2018 2047 KY_A_FutThe Silali2 Geo 0 Heat 43.25 3.09 2018 2047
KY_A_FutThe KY_Coal2 STPP 960 Coal 40% 44.88 3.74 2018 2047 KY_A_FutThe Silali3 Geo 0 Heat 43.25 3.09 2019 2048 KY_A_FutThe AGIL Geo 140 Heat 43.25 3.09 2018 2047 KY_A_FutThe OLK_VI Geo 140 Heat 43.25 3.09 2017 2046 KY_A_FutThe Kipevu_GT_I_III OCGT 194 NG 26% 20.40 1.70 2017 2046 KY_A_FutThe Tsavo_NG OCGT 74 NG 26% 20.40 1.70 2017 2046 KY_A_FutThe Rabai_NG OCGT 90 NG 26% 20.40 1.70 2017 2046 KY_A_FutThe Eburru_New Geo 25 Heat 43.25 3.09 2018 2047
Candidates KY_A_NewGeo KY_New_Geo Geo 7660 Heat 4.31 43.25 3.09 2024 2053 KY_A_Nuclear KY_Nuclear Nuclear 900 Nuclear 33% 5.56 125.46 0.00 2019 2050 KY_A_Karura Karura HYDRO 90 Water - ROR 3.70 45.53 3.25 2020 2050 KY_A_LowerGrand LowerGrand HYDRO 140 Water - RESER 3.62 45.53 3.25 2020 2050
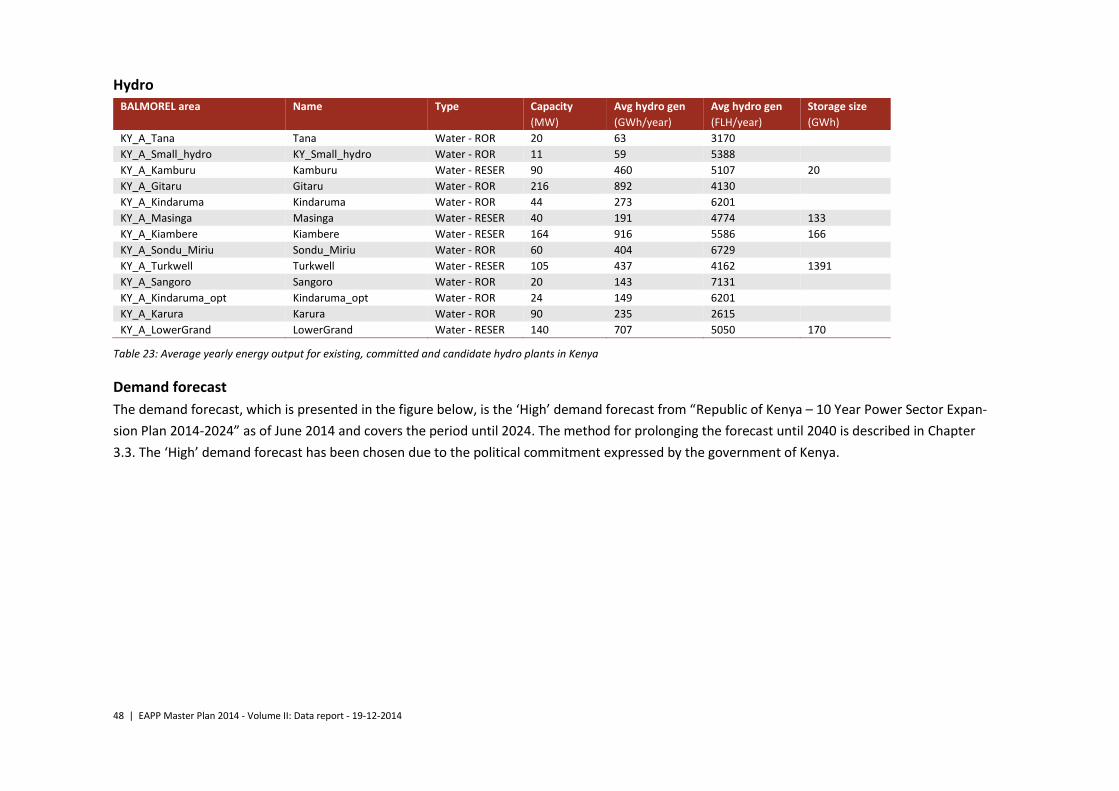
48 | EAPP Master Plan 2014 - Volume II: Data report - 19-12-2014
Hydro
BALMOREL area Name Type Capacity Avg hydro gen Avg hydro gen Storage size
(MW) (GWh/year) (FLH/year) (GWh)
KY_A_Tana Tana Water - ROR 20 63 3170
KY_A_Small_hydro KY_Small_hydro Water - ROR 11 59 5388
KY_A_Kamburu Kamburu Water - RESER 90 460 5107 20
KY_A_Gitaru Gitaru Water - ROR 216 892 4130
KY_A_Kindaruma Kindaruma Water - ROR 44 273 6201
KY_A_Masinga Masinga Water - RESER 40 191 4774 133
KY_A_Kiambere Kiambere Water - RESER 164 916 5586 166
KY_A_Sondu_Miriu Sondu_Miriu Water - ROR 60 404 6729
KY_A_Turkwell Turkwell Water - RESER 105 437 4162 1391
KY_A_Sangoro Sangoro Water - ROR 20 143 7131
KY_A_Kindaruma_opt Kindaruma_opt Water - ROR 24 149 6201
KY_A_Karura Karura Water - ROR 90 235 2615
KY_A_LowerGrand LowerGrand Water - RESER 140 707 5050 170
Table 23: Average yearly energy output for existing, committed and candidate hydro plants in Kenya
Demand forecast
The demand forecast, which is presented in the figure below, is the ‘High’ demand forecast from “Republic of Kenya – 10 Year Power Sector Expan-
sion Plan 2014-2024” as of June 2014 and covers the period until 2024. The method for prolonging the forecast until 2040 is described in Chapter
3.3. The ‘High’ demand forecast has been chosen due to the political commitment expressed by the government of Kenya.
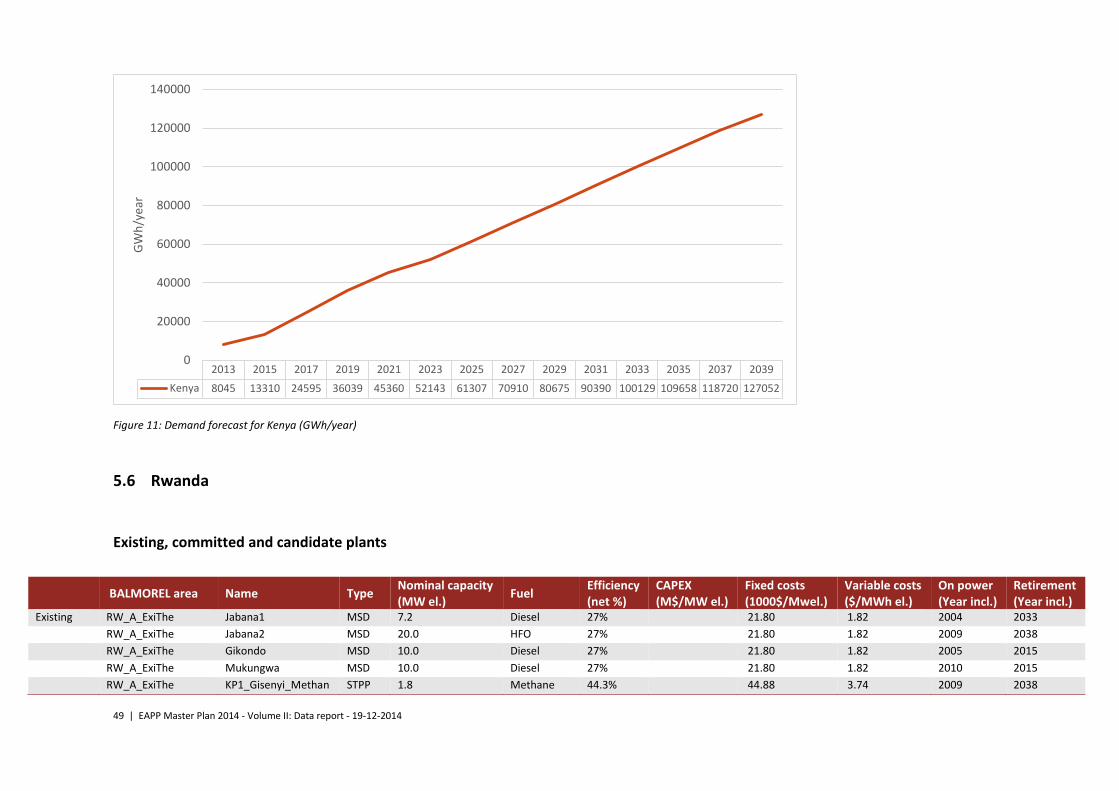
49 | EAPP Master Plan 2014 - Volume II: Data report - 19-12-2014
Figure 11: Demand forecast for Kenya (GWh/year)
5.6 Rwanda
Existing, committed and candidate plants
2013 2015 2017 2019 2021 2023 2025 2027 2029 2031 2033 2035 2037 2039
Kenya 8045 13310 24595 36039 45360 52143 61307 70910 80675 90390 100129 109658 118720 127052
0
20000
40000
60000
80000
100000
120000
140000
GW
h/y
ear
BALMOREL area Name Type Nominal capacity (MW el.)
Fuel Efficiency (net %)
CAPEX (M$/MW el.)
Fixed costs (1000$/Mwel.)
Variable costs ($/MWh el.)
On power (Year incl.)
Retirement (Year incl.)
Existing RW_A_ExiThe Jabana1 MSD 7.2 Diesel 27% 21.80 1.82 2004 2033
RW_A_ExiThe Jabana2 MSD 20.0 HFO 27% 21.80 1.82 2009 2038
RW_A_ExiThe Gikondo MSD 10.0 Diesel 27% 21.80 1.82 2005 2015
RW_A_ExiThe Mukungwa MSD 10.0 Diesel 27% 21.80 1.82 2010 2015
RW_A_ExiThe KP1_Gisenyi_Methan STPP 1.8 Methane 44.3% 44.88 3.74 2009 2038
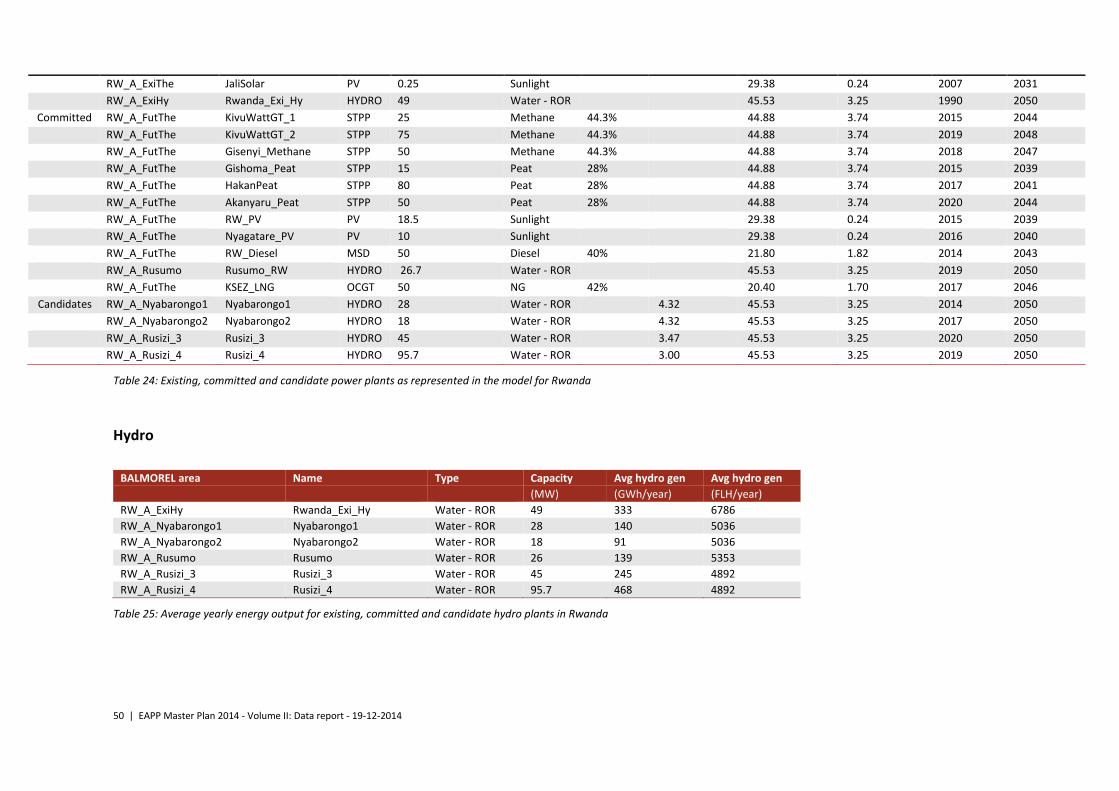
50 | EAPP Master Plan 2014 - Volume II: Data report - 19-12-2014
Table 24: Existing, committed and candidate power plants as represented in the model for Rwanda
Hydro
BALMOREL area Name Type Capacity Avg hydro gen Avg hydro gen
(MW) (GWh/year) (FLH/year)
RW_A_ExiHy Rwanda_Exi_Hy Water - ROR 49 333 6786
RW_A_Nyabarongo1 Nyabarongo1 Water - ROR 28 140 5036
RW_A_Nyabarongo2 Nyabarongo2 Water - ROR 18 91 5036
RW_A_Rusumo Rusumo Water - ROR 26 139 5353
RW_A_Rusizi_3 Rusizi_3 Water - ROR 45 245 4892
RW_A_Rusizi_4 Rusizi_4 Water - ROR 95.7 468 4892
Table 25: Average yearly energy output for existing, committed and candidate hydro plants in Rwanda
RW_A_ExiThe JaliSolar PV 0.25 Sunlight 29.38 0.24 2007 2031
RW_A_ExiHy Rwanda_Exi_Hy HYDRO 49 Water - ROR 45.53 3.25 1990 2050
Committed RW_A_FutThe KivuWattGT_1 STPP 25 Methane 44.3% 44.88 3.74 2015 2044
RW_A_FutThe KivuWattGT_2 STPP 75 Methane 44.3% 44.88 3.74 2019 2048
RW_A_FutThe Gisenyi_Methane STPP 50 Methane 44.3% 44.88 3.74 2018 2047
RW_A_FutThe Gishoma_Peat STPP 15 Peat 28% 44.88 3.74 2015 2039
RW_A_FutThe HakanPeat STPP 80 Peat 28% 44.88 3.74 2017 2041
RW_A_FutThe Akanyaru_Peat STPP 50 Peat 28% 44.88 3.74 2020 2044
RW_A_FutThe RW_PV PV 18.5 Sunlight 29.38 0.24 2015 2039
RW_A_FutThe Nyagatare_PV PV 10 Sunlight 29.38 0.24 2016 2040
RW_A_FutThe RW_Diesel MSD 50 Diesel 40% 21.80 1.82 2014 2043
RW_A_Rusumo Rusumo_RW HYDRO 26.7 Water - ROR 45.53 3.25 2019 2050
RW_A_FutThe KSEZ_LNG OCGT 50 NG 42% 20.40 1.70 2017 2046
Candidates RW_A_Nyabarongo1 Nyabarongo1 HYDRO 28 Water - ROR 4.32 45.53 3.25 2014 2050
RW_A_Nyabarongo2 Nyabarongo2 HYDRO 18 Water - ROR 4.32 45.53 3.25 2017 2050
RW_A_Rusizi_3 Rusizi_3 HYDRO 45 Water - ROR 3.47 45.53 3.25 2020 2050
RW_A_Rusizi_4 Rusizi_4 HYDRO 95.7 Water - ROR 3.00 45.53 3.25 2019 2050

51 | EAPP Master Plan 2014 - Volume II: Data report - 19-12-2014
Demand forecast
The demand forecast, which is presented in the figure below, is based on the load forecast from the “SOFRECO Report, Revision 2014” and covers
the period until 2022 (the growth rates of the load forecast have been applied to the historic power demand). The method for prolonging the fore-
cast until 2040 is described in Chapter 3.3.
Figure 12: Demand forecast for Rwanda (GWh/year)
2013 2015 2017 2019 2021 2023 2025 2027 2029 2031 2033 2035 2037 2039
Rwanda 551 883 1469 1795 2081 2250 2458 2714 3026 3390 3756 4113 4453 4765
0
1000
2000
3000
4000
5000
6000
GW
h/y
ear
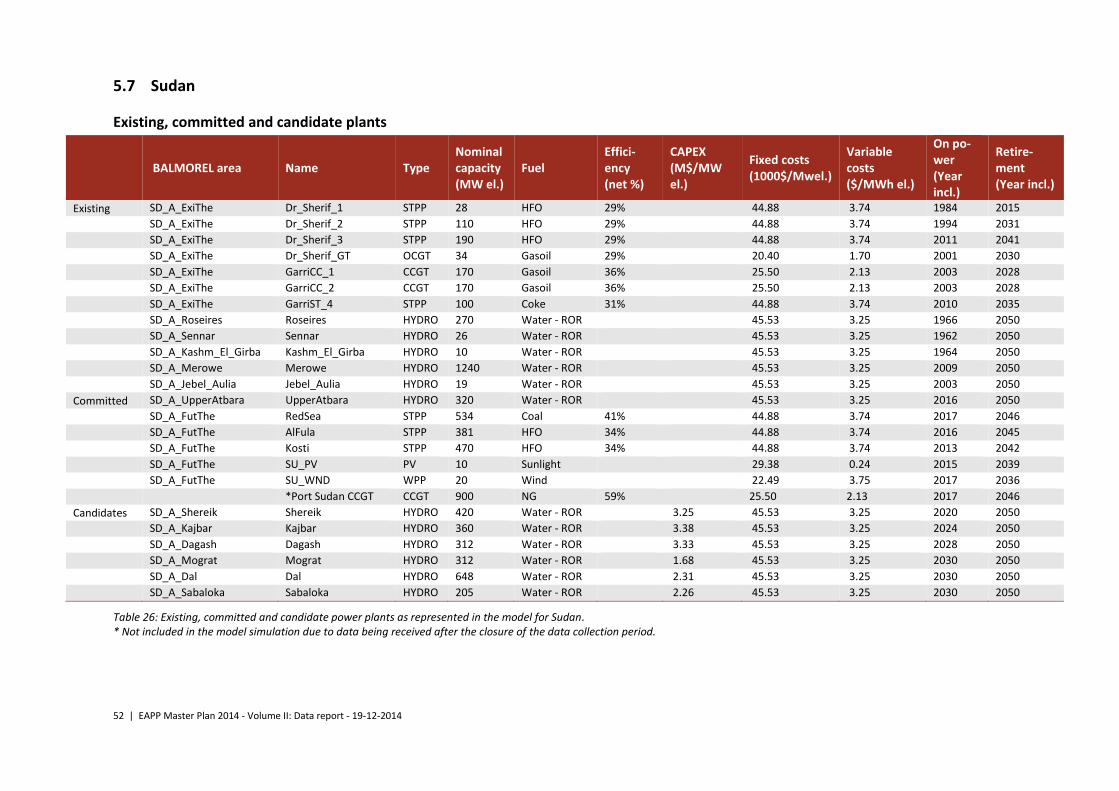
52 | EAPP Master Plan 2014 - Volume II: Data report - 19-12-2014
5.7 Sudan
Existing, committed and candidate plants
BALMOREL area Name Type
Nominal capacity (MW el.)
Fuel Effici-ency (net %)
CAPEX (M$/MW el.)
Fixed costs (1000$/Mwel.)
Variable costs ($/MWh el.)
On po-wer (Year incl.)
Retire-ment (Year incl.)
Existing SD_A_ExiThe Dr_Sherif_1 STPP 28 HFO 29% 44.88 3.74 1984 2015
SD_A_ExiThe Dr_Sherif_2 STPP 110 HFO 29% 44.88 3.74 1994 2031
SD_A_ExiThe Dr_Sherif_3 STPP 190 HFO 29% 44.88 3.74 2011 2041
SD_A_ExiThe Dr_Sherif_GT OCGT 34 Gasoil 29% 20.40 1.70 2001 2030
SD_A_ExiThe GarriCC_1 CCGT 170 Gasoil 36% 25.50 2.13 2003 2028
SD_A_ExiThe GarriCC_2 CCGT 170 Gasoil 36% 25.50 2.13 2003 2028
SD_A_ExiThe GarriST_4 STPP 100 Coke 31% 44.88 3.74 2010 2035
SD_A_Roseires Roseires HYDRO 270 Water - ROR 45.53 3.25 1966 2050
SD_A_Sennar Sennar HYDRO 26 Water - ROR 45.53 3.25 1962 2050
SD_A_Kashm_El_Girba Kashm_El_Girba HYDRO 10 Water - ROR 45.53 3.25 1964 2050
SD_A_Merowe Merowe HYDRO 1240 Water - ROR 45.53 3.25 2009 2050
SD_A_Jebel_Aulia Jebel_Aulia HYDRO 19 Water - ROR 45.53 3.25 2003 2050
Committed SD_A_UpperAtbara UpperAtbara HYDRO 320 Water - ROR 45.53 3.25 2016 2050
SD_A_FutThe RedSea STPP 534 Coal 41% 44.88 3.74 2017 2046
SD_A_FutThe AlFula STPP 381 HFO 34% 44.88 3.74 2016 2045
SD_A_FutThe Kosti STPP 470 HFO 34% 44.88 3.74 2013 2042
SD_A_FutThe SU_PV PV 10 Sunlight 29.38 0.24 2015 2039
SD_A_FutThe SU_WND WPP 20 Wind 22.49 3.75 2017 2036
*Port Sudan CCGT CCGT 900 NG 59% 25.50 2.13 2017 2046
Candidates SD_A_Shereik Shereik HYDRO 420 Water - ROR 3.25 45.53 3.25 2020 2050
SD_A_Kajbar Kajbar HYDRO 360 Water - ROR 3.38 45.53 3.25 2024 2050
SD_A_Dagash Dagash HYDRO 312 Water - ROR 3.33 45.53 3.25 2028 2050
SD_A_Mograt Mograt HYDRO 312 Water - ROR 1.68 45.53 3.25 2030 2050
SD_A_Dal Dal HYDRO 648 Water - ROR 2.31 45.53 3.25 2030 2050
SD_A_Sabaloka Sabaloka HYDRO 205 Water - ROR 2.26 45.53 3.25 2030 2050
Table 26: Existing, committed and candidate power plants as represented in the model for Sudan. * Not included in the model simulation due to data being received after the closure of the data collection period.
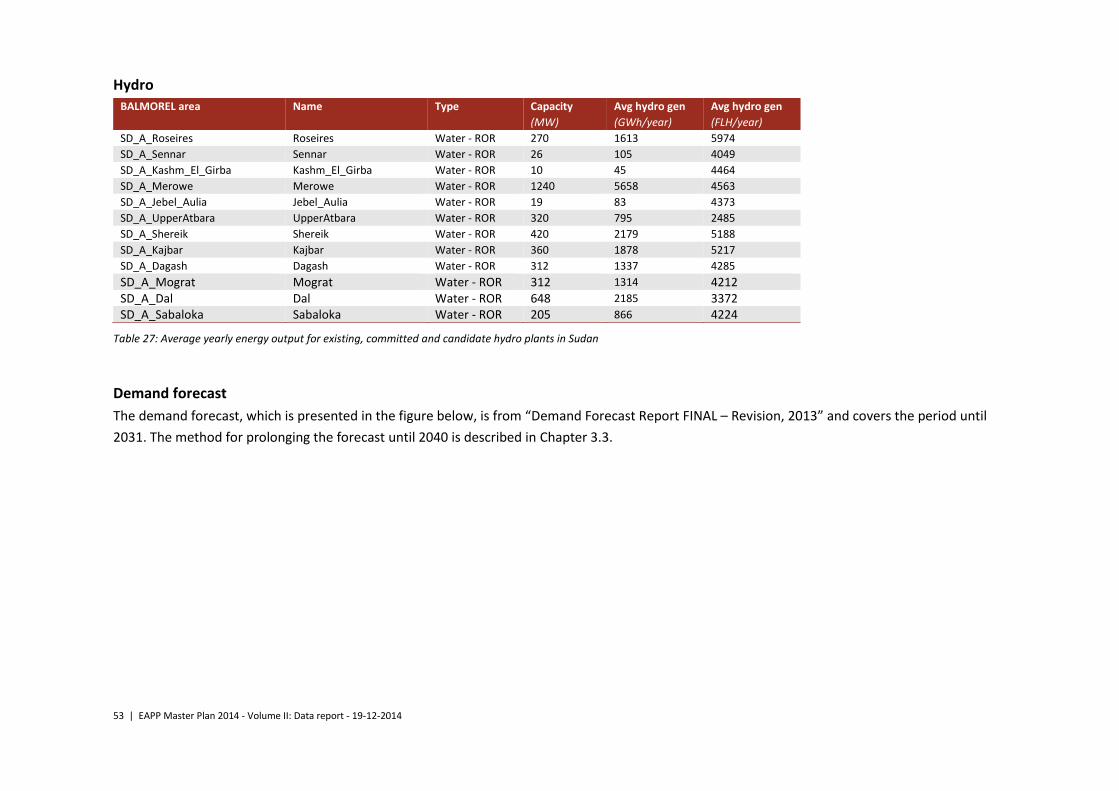
53 | EAPP Master Plan 2014 - Volume II: Data report - 19-12-2014
Hydro
BALMOREL area Name Type Capacity Avg hydro gen Avg hydro gen
(MW) (GWh/year) (FLH/year)
SD_A_Roseires Roseires Water - ROR 270 1613 5974
SD_A_Sennar Sennar Water - ROR 26 105 4049
SD_A_Kashm_El_Girba Kashm_El_Girba Water - ROR 10 45 4464
SD_A_Merowe Merowe Water - ROR 1240 5658 4563
SD_A_Jebel_Aulia Jebel_Aulia Water - ROR 19 83 4373
SD_A_UpperAtbara UpperAtbara Water - ROR 320 795 2485
SD_A_Shereik Shereik Water - ROR 420 2179 5188
SD_A_Kajbar Kajbar Water - ROR 360 1878 5217
SD_A_Dagash Dagash Water - ROR 312 1337 4285
SD_A_Mograt Mograt Water - ROR 312 1314 4212
SD_A_Dal Dal Water - ROR 648 2185 3372
SD_A_Sabaloka Sabaloka Water - ROR 205 866 4224
Table 27: Average yearly energy output for existing, committed and candidate hydro plants in Sudan
Demand forecast
The demand forecast, which is presented in the figure below, is from “Demand Forecast Report FINAL – Revision, 2013” and covers the period until
2031. The method for prolonging the forecast until 2040 is described in Chapter 3.3.

54 | EAPP Master Plan 2014 - Volume II: Data report - 19-12-2014
Figure 13: Demand forecast for Sudan (GWh/year)
5.8 South Sudan
Existing, committed and candidate plants
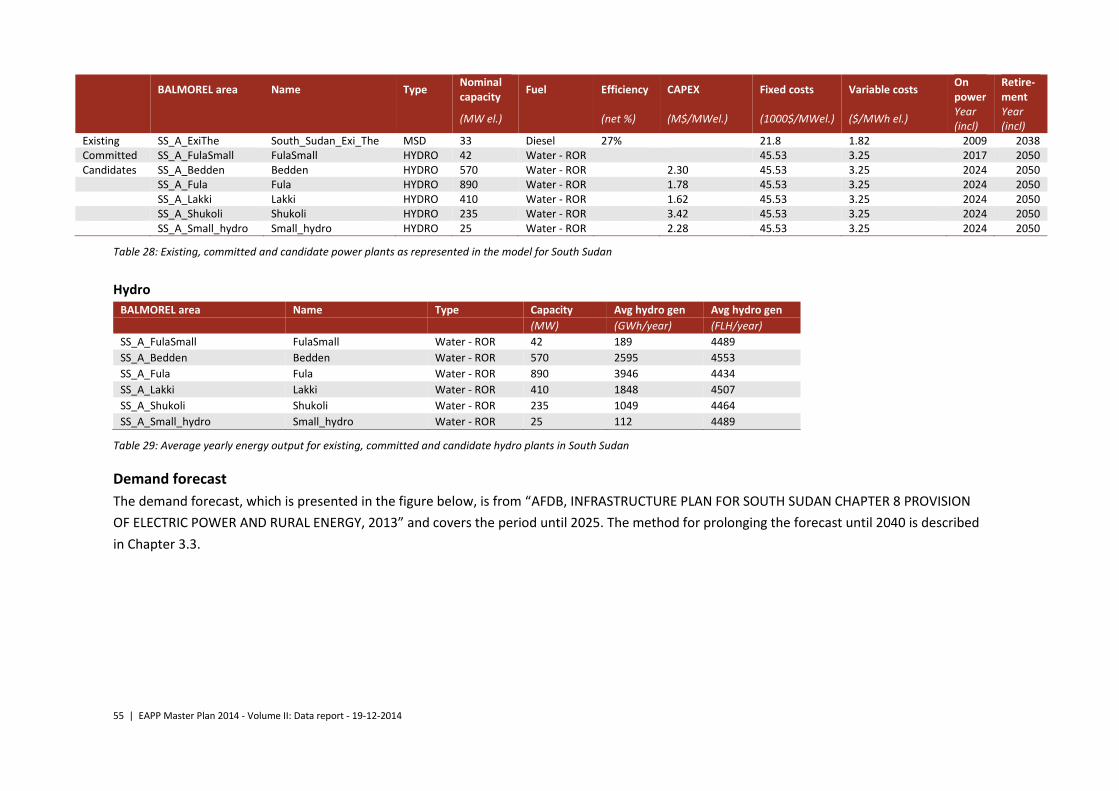
55 | EAPP Master Plan 2014 - Volume II: Data report - 19-12-2014
BALMOREL area Name Type Nominal capacity
Fuel Efficiency CAPEX Fixed costs Variable costs On power
Retire-ment
(MW el.) (net %) (M$/MWel.) (1000$/MWel.) ($/MWh el.) Year (incl)
Year (incl)
Existing SS_A_ExiThe South_Sudan_Exi_The MSD 33 Diesel 27% 21.8 1.82 2009 2038 Committed SS_A_FulaSmall FulaSmall HYDRO 42 Water - ROR 45.53 3.25 2017 2050 Candidates SS_A_Bedden Bedden HYDRO 570 Water - ROR 2.30 45.53 3.25 2024 2050
SS_A_Fula Fula HYDRO 890 Water - ROR 1.78 45.53 3.25 2024 2050 SS_A_Lakki Lakki HYDRO 410 Water - ROR 1.62 45.53 3.25 2024 2050 SS_A_Shukoli Shukoli HYDRO 235 Water - ROR 3.42 45.53 3.25 2024 2050 SS_A_Small_hydro Small_hydro HYDRO 25 Water - ROR 2.28 45.53 3.25 2024 2050
Table 28: Existing, committed and candidate power plants as represented in the model for South Sudan
Hydro
BALMOREL area Name Type Capacity Avg hydro gen Avg hydro gen
(MW) (GWh/year) (FLH/year)
SS_A_FulaSmall FulaSmall Water - ROR 42 189 4489
SS_A_Bedden Bedden Water - ROR 570 2595 4553
SS_A_Fula Fula Water - ROR 890 3946 4434
SS_A_Lakki Lakki Water - ROR 410 1848 4507
SS_A_Shukoli Shukoli Water - ROR 235 1049 4464
SS_A_Small_hydro Small_hydro Water - ROR 25 112 4489
Table 29: Average yearly energy output for existing, committed and candidate hydro plants in South Sudan
Demand forecast
The demand forecast, which is presented in the figure below, is from “AFDB, INFRASTRUCTURE PLAN FOR SOUTH SUDAN CHAPTER 8 PROVISION
OF ELECTRIC POWER AND RURAL ENERGY, 2013” and covers the period until 2025. The method for prolonging the forecast until 2040 is described
in Chapter 3.3.
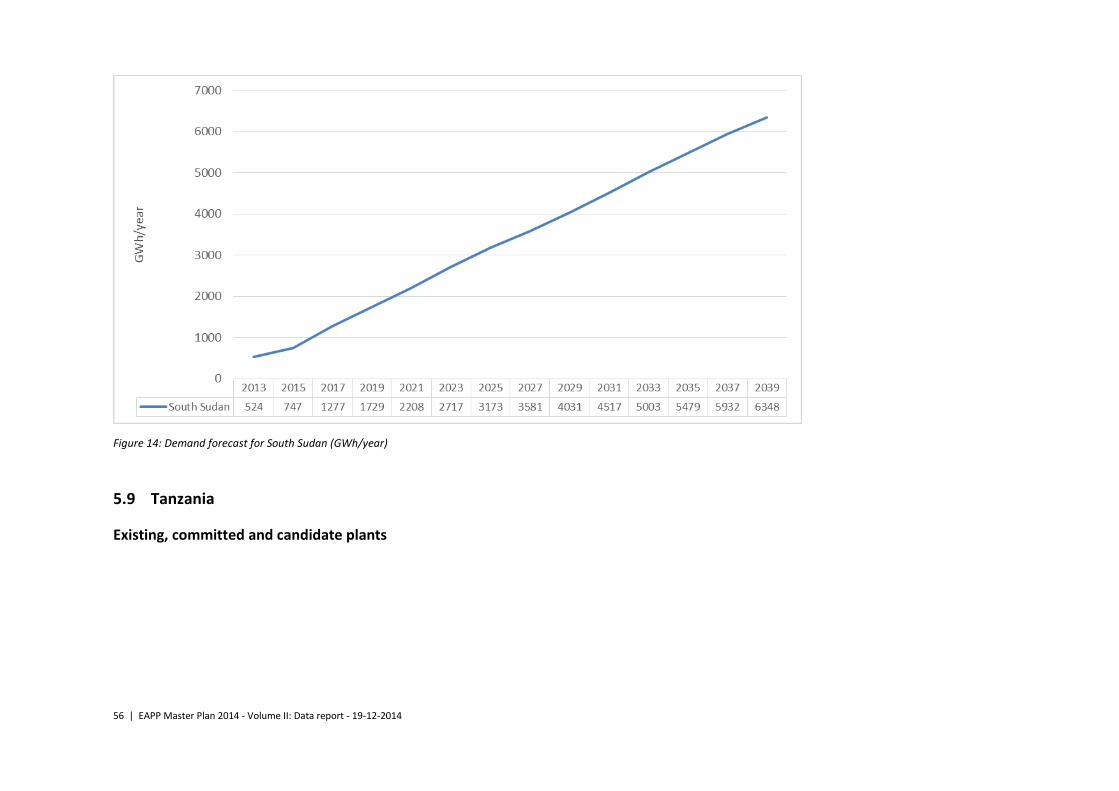
56 | EAPP Master Plan 2014 - Volume II: Data report - 19-12-2014
Figure 14: Demand forecast for South Sudan (GWh/year)
5.9 Tanzania
Existing, committed and candidate plants
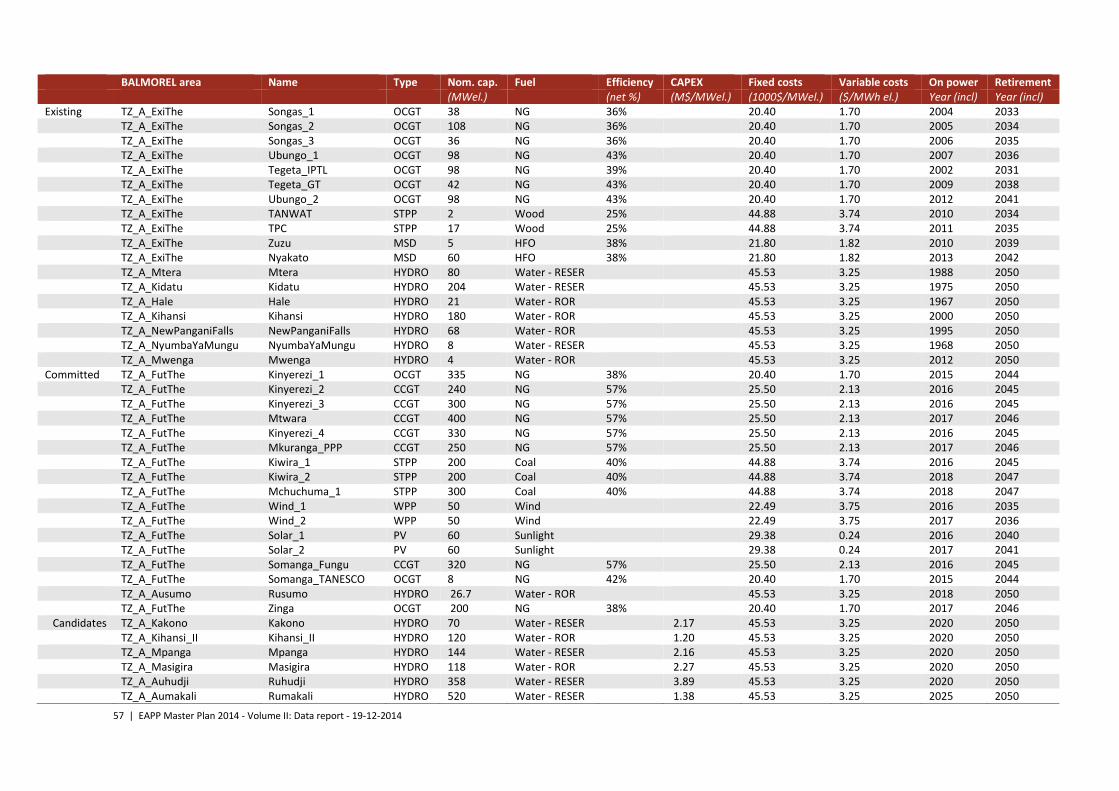
57 | EAPP Master Plan 2014 - Volume II: Data report - 19-12-2014
BALMOREL area Name Type Nom. cap. Fuel Efficiency CAPEX Fixed costs Variable costs On power Retirement (MWel.) (net %) (M$/MWel.) (1000$/MWel.) ($/MWh el.) Year (incl) Year (incl) Existing TZ_A_ExiThe Songas_1 OCGT 38 NG 36% 20.40 1.70 2004 2033
TZ_A_ExiThe Songas_2 OCGT 108 NG 36% 20.40 1.70 2005 2034 TZ_A_ExiThe Songas_3 OCGT 36 NG 36% 20.40 1.70 2006 2035 TZ_A_ExiThe Ubungo_1 OCGT 98 NG 43% 20.40 1.70 2007 2036 TZ_A_ExiThe Tegeta_IPTL OCGT 98 NG 39% 20.40 1.70 2002 2031 TZ_A_ExiThe Tegeta_GT OCGT 42 NG 43% 20.40 1.70 2009 2038 TZ_A_ExiThe Ubungo_2 OCGT 98 NG 43% 20.40 1.70 2012 2041 TZ_A_ExiThe TANWAT STPP 2 Wood 25% 44.88 3.74 2010 2034 TZ_A_ExiThe TPC STPP 17 Wood 25% 44.88 3.74 2011 2035 TZ_A_ExiThe Zuzu MSD 5 HFO 38% 21.80 1.82 2010 2039 TZ_A_ExiThe Nyakato MSD 60 HFO 38% 21.80 1.82 2013 2042 TZ_A_Mtera Mtera HYDRO 80 Water - RESER 45.53 3.25 1988 2050 TZ_A_Kidatu Kidatu HYDRO 204 Water - RESER 45.53 3.25 1975 2050 TZ_A_Hale Hale HYDRO 21 Water - ROR 45.53 3.25 1967 2050 TZ_A_Kihansi Kihansi HYDRO 180 Water - ROR 45.53 3.25 2000 2050 TZ_A_NewPanganiFalls NewPanganiFalls HYDRO 68 Water - ROR 45.53 3.25 1995 2050 TZ_A_NyumbaYaMungu NyumbaYaMungu HYDRO 8 Water - RESER 45.53 3.25 1968 2050
TZ_A_Mwenga Mwenga HYDRO 4 Water - ROR 45.53 3.25 2012 2050 Committed TZ_A_FutThe Kinyerezi_1 OCGT 335 NG 38% 20.40 1.70 2015 2044
TZ_A_FutThe Kinyerezi_2 CCGT 240 NG 57% 25.50 2.13 2016 2045 TZ_A_FutThe Kinyerezi_3 CCGT 300 NG 57% 25.50 2.13 2016 2045 TZ_A_FutThe Mtwara CCGT 400 NG 57% 25.50 2.13 2017 2046 TZ_A_FutThe Kinyerezi_4 CCGT 330 NG 57% 25.50 2.13 2016 2045
TZ_A_FutThe Mkuranga_PPP CCGT 250 NG 57% 25.50 2.13 2017 2046 TZ_A_FutThe Kiwira_1 STPP 200 Coal 40% 44.88 3.74 2016 2045 TZ_A_FutThe Kiwira_2 STPP 200 Coal 40% 44.88 3.74 2018 2047 TZ_A_FutThe Mchuchuma_1 STPP 300 Coal 40% 44.88 3.74 2018 2047 TZ_A_FutThe Wind_1 WPP 50 Wind 22.49 3.75 2016 2035 TZ_A_FutThe Wind_2 WPP 50 Wind 22.49 3.75 2017 2036 TZ_A_FutThe Solar_1 PV 60 Sunlight 29.38 0.24 2016 2040 TZ_A_FutThe Solar_2 PV 60 Sunlight 29.38 0.24 2017 2041 TZ_A_FutThe Somanga_Fungu CCGT 320 NG 57% 25.50 2.13 2016 2045 TZ_A_FutThe Somanga_TANESCO OCGT 8 NG 42% 20.40 1.70 2015 2044 TZ_A_Ausumo Rusumo HYDRO 26.7 Water - ROR 45.53 3.25 2018 2050
TZ_A_FutThe Zinga OCGT 200 NG 38% 20.40 1.70 2017 2046 Candidates TZ_A_Kakono Kakono HYDRO 70 Water - RESER 2.17 45.53 3.25 2020 2050
TZ_A_Kihansi_II Kihansi_II HYDRO 120 Water - ROR 1.20 45.53 3.25 2020 2050 TZ_A_Mpanga Mpanga HYDRO 144 Water - RESER 2.16 45.53 3.25 2020 2050 TZ_A_Masigira Masigira HYDRO 118 Water - ROR 2.27 45.53 3.25 2020 2050 TZ_A_Auhudji Ruhudji HYDRO 358 Water - RESER 3.89 45.53 3.25 2020 2050 TZ_A_Aumakali Rumakali HYDRO 520 Water - RESER 1.38 45.53 3.25 2025 2050
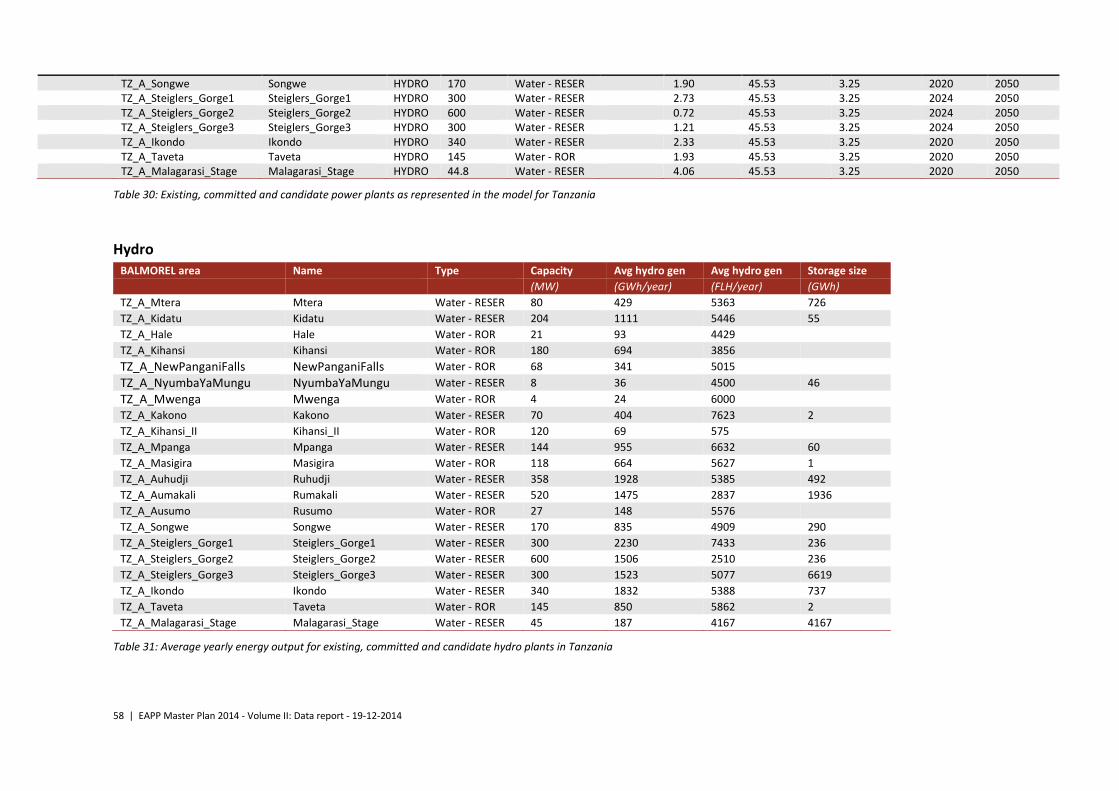
58 | EAPP Master Plan 2014 - Volume II: Data report - 19-12-2014
TZ_A_Songwe Songwe HYDRO 170 Water - RESER 1.90 45.53 3.25 2020 2050 TZ_A_Steiglers_Gorge1 Steiglers_Gorge1 HYDRO 300 Water - RESER 2.73 45.53 3.25 2024 2050 TZ_A_Steiglers_Gorge2 Steiglers_Gorge2 HYDRO 600 Water - RESER 0.72 45.53 3.25 2024 2050 TZ_A_Steiglers_Gorge3 Steiglers_Gorge3 HYDRO 300 Water - RESER 1.21 45.53 3.25 2024 2050 TZ_A_Ikondo Ikondo HYDRO 340 Water - RESER 2.33 45.53 3.25 2020 2050 TZ_A_Taveta Taveta HYDRO 145 Water - ROR 1.93 45.53 3.25 2020 2050 TZ_A_Malagarasi_Stage Malagarasi_Stage HYDRO 44.8 Water - RESER 4.06 45.53 3.25 2020 2050
Table 30: Existing, committed and candidate power plants as represented in the model for Tanzania
Hydro
BALMOREL area Name Type Capacity Avg hydro gen Avg hydro gen Storage size
(MW) (GWh/year) (FLH/year) (GWh)
TZ_A_Mtera Mtera Water - RESER 80 429 5363 726
TZ_A_Kidatu Kidatu Water - RESER 204 1111 5446 55
TZ_A_Hale Hale Water - ROR 21 93 4429
TZ_A_Kihansi Kihansi Water - ROR 180 694 3856
TZ_A_NewPanganiFalls NewPanganiFalls Water - ROR 68 341 5015
TZ_A_NyumbaYaMungu NyumbaYaMungu Water - RESER 8 36 4500 46
TZ_A_Mwenga Mwenga Water - ROR 4 24 6000
TZ_A_Kakono Kakono Water - RESER 70 404 7623 2
TZ_A_Kihansi_II Kihansi_II Water - ROR 120 69 575
TZ_A_Mpanga Mpanga Water - RESER 144 955 6632 60
TZ_A_Masigira Masigira Water - ROR 118 664 5627 1
TZ_A_Auhudji Ruhudji Water - RESER 358 1928 5385 492
TZ_A_Aumakali Rumakali Water - RESER 520 1475 2837 1936
TZ_A_Ausumo Rusumo Water - ROR 27 148 5576
TZ_A_Songwe Songwe Water - RESER 170 835 4909 290
TZ_A_Steiglers_Gorge1 Steiglers_Gorge1 Water - RESER 300 2230 7433 236
TZ_A_Steiglers_Gorge2 Steiglers_Gorge2 Water - RESER 600 1506 2510 236
TZ_A_Steiglers_Gorge3 Steiglers_Gorge3 Water - RESER 300 1523 5077 6619
TZ_A_Ikondo Ikondo Water - RESER 340 1832 5388 737
TZ_A_Taveta Taveta Water - ROR 145 850 5862 2
TZ_A_Malagarasi_Stage Malagarasi_Stage Water - RESER 45 187 4167 4167
Table 31: Average yearly energy output for existing, committed and candidate hydro plants in Tanzania
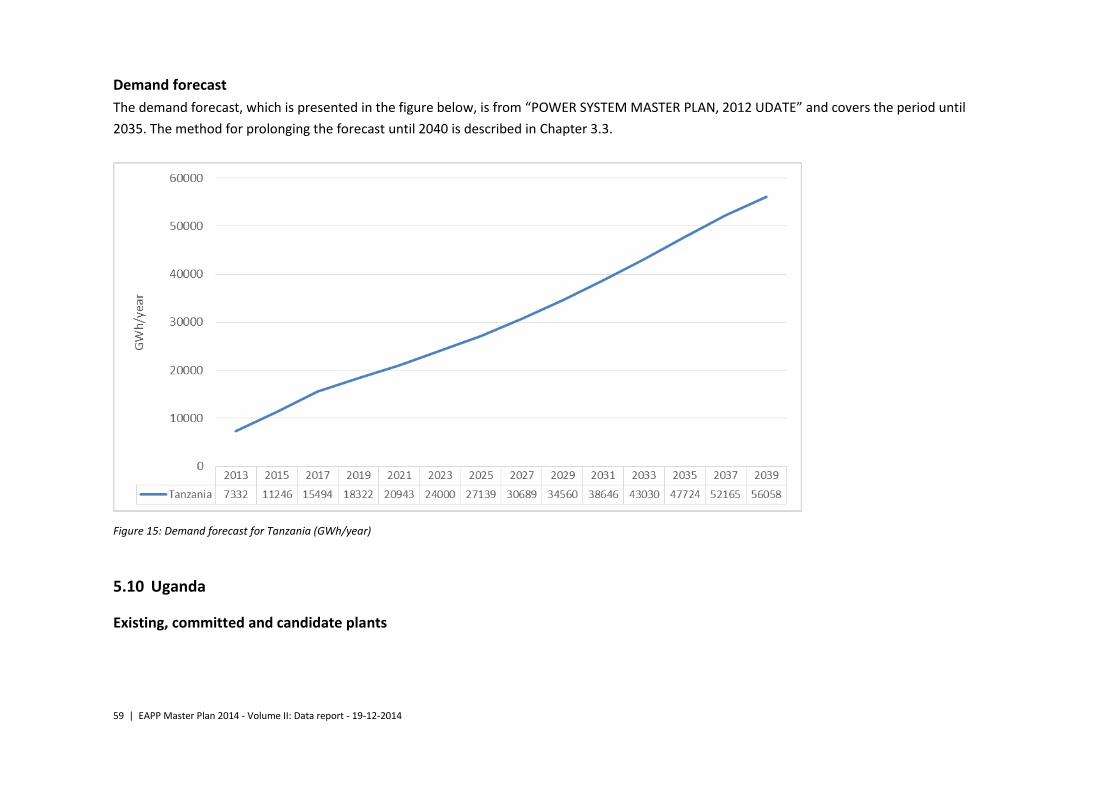
59 | EAPP Master Plan 2014 - Volume II: Data report - 19-12-2014
Demand forecast
The demand forecast, which is presented in the figure below, is from “POWER SYSTEM MASTER PLAN, 2012 UDATE” and covers the period until
2035. The method for prolonging the forecast until 2040 is described in Chapter 3.3.
Figure 15: Demand forecast for Tanzania (GWh/year)
5.10 Uganda
Existing, committed and candidate plants

60 | EAPP Master Plan 2014 - Volume II: Data report - 19-12-2014
BALMOREL area Name Type Nom. cap.
Fuel Effici-ency
CAPEX Fixed costs Variable costs On po-wer
Retire-ment
(MWel.) (net %) (M$/MWel.) (1000$/MWel.) ($/MWh el.) Year (incl) Year (incl)
Existing UG_A_ExiThe Namanve MSD 50 HFO 38% 21.80 1.82 2008 2037
UG_A_ExiThe Kakira Cogen 30 Bagasse 17% 44.88 3.74 2008 2032
UG_A_ExiThe Kinyara Cogen 1.5 Bagasse 17% 44.88 3.74 2009 2033
UG_A_ExiThe Electromaxx MSD 50 HFO 38% 21.80 1.82 2012 2041
UG_A_Nalubaale Nalubaale HYDRO 180 Water - ROR 45.53 3.25 2010 2050
UG_A_Kira Kira HYDRO 200 Water - ROR 45.53 3.25 2010 2050
UG_A_Bujagali Bujagali HYDRO 250 Water - ROR 45.53 3.25 2010 2050
UG_A_Small_hydro UG_Small_hydro HYDRO 61 Water - ROR 45.53 3.25 2011 2050
Committed UG_A_NewThe Albatros MSD 50 HFO 38% 21.80 1.82 2017 2046
UG_A_Karuma_High Karuma_High HYDRO 600 Water - ROR 45.53 3.25 2019 2050
UG_A_Isimba Isimba HYDRO 183 Water - ROR 45.53 3.25 2018 2050
UG_A_NewThe Kinyara2 Cogen 30 Bagasse 17% 44.88 3.74 2016 2040
UG_A_NewThe Sugar_Allied_Industries Cogen 12 Bagasse 17% 44.88 3.74 2014 2038
UG_A_NewThe Kabale_Peat STPP 33 Peat 17% 44.88 3.74 2016 2040
UG_A_NewThe Katwe1 Geo 50 Heat 43.25 3.09 2017 2046
UG_A_Shydro_com UG_Shydro_com HYDRO 152 Water - ROR 45.53 3.25 2017 2050
UG_A_NewThe Solar_UG PV 20 Sunlight 29.38 0.24 2017 2041
UG_A_Ayago Ayago HYDRO 600 Water - ROR 45.53 3.25 2020 2050
Candidates UG_A_NewThe Katwe2 Geo 200 Heat 3.72 43.25 3.09 2016 2045
UG_A_Kiba Kiba HYDRO 288 Water - ROR 8.57 45.53 3.25 2025 2050
UG_A_Oriang Oriang HYDRO 392 Water - ROR 4.88 45.53 3.25 2025 2050
UG_A_Murchisson_F_High Murchisson_F_High HYDRO 648 Water - ROR 1.91 45.53 3.25 2025 2050
UG_A_SHydro_cand UG_SHydro_cand HYDRO 99 Water - ROR 4.05 45.53 3.25 2020 2050
Table 32: Existing, committed and candidate power plants as represented in the model for Uganda
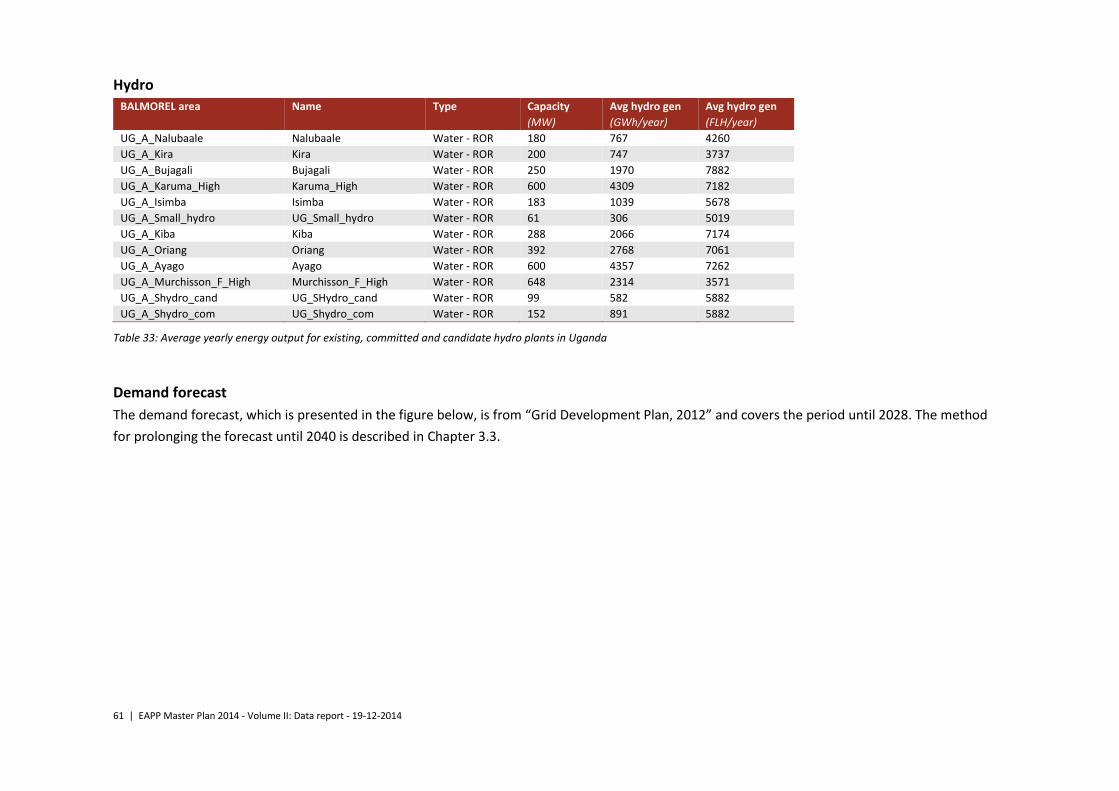
61 | EAPP Master Plan 2014 - Volume II: Data report - 19-12-2014
Hydro
BALMOREL area Name Type Capacity Avg hydro gen Avg hydro gen
(MW) (GWh/year) (FLH/year)
UG_A_Nalubaale Nalubaale Water - ROR 180 767 4260
UG_A_Kira Kira Water - ROR 200 747 3737
UG_A_Bujagali Bujagali Water - ROR 250 1970 7882
UG_A_Karuma_High Karuma_High Water - ROR 600 4309 7182
UG_A_Isimba Isimba Water - ROR 183 1039 5678
UG_A_Small_hydro UG_Small_hydro Water - ROR 61 306 5019
UG_A_Kiba Kiba Water - ROR 288 2066 7174
UG_A_Oriang Oriang Water - ROR 392 2768 7061
UG_A_Ayago Ayago Water - ROR 600 4357 7262
UG_A_Murchisson_F_High Murchisson_F_High Water - ROR 648 2314 3571
UG_A_Shydro_cand UG_SHydro_cand Water - ROR 99 582 5882
UG_A_Shydro_com UG_Shydro_com Water - ROR 152 891 5882
Table 33: Average yearly energy output for existing, committed and candidate hydro plants in Uganda
Demand forecast
The demand forecast, which is presented in the figure below, is from “Grid Development Plan, 2012” and covers the period until 2028. The method
for prolonging the forecast until 2040 is described in Chapter 3.3.
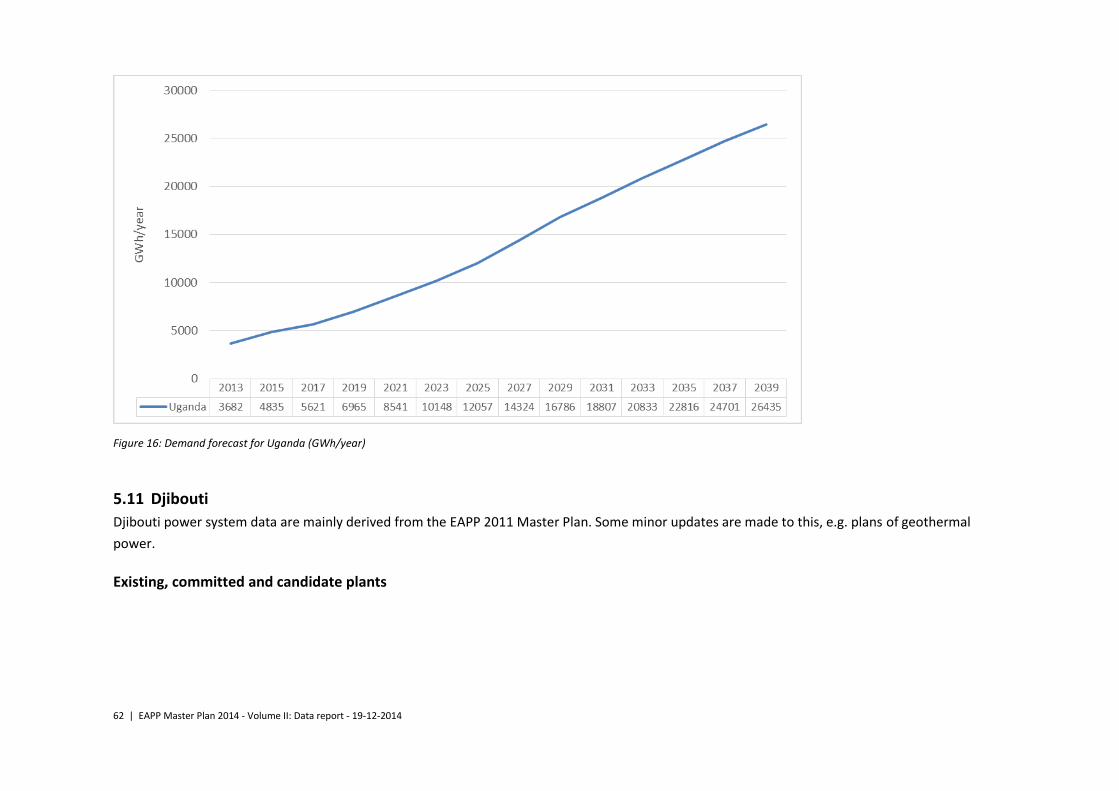
62 | EAPP Master Plan 2014 - Volume II: Data report - 19-12-2014
Figure 16: Demand forecast for Uganda (GWh/year)
5.11 Djibouti
Djibouti power system data are mainly derived from the EAPP 2011 Master Plan. Some minor updates are made to this, e.g. plans of geothermal
power.
Existing, committed and candidate plants

63 | EAPP Master Plan 2014 - Volume II: Data report - 19-12-2014
BALMOREL area Name Type Nom. cap. Fuel Efficiency CAPEX Fixed costs Variable costs On power Retirement
(MWel.) (net %) (M$/MWel.) (1000$/MWel.) ($/MWh el.) Year (incl) Year (incl)
Existing DB_A_ExiThe Boulaos MSD 108 Diesel 27% 21.80 1.82 2000 2029
DB_A_ExiThe Marabout MSD 14 Diesel 27% 21.80 1.82 2000 2029
Committed DB_A_Committed DBGeothermal Geo 50 Heat 43.25 3.09 2015 2044
Table 34: Existing, committed and candidate power plants as represented in the model for Djibouti
Demand forecast
The demand forecast, which is presented in the figure below, is from “EAPP Master Plan, 2011” and covers the period until 2038. The method for
prolonging the forecast until 2040 is described in Chapter 3.3.
Figure 17: Demand forecast for Djibouti (GWh/year)
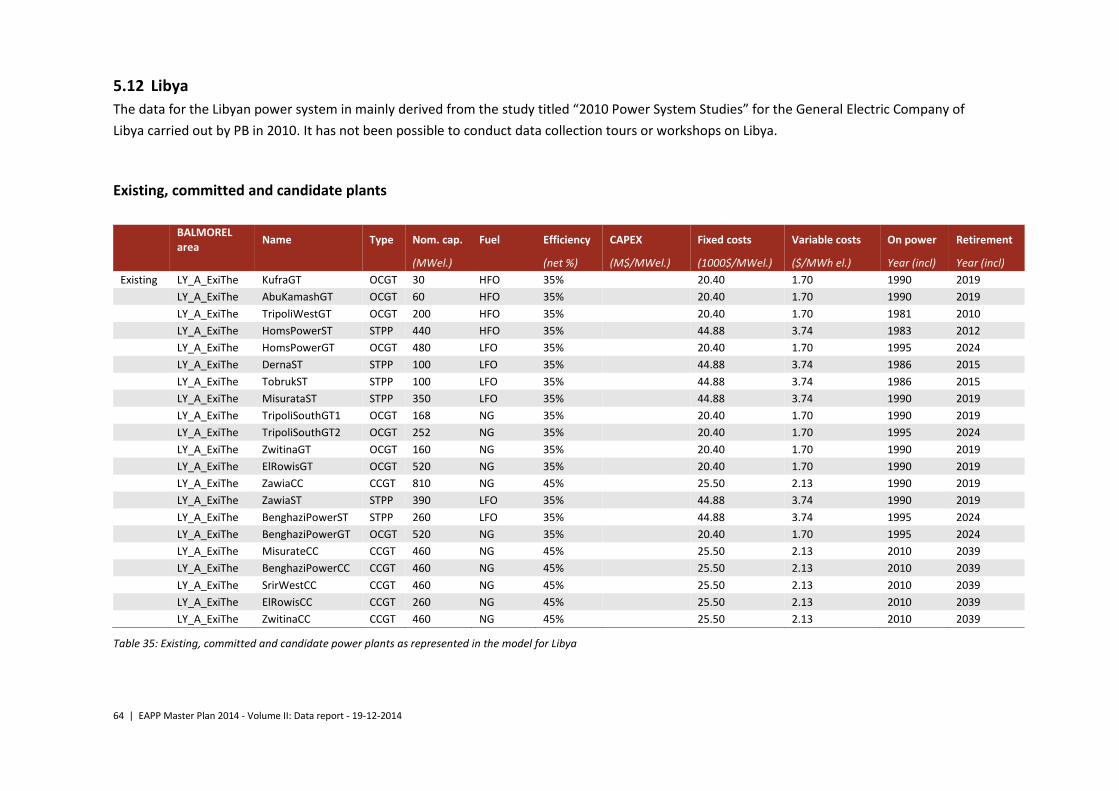
64 | EAPP Master Plan 2014 - Volume II: Data report - 19-12-2014
5.12 Libya
The data for the Libyan power system in mainly derived from the study titled “2010 Power System Studies” for the General Electric Company of
Libya carried out by PB in 2010. It has not been possible to conduct data collection tours or workshops on Libya.
Existing, committed and candidate plants
BALMOREL area
Name Type Nom. cap. Fuel Efficiency CAPEX Fixed costs Variable costs On power Retirement
(MWel.) (net %) (M$/MWel.) (1000$/MWel.) ($/MWh el.) Year (incl) Year (incl)
Existing LY_A_ExiThe KufraGT OCGT 30 HFO 35% 20.40 1.70 1990 2019
LY_A_ExiThe AbuKamashGT OCGT 60 HFO 35% 20.40 1.70 1990 2019
LY_A_ExiThe TripoliWestGT OCGT 200 HFO 35% 20.40 1.70 1981 2010
LY_A_ExiThe HomsPowerST STPP 440 HFO 35% 44.88 3.74 1983 2012
LY_A_ExiThe HomsPowerGT OCGT 480 LFO 35% 20.40 1.70 1995 2024
LY_A_ExiThe DernaST STPP 100 LFO 35% 44.88 3.74 1986 2015
LY_A_ExiThe TobrukST STPP 100 LFO 35% 44.88 3.74 1986 2015
LY_A_ExiThe MisurataST STPP 350 LFO 35% 44.88 3.74 1990 2019
LY_A_ExiThe TripoliSouthGT1 OCGT 168 NG 35% 20.40 1.70 1990 2019
LY_A_ExiThe TripoliSouthGT2 OCGT 252 NG 35% 20.40 1.70 1995 2024
LY_A_ExiThe ZwitinaGT OCGT 160 NG 35% 20.40 1.70 1990 2019
LY_A_ExiThe ElRowisGT OCGT 520 NG 35% 20.40 1.70 1990 2019
LY_A_ExiThe ZawiaCC CCGT 810 NG 45% 25.50 2.13 1990 2019
LY_A_ExiThe ZawiaST STPP 390 LFO 35% 44.88 3.74 1990 2019
LY_A_ExiThe BenghaziPowerST STPP 260 LFO 35% 44.88 3.74 1995 2024
LY_A_ExiThe BenghaziPowerGT OCGT 520 NG 35% 20.40 1.70 1995 2024
LY_A_ExiThe MisurateCC CCGT 460 NG 45% 25.50 2.13 2010 2039
LY_A_ExiThe BenghaziPowerCC CCGT 460 NG 45% 25.50 2.13 2010 2039
LY_A_ExiThe SrirWestCC CCGT 460 NG 45% 25.50 2.13 2010 2039
LY_A_ExiThe ElRowisCC CCGT 260 NG 45% 25.50 2.13 2010 2039
LY_A_ExiThe ZwitinaCC CCGT 460 NG 45% 25.50 2.13 2010 2039
Table 35: Existing, committed and candidate power plants as represented in the model for Libya
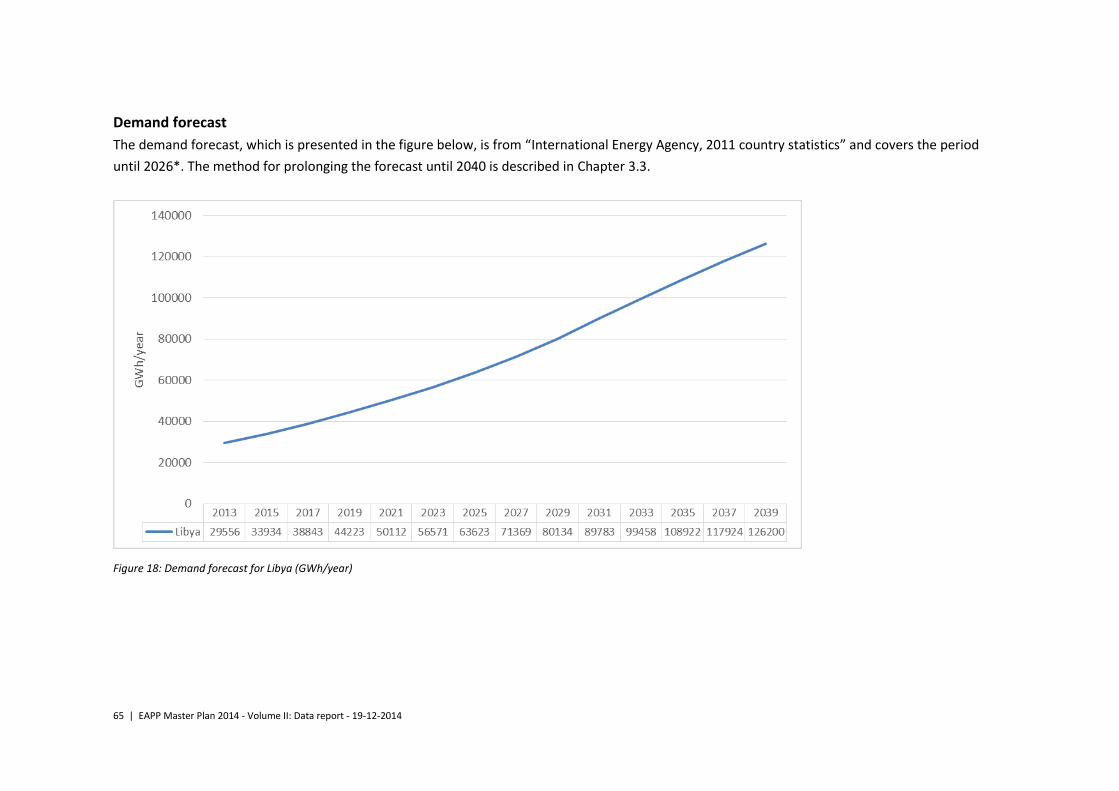
65 | EAPP Master Plan 2014 - Volume II: Data report - 19-12-2014
Demand forecast
The demand forecast, which is presented in the figure below, is from “International Energy Agency, 2011 country statistics” and covers the period
until 2026*. The method for prolonging the forecast until 2040 is described in Chapter 3.3.
Figure 18: Demand forecast for Libya (GWh/year)
6 References
ASTERN AFRICA POWER POOL (EAPP) AND EAST AFRICAN Eastern Africa Power Pool (EAPP) and East African Community (EAC) - Re-
gional Power System Master Plan and Grid Code Study, SNC Lavalin Interna-
tional Inc in association with Parsons Brinckerhoff, 2010-2011
References to Parts of the study:
[1] Final Interim Report Module 1C Appendices part 1
- Hydro profiles p. 44
- Hydro Potential p. 92
[2] Final Interim Report Module 1C Appendices part 2
- Tech data p. 6
- Future Tech plan p. 36
[3] Final Interim Report Module 1C part 3
- Transmission p. 75
[4] Final Interim Report- Module 1A Demand Forecast Main
- Demand year
[5] Final Interim Report Module 1C part 2
- Fuel prices
Eastern Nile Power Trade Programs Study, EDF – Generation and Engineer-
ing Division and Scott Wilson, 2007
References to Parts of the study:
[6] Final main report – Energy Sector Profile & Projections Vol2 – Egypt
- Demand variation Egypt
[7] Final main report – Energy Sector Profile & Projections Vol3 – Ethiopia
- Demand variation Ethiopia
[8] Final main report – Energy Sector Profile & Projections Vol4 – Sudan
- Demand variation Sudan