early childhood conference: improving data, improving ... · early childhood conference: improving...
TRANSCRIPT

Early Childhood Conference: Improving Data, Improving Outcomes
Big B Add-on Day September 10-11, 2014 New Orleans, LA

Equity, Inclusion, & Opportunity:
Addressing Success Gaps
Presented on September 11, 2014 by Tom Munk (IDC), Bonnie Dye (Georgia), Cesar D'Agord (WRRC), and Nancy O'Hara (IDC, MSRRC)

Contributors • Regional Resource Center Program
– Nancy O’Hara, Lead, RRCP Disproportionality Priority Team
– Cesar D’Agord, WRRC – John Inglish, WRRC – Kristin Reedy, NERRC – Susan DuRant, SERRC
• Other TA Centers – Darren Woodruff, National RTI Center@AIR – Tom Munk, DAC/IDC
• US ED, Office of Special Education Programs – Perry Williams, Grace Duran, Jennifer Finch, Dave
Guardino

What is a success gap? • Differences or “gaps” in a variety of educational factors
and outcomes that affect the likelihood of educational success for some groups of students compared to their peers – Achievement – Identification and/or placement for special
education – Suspension rates – College and career preparation – Graduation rates

Achievement: Disaggregated Main NAEP Reading Scores, Grades 4 and 8, 2013, Philadelphia,
Pennsylvania
227.3
214.9
214.0
205.9
202.2
199.9
198.1
196.4
193.3
165.7
160.6
271.2
265.4
261.2
255.4
250.6
248.5
245.3
243.7
242.9
220.4
216.0
Not eligible for Free or reduced lunch
Asian/Pacific Islander
White
Without disabilities
Not English language learner
All students
Eligible for free or reduced lunch
Black
Hispanic
English language learner
With disabilities
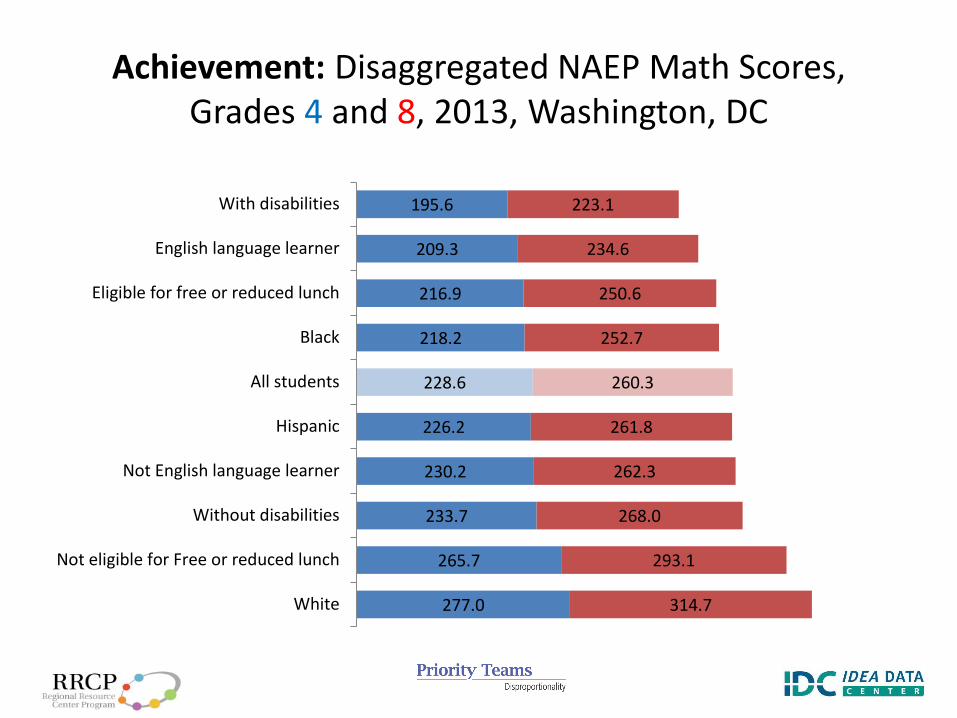
Achievement: Disaggregated NAEP Math Scores, Grades 4 and 8, 2013, Washington, DC
277.0
265.7
233.7
230.2
226.2
228.6
218.2
216.9
209.3
195.6
314.7
293.1
268.0
262.3
261.8
260.3
252.7
250.6
234.6
223.1
White
Not eligible for Free or reduced lunch
Without disabilities
Not English language learner
Hispanic
All students
Black
Eligible for free or reduced lunch
English language learner
With disabilities

Graduation Rates
79%
57% 59%
65% 67%
70% 71%
84% 87%
80%
59% 61%
67% 69%
72% 73%
86% 88%
0%
10%
20%
30%
40%
50%
60%
70%
80%
90%
100%
All ELL SWD AmericanIndian &
Alaskan Native
Black Low Income Hispanic White Asian & PacificIslander
2010-2011 2011-2012

The Graduation Gap: What the Data Tell Us: All States, % of SWDs Graduating With Regular
Diploma, 2010-11 50% 46% 45% 45% 45%
40% 40%
35% 35% 35% 34%
32% 30%
25%
20%
15%
10%
5%
0%Asian Native White American Hispanic or Two or More Black or Total
Hawaiian or Indian or Latino Races AfricanOther Pacific Alaskan American
Islander Native
SOURCE: U.S. Department of Education, Office of Special Education Programs, Data Analysis System (DANS), OMB #1820-0043: "Children with Disabilities Receiving Special Education Under Part B of the Individuals with Disabilities Education Act," 2010-11.
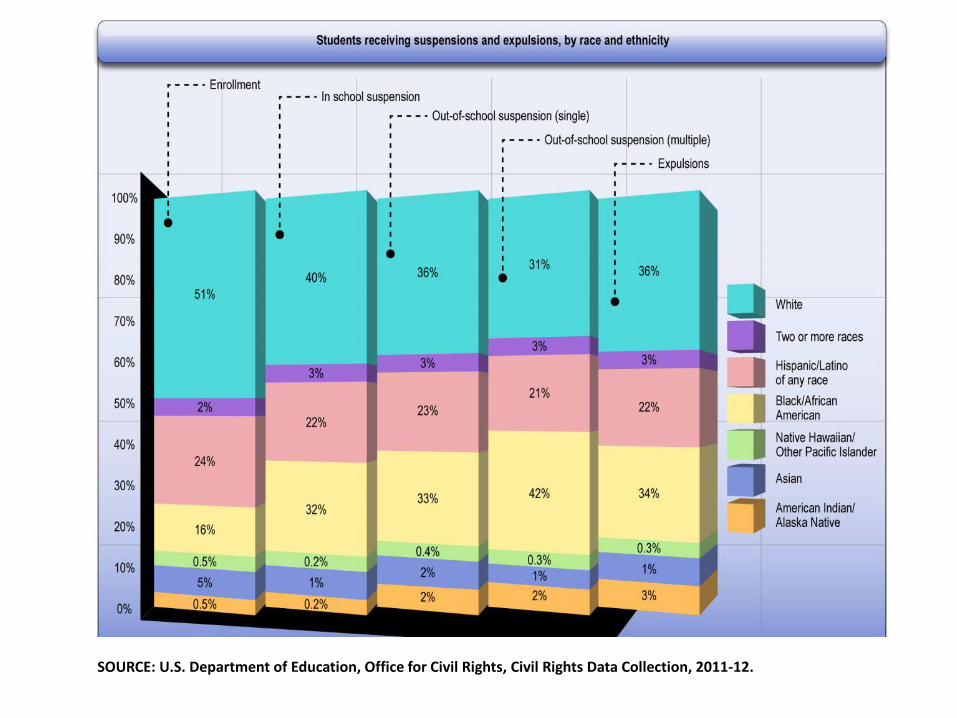
SOURCE: U.S. Department of Education, Office for Civil Rights, Civil Rights Data Collection, 2011-12.
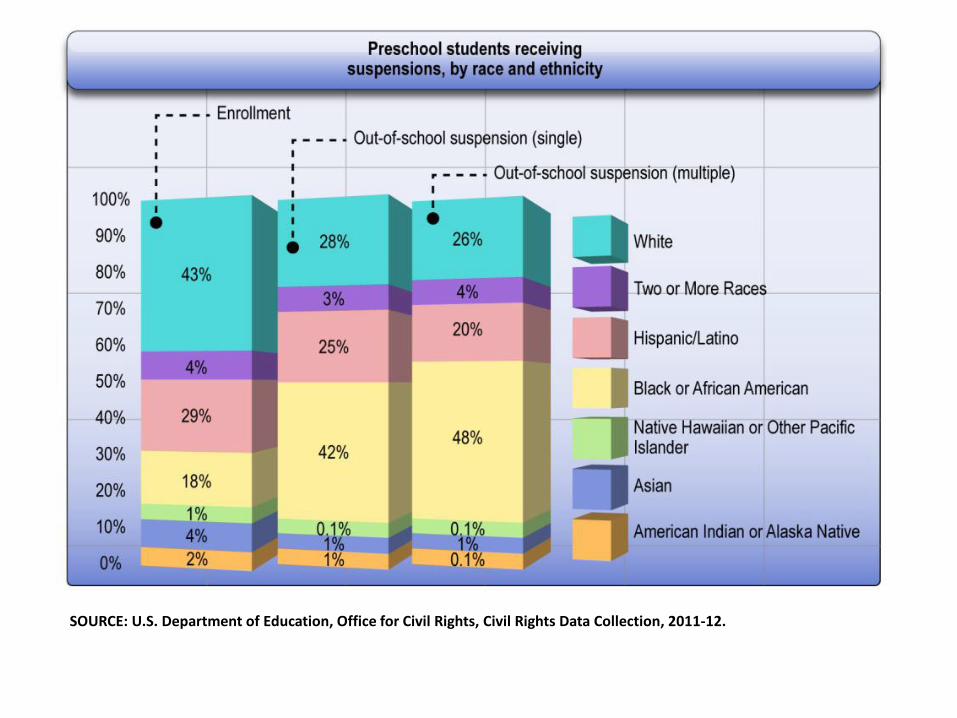
SOURCE: U.S. Department of Education, Office for Civil Rights, Civil Rights Data Collection, 2011-12.

What are the results of success gaps?
Poor long-term outcomes for entire groups of students

Why focus on success gaps?


Intended Audiences
• State departments of education • Local school districts • Schools • TA providers, professional developers, &
consultants working with districts and schools • Other stakeholders concerned about equity
issues in schools • General Ed. and Special Ed.
To address success gaps…
… look closely at equity, inclusion, and opportunity for children in the affected groups

Structure of the Document(s)
• Introductory research brief • Self-assessment rubric

Investigate the root causes of your success gaps
Have you implemented these five elements? • Data-based decision making • Cultural responsiveness • High-quality core instructional program • Universal screening and progress monitoring • Evidence-based interventions and supports

Data-Based Decision Making
• Use disaggregated data for decisions about – Curriculum and instructional programs – Academic and behavioral supports
• Make decisions about student interventions using multiple data sources, including – Screening – Progress monitoring – Formative and summative evaluation data

Cultural Responsiveness
• Recognize diversity across student ethnicity, language, and socio-economic status
• Provide training and resources so teachers can meet the linguistic needs of all students
• Include parents from all backgrounds in discussions about the school and about their children’s progress

Core Instructional Program
• Rigorous, consistent, and well-articulated K-12 instructional program, aligned with standards, delivered with fidelity
• Effective differentiation in the core curriculum • Universal design for learning • Informing parents in their native or home
language about differentiation

Assessment
• Valid universal screening • Progress monitoring for all students • Informing parents in their native or home
language about results

Evidence-Based Interventions and Supports
• Implemented with fidelity • Instructional • Behavioral
– such as Positive Behavioral Supports or Restorative Justice
– Tiered response protocols, not zero tolerance
• Informing parents in their native or home language about interventions and responses


How to Address Success Gaps
1. Form a team 2. Study the data 3. Conduct a self-assessment 4. Provide evidence 5. Consider the students first 6. Ensure equitable participation 7. Develop a plan of action


Georgia Department of Education Division for Special Education Services
Deborah Gay, Director

State Performance Plan/Annual Performance Report Indicator B-17
• INDICATOR: The State’s SPP/APR includes a State Systemic Improvement Plan that meets the requirements set forth for this indicator.
• Basis for this plan is a detailed data and infrastructure analysis that will guide the development of the strategies to increase the State’s capacity to structure and lead meaningful change in LEAs.

Broad Infrastructure
Analysis
Broad Data Analysis
State Identified Measurable Result(s)
Coherent Improvement Strategies
Theory of Action
In-depth Data Analysis
In-depth Infrastructure
Analysis
Phase I Components
What is the problem?
Why is it happening?
What will we do about it?

SWD Enrollment
Data
Total SWD Enrollment
Disability Categories
Racial/Ethnic Groups
Gender
Performance Data
Reading Performance and Gap Data
Math Performance and Gap Data
Performance by Disability Categories
Least Restrictive
Environment
Graduation and Dropout Georgia ‘SIMRering’
SWD Discipline
Data
Racial/Ethnic Groups
Gender
Broa
d
Data
Ana
lysi
s

Broa
d In
fras
truc
ture
An
alys
is
Infrastructure Analysis
Numerous activities and initiatives that support college and career readiness.
Not all activities and initiatives are aligned.
‘Opportunity gaps’ may be negatively affecting graduation rates.
Rigorous standards are in place for all students.
Georgia ‘SIMRering’

To address success gaps…
… look closely at equity, inclusion, and opportunity for children in the affected groups

2014 Total Student Enrollment and Special Education Enrollment
2014 Georgia Student Enrollment
13% 0% 4%
37%
0%
43%
3% Hispanic
American Indian
Asian
Black
Pacific Islander
White
Multi-Racial
2014 Georgia Students With Disabilities Enrollment
12% 0% 1%
40%
0%
44%
3% Hispanic
American Indian
Asian
Black
Pacific Islander
White
Two or More

Mild Intellectual Disability
White, Female 13%
White, Male 17%
Black, Female 24%
Black, Male 36%
Hispanic, Female 3%
Hispanic, Male 4%
Multi-Racial, Female 1%
Multi-Racial, Male 1%
American Indian/Alaskan, Female
0%
American Indian/Alaskan, Male 0%
Pacific Islander, Female
0%
Pacific Islander, Male 0%
Asian, Female 0%
Asian, Male 1%

Reading Meets/Exceeds Rate and General Education >80% Inclusion Rate*
* Inclusion Rate is for all students in disability category not specific to Meets/Exceeds Rate 0 10 20 30 40 50 60 70 80 90 100
All Special Education Students
Blind/Visual Impairments
Deaf/Hard of Hearing
Specific Learning Disabilities
Mild Intellectual Disabilities
Autism
Orthopedic Impairments
Speech-Language Impairments
Emotional and Behavioral Disabilities
Other Health Impairments
Gen Ed >80%
Grade 8
Grade5
Grade 3

Four-Year Cohort Graduation Gap
Four-Year Cohort Graduation Rate
School Year
2012-13
School Year
2011-12
School Year
2010-11
All Students 71.50% 69.73% 67.50% Students with Disabilities 35.00% 35.18% 29.80%
Gap 36.50% 34.55% 37.70%
Four-Year Cohort Graduation Rate
71.50% 69.73% 67.50%
35.00% 35.18% 29.80%
0%
10%
20%
30%
40%
50%
60%
70%
80%
SchoolYear 2012-
13
SchoolYear 2011-
12
SchoolYear 2010-
11
All Students
Students withDisabilities

To address success gaps…
Step One - Recognize the need for change in your school’s or district’s current practices and policies because you have identified a group of students who are experiencing success gaps.
Step Two - Identify the root causes of the problem.
Step Three - Make the changes that address those root causes.

Cause Root Causes (EIO)
Georgia’s Success
Gaps
MID Identification Rate for Black
Students is Twice the Rate
for White Students
Identification Rate for Male Students is
Twice the Rate for Female Students
OSS >10 Days Exclusion Rate
Is 4 Times Greater for Black SWD Than White
SWD

How to Address Success Gaps
1. Form a team—SEA, LEA, and School (General Education and Special Education)
2. Study the data 3. Conduct a self-assessment 4. Provide evidence 5. Consider the students first 6. Ensure equitable participation 7. Develop a plan of action

Georgia's Collaborative Communities for 2014-15
Focus: Results-Driven Accountability
Statement of Purpose: To explore the relationships between existing and available district and school level data and the student outcomes for those districts and schools: using data to inform and improve practice.

Georgia's Collaborative Communities for 2014-15
Data Points for the ABC’s of Results-Driven Accountability
A Attendance Reporting Data B Behavior Data: Discipline events per student ratio. Comparison of
district/school suspension data to state averages: consideration of discrepancy
C Course Completion/Subject Area Achievement High Schools: Course Completion Data
Elementary and Middle Schools: Gaps between SWDs and general education scores on state tests for math and reading

Organizational Outline
Conduct five structured collegial learning and sharing opportunities that encompass three identified areas in which current research literature supports casual connections between data and student achievement outcomes.
The three topic areas are (A) Attendance, (B) Behavior/Discipline, and (C) Course Credit/Subject Area Achievement.
The structure for collegial sharing will involve three general activities: 1) a brief review of current literature regarding the relationship between
the topic area and student outcomes, 2) a discussion around where the most appropriate data about the topic
can be located within each system, 3) an exercise in which each director reviews his/her own system data and
shares conclusions, and 4) a discussion of what strategies and interventions are proving effective
or hold promise and a sharing of ideas about possible new interventions.

Not So Easy
“Equity, inclusion and opportunity for all students is an important goal, but one that is not easily achieved.”
(EIO)

Equity, Inclusion and Opportunity: How to Address Success Gaps Indicators of Success Rubric

The “what” and “how” are helpful!
At the end of the day, what is the “WHY” behind the work?
Dr. Zelphine Smith-Dixon, Assistant Director Division for Special Education Services and Supports
Georgia Department of Education

Using the Success Gaps Documents
1. How could you use this tool to improve results? 2. In what components of Phase 1 of the SSIP will
these documents be useful? How? 3. How could you use this in your state’s work
with identified LEAs? 4. Do you feel you would need assistance to use
this tool? What kind? 5. What adaptions would be necessary to use this
tool in your work? 6. What questions do you have?

Further Resources
• Documents are found at: – http://disprop.sites.tadnet.org/pages/115
• Are you interested in piloting these tools? • Please provide feedback about the tools if you
use them – Contact Nancy O’Hara ([email protected]) or Tom
Munk ([email protected]) if you want to assist with piloting or to provide feedback for the tools.
Thank You!

The contents of this presentation were developed under grants from the U.S. Department of Education. However, the contents do not necessarily represent the policy of the Department of Education, and you should not assume endorsement by the Federal Government.